Abstract
In recent years, the digital creative industry has manifested a vigorous growth trend along with the continuous upgrading of the Internet and the leap of the national economy. This research identifies the spatial distribution characteristics of digital creative enterprises in Shenzhen, employs big data of spatial information of various facilities such as transportation and commerce as the driving factor to construct a model, takes 1 km grid as the fundamental research unit, and explores the influence mechanism of enterprise location selection through methods like OLS and MGWR. The results are as follows: (1) The overall spatial distribution characteristics of digital creative industry are characterized by “widely distributed throughout the city, with a high concentration within the customs and a weak dispersion outside the customs”. (2) The factors of park foundation, production service, public service and life service exert a significant influence on the spatial distribution of digital creative industries in Shenzhen. Among them, the density of shopping facilities, staff, hotel and bus station exhibits a highly obvious spatial heterogeneity in terms of the influence on enterprise location. (3) The correlation of local scale factors is high and the influence range is precise, which frequently presents complex correlation outcomes in small scales such as streets or communities.
1. Introduction
The continuous evolution of new -generation technologies such as the Internet, the Internet of Things, 5G, and artificial intelligence has triggered a new round of industrial transformation based on intelligent technologies [1]. The digital creativity industry, which relies on digital technologies for creation, has emerged in response to the times [2]. It takes cultural creativity and design services as the core and conducts production, dissemination, and services based on digital information platforms (Figure 1), thereby meeting people’s modern life needs and leading new supply and new consumption [3].
Figure 1.
Full Map of Digital Creative Industry.
The continuous evolution of new-generation technologies such as the Internet, the Internet of Things, 5G, and artificial intelligence has triggered a new round of industrial transformation based on intelligent technologies. In recent years, Shenzhen has deeply implemented the innovation-driven development strategy, vigorously promoted the construction of a strong manufacturing city, continuously advanced industrial transformation and upgrading, and achieved positive results in promoting the development of strategic emerging industries. Against the background of the high-quality development requirements of territorial and spatial planning, exploring the spatial distribution characteristics and influencing factors of the digital creative industry will be conducive to achieving intensive and efficient utilization of industrial space.
This paper is mainly rooted in the characteristics of the digital creative industry, combined with spatial information data based on the background of industry-city integration, conducts indepth research on the spatial distribution and cluster development of the digital creative industry in Shenzhen, summarizes its spatial structure model of distribution and the mechanism of industrial spatial agglomeration, enriches the research theoretical system of industrial clusters, and puts forward constructive opinions and suggestions targeted at promoting the development of digital creative industry clusters for relevant government functional departments.
2. Research Design
2.1. Literature Review
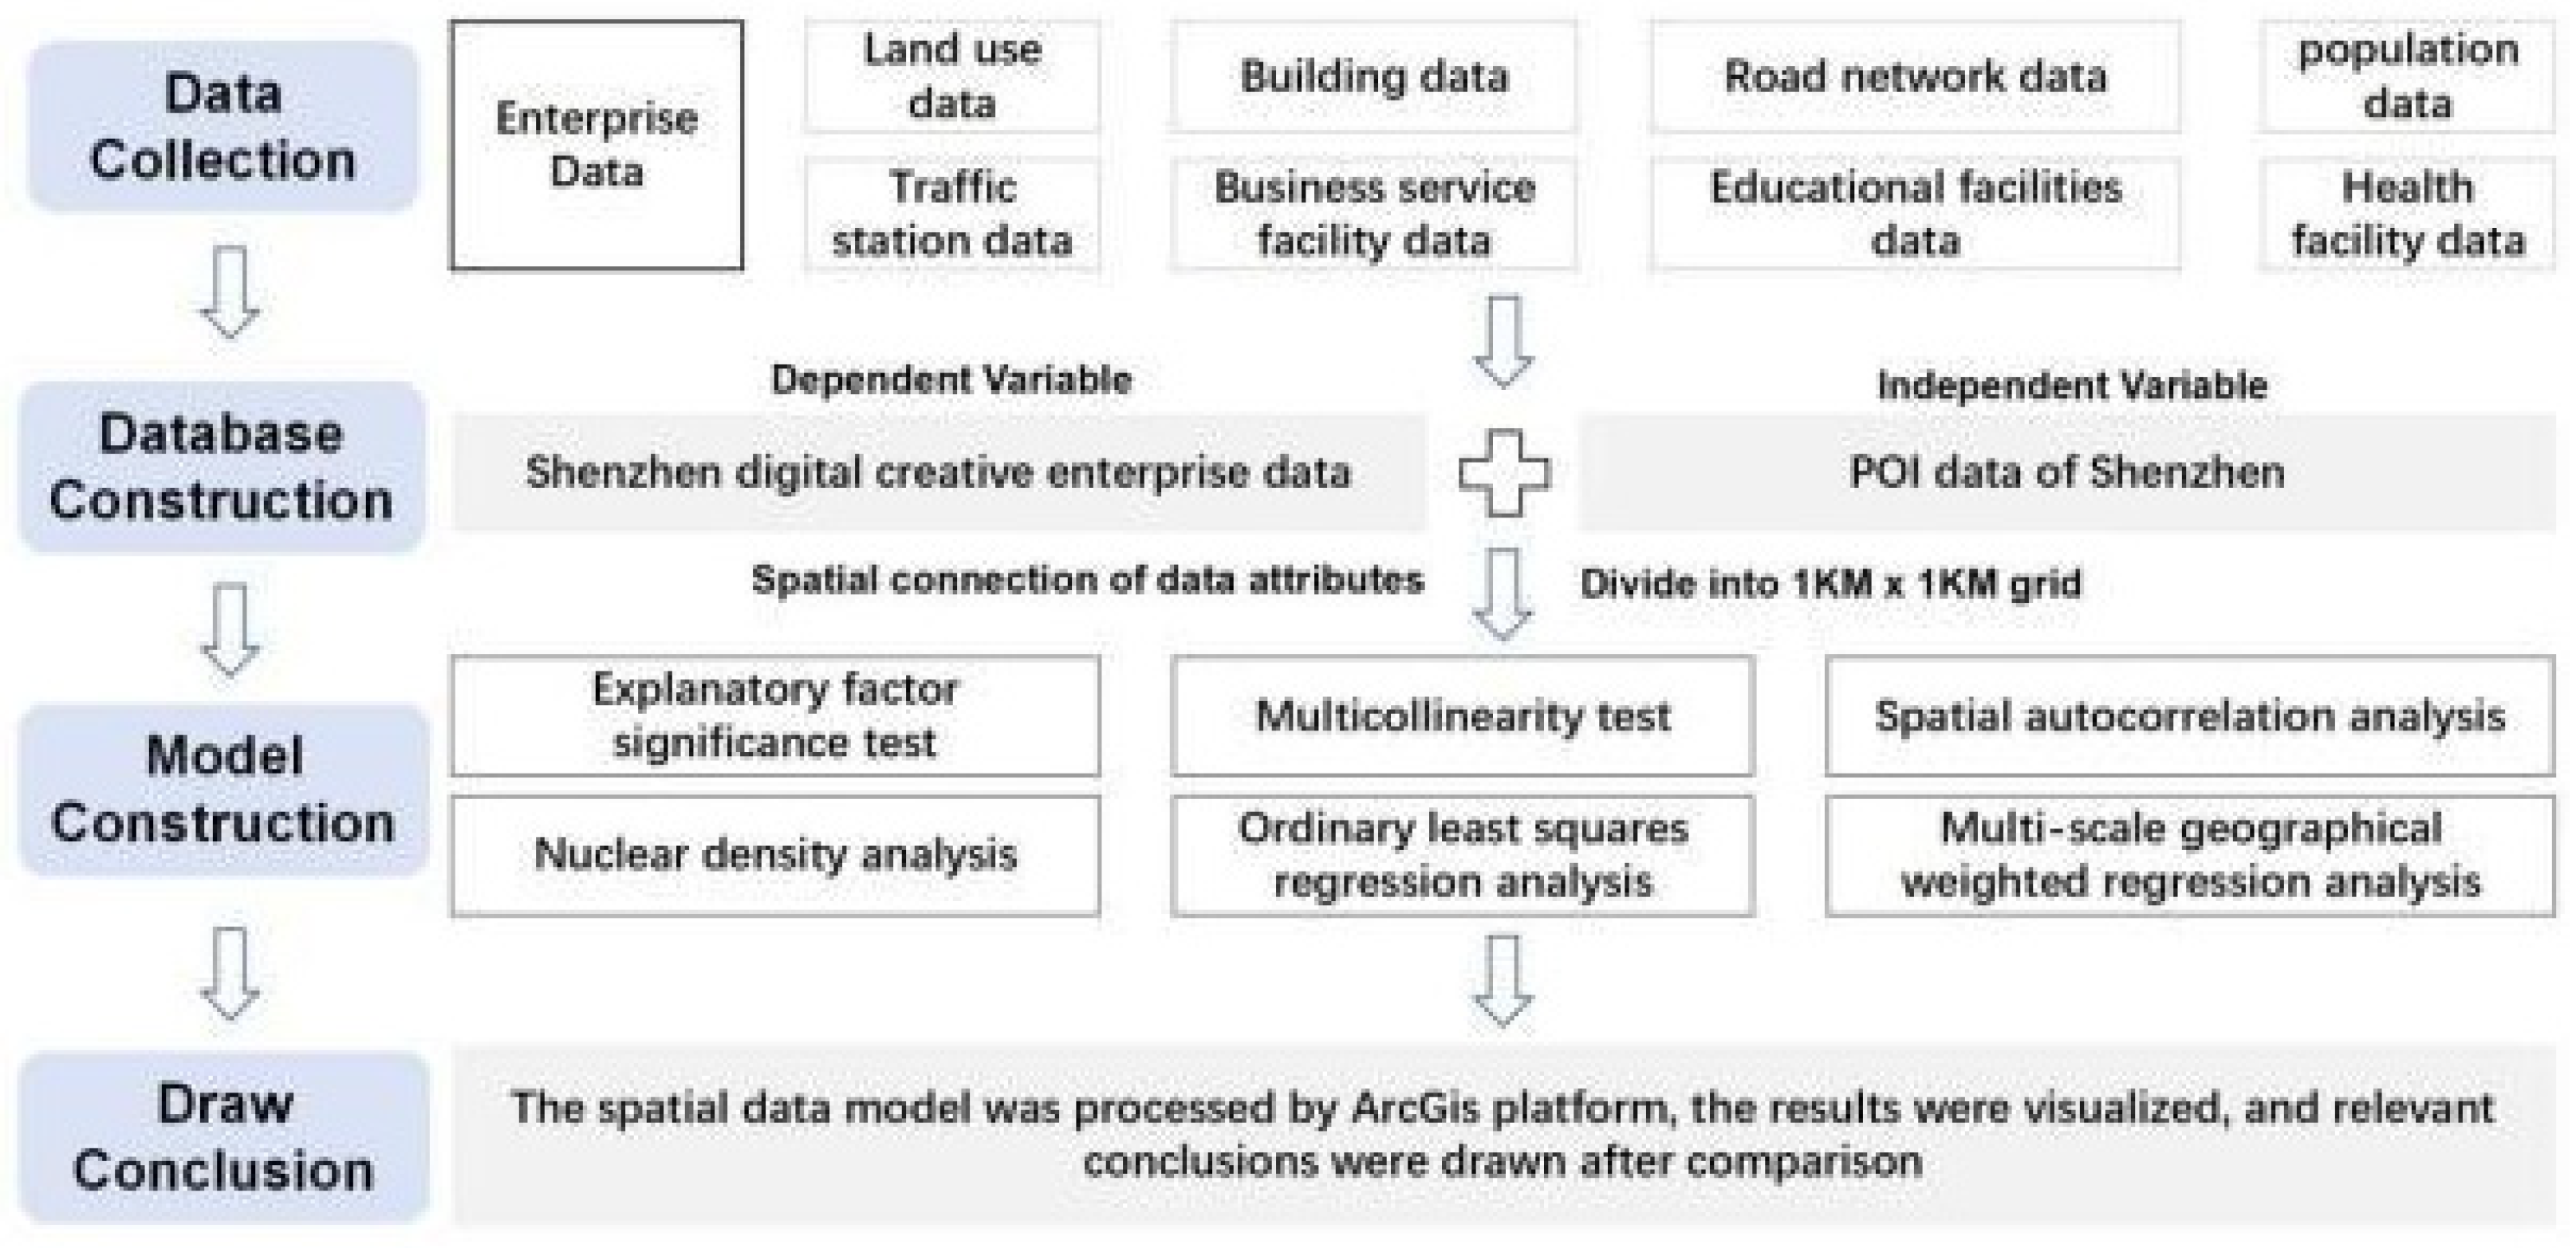
Based on CiteSpace platform, this study summarized the literature data of digital creative industry in CNKI during the 25-year period from 1997 to 2022, and found that the keywords “digital creativity, digital media, creative industry, advertising creativity, animation and games” were clustered significantly, and the first three keywords had a higher centrality. And “advertising creativity, animation games” are two important categories in the digital creative industry. The emergence of “creative industry” first appeared in 2005, while “digital creativity, cultural creativity, digital media” appeared in 2017, their emergence time is late but high intensity.
Firstly, at the theoretical research level, domestic scholars such as Wang Xueqin (2014) [4] have defined relevant concepts of digital creative industry, and Li Fengliang (2017) [5] and other scholars have studied the industrial development path based on the scale of the whole of China. Zang Zhipeng (2018) [6], Chen Nengjun (2020) [7] and other scholars have studied the high-quality development path of the industry from the perspective of global value chain. Secondly, in terms of research scale, Jian Yarong (2021) [8] Glaeser (2005) [9], Lumei Village (2018) [10], Durrer (2017) [11], Zhou Jianxin (2020) [12], Xie Xuefang (2020) [13] Etc. Scholars believe that urban agglomeration should become an important carrier of industrial development.
At present, domestic and foreign scholars have studied the development mechanism and path of digital creative industry from the perspective of China and even the world, and there are many empirical studies on the pattern of digital creative industry in the world’s four major bay areas and China’s urban agglomerations from a regional perspective, but there are few studies on the layout and influencing factors of digital creative industry from the perspective of cities. Therefore, this study chooses the digital creative industry in the megacity of Shenzhen as the research object to conduct empirical research from the micro perspective.
2.2. Research Ideas
This paper intends to explore the distribution characteristics and clustering development trend of Shenzhen’s digital creative industry from two aspects: spatial distribution evolution characteristics of digital creative enterprises and influencing factors of enterprise location (Figure 2). Specifically speaking: Firstly, the database of digital creative enterprises is constructed by using enterprise big data screening, and the spatial agglomeration characteristics are identified by kernel density analysis and other methods based on Arcgis platform. Then, combined with big data of urban spatial information, the impact factor system was constructed, and the model was built through OLS and MGWR regression analysis. The effects of each impact factor were analyzed, and feasible suggestions for promoting the development of industrial clusters were obtained.
Figure 2.
Research technology route.
2.3. Data Source
This study selects the whole city of Shenzhen as the research object, and selects the big data of Shenzhen enterprises, which covers the enterprise name, address, business scope, industry code and other enterprise information. In addition, the big data of Shenzhen urban spatial information is also selected, including land use data, building census data, traffic data (road network data and public transportation station data), population data, POI data, etc.
2.4. Index System Construction
Based on the development needs of digital creative industry, this study starts from four dimensions: park foundation, production service, public service and life service. Construct an indicator system that includes 21 influencing factors, such as concentration degree of key parks, talent supply level, information consulting and agency service ability, public transportation service level, education and medical service level, shopping and leisure service level (see Table 1). This study measured their professional service ability by the number of information consulting and agency agencies, their transportation accessibility by the distance to bus stations, subway stations, etc., the convenience of medical education facilities by the distance to primary and secondary schools and hospitals and clinics, and their life service level by the number of service facilities such as shopping malls.
Table 1.
Influencing factor system.
3. Research Methods
3.1. Nuclear Density Analysis
Kernel density analysis is based on the location and density of the observed data. By calculating the number of points within a certain distance around each location, the density value of the location is obtained, and the data density distribution in the whole study area is obtained. Kernel density analysis can help us explore the distribution pattern and hot spots of spatial data [14]. This paper uses the kernel density analysis tool to explore the spatial distribution characteristics of digital creative enterprises in Shenzhen and analyze their agglomeration rules.
3.2. Multi-Scale Geographical Weighted Regression Analysis
Multiscale Geographically Weighted Regression (MGWR) is a geographically weighted regression model that considers the influence of spatial data on different scales, and can solve the spatial heterogeneity problem. Its expression is as follows:
In the formula, the regression coefficient of the k variable is expressed under the condition of b bandwidth [15].
Compared with the traditional global regression model, MGWR model can consider the influence of spatial heterogeneity and local effects, and adopt different bandwidth values for different independent variables to better reflect the spatial heterogeneity among different influencing factors, thus improving the accuracy of its regression analysis. In this study, the results of MGWR model with spatial heterogeneity and LOS model with simple linear regression will be compared and analyzed, so as to draw more scientific and reasonable research conclusions and put forward policy guidance in turn.
4. Spatial Distribution Characteristics of Digital Creative Industry in Shenzhen
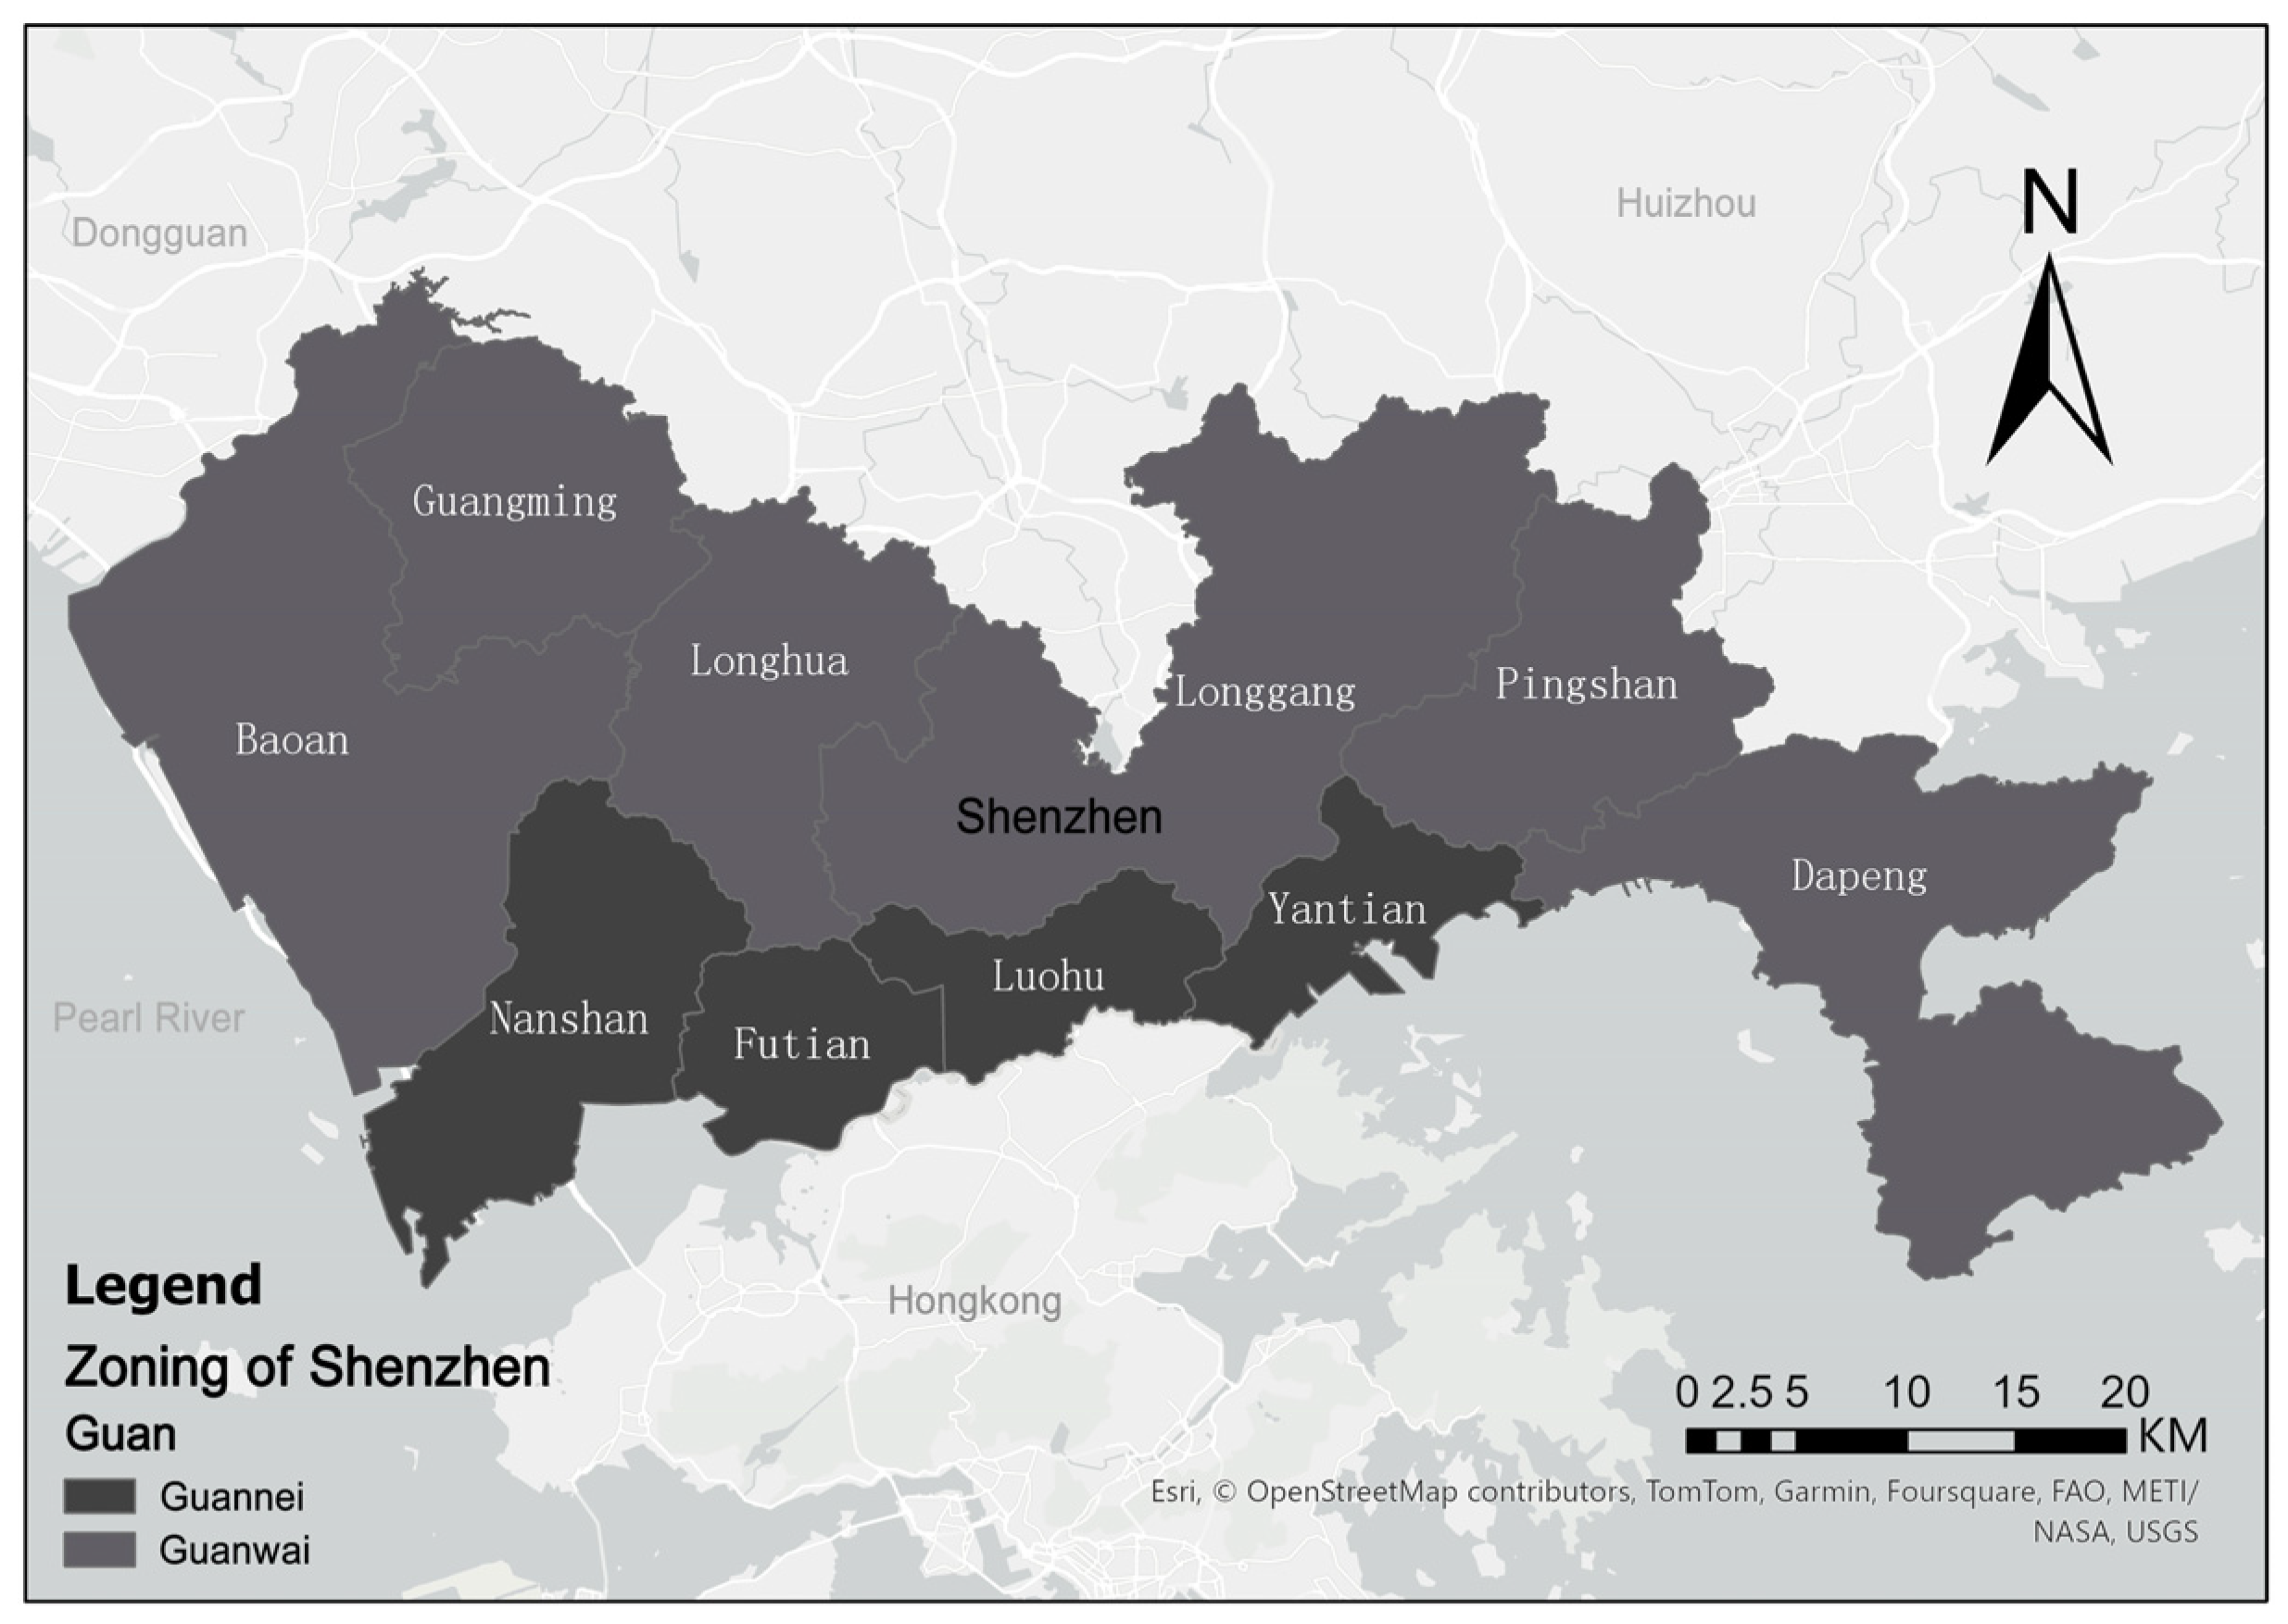
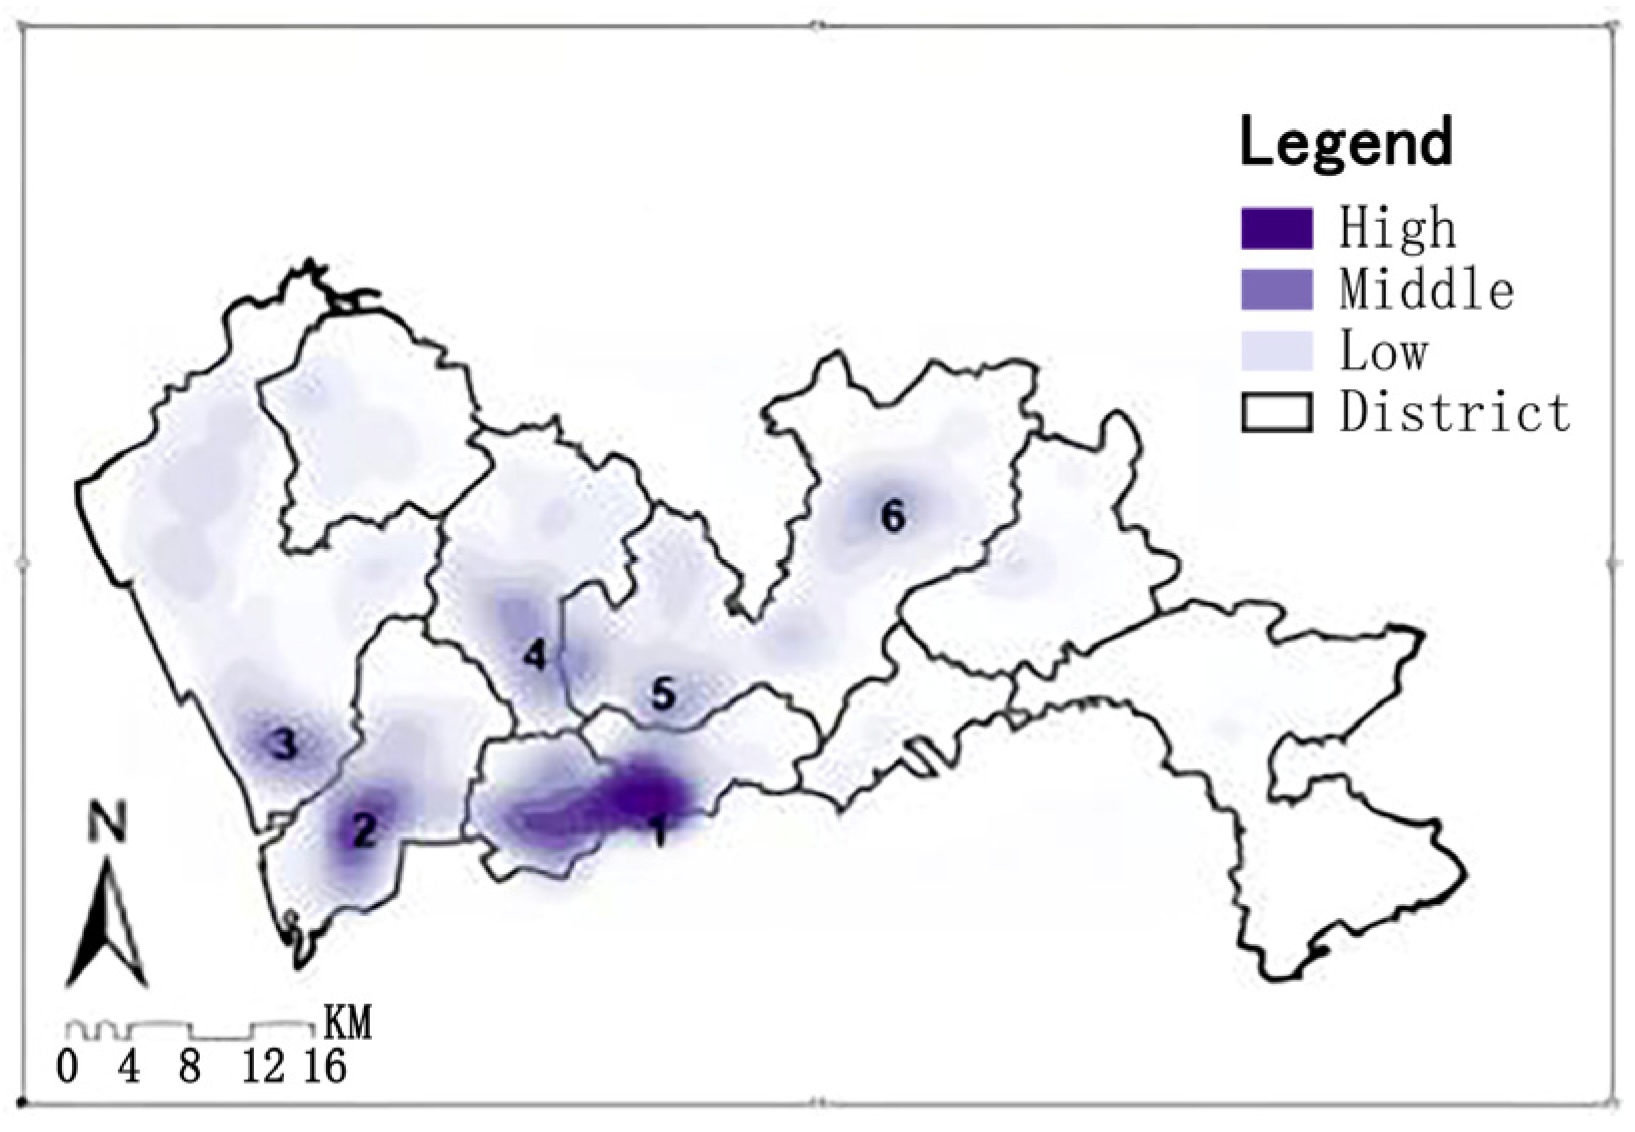
4.1. The Overall Spatial Distribution Characteristics Are Characterized by Strong Agglomeration Guannei and Weak Dispersion GUANWAI
Based on source data screening, this study constructs a database of digital creative enterprises in Shenzhen, and uses the kernel density analysis tool of ArcGIS platform to explore the overall spatial distribution characteristics (Figure 3).
Figure 3.
Administrative divisions of Shenzhen.
There are six spatial clusters (Figure 4), including “Futian, Luohu” Pole, “Nantou, Nan shan, Yuehai” Pole, “Baoan, Xixiang” Pole, “Longhua, Minzhi, Sakata” Pole, “Longgang, Buji” Pole and Longgang Central Pole. On the 3 km spatial scale, the results of nuclear density agglomeration are shown as the core results of administrative district level agglomeration, and on the 1 km spatial scale, the results of nuclear density agglomeration are shown as the agglomeration results of various industrial platforms in the city.
Figure 4.
Results of 3 km core density analysis.
In Guannei area (Figure 3), the industry is highly concentrated in Futian, Nanshan and Luohu districts, and Yantian has not developed significantly in the digital creative industry. The Futian and Luohu poles are connected to Nanshan poles along Shennan Avenue.
In Guanwai area Baoan, Longhua and Longgang have obvious clusters of digital creative industries, leading Guangming and Pingshan; Longgang presents a number of medium and low strength nodes, and the overall trend is linearly connected from the ”Buji, Henggang, Longgang” center along Metro Line 3 (Figure 5).
Figure 5.
Results of 1 km core density analysis.
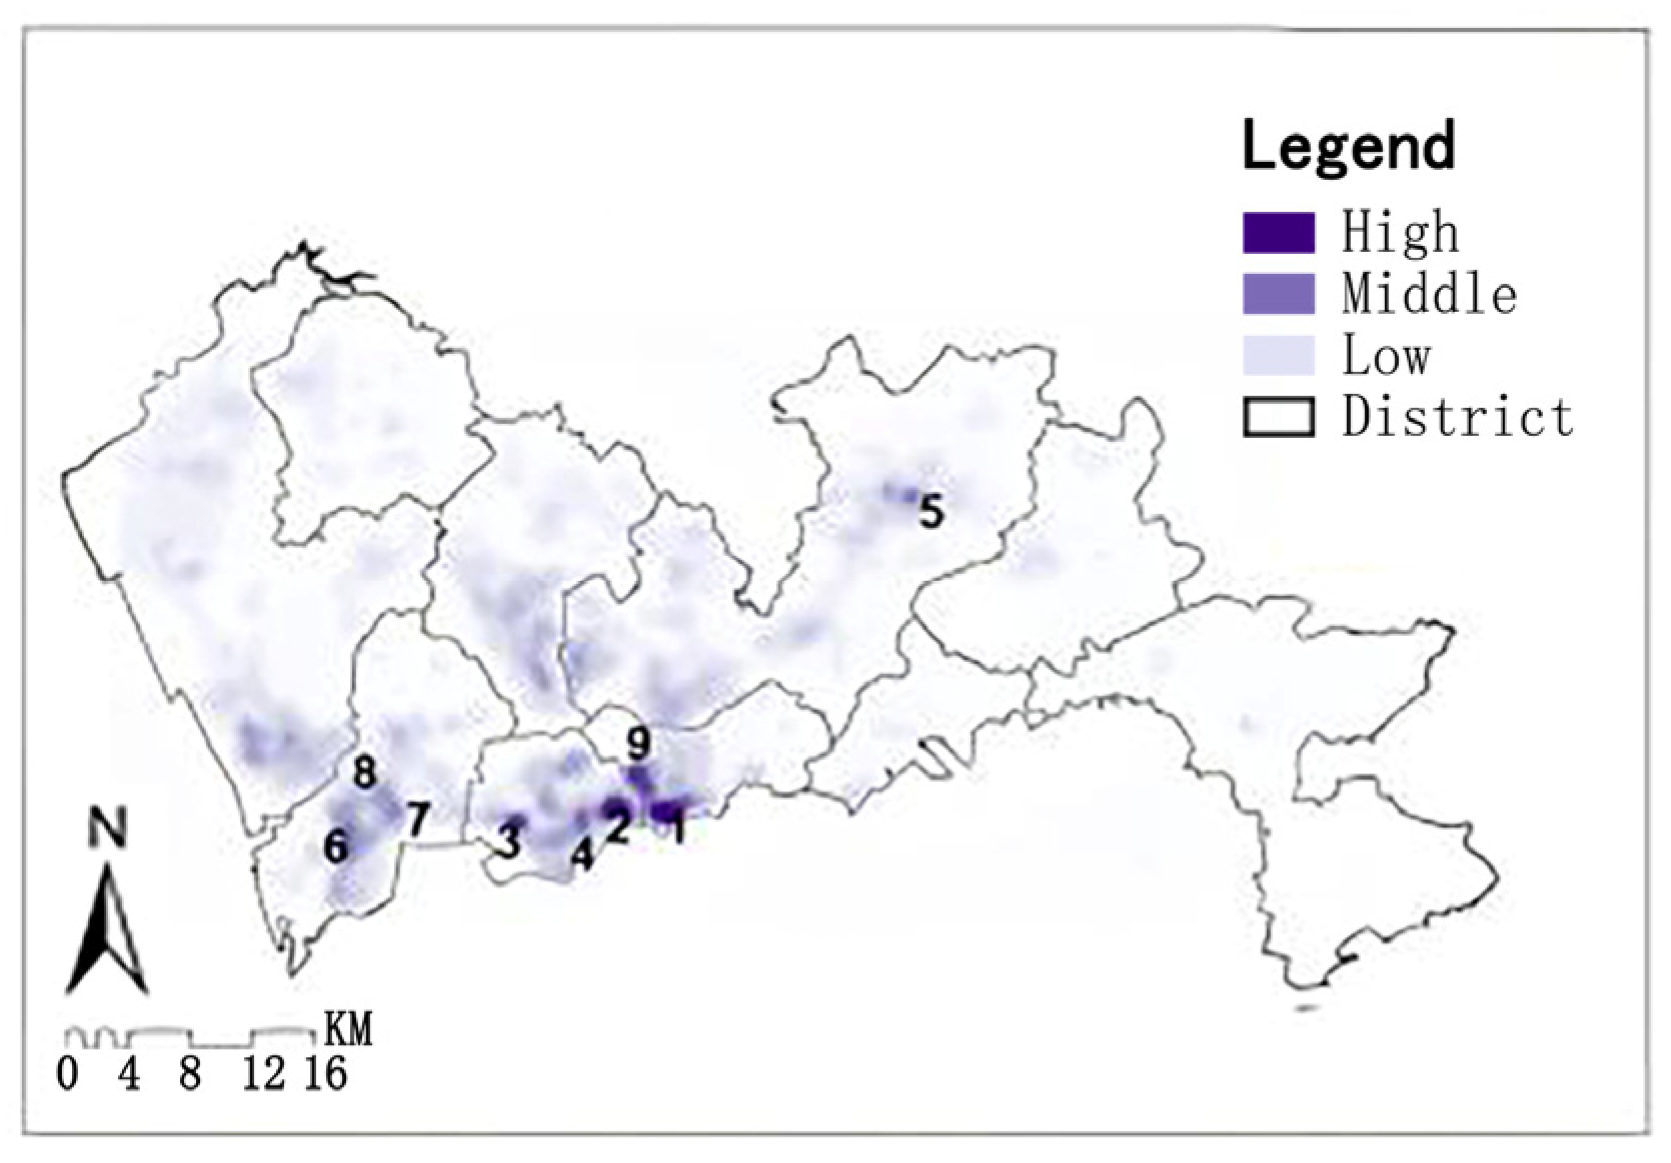
4.2. The Agglomeration Scale of Digital Creative Industry Decreases from the Center to the Outside
The agglomeration scale of digital creative industry decreases from the center to the outside. In the process of increasing the threshold value, the clustering of eight districts, Pingshan, Dapeng, Guangming, Yantian, Longhua, Baoan, Longhua and Longgang, disappear successively. Under the standard of “300 enterprises with a radius of 1 km”, (1) Futian, Luohu and Nanshan have 4 or more clusters, and obviously formed a cluster area, which has obvious advantages in the number of large-scale enterprises. (2) In the south of Baoan, Longhua, Longgang and other regions, the number of clusters in each district is not more than 3, the formation of cluster continuous areas is not obvious, and the number of enterprises reaching scale is limited. (3) In Guangming, Pingshan and Dapeng, the number of clusters reaching scale is limited or even none, and they are in the embryonic and initial stage of enterprises.
5. Analysis of Influencing Factors of Spatial Location of Digital Creative Industry in Shenzhen
5.1. Model Fitting Effect
The dependent variable of the spatial analysis model in this study is the enterprise density of digital creative industry in the grid, and the explanatory variable is the driving factor system of 4 categories including park foundation, production service, public service and life service and 21 subcategories. OLS, GWR and MGWR regression analysis methods are successively used to build the model and compare the results.
Firstly, the global spatial autocorrelation analysis was performed on the data and the report was displayed. The global Moran’s I was about 0.9966, and the z score was about 64.240 (Table 2), indicating that there was a very obvious spatial positive correlation. Then the OLS model was used for several rounds of analysis, and the driving factors that were irrelevant or weakly correlated with the dependent variables were gradually eliminated. Finally, MGWR was used to carry out several rounds of spatial heterogeneity research and compared the results, and gradually eliminated the driving factors that were not correlated with the dependent variables or had weak correlation.
Table 2.
Spatial self-correlation report and MGWR diagnostic information.
5.2. Selection and Scale Analysis of Influencing Factors
The driving factor system of this study includes two measures: density and distance. After the model was constructed by OLS analysis method, explanatory variables with multicollinearity (VIF > 7) in the results were screened and removed. After several rounds of OLS model construction, the relationship between explanatory variables and dependent variables can be divided into two categories: significant correlation and non-significant correlation according to the results. The significant correlation explanatory variables are sorted according to the strength of correlation, while the nonsignificant correlation explanatory variables are directly eliminated, so as to optimize the fitting effect of the model. According to the phased optimal model, the ideal driving factor system is obtained, and the multi-scale geographical weighted regression model is used for analysis. After modeling by MGWR analysis method, the correlation strength was judged according to the average value of coefficient of each explanatory variable (Table 3), and the corresponding spatial characteristics were visualized and the reasons were analyzed.
Table 3.
Explanatory variable coefficients, Bandwidth of MGWR model.
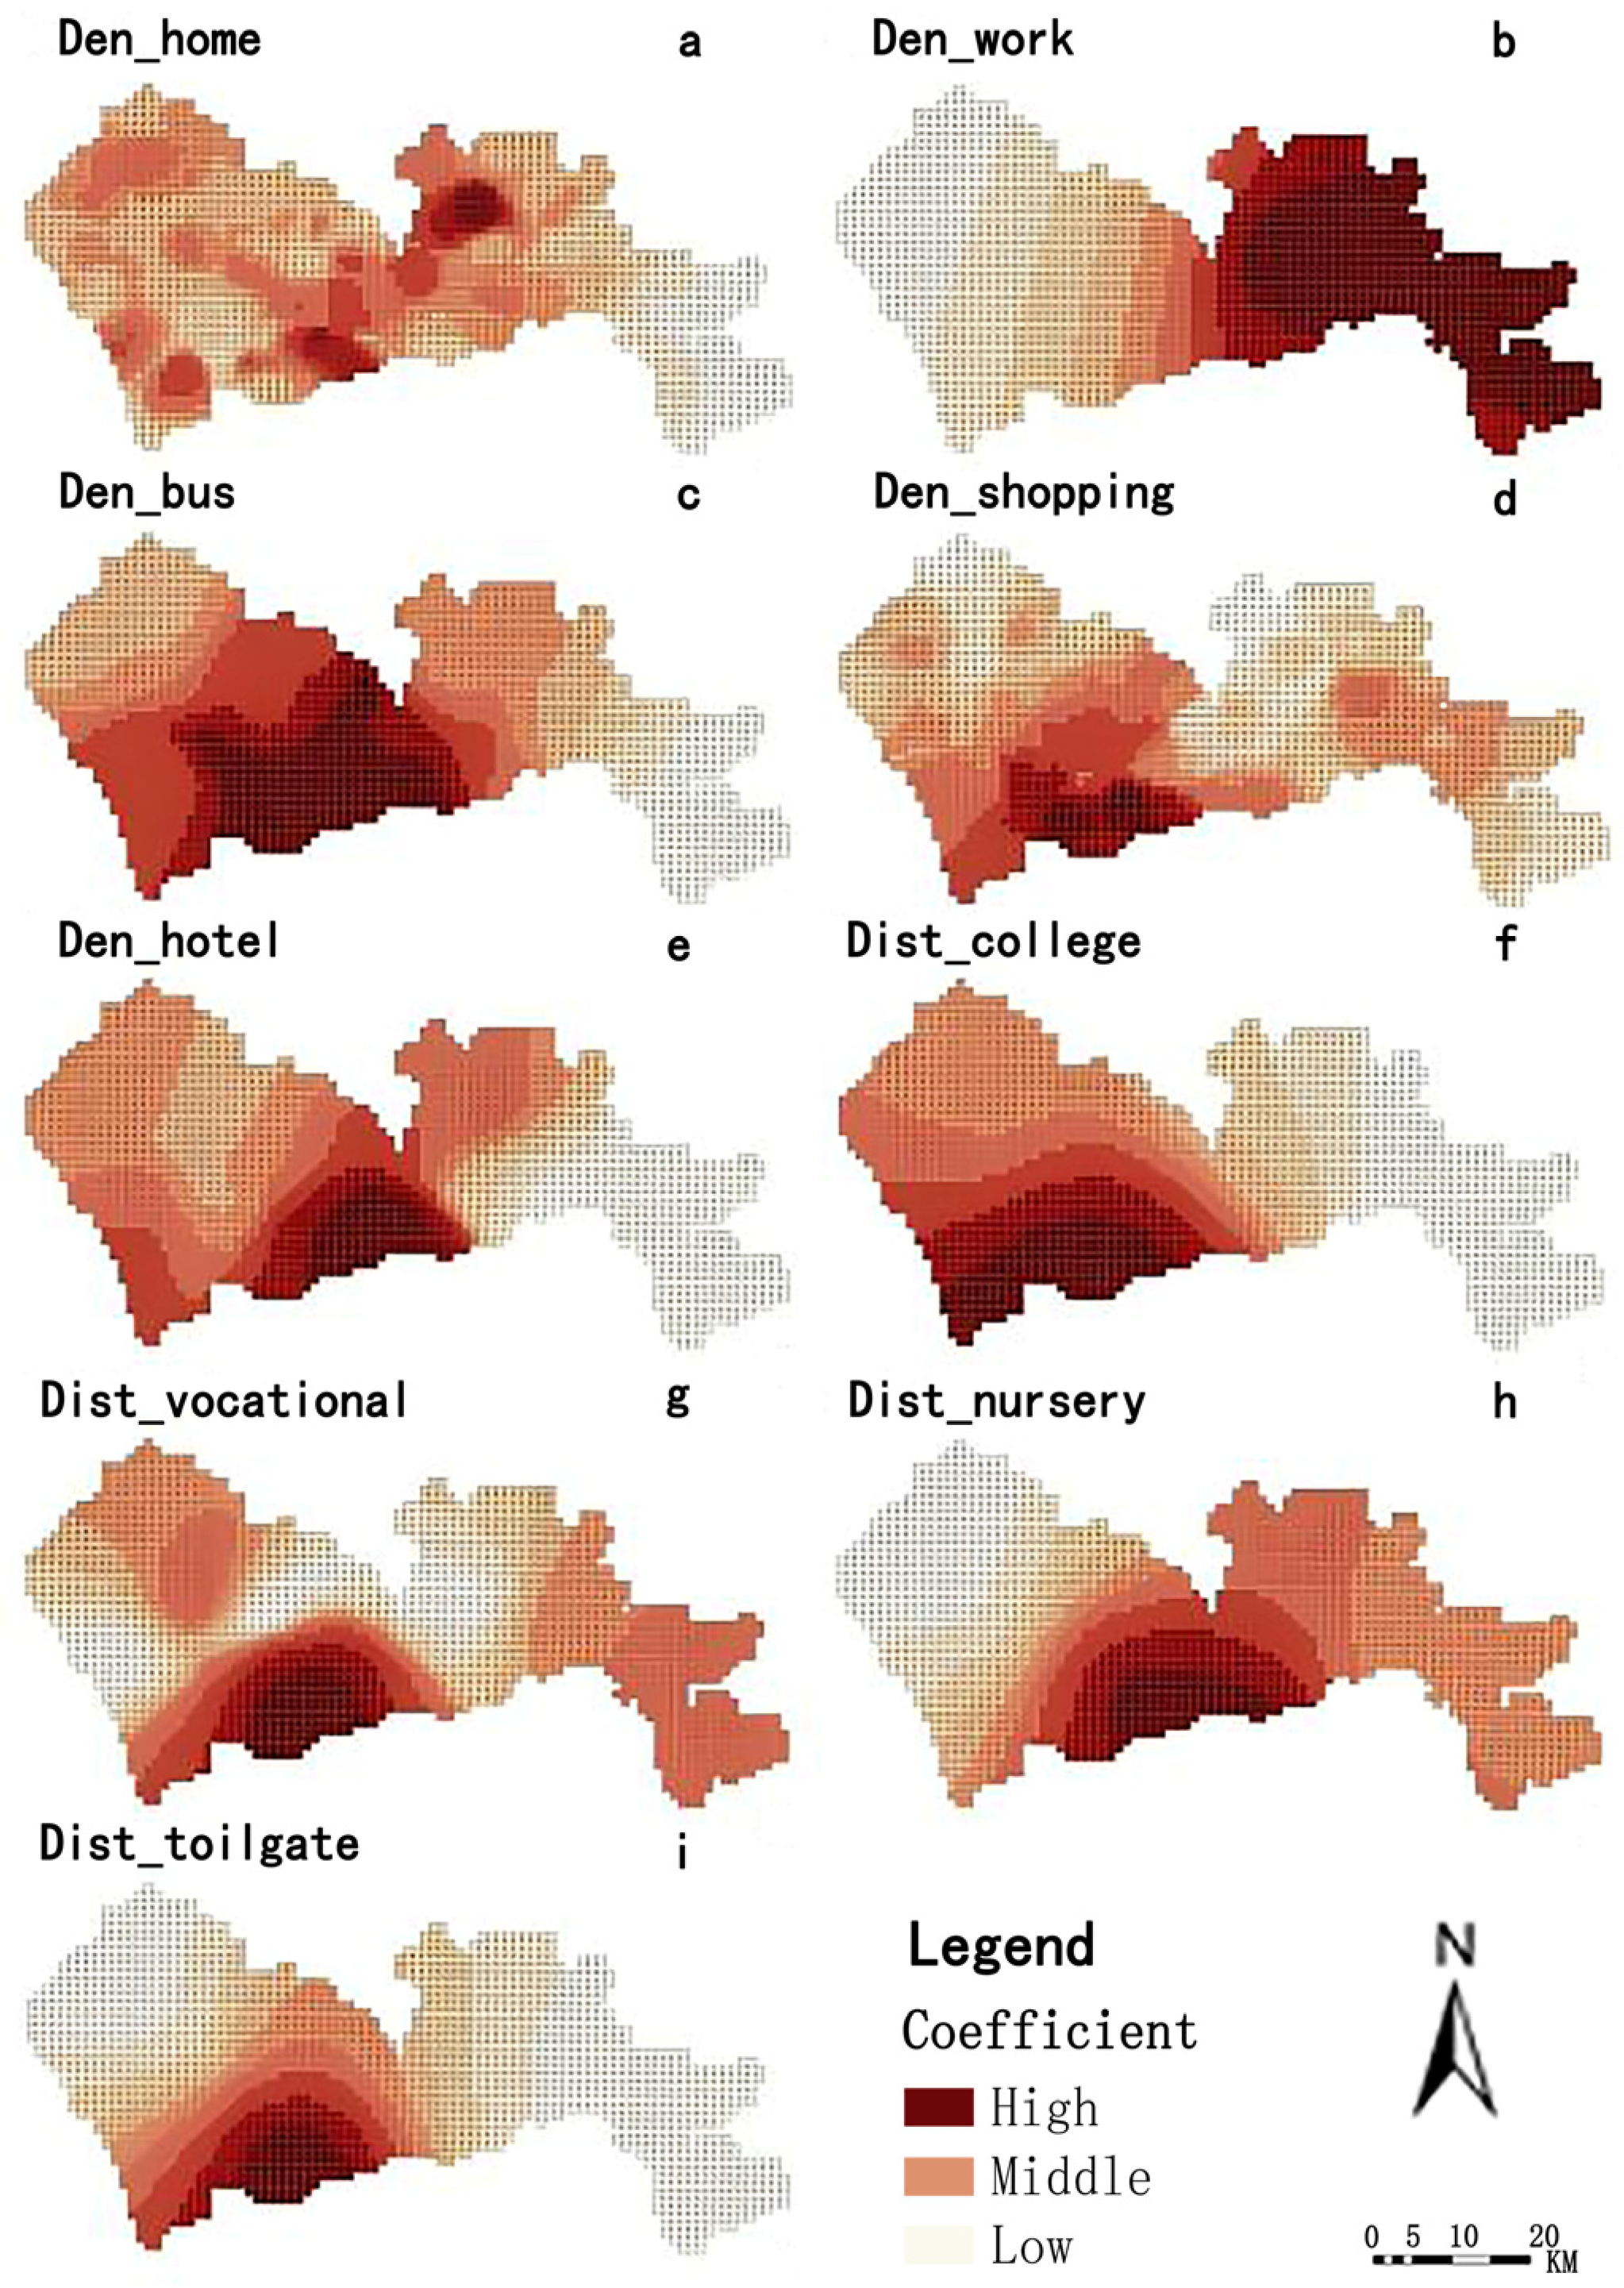
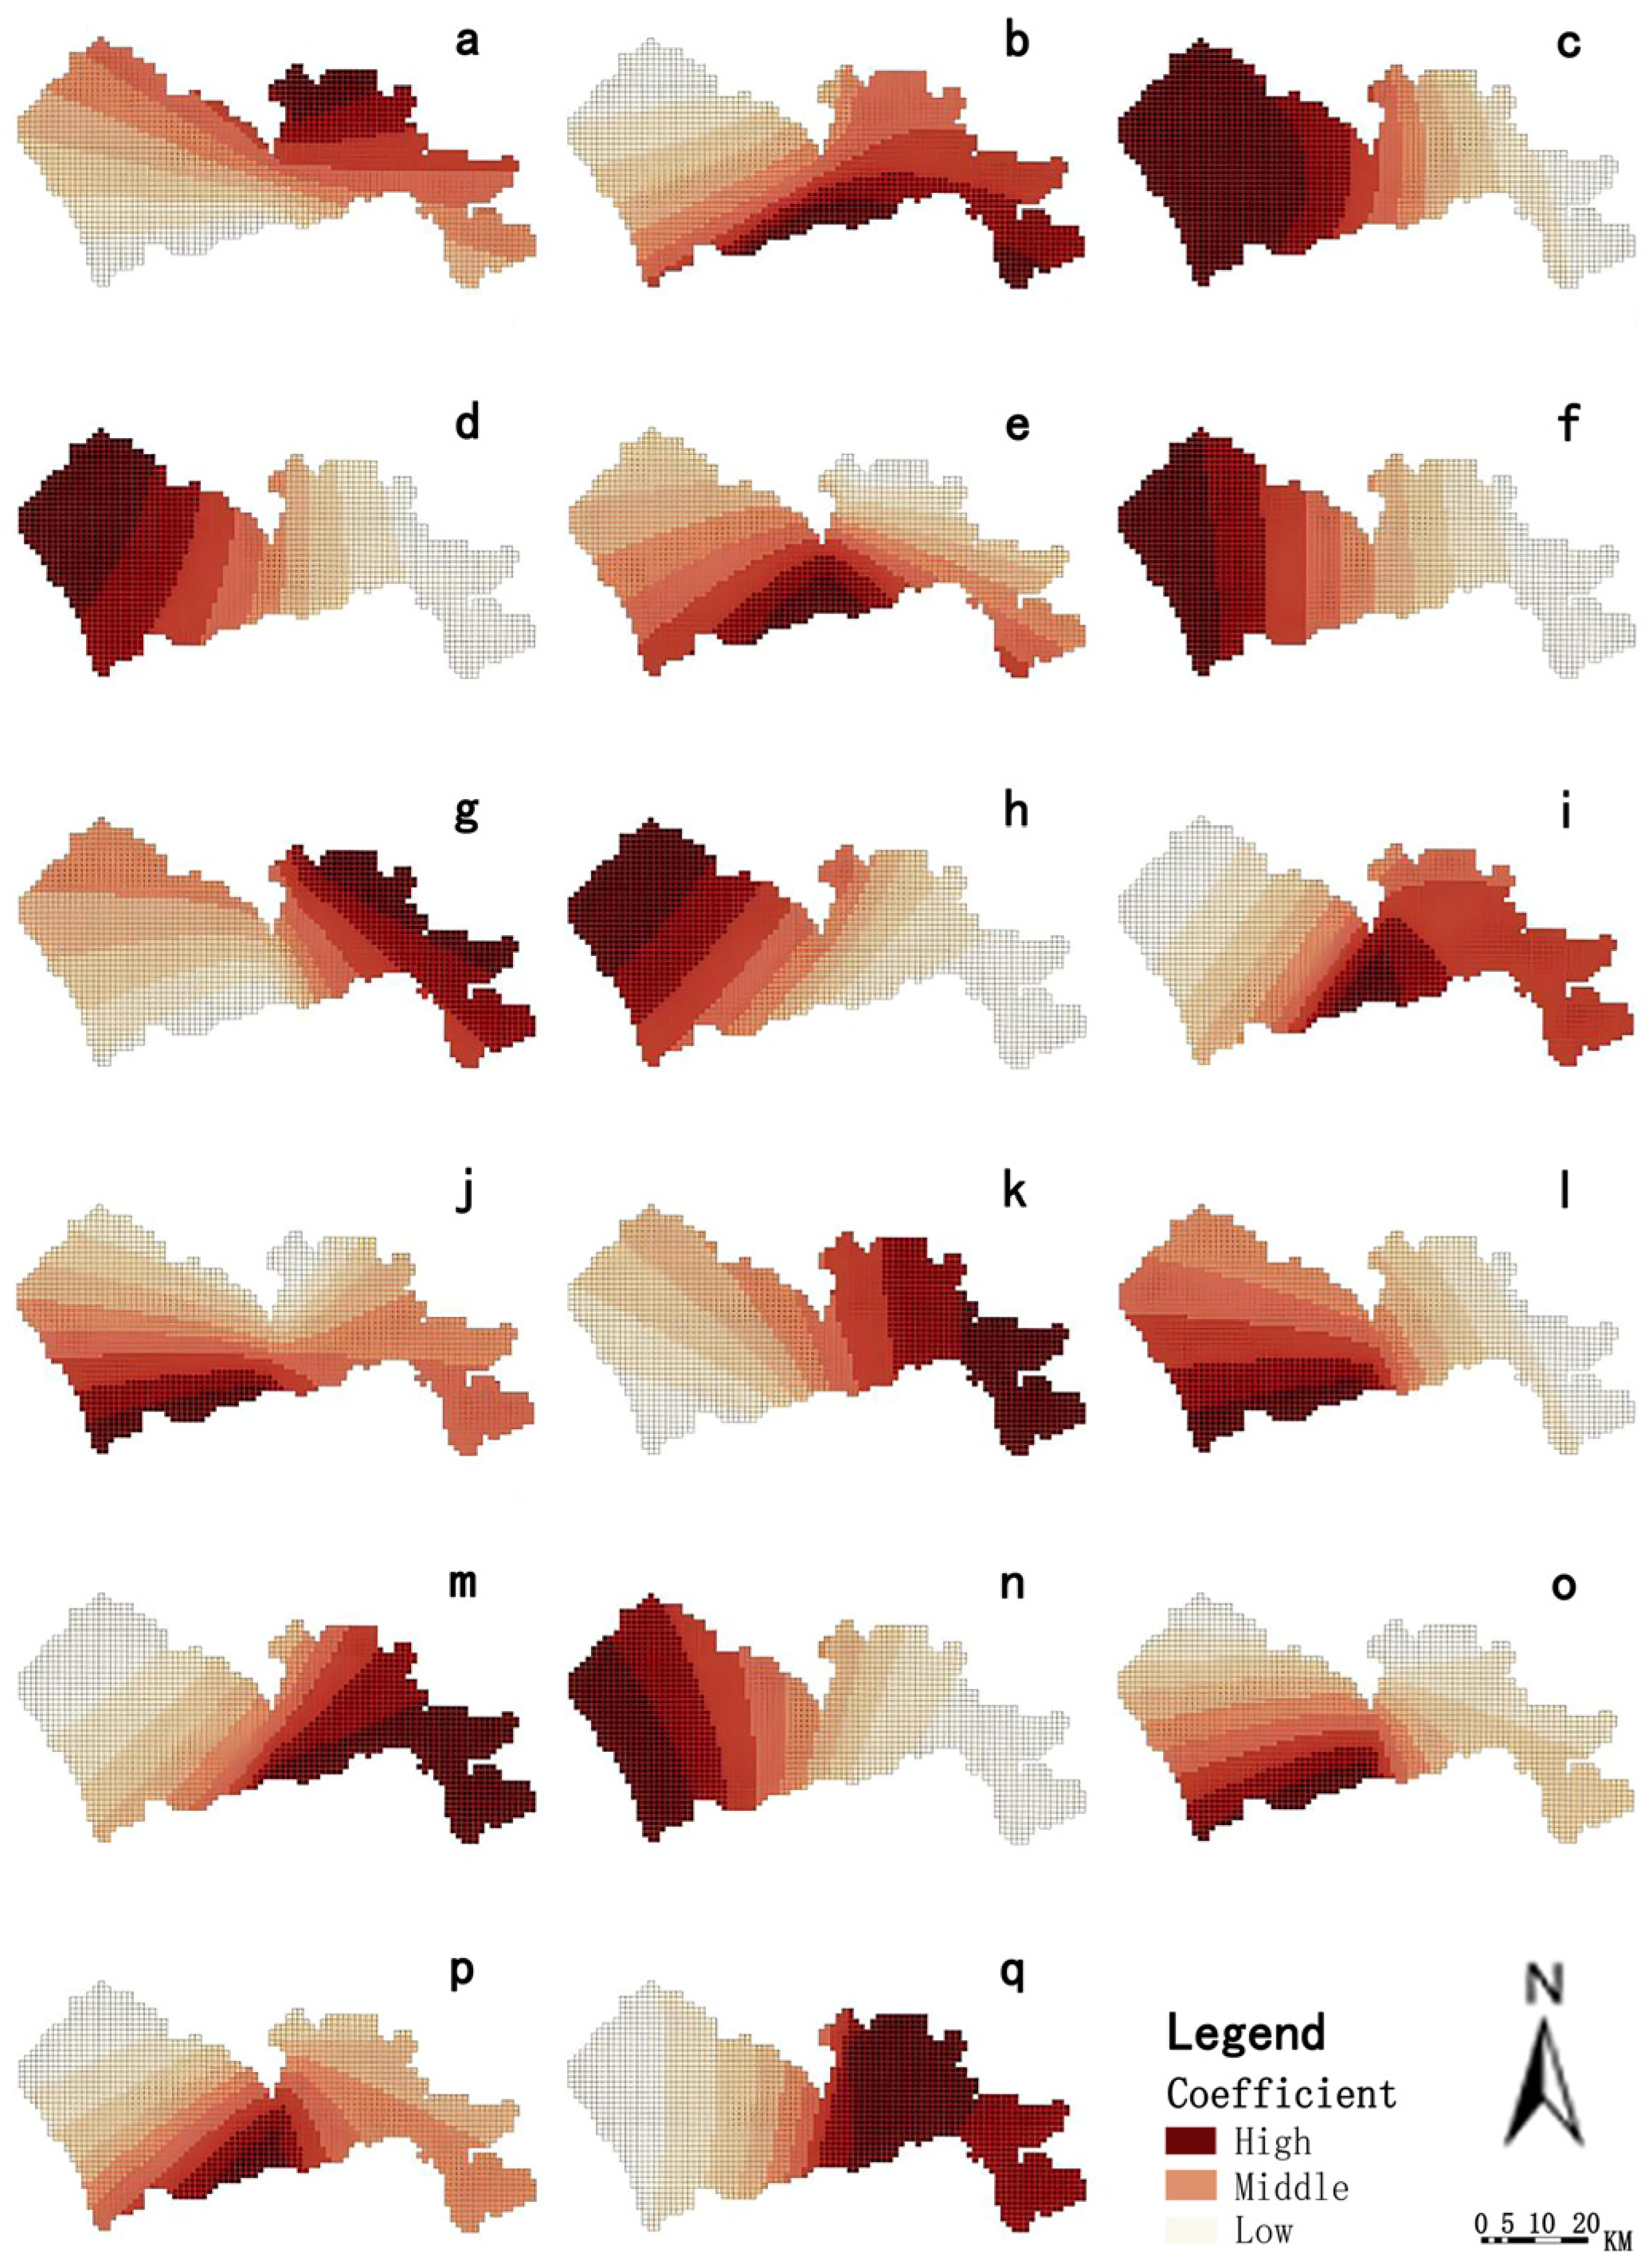
5.3. Spatial Heterogeneity Analysis of Influencing Factors
The factors affecting the spatial distribution of digital creative industry in Shenzhen are very complex. It is not only necessary to consider the conditions of enterprises themselves, but also to integrate the influence of government preferential policies, convenience of living production service facilities and other factors on talent attraction. According to the results of MGWR analysis, four factors, namely park foundation, production service, life service and public service, have a significant impact on the location selection of digital creative enterprises in Shenzhen. It is worth noting that government policy bases such as the number of policies and the number of platforms play an indelible role in helping enterprises attract talents and reduce financial expenditure. Life service facilities such as parks and plazas and comprehensive shopping provide the most basic living security for employees of digital creative enterprises, which helps to improve employees’ willingness to work and improve enterprise operation efficiency to a certain extent.
In this study, independent variables are divided into global and local factors according to the scale of action.
The global scale factors represent the scale of influence on the distribution of enterprises in the whole city of Shenzhen, and the effect is weak, for example, the influence range of hospital density in the grid is the whole city and shows a weak positive correlation. The local scale factors indicate that the scope of action is accurate and the effect is strong, for example, the bandwidth of the shopping facility density in the grid is 60 (Table 3) and presents a strong positive correlation [16,17,18,19,20].
5.3.1. Local Influencing Factors
The effect scale of local influencing factors is small, so the spatial heterogeneity of the effect of independent variables on dependent variables can be explored based on their influence scope (Figure 6). The potential influencing factors will also be analyzed in this paper.
Figure 6.
MGWR coefficients of local influencing factors.
The number of residents in the grid unit where the enterprise is located is a local variable with a small effect scale, and its influence presents strong spatial heterogeneity. As a whole, there was a strong positive correlation (Figure 6a), with high coefficients in the core areas of each district and low coefficients in other regions. The peak coefficient is mainly distributed in the area of Longcheng Square Station and Shuanglong Station in Longgang, where a large number of residential communities are built to provide accommodation for employees in the southern industrial park.
The number of working population in the grid unit where the enterprise is located is a local variable, but the effect scale is large, and its influence shows weak spatial heterogeneity. The overall positive correlation was strong (Figure 6b) and the coefficient fluctuation was small. However, the results show that the east is high and the west is low, while the east is a large number of mountains and other nonconstruction land, which indicates that the eastern construction land enterprise agglomeration is stronger to a certain extent.
The number of bus stops in the grid unit where the enterprise is located is a local variable with a small effect scale, and its influence presents strong spatial heterogeneity. The overall positive correlation is strong (Figure 6c), and the high coefficient is mainly in Nanshan, Baoan, Futian and Luohu. The possible reason is that public transport has high accessibility and low cost, and employees will give priority to using public transport to commute due to life pressure.
The number of shopping facilities in the grid unit of the enterprise is a local variable and the effect scale is small, and its influence shows strong spatial heterogeneity. The overall positive correlation was strong (Figure 6d), with high coefficient in the core area and low coefficient in other areas. The high coefficient showed obvious clusters, mainly distributed in Futian, Luohu, Nanshan, Baoan and Longhua. The coverage of comprehensive shopping facilities has a strong promoting effect on the density of enterprises, and the core area is mainly concentrated in a high cluster based on its strong development foundation.
The number of hotels in the grid unit where the enterprise is located is a local variable with small effect scale, and its influence presents strong spatial heterogeneity. The overall positive correlation was strong (Figure 6e), and the high coefficient was mainly distributed in Luohu and Futian, which may be caused by the large accommodation demand of Hong Kong-Shenzhen commuting groups. In addition, the core areas of Nanshan and Baoan, Longhua and Longgang showed medium-high values; Among them, Nanshan and Baoan, relying on highly intensive business activities and airports, have sprung up the hotel industry with business services, while Longhua and Longgang have sprung up the accommodation industry with tourism services, relying on Shenzhen North Railway Station and East Railway Station.
The distance from the firm to the university is a local variable, but the effect scale is large, and its influence shows weak spatial heterogeneity. The overall correlation is negative (Figure 6f), and the local negative correlation is strong. The high-value areas are mainly located in Futian, Luohu, Nanshan, Baoan and Longhua. The university campuses are mainly located at the junction of Nanshan and Longhua, and most digital creative enterprises are located in the urban area of Shenzhen.
The distance between enterprises and vocational schools is a local variable with small scale, and its influence presents strong spatial heterogeneity. The overall negative correlation was weak (Figure 6g), but the negative correlation was relatively strong in Futian, Luohu and Nanshan, and the negative correlation was generally high in Guangming, Dapeng and Pingshan.
The number of nursery school in the enterprise’s grid unit is a local variable, but the effect scale is large, and its influence shows weak spatial heterogeneity. As a whole, there is a weak negative correlation (Figure 6h), which may be due to the fact that employees are relatively young, most of them are childless, and the supply capacity of such facilities is difficult to become their core demand.
The distance between the firm and the high-speed toll station is a local variable, but the effect scale is large, and its influence shows weak spatial heterogeneity (Figure 6i). The overall negative correlation was weak, but Futian and Luohu showed strong negative correlation.
5.3.2. Global Impact Factors
The spatial distribution of correlation coefficients of global scale influencing factors is shown in the Figure 7, and their data characteristics and changing trends are shown in the Table 4. From the statistical results of the model, their influence on the dependent variables is not prominent, so this paper does not make a specific analysis.
Figure 7.
MGWR coefficient of global influencing factors.
Table 4.
MGWR results of global influencing factors.
6. Conclusion and Discussion
6.1. Conclusion
Based on enterprise data, urban built environment data, population data and other multi-source data, this study uses spatial autocorrelation analysis, kernel density analysis, OLS and MGWR analysis models to describe the spatial distribution characteristics of Shenzhen’s digital creative industry, and further discusses the influencing factors of Shenzhen’s digital creative enterprises location. The results are as follows:
- (1)
- The overall spatial distribution characteristics of Shenzhen’s digital creative industry are characterized as “widely distributed throughout the city, with strong concentration within the customs and weak dispersion outside the customs”; The agglomeration scale of digital creative industry decreases from the center to the outside. The concentration of digital creative industry is mainly concentrated in Nanshan, Futian and Luohu, among which “Futian, Luohu” and “Nanshan Nantou, Yuehai” are the two core agglomeration points. The areas outside the customs formed small-scale agglomeration in the center of Longhua and Longgang, but it was not obvious.
- (2)
- After analyzing the OLS and MGWR models, a driving factor system consisting of four categories was constructed from the perspectives of enterprises and employees, and 15 explanatory variables were finally selected. According to the MGWR model, the four explanatory variables with strong correlation are “the density of shopping facilities”, “the density of working people”, “the density of hotel accommodation” and “the density of bus stations”.
- (3)
- According to the correlation results, the density measure has a stronger impact on enterprise density than the distance measure, and living service facilities such as shopping facilities and hotel facilities have a more obvious impact on enterprise density, indicating that enterprises are more inclined to choose locations with more convenient living service facilities, which can provide better living environment for practitioners and improve their work efficiency. Create higher value for the enterprise.
6.2. Discussion
The spatial distribution of digital creative industry in Shenzhen is not a simple agglomeration, but a combination of agglomeration and decentralization. Some areas rely on solid development foundation such as infrastructure or core parks to produce large-scale agglomeration, while other areas are dispersed. After further exploring the influencing factors, it is found that the classical location theory can not fully explain the location problem of digital creative enterprises. Suggestions for the current situation of digital creative industry are as follows:
- (1)
- Various districts propose different systems for the development of digital creative industries. Nanshan, Futian and Luohu should strengthen the integration of digital creative industry with the new generation of digital technology, and play the leading role of the whole city; Other districts should optimize the institutional environment for industrial development, improve the environment for the development of cultural industries and digital technologies, and foster the endogenous driving force for the agglomeration and development of digital creative industries.
- (2)
- The construction of digital creative industry parks should strengthen supporting professional consulting agencies, commercial shopping facilities, hotel accommodation, and create a park environment with multiple functions and matching supply and demand.
- (3)
- The location of digital creative enterprises should not only consider the production cost, but also consider the humanistic factors of practitioners, and provide them with an efficient, convenient, safe and comfortable living environment as much as possible, so as to better create value for the enterprise.
There are still some deficiencies in this paper. On the one hand, this study is unable to obtain the financial input and expenditure data of the digital creative industry and the cost data of industrial land in each district of Shenzhen. At present, it is limited to the use of urban spatial big data for relevant analysis, and it is unable to obtain more scientific research results. On the other hand, micro-scale data is missing, and subsequent field investigations are needed to verify the reliability of the conclusions.
In the future, the research on digital creative industry should pay more attention to the changes in the demand of enterprises and employees, and create corresponding supply strategies in response to the changes in demand. Whether it is urban policy or infrastructure, the humanistic concept should be more emphasized.
Author Contributions
Conceptualization, methodology, software, validation, formal analysis, investigation, resources, writing—original draft preparation, Z.G.; data curation, Z.G. and R.L.; writing—review and editing, Y.Z. and N.C.; visualization, supervision, project administration, funding acquisition, Y.Z. All authors have read and agreed to the published version of the manuscript.
Funding
This research was funded by Shenzhen Science and Technology Program grant number 20220808172042001. The project name: Research on the spatial distribution characteristics and cluster development strategy of digital creative industry in Shenzhen from the perspective of Industry-city integration.
Institutional Review Board Statement
This study did not require ethical approval.
Informed Consent Statement
This study did not involve humans.
Data Availability Statement
This study selects the whole city of Shenzhen as the research object, and selects the big data of Shenzhen enterprises, which covers the enterprise name, address, business scope, industry code and other enterprise information. In addition, the big data of Shenzhen urban spatial information is also selected, including land use data, building census data, traffic data (road network data and public transportation station data), population data, POI data, etc.
Conflicts of Interest
The authors declare no conflict of interest.
References
- Xie, X.; He, X. Development risk and good governance mechanism of digital collections from the meta-cosmic perspective. China Ed. 2023, 45–53. [Google Scholar]
- Zang, Z. Global Value Chain Reconstruction of Digital Creative Industries: Strategic Position and China’s Path. Sci. Res. 2018, 4, 825–830. [Google Scholar]
- “13th Five-Year Plan” National Strategic Emerging Industries Development Plan (Full Text). Available online: https://www.gov.cn/zhengce/content/2016-12/19/content_5150090.htm (accessed on 29 November 2016).
- Wang, C. Connotation comparison and current status research of digital cultural industry at home and abroad. Digit. Libr. Forum 2014, 5, 39–44. [Google Scholar]
- Li, Z. Research on Digital creative Industry and the promotion path of National Cultural Soft Power. J. Guangxi Univ. Natl. (Philos. Soc. Sci. Ed.) 2017, 39, 2–7. [Google Scholar]
- Zang, Z. Digital Creative Industry global value chain: A review of the world Pattern and China’s reconstruction strategy. China Sci. Technol. Forum 2018, 7, 64–73+87. [Google Scholar]
- Chen, S. Digital Creative Industry in the 5G era: Global Value Chain reconstruction and China’s path. J. Hohai Univ. (Philos. Soc. Sci. Ed.) 2020, 22, 43–52+107. [Google Scholar]
- Jian, G. Spatial pattern and influencing factors of Chinese digital creative listed enterprises. Sci. Geogr. Sin. 2022, 42, 1370–1380. [Google Scholar]
- Glaeser, E. Review of Richard Florida’s The Rise of the Creative Class. Reg. Sci. Urban Econ. 2005, 35, 593–596. [Google Scholar] [CrossRef]
- Lumei Village: The Characteristics and Experience of the Industrial Development of the Bay Area in the World. Spec. Zone Econ. 2018, 8, 14–17.
- Durrer, V.; Miller, T.; O’Brien, D. The Routledge Handbook of Global Cultural Policy; Routledge: London, UK, 2017. [Google Scholar] [CrossRef]
- Zhou, H. 2019 Academic Report on China’s Cultural Industry Research. J. Shenzhen Univ. (Humanit. Soc. Sci. Ed.) 2020, 37, 57–68. [Google Scholar]
- Xie, X.; Li, L. Urban Atlas of Global digital Creative Industry Agglomeration and Research on China’s innovation Path. J. Tongji Univ. (Soc. Sci. Ed.) 2020, 31, 36–51. [Google Scholar]
- Wang, S. China, a spatial distribution pattern and its influencing factors. J. Econ. Geogr. 2020, 40, 196–207. [Google Scholar]
- Shen, T.; Yu, H.; Zhou, L.; Gu, H.; He, H. Influencing mechanism of second-hand housing price in Beijing: A study based on multi-scale Geographical Weighted regression Model (MGWR). Econ. Geogr. 2020, 40, 75–83. [Google Scholar]
- Zhou, X.; Yang, S. Distribution characteristics and influencing factors of high-tech enterprises in Beijing. Econ. Geogr. 2024, 44, 126–136. [Google Scholar]
- Li, J.; Sun, C.; Zhang, C.; Hu, X. Spatial heterogeneity of urban housing price factors based on multi-scale geographical weighted regression model: A case study of the main urban area of Guilin City. J. Zhejiang Univ. (Sci. Ed.) 2019, 51, 623–635. [Google Scholar]
- Xiao, F.; Wang, J.; Huang, Y.; Gu, H. Spatial heterogeneity and scale effect of factors influencing the distribution of high-tech enterprises in China. Geogr. Res. 2022, 41, 1338–1351. [Google Scholar]
- Liu, J.; Zhen, F.; Zhang, S.; Kong, Y.; Li, Z. Spatial distribution characteristics and influencing factors of the new generation of information technology enterprises: A case study of Nanjing City Center. Econ. Geogr. 2022, 2, 114–123+211. [Google Scholar]
- Ding, J.; Hu, D.; Leng, Z. Spatial distribution of specialized new enterprises and scale effect of Influencing factors in Yangtze River Delta Region: Based on buffer zone and MGWR. Prog. Geogr. 2019, 42, 2099–2112. [Google Scholar] [CrossRef]
Disclaimer/Publisher’s Note: The statements, opinions and data contained in all publications are solely those of the individual author(s) and contributor(s) and not of MDPI and/or the editor(s). MDPI and/or the editor(s) disclaim responsibility for any injury to people or property resulting from any ideas, methods, instructions or products referred to in the content. |
© 2024 by the authors. Licensee MDPI, Basel, Switzerland. This article is an open access article distributed under the terms and conditions of the Creative Commons Attribution (CC BY) license (https://creativecommons.org/licenses/by/4.0/).