Article

Multifractal Characteristics of Tight Sandstone Pore Structure Based on Nuclear Magnetic Resonance in Benxi Formation, Ordos Basin, China

1
National Key Laboratory of Petroleum Resources and Engineering, China University of Petroleum (Beijing), Beijing 102249, China
2
College of Geosciences, China University of Petroleum (Beijing), Beijing 102249, China
*
Author to whom correspondence should be addressed.
Fractal Fract. 2026, 10(3), 153; https://doi.org/10.3390/fractalfract10030153
Submission received: 21 January 2026 / Revised: 20 February 2026 / Accepted: 23 February 2026 / Published: 27 February 2026

Abstract

Quantifying the heterogeneity of pore-throat structure and evaluating reservoir quality are of great significance in the exploration and development of tight sandstone oil and gas reservoirs. This study focused on 10 samples of tight sandstone from the Benxi Formation in the Ordos Basin of China. Based on nuclear magnetic resonance (NMR) and combined with the theory of multifractal analysis to calculate multifractal parameters, the pore structure and fractal characteristics of tight sandstone reservoirs were characterized. The results showed that the dominant minerals are quartz, clay minerals, rock fragments and calcite, while feldspar content is relatively minor. The NMR T2 spectra all exhibited bimodal characteristics. The pore size distribution of the reservoir has multifractal characteristics. The multifractal parameters Dmin-Dmax range from 2.02 to 2.88, Dmin/Dmax ranges from 3.69 to 5.11, and △α ranges from 2.441 to 3.316. Different mineral components had different effects on the fractal characteristics. The increase in quartz content retained more primary intergranular pores, affecting the fractal dimension of large pores, and weakening the heterogeneity of the pores. The increase in calcite and clay minerals corresponded to the enhancement of micropores and mesopores, increasing the heterogeneity of the pore structure. Based on the reservoir classification using multifractal parameters, the evolution of pore heterogeneity in tight sandstone rocks can be quantified, thereby effectively evaluating reservoir quality. Overall, reservoirs with larger Dmin-Dmax and Dmin/Dmax values, smaller △α, weaker porosity heterogeneity, and better connectivity are favorable areas for hydrocarbon exploration and development. The comprehensive fractal characterization of tight sandstone reservoirs demonstrates the applicability of multifractal dimensions in characterizing the heterogeneity of pore structures in tight sandstones, and is a key factor in improving the exploration effectiveness and development benefits of tight sandstone oil and gas reservoirs.

1. Introduction

As tight sandstone gas is an unconventional natural gas resource with abundant reserves, its exploration and development can not only expand the supply of natural gas but also ensure the stability of gas sources in the energy market [1,2,3]. More than 70 basins have been discovered (or estimated) worldwide, with a total tight gas resource amount of approximately 210 × 1012 cubic meters. The safe and efficient development of this precious resource is regarded as a key strategy for achieving the dual carbon goals [4,5]. The exploitation of tight sandstone reservoirs faces numerous technical and geological difficulties, including highly variable sedimentary conditions, poor reservoir physical properties, and marked heterogeneity within the reservoir [6,7]. In addition to possessing a complicated pore structure, such formations are typically tight and exhibit extremely limited permeability. This inherent heterogeneity emphasizes the importance of pore structure in defining reservoir characteristics and as a key indicator of their quality. Therefore, comprehensively characterizing the heterogeneity of tight sandstone and assessing reservoir quality are of vital importance for deepening reservoir understanding, optimizing production enhancement measures, and increasing tight gas production [8,9,10,11].
The characterization of pore structure usually involves two main experimental methods: the fluid injection method and photoelectric radiation technology [12,13]. Nuclear magnetic resonance (NMR) is employed to obtain a more detailed understanding of pore and throat properties [14,15]. In recent years, fractal theory, as a new method for studying nonlinear complex systems, has gradually been adopted by people and used to study the pore structures inside rocks. However, relevant studies have shown that using only one fractal dimension to describe the complex pore structures derived from nonlinear evolution has limitations. For instance, rocks with the same fractal dimension may also have significantly different porosities [16].
Compared with the conventional single fractal description, a multifractal analytical scheme decomposes the self-similar characteristics of a system into several mutually coupled fractal subsets, allowing a more detailed representation of structural complexity. This allows the complex fractal patterns of pore networks to be resolved into several hierarchical components, thereby providing a more refined representation of the heterogeneity and intricacy of pore-throat systems. It proves especially beneficial for exploring microscopic pore characteristics as well as evaluating reservoir quality at various scales [17]. At present, most studies emphasize qualitative identification of factors influencing multifractal dimensions [18,19,20]. However, quantitative evaluation concerning the extent of these effects remains scarce. With the deepening of research, multifractal theory has gradually been integrated into reservoir pore structure characterization, offering supplementary insights beyond the limitations of single-dimensional fractal models [21,22,23]. It uses singularity spectra and generalized dimension spectra to decompose complex structures into multiple fractal subsets [24]. Crucially, it uses weighting factors to adaptively extract features from different pore size ranges: high weighting factors amplify the contribution of micropores to fractal characterization, while low weighting factors emphasize the contribution of macropores. The introduction of multifractal analysis establishes a quantitative scheme for describing the spatial complexity and structural heterogeneity of pore systems [1,25].
Based on nuclear magnetic resonance (NMR) measurements combined with multifractal theoretical analysis, this study investigates tight sandstone samples collected from the Benxi Formation within the Ordos Basin. The multifractal parameters were calculated and their quantitative relationships with pore structure, physical properties and mineral composition were constructed, aiming to reveal the main controlling factors of reservoir heterogeneity and improve the evaluation system of microscopic pore structure. The specific research objectives are as follows: (i) based on multiple experimental methods, to reveal the macroscopic physical properties and microscopic pore structure characteristics of tight sandstone reservoirs, and classify the pore-throat types; (ii) to quantitatively study the influence of mineral composition, rock physical parameters and pore-throat heterogeneity of tight sandstone reservoirs on multifractal parameters; (iii) to carry out reservoir classification of tight sandstone based on multifractal parameters to provide assistance in the prediction of high-quality tight sandstone reservoirs. This investigation enhances insight into the pore characteristics of tight sandstone and refines methodologies for assessing reservoir quality, while also offering valuable guidance for the development of other tight sandstone gas reservoirs.

2. Experimental Methods and Theories

2.1. Geological Background

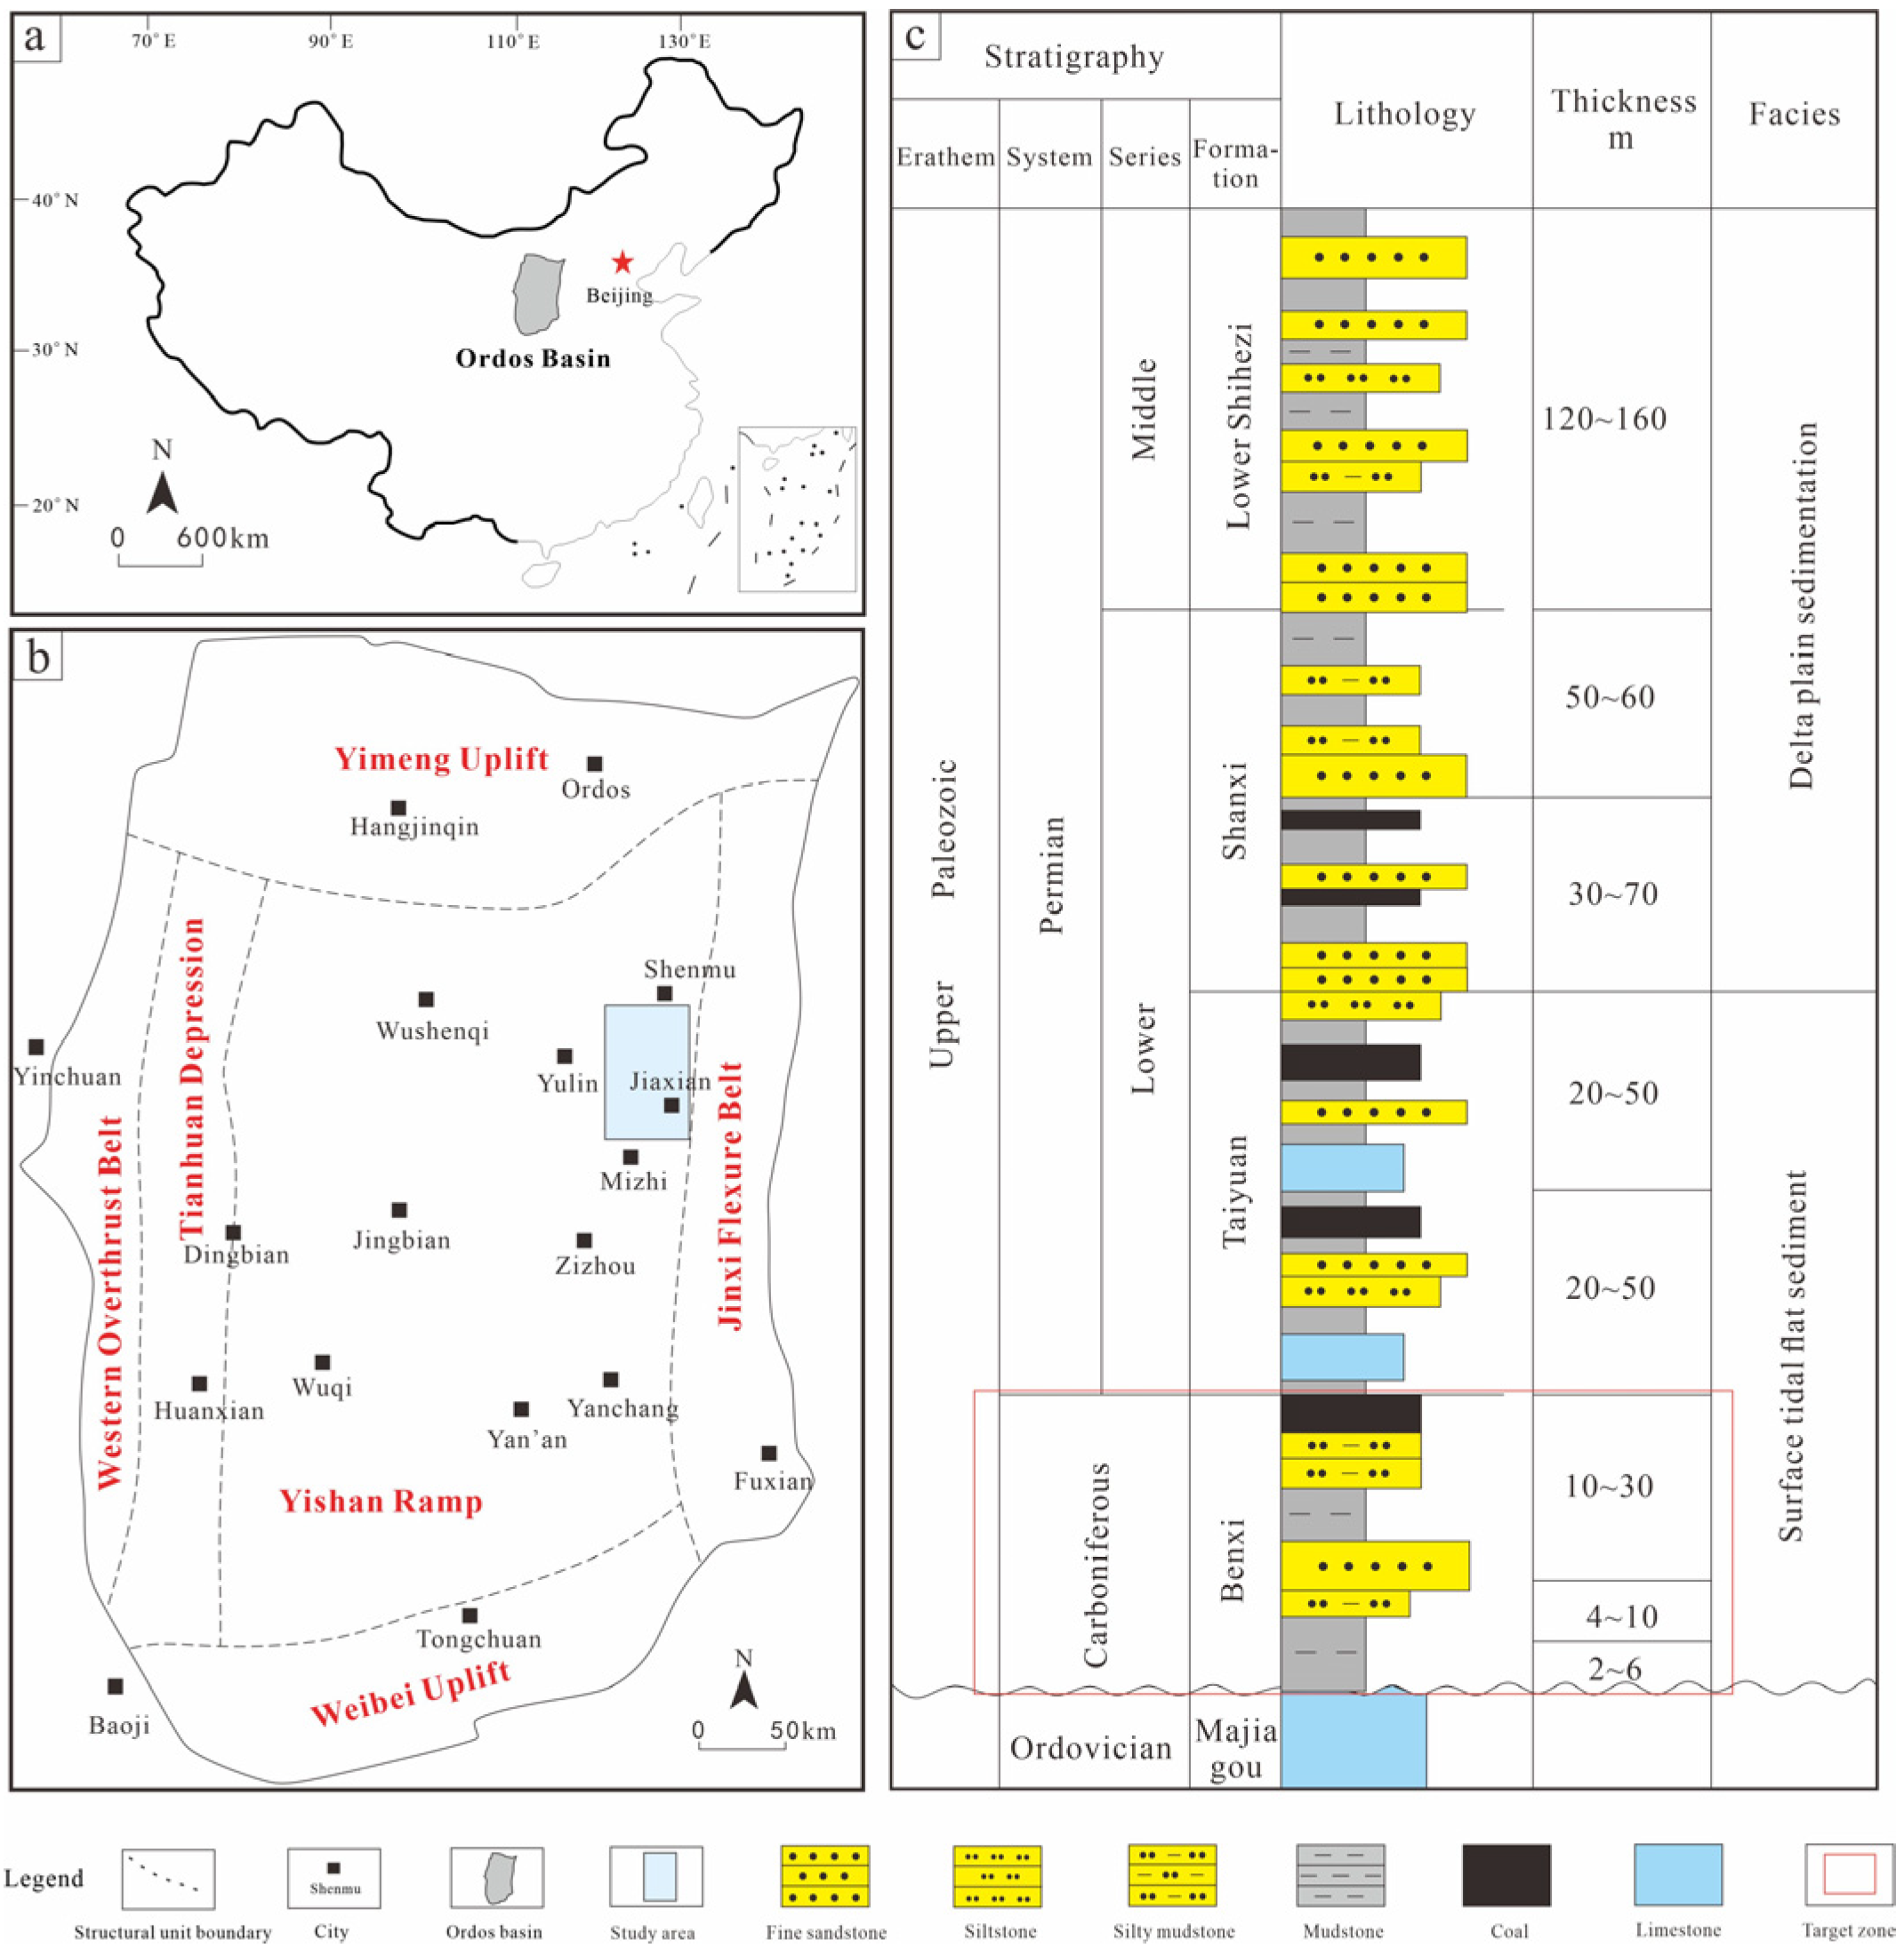
The Ordos Basin, China’s second-largest inland sedimentary basin (Figure 1a), extends from the Yimeng Uplift in the north to the Weibei Uplift in the south, bordered by the Jinxi Flexure Belt to the east and the Western Overthrust Belt to the west (Figure 1b) [26]. The research area is situated in the eastern part of the Yishan Ramp. The Benxi Formation, belonging to the Lower Paleozoic, possesses tight sandstones that are thick and stable in distribution, identified as a key target for tight gas exploration in this basin (Figure 1c). The latest exploration results show that the Benxi Formation has good reservoir physical properties and high single-well gas test production, making it a key replacement area for stable natural gas production in the Upper Paleozoic strata of the basin.

2.2. Sample Information and Experimental Process

Based on the core observation and in combination with the gas test data, 10 representative sandstone samples of the Benxi Formation from 10 exploration wells in the study area were selected for research. All collected rock samples were sealed using plastic film and immediately transferred to the laboratory, where they were processed into uniform cylindrical cores (25 mm in diameter and 50 mm in length) to ensure comparability. Each specimen was cataloged sequentially (S1–S10; Table 1). The measured porosity ranged from 0.26% to 7.55%, with an average value of 5.89%, whereas permeability varied between 0.019 × 10⁻³ and 1.115 × 10⁻³ mD (average 0.39 × 10⁻³ mD).
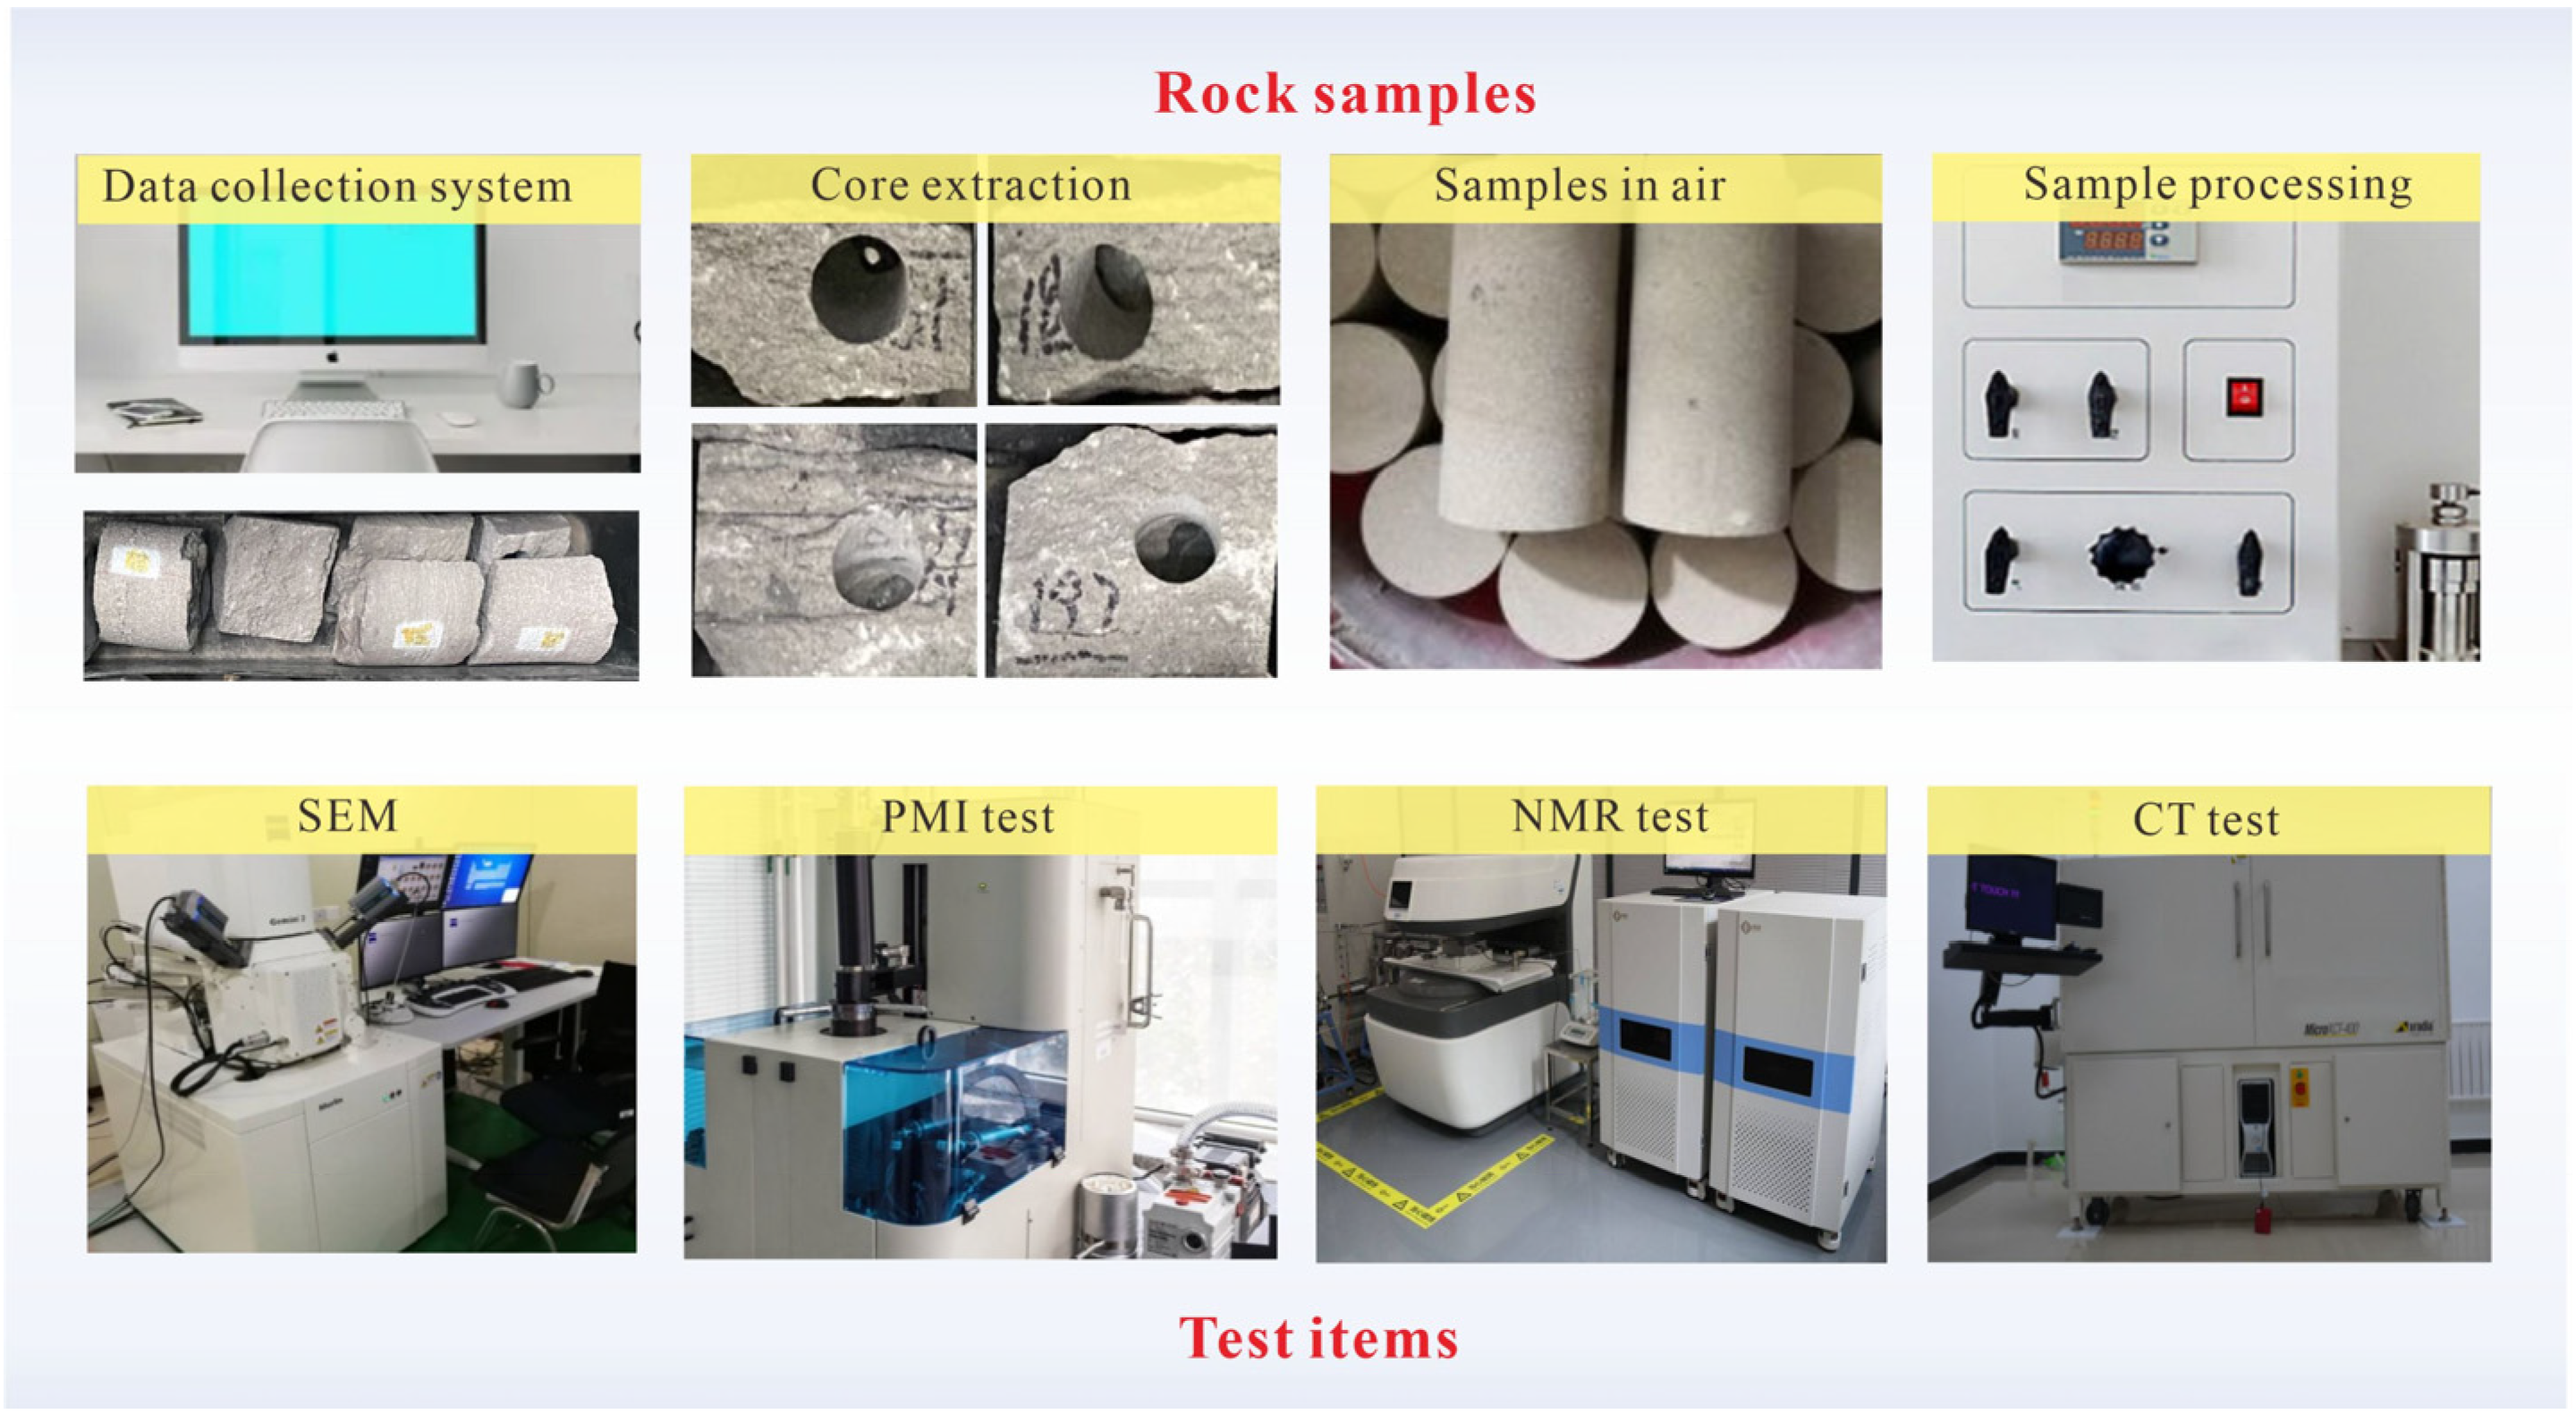
The 10 representative samples were cut into two parts: 15 mm and 35 mm. The 15 mm part of the 10 representative samples was analyzed by CTS and scanning electron microscopy to obtain detailed observation results of petrological characteristics and microscopic pore morphology. At the same time, the 35 mm part of the 10 samples was subjected to NMR testing. The rock samples and the experiment illustrations are shown in Figure 2.

2.3. Nuclear Magnetic Resonance Experiment (NMR)

The T2 spectrum test of nuclear magnetic resonance was conducted using the Nuomai NM12 nuclear magnetic resonance analyzer. The experimental temperature is 25 °C and the humidity is 55% to 65%. To ensure the accuracy of the experimental results, 10 core columns with a diameter of 25 mm and a length of approximately 35 mm were selected for this test. After the core samples are cleaned and dried, they are weighed dry. First, the core is placed into the ultra-low-permeability saturation device, then evacuated at 1 MPa for 24 h, and then the standard brine is saturated at 30 MPa until the pressure stabilizes. The main test parameters were: an echo interval of 0.1 ms, waiting time of 6 s, reception gain of 100%, and number of echoes of 15,000. The saturated water sample is subjected to high-speed centrifugation for 5 h, and then nuclear magnetic resonance experimental analysis is conducted on the fully centrifuged sample according to the same experimental parameters as the previous steps. T2 is described as
1 T 2 = 1 T 2 B + 1 T 2 S + 1 T 2 D
In the context of NMR interpretation, the transverse relaxation components—free relaxation (T2B), surface relaxation (T2S), and diffusion relaxation (T2D)—represent distinct physical mechanisms. For hydrophilic rocks saturated fully with water, free relaxation is negligible. Similarly, diffusion relaxation may be disregarded when magnetic field gradients are minimal and echo spacing is short.

2.4. Multifractal Theory

Fractal theory offers an effective framework for investigating complex pore networks and quantitatively assessing their heterogeneity and self-similarity [27]. This technology is widely used to assess the pore structure of rocky landforms [28]. Constructing a fractal model of the pore is strongly linked to the approaches used to assess pore attributes. A fractal dimension D model based on nuclear magnetic resonance and T2 correlation can be described as [29]:
l g S v = 3 D l g T 2 + D D 3 l g T 2 m a x
where SV denotes pore volume fraction, D stands for fractal dimension, and T2max corresponds to the maximum relaxation time. Although a single fractal model can describe some aspects of pore structure complexity, its interpretive capacity is limited compared with multifractal analysis. It lacks applicability to more complex multi-scale fractal structures [30]. Generally speaking, multifractal models provide information insights into the pore characteristics of rocks and help to more clearly determine the microstructure features. Similarly, based on the multifractal theory, the spectra obtained by T2 through nuclear magnetic resonance measurement can be used to better understand the characteristics of rock pores [31]. The box-counting approach was employed to investigate the multifractal properties of NMR T2 spectral data from sandstone specimens [32]. The research subject is divided into N equal-sized boxes (N = 2k, k = 1, 2, 3, …); each box size is ɛ:
ε = 2 k L
where L represents the side length of the box. Then the mass probability function of the i-th box of size ɛ can be expressed as
P i ( ε ) = N i ( ε ) i = 1 N ( ε ) N i ( ε )
where Ni(ɛ) denotes the aggregate pore volume in the ith box, and Pi(ɛ) is the probability mass function, which follows a power-exponential dependence on the box size scale ɛ:
P i ( ε ) ε α i
where αi represents the singular intensity, which is related to the region where it is located and reflects the magnitude of the probability in that region.
If the number of boxes with the same α value is defined as Nα(ɛ), then we have
N α ( ε ) ε f ( α ) ,   ε 0
where f(α) denotes the multifractal singular spectrum [33]. The singularity indices a and f(α) can be computed using the CHHABRA and JENSEN methods, and their explicit expressions are
α ( q ) i = 1 N ( ε ) u i ( q , ε ) l g ε l g ε
f ( α ) i = 1 N ( ε ) u i ( q , ε ) l g u i ( q , ε ) l g ε
u i ( q , ε ) = p i q ( ε ) i = 1 N ( ε ) p i q ( ε )
where q represents the statistical moment order, and the range can be (−∞, +∞).
For multifractals, the denominator in Equation (9) is the partition function, and its expression is as follows:
X ( q , ε ) = i = 1 N ( ε ) p i q ( ε )
f(α)~α is a set of parameters for describing the local features of multifractals, and the other set is q~Dq, which is introduced from the perspective of information theory. The calculation formula for Dq is
D q = ı ( q ) q 1
When q = 1, the formula for calculating Dq becomes
D 1 = l i m ε 0 i = 1 N ( ε ) p i ( ε ) l g p i ( ε ) l g ε
However, when substituting into the formula, it is obvious that a large amount of computing power is consumed. Therefore, previous researchers have provided a set of conversion formulas through the Legendre transformation, namely the relationship between the generalized dimension D(q) and the singular spectrum f(α):
D ( q ) = q × α ( q ) f ( α ) q 1
f ( α ) = q × α ( q ) ı ( q )
Based on the above formulas, a program was written using Matlab (2018). According to the T2 spectral distribution of nuclear magnetic resonance, parameters such as D(q), α(q), f(α), and Δα were calculated to characterize the multifractal features of the microscopic pore structure of the tight sandstone reservoirs in the study area.
Figure 1. (a) Location map of the Ordos Basin on the map of China. (b) Location map of the study area in the Ordos Basin. (c) Comprehensive columnar map of Upper Paleozoic strata in the Ordos Basin [29].
Fractalfract 10 00153 g001
Figure 2. Rock samples and test items.
Fractalfract 10 00153 g002

3. Results and Analysis

3.1. Petrological Characteristics of the Reservoir

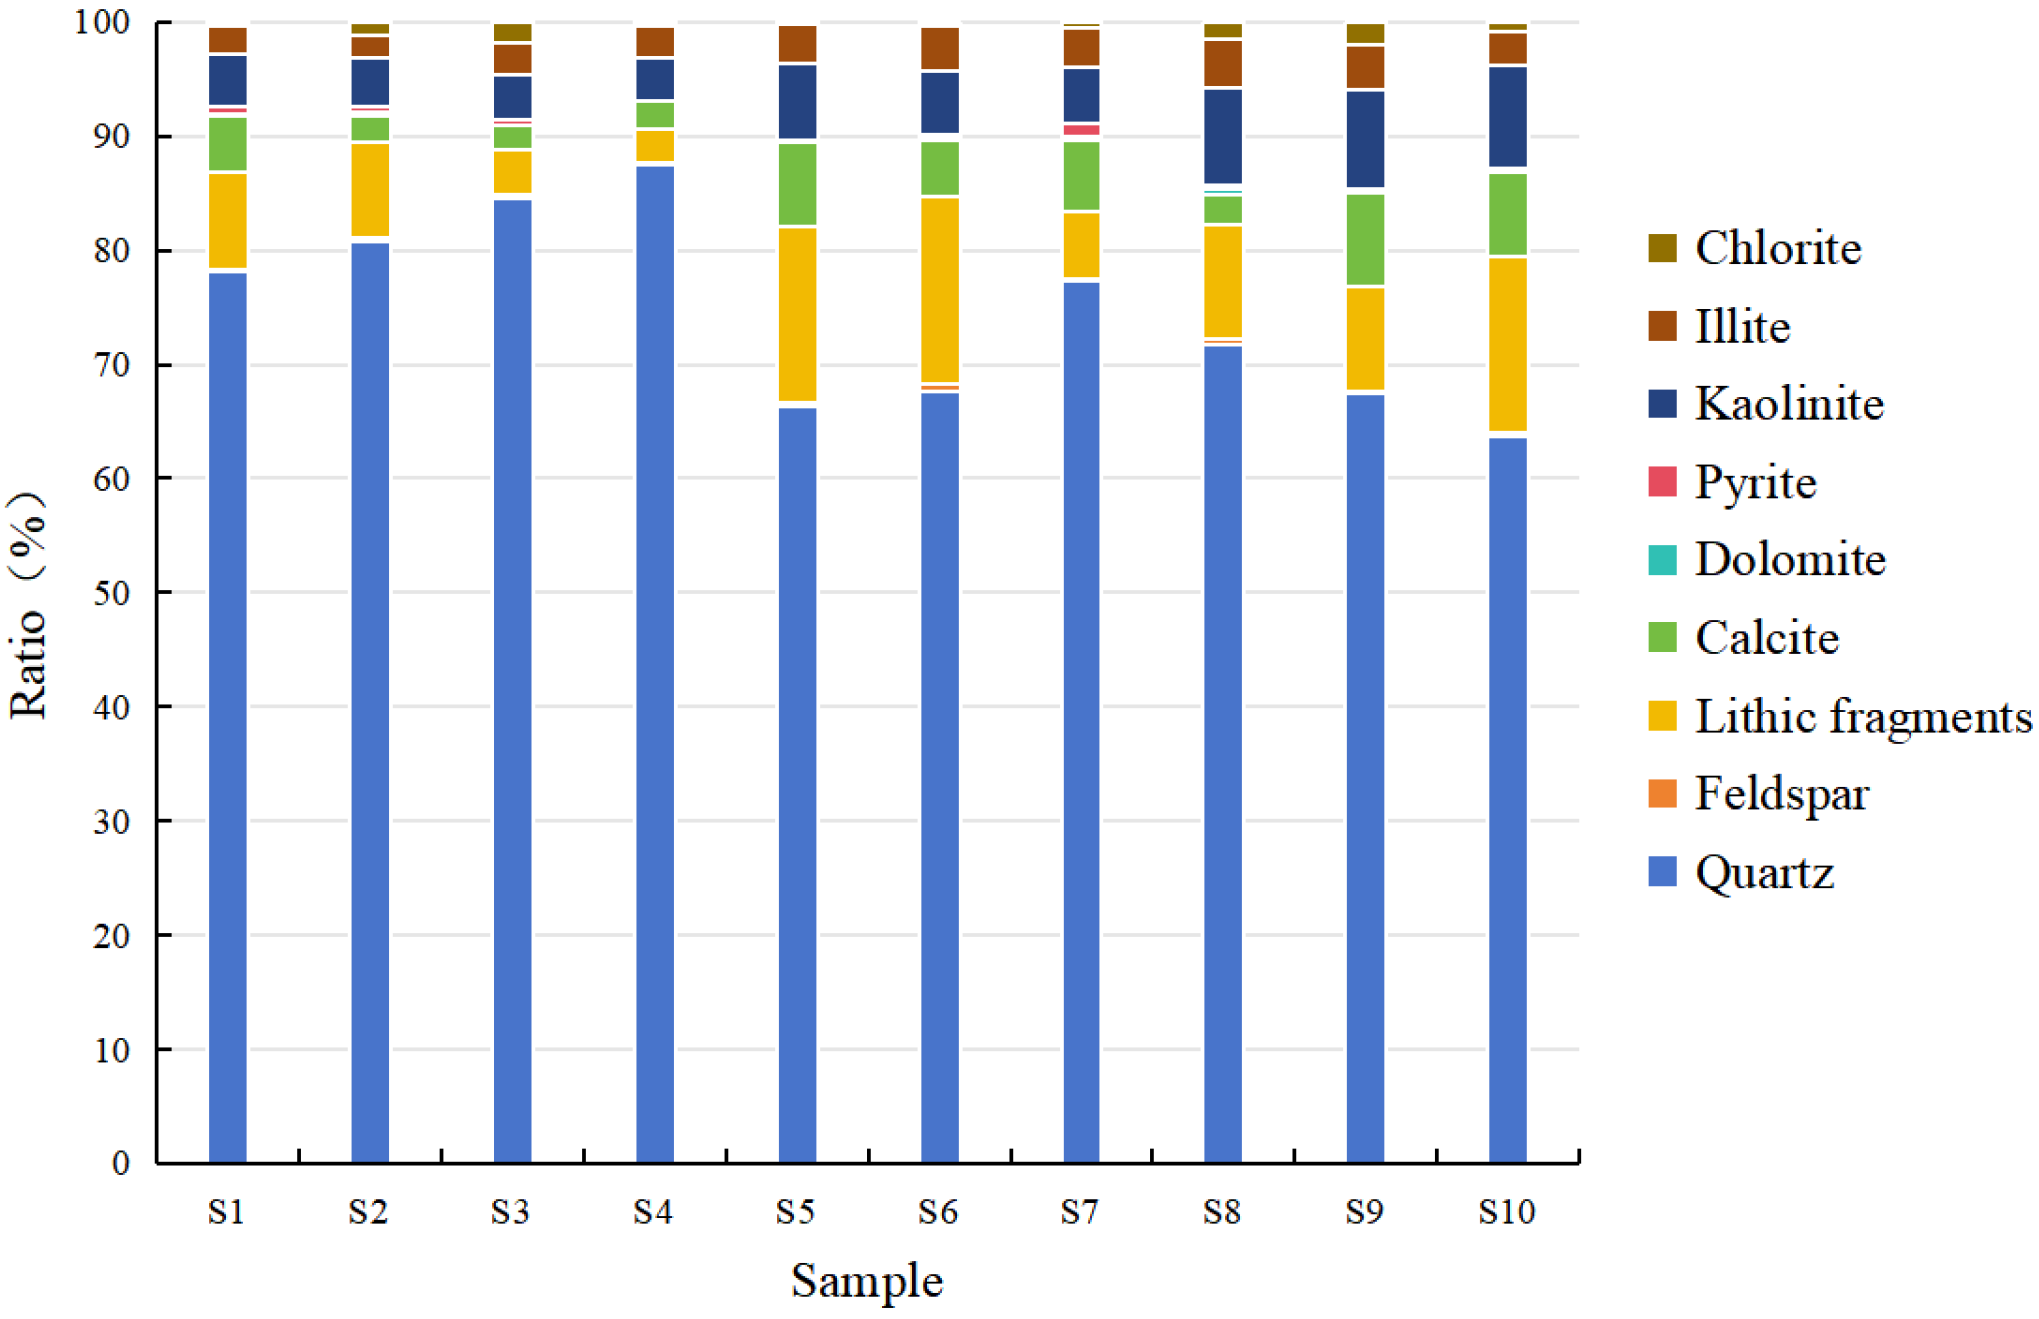
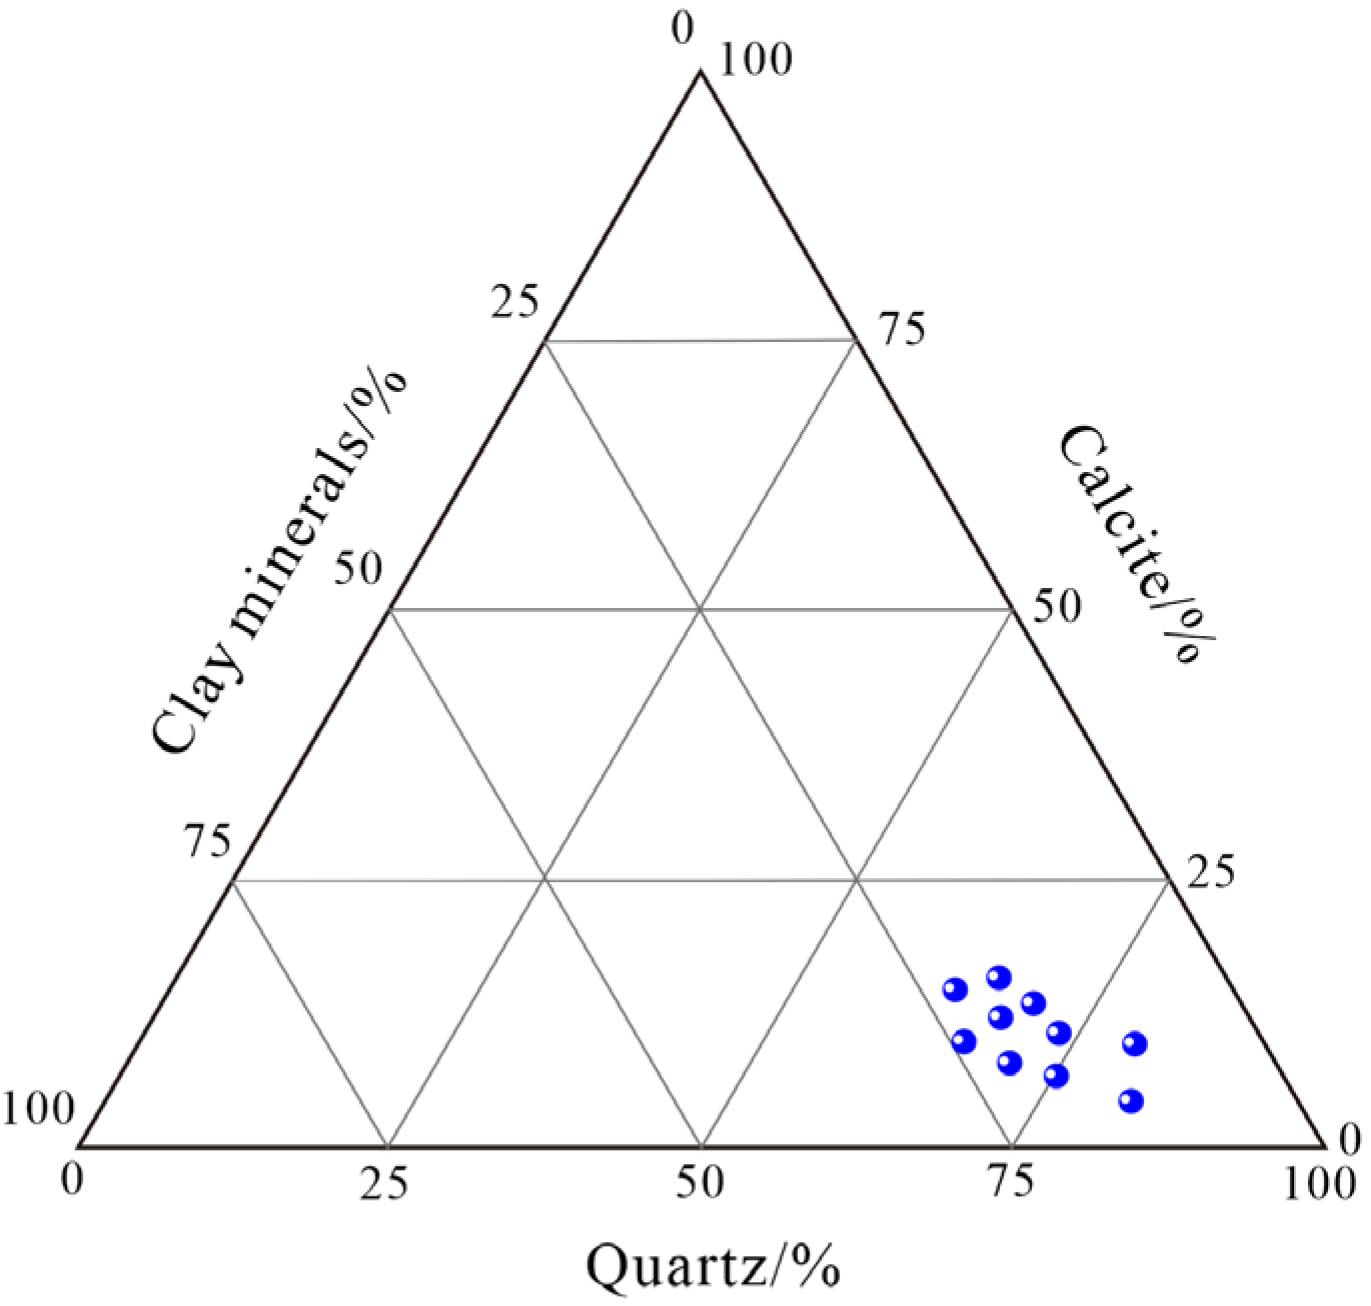
The petrological characteristics of the Benxi Formation in the study area can be determined through testing (Table 2). The dominant minerals are quartz, clay minerals, rock fragments and calcite, while feldspar content is relatively minor (Figure 3). The average content of quartz in all samples is 74.5%, accounting for the main part of the mineral composition (Figure 4). The variation in quartz content is relatively small. The average content of clay minerals is 10.1%. Clay minerals remain stable throughout the samples, primarily comprising kaolinite (64.68%), illite (25.56%), and chlorite (9.76%), suggesting a distinctly high kaolinite concentration. The average content of rock fragments was 9.7%. The variation in rock fragment content is also relatively small. The average calcite content was 4.8%, among which the rock sample had the highest S9 content (8.2%), while the rock sample had the lowest S2 and S3 contents (2.2%). The calcite content also shows relatively small variations.

3.2. Reservoir Pore Structure Characteristics

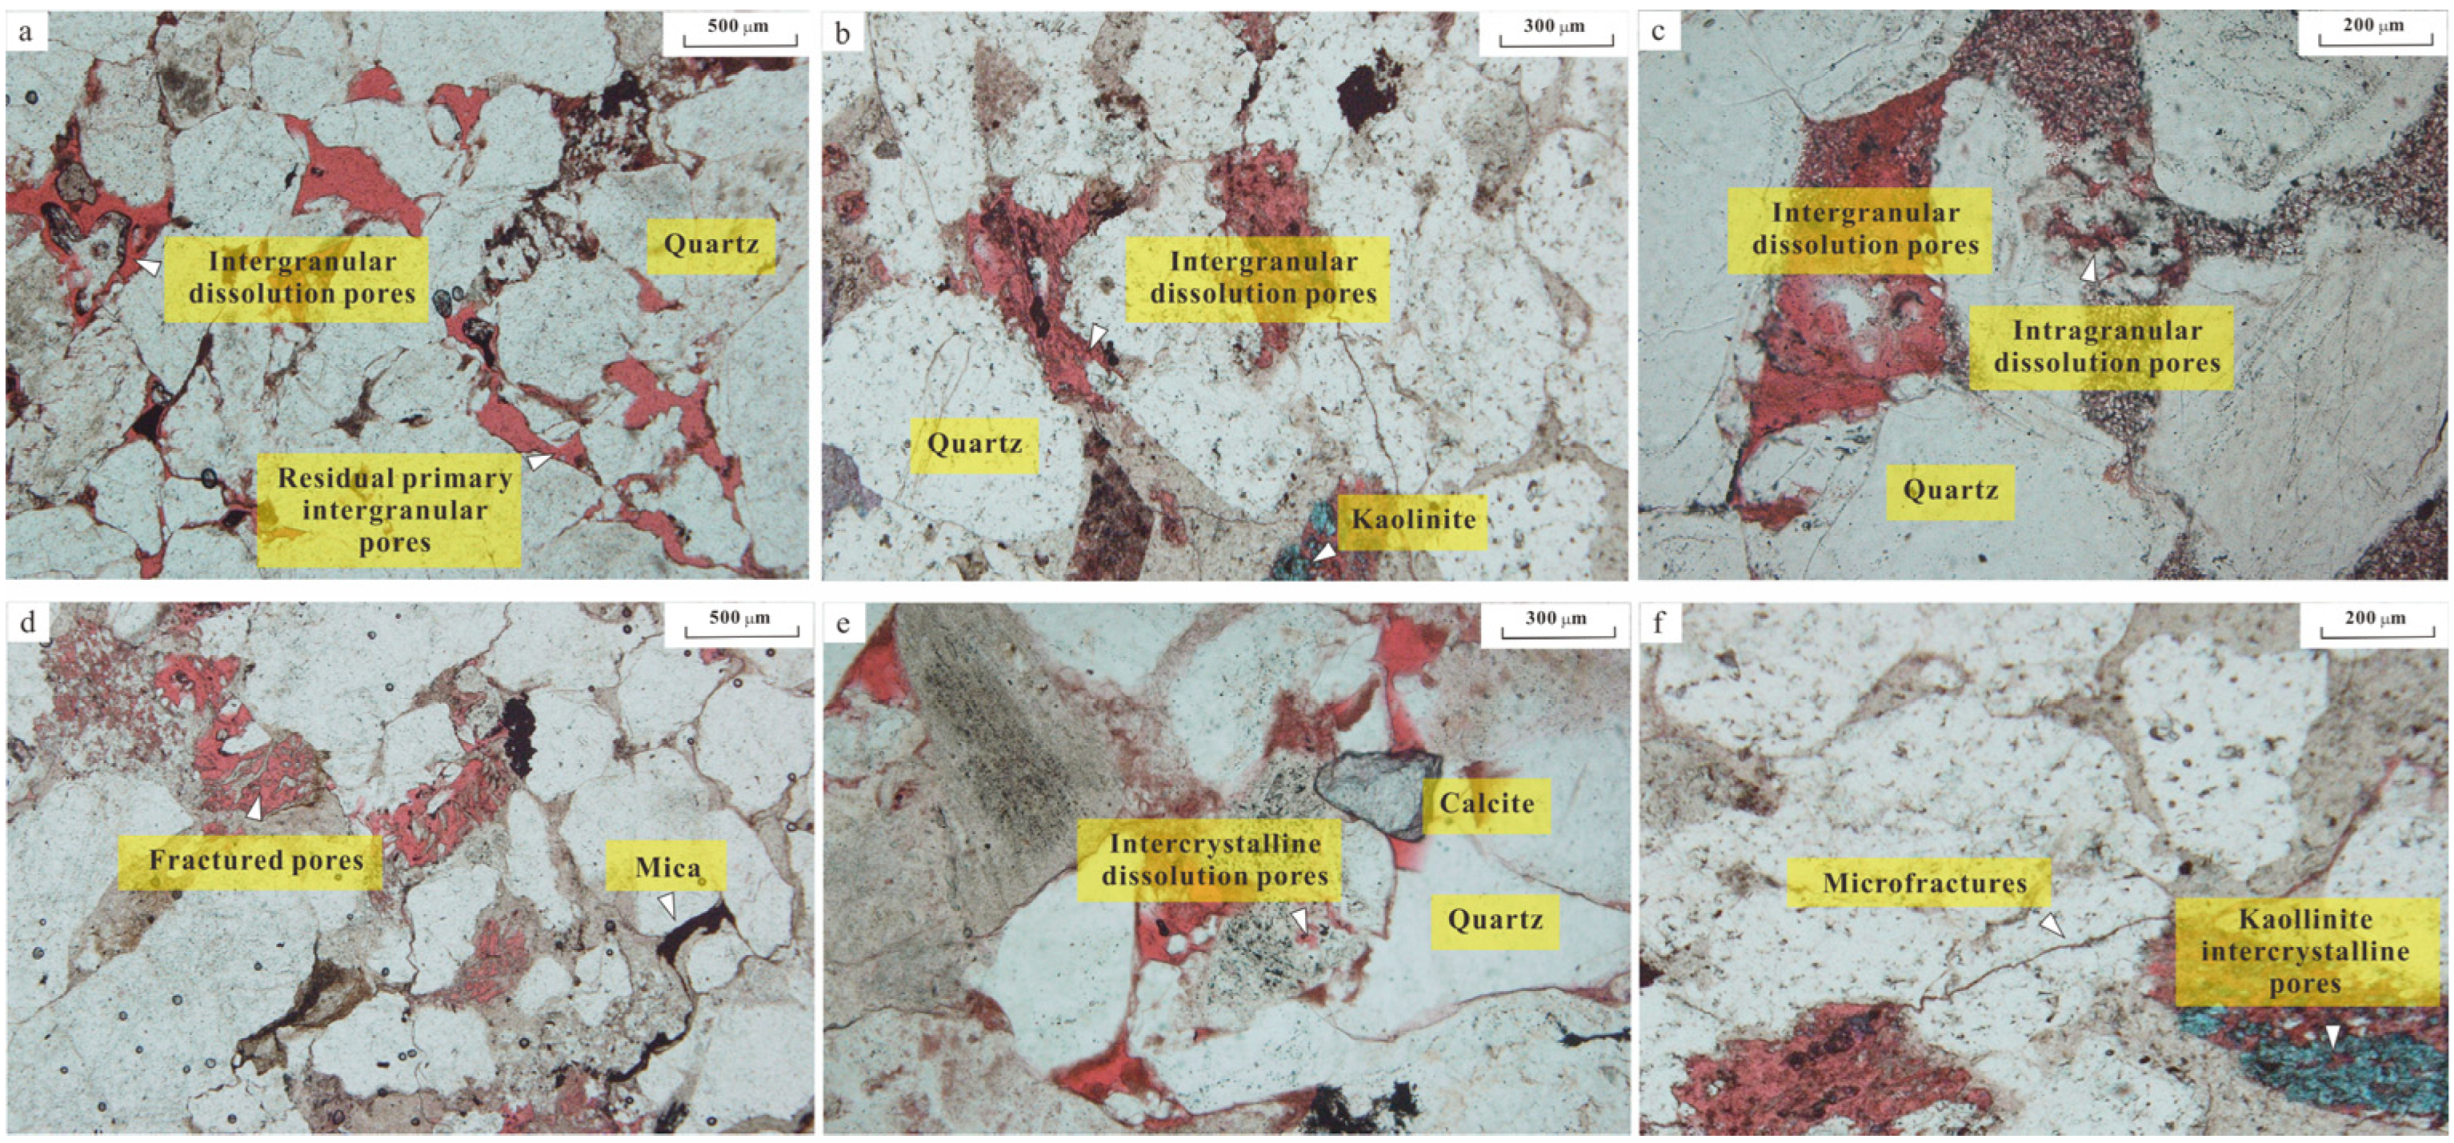
Cast-thin-section petrography and SEM imaging indicate that reservoir pores in the Benxi Formation can be grouped by genesis into three classes: primary pores, secondary pores, and microfractures. The geometric shapes of primary pores are mostly irregular polygons or nearly circles (Figure 5a), mainly controlled by the intensity of compaction, sediment grain size, sortability, roundness and sedimentary environment. Intergranular dissolution pores are predominantly secondary pores that originate from the dissolution and enlargement of primary intergranular pores, or from newly formed intergranular spaces following the complete removal of cementing materials. These are mostly in the shape of a harbor, a honeycomb or an irregular pattern (Figure 5a,b), and their distribution is controlled by the original sedimentary structure. Intragranular dissolution pores, by contrast, develop within mineral grains and are typically generated through variable degrees of corrosion affecting quartz, lithic fragments, and related components, and are mostly sieve-like or honeycomb-like (Figure 5c,d). The intercrystalline dissolution pores are mainly tiny pores between or within crystals, commonly found between kaolinite cements, presenting a grid-like pattern (Figure 5e). The microfractures are fracture systems at the micrometer scale, presenting as linear or serrated patterns on the plane (Figure 5f). They can significantly improve pore connectivity and serve as important storage spaces and migration channels for hydrocarbons.

3.3. Characteristics of Reservoir Pore Network

3.3.1. Pore Network in PMI Analysis

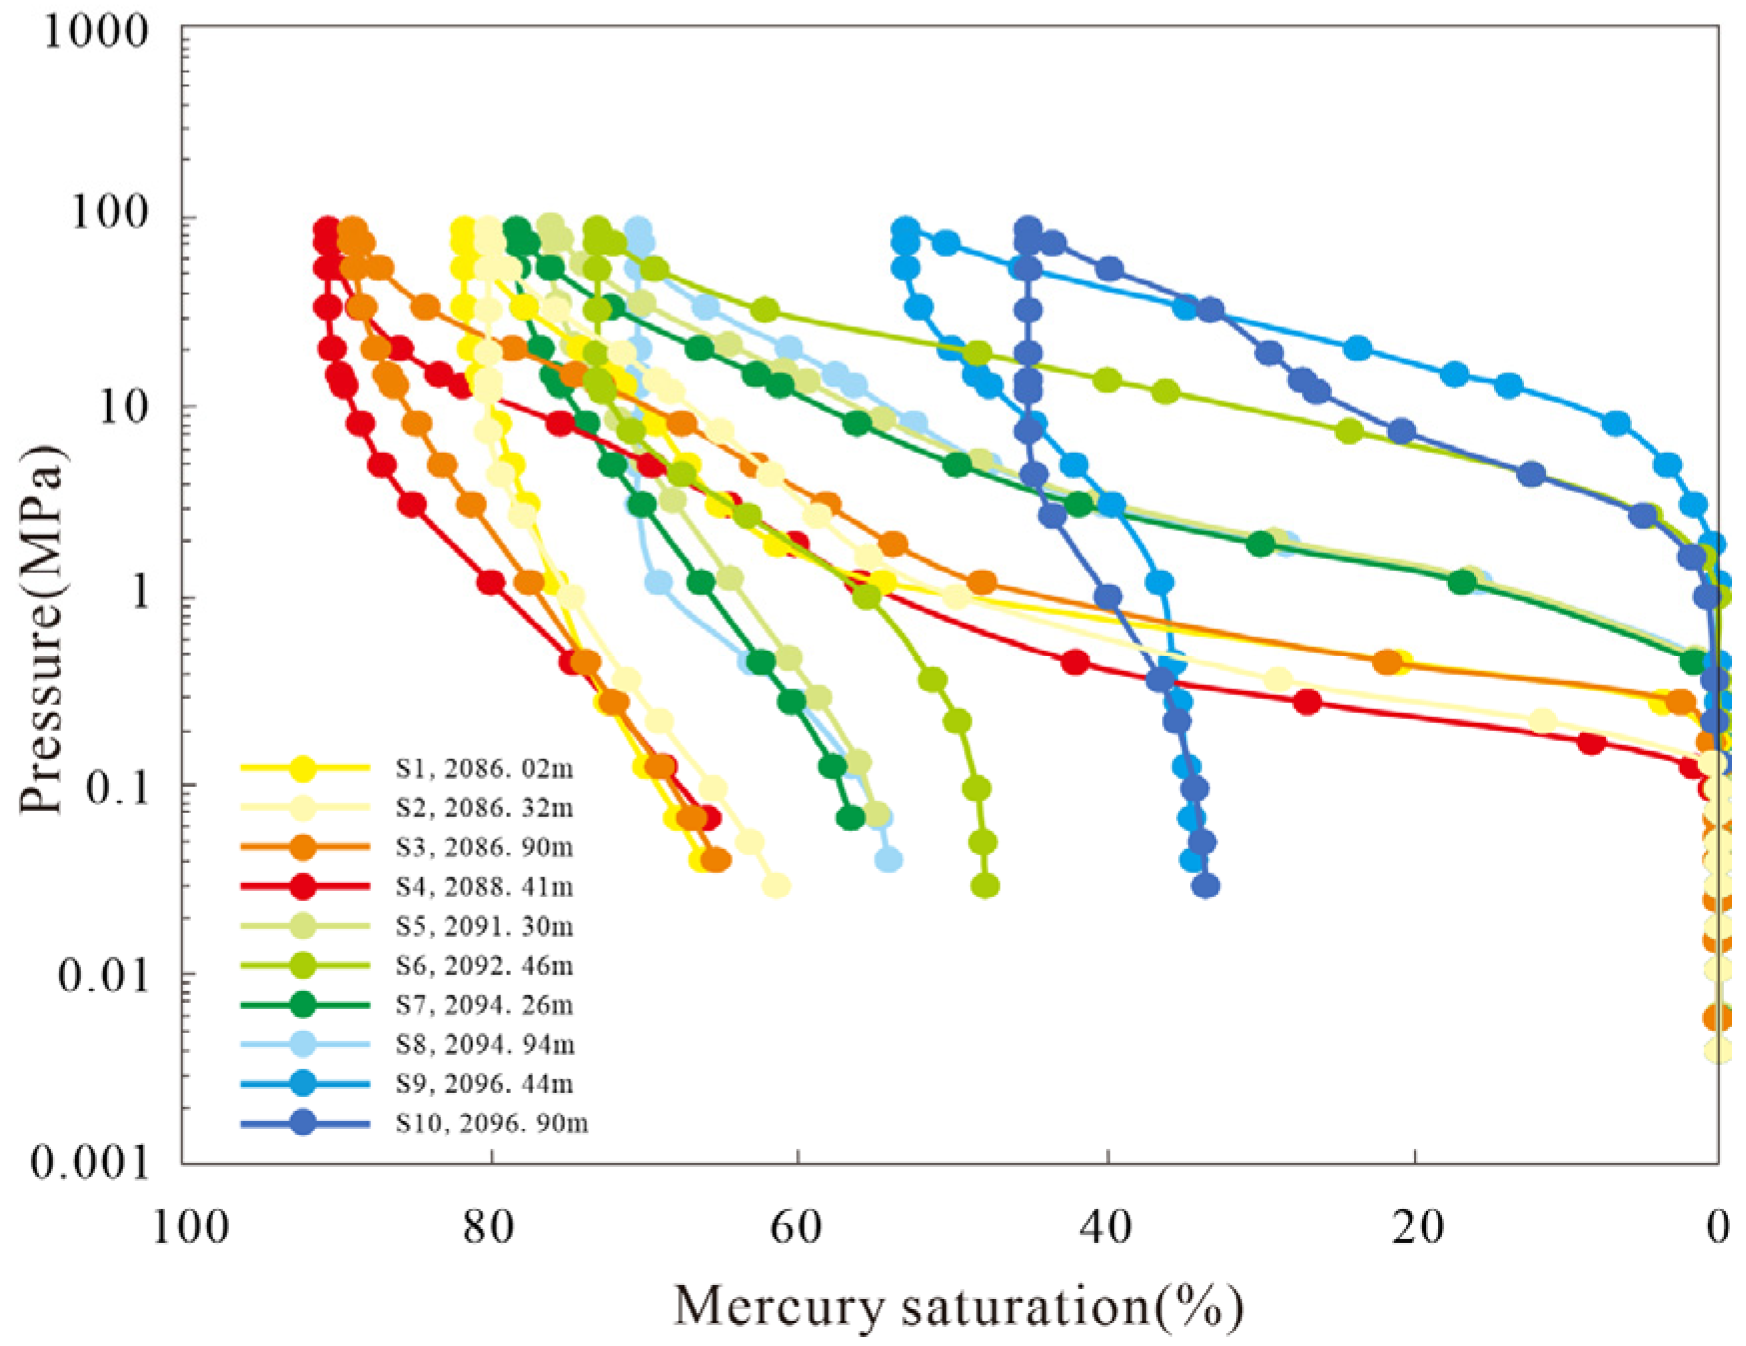
Pressure-controlled mercury injection (PMI) serves not only to determine pore size distributions but also to elucidate the connectivity and seepage properties of pore networks [34]. Capillary pressure curves exhibit considerable variation among samples (Figure 6). Based on curve morphology and displacement pressure characteristics (Figure 6, Table 3), the pore networks of tight sandstones can be classified into three categories—Classes I, II, and III—to assess their network connectivity and reservoir effectiveness. Class I samples (S3, S4) display displacement pressures below 0.7 MPa, median pore-throat radiuses greater than 0.3 um, and maximum intrusion mercury saturation values exceeding 81%. Their curves feature long, smooth sections, corresponding to favorable reservoir quality and connectivity. Class II samples (e.g., S1 and S5, totaling six samples) show displacement pressures of 0.7~1.0 MPa, median pore-throat radiuses of 0.1~0.3 um, and maximum intrusion mercury saturation levels between 72% and 81%, indicating that the reservoir performance was acceptable but the connectivity decreased. Class III samples (S9, S10) exhibit displacement pressures above 1.0 MPa, median pore-throat radiuses from 0.01 to 0.1 um, and maximum intrusion mercury saturation between 62% and 72%. Their steep curves reflect poor pore connectivity and weak reservoir potential. These variations confirm pronounced heterogeneity in pore-throat structures among the analyzed samples.

3.3.2. Pore Networks Scanned by NMR and CT

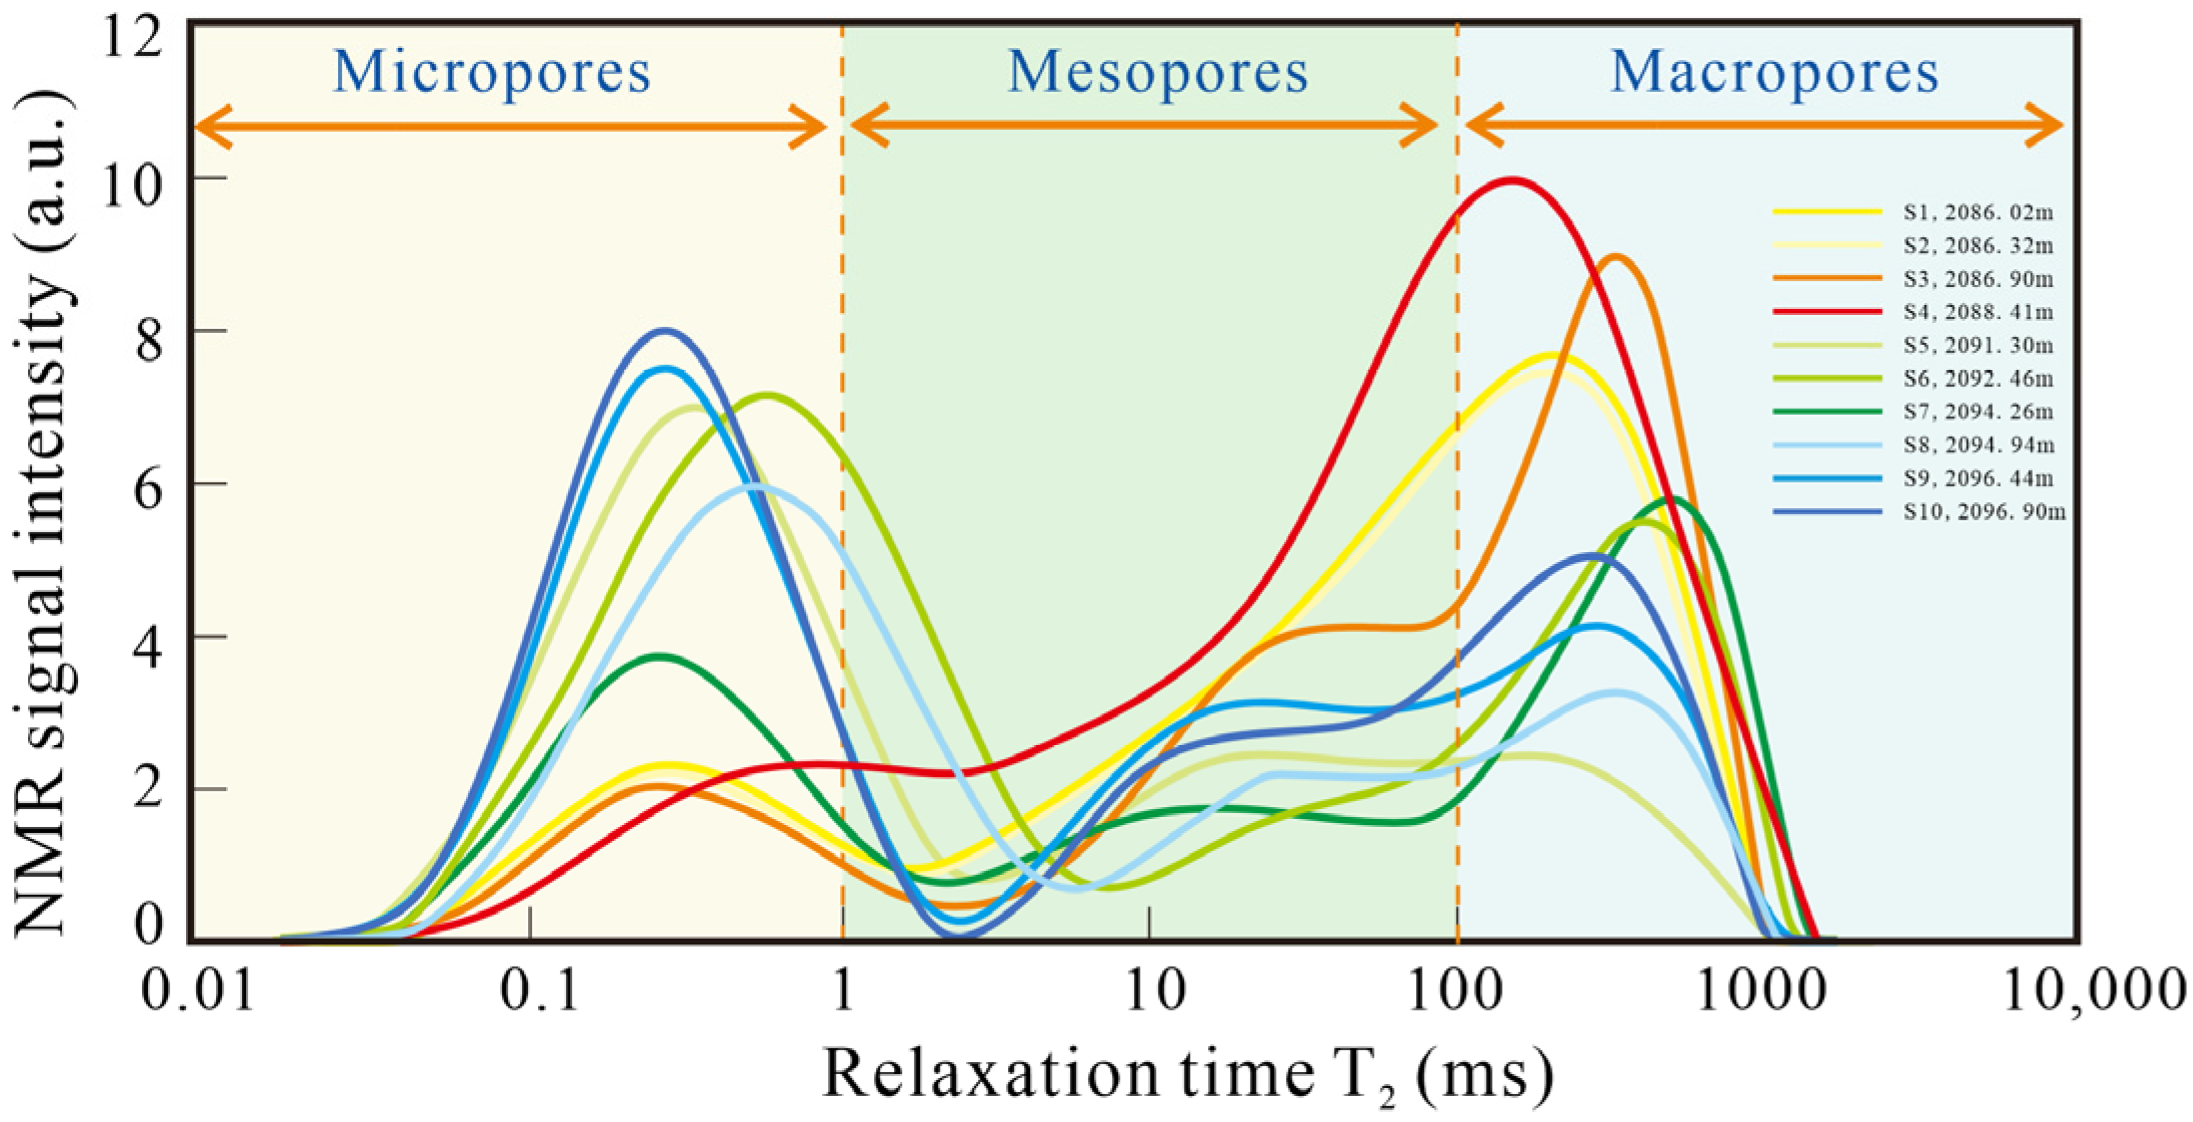
Figure 7 shows that the NMR T2 spectrum of the tight sandstone in the study area shows a bimodal distribution, which divides the NMR T2 spectrum into three types. In Class I, the left peak (corresponding to micropores) is significantly lower than the right peak (corresponding to macropores), represented by samples S3 and S4, indicating that the tight sandstone samples are mainly dominated by macropores and microfractures. The heights of the left and right peaks of Class II are similar, represented by S5 and S6 samples, indicating that the samples are mainly dominated by macropores and micropores. The left peak of Class III is more prominent than the right peak, as observed in samples S9 and S10, suggesting that these samples are predominantly micropores. This classification aligns with the pore structure categorization based on PMI analysis. Moving from Class I to Class III, the saturation of the moving fluid decreases from 56.92% to 28.63%, while the bound water saturation increases from 48.16% to 71.37% (Table 4). These features collectively suggest increased pore structural complexity accompanied by a decline in reservoir physical performance. Variations in pore size distribution and pore volume therefore provide important evidence for understanding the heterogeneity of tight sandstone pore systems, which is crucial for understanding their potential as a reservoir.
Based on the NMR signals of the residual fluids after centrifugation, typical experimental results of three types of nuclear magnetic resonance were obtained, namely the right-biased bimodal type, bimodal type, and left-biased bimodal type (Figure 8). It can be seen that the calculation range of porosity based on nuclear magnetic resonance is from 0.8% to 7.1%, which is highly consistent with the range values of 0.26% to 7.55% of the gas measurement porosity. This indicates that all relaxation signals can be captured within the current echo interval. And the typical experimental results of the three types of nuclear magnetic resonance have T2 cutoff values of 11.29, 5.49, and 1.92, respectively. The T2 cutoff value is an important indicator for identifying bound water and flowing water. It can be seen that the percentage of flowing water in the right-biased bimodal type is the highest, while the percentage of flowing water in the left-biased bimodal type is the lowest.
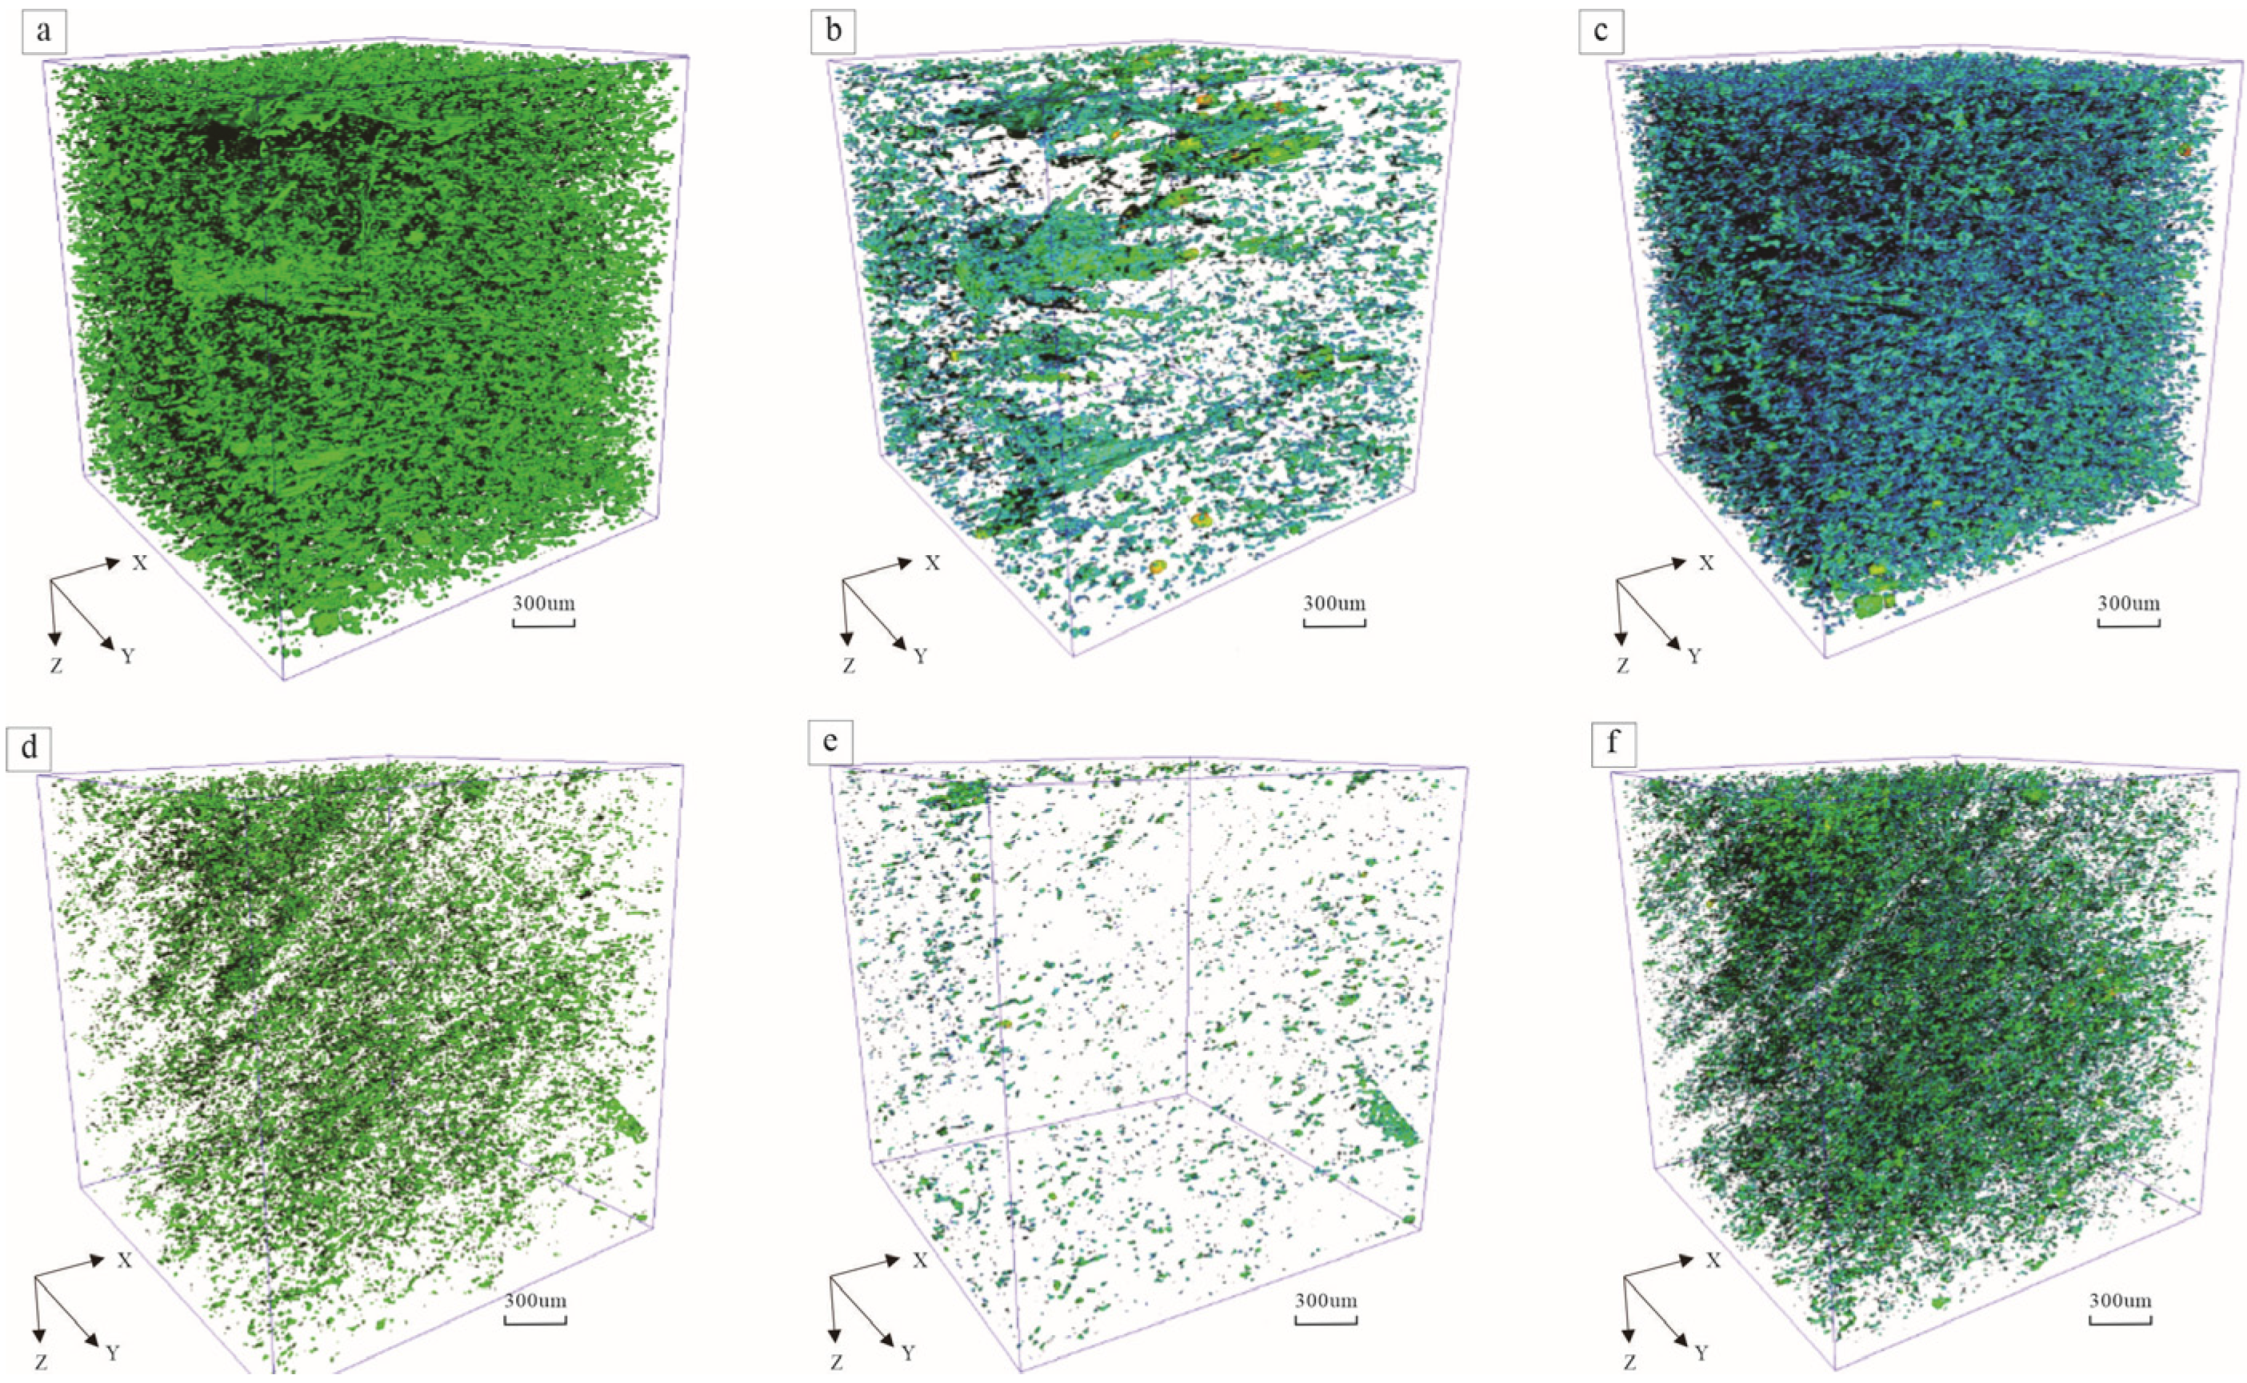
To deeply characterize the pore-throat features and visually present the three-dimensional distribution of pore structure, CTS was conducted on typical samples S4 and S8 based on the NMR test results (Figure 9). This indicates that the pore structure is composed of isolated pores and connected pores. Representative tight sandstone specimens from the study area exhibit pronounced variability in pore-throat dimensions and spatial arrangements (Figure 9a,d). Different-colored labels represent the pore-throat volume (Figure 9b,c,e,f). As the color changes from red to yellowish green, the pore volume decreases. In typical S8 samples with low quartz content, the pore space volume covered by the monochrome label is very large (Figure 9e,f). However, in images of S4 samples with high quartz content, multicolored labels exhibited intermixing, and the pore volume delineated by any single-color label was reduced, indicating that the S4 samples had better pore-throat connectivity (Figure 9b,c). A large number of isolated pores are widely distributed in the S8 sample. In addition, some extremely narrow pore-throat spaces are rarely injected into PMI experiments and make a certain contribution to permeability. In contrast, the isolated pore space existing in the S4 sample is smaller. By comparing Figure 9b,e, it can be found that the volume of the connecting holes of sample S4 is much larger than that of sample S8. Large areas of interconnected pores are beneficial to the quality of hydrocarbon reservoirs.

3.4. Single Fractal Characteristics

Prior studies show that the fractal dimensions can reflect the distribution heterogeneity of pore throats, and several methods have been promoted to calculate fractal dimension via RMI or PMI results [35]. The fractal dimension can be obtained by calculating the T2 spectral data obtained from the nuclear magnetic resonance experiment using formula (2).
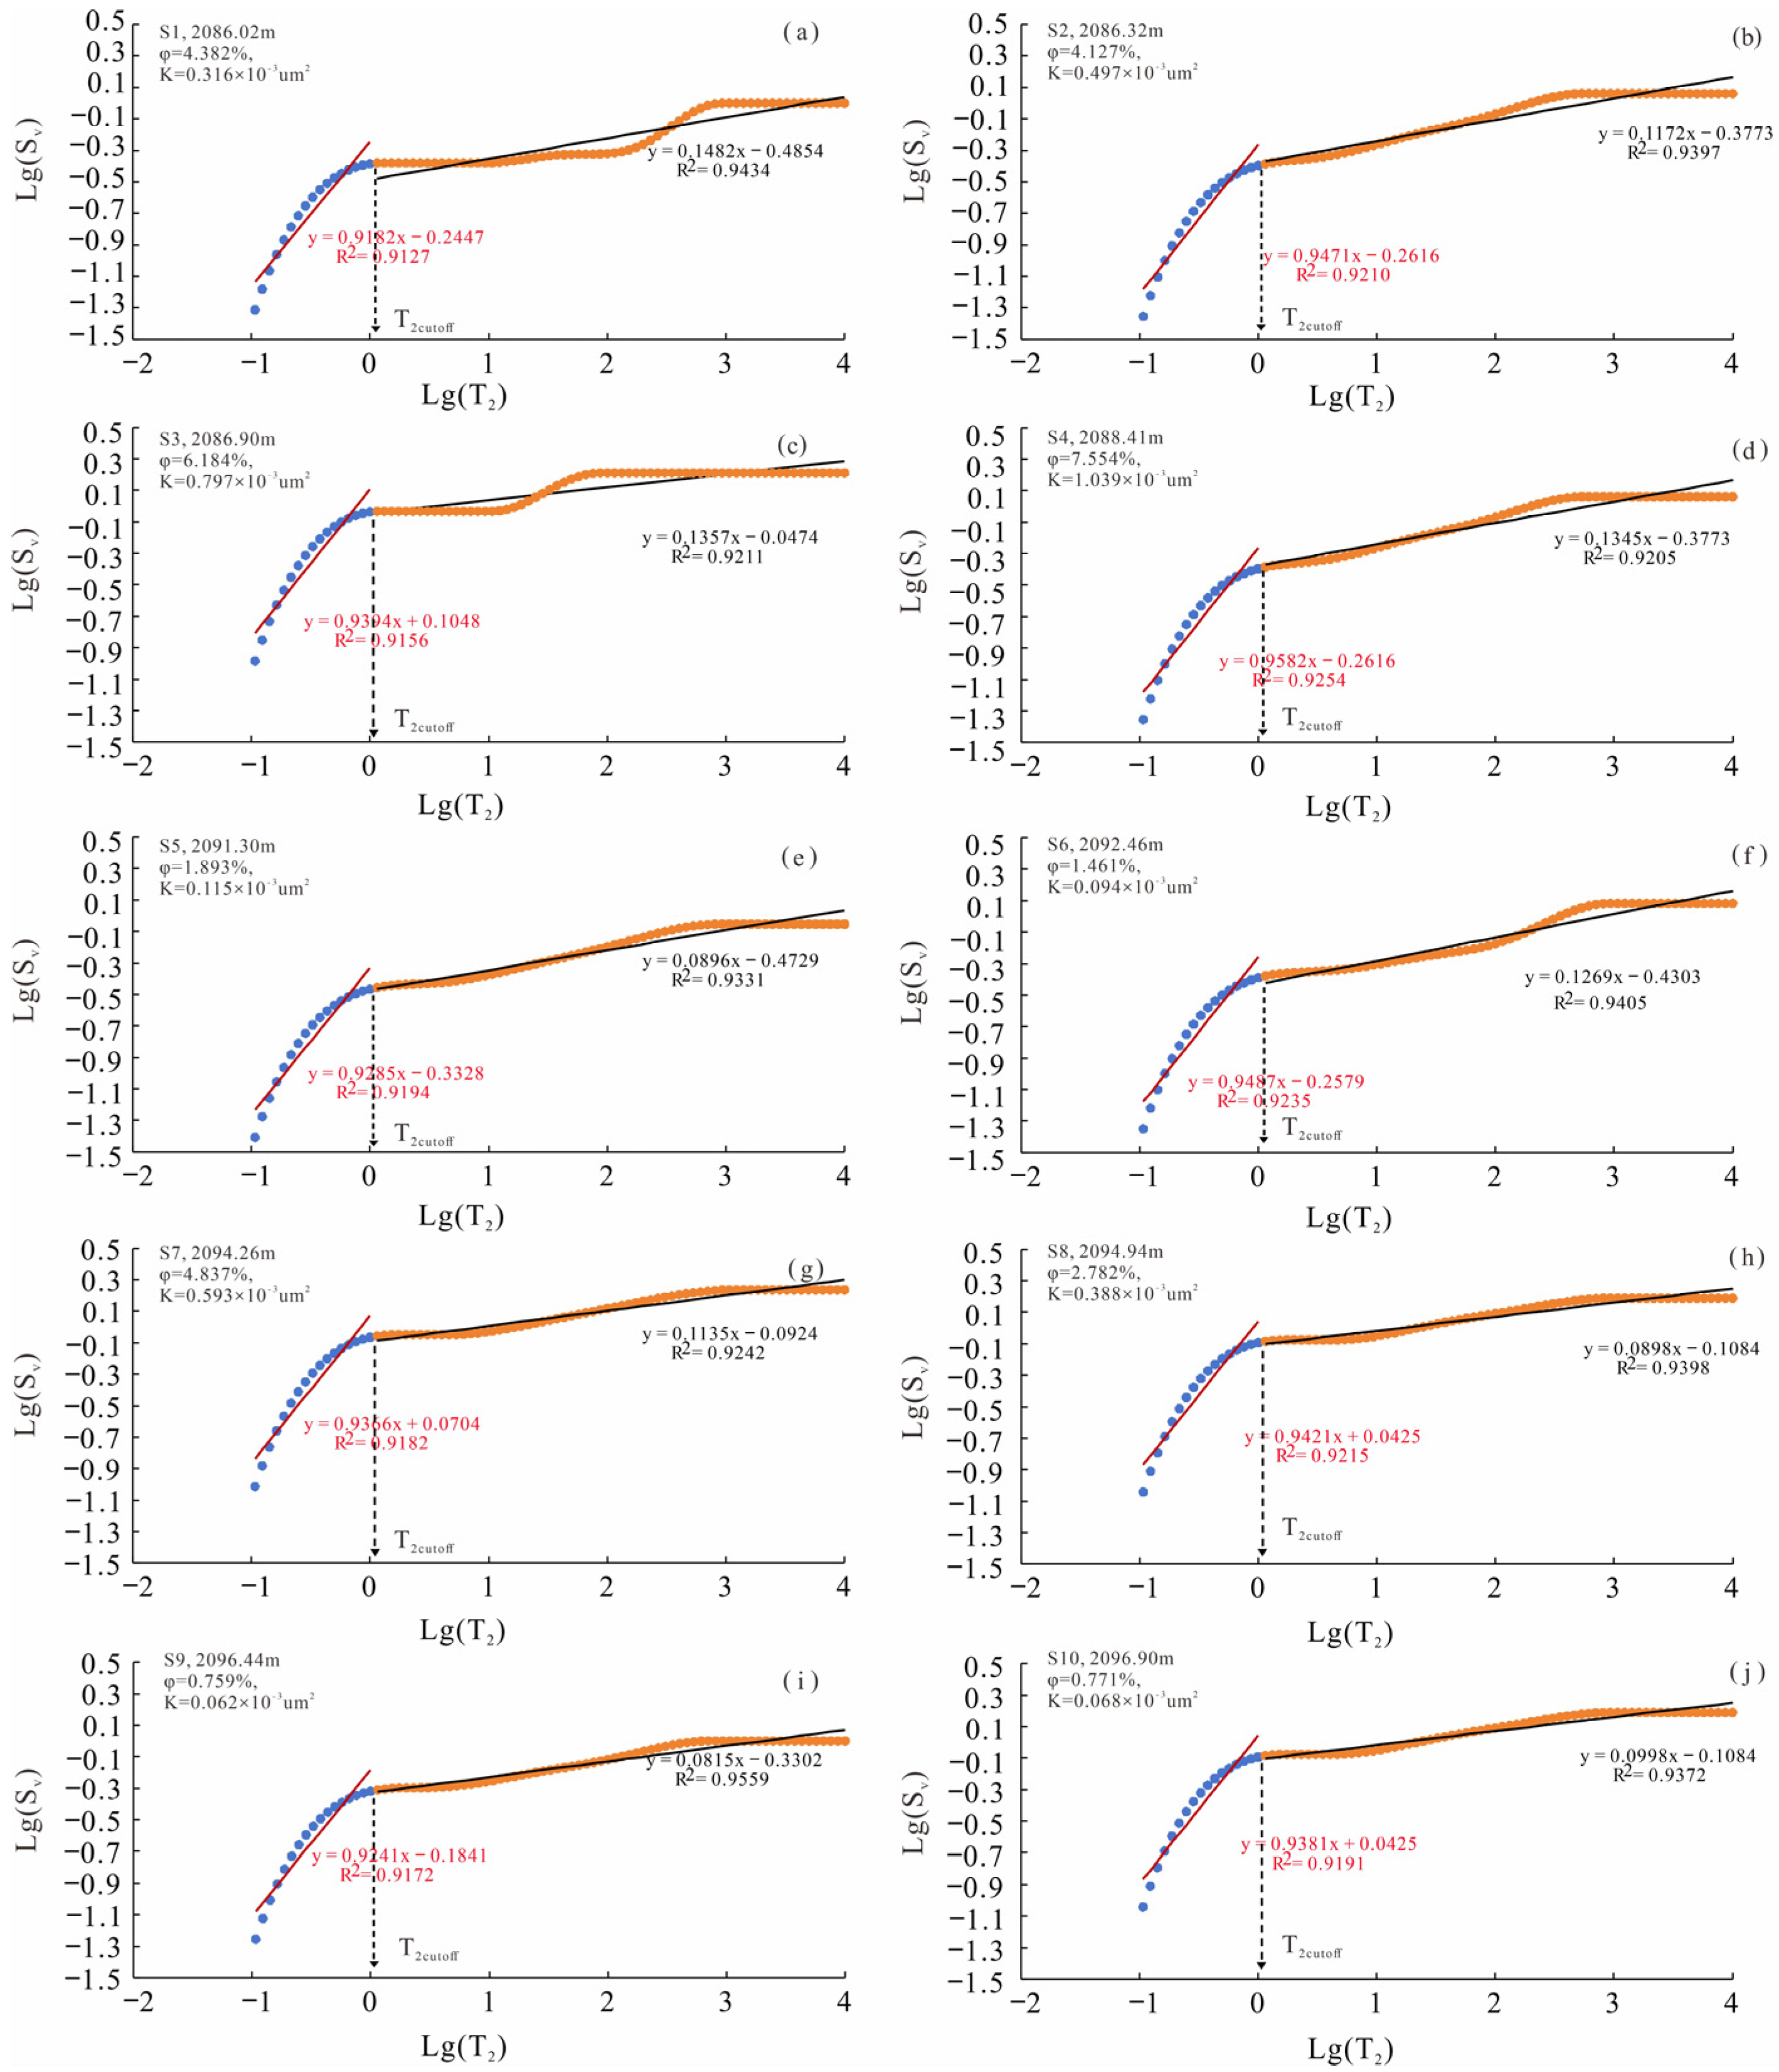
A single fractal feature analysis of the sample was conducted using nuclear magnetic resonance (Table 4). Figure 10 shows that the lg(Sv)-lg(T2) relationship curve turns at the T2 cutoff value, presenting typical bifractal characteristics: The segment located to the right of the inflection point (orange) corresponds to residual primary intergranular pores, intergranular dissolution pores, and microfractures characterized by longer T2 relaxation times, which mainly host movable fluids. In contrast, the left segment (blue) represents intercrystalline micropores and intragranular dissolution pores with shorter T2 responses, where fluids are predominantly bound. Through piecewise linear fitting, the fractal dimensions of small pores Ds (0.1877~0.2009) and large pores Dl (2.8518~2.9185, with an average of 2.8863) were obtained, respectively. Moreover, Dl exceeded Ds in all specimens.

4. Discussion

4.1. Fractal Dimensions, Physical Properties and Microstructure Parameters

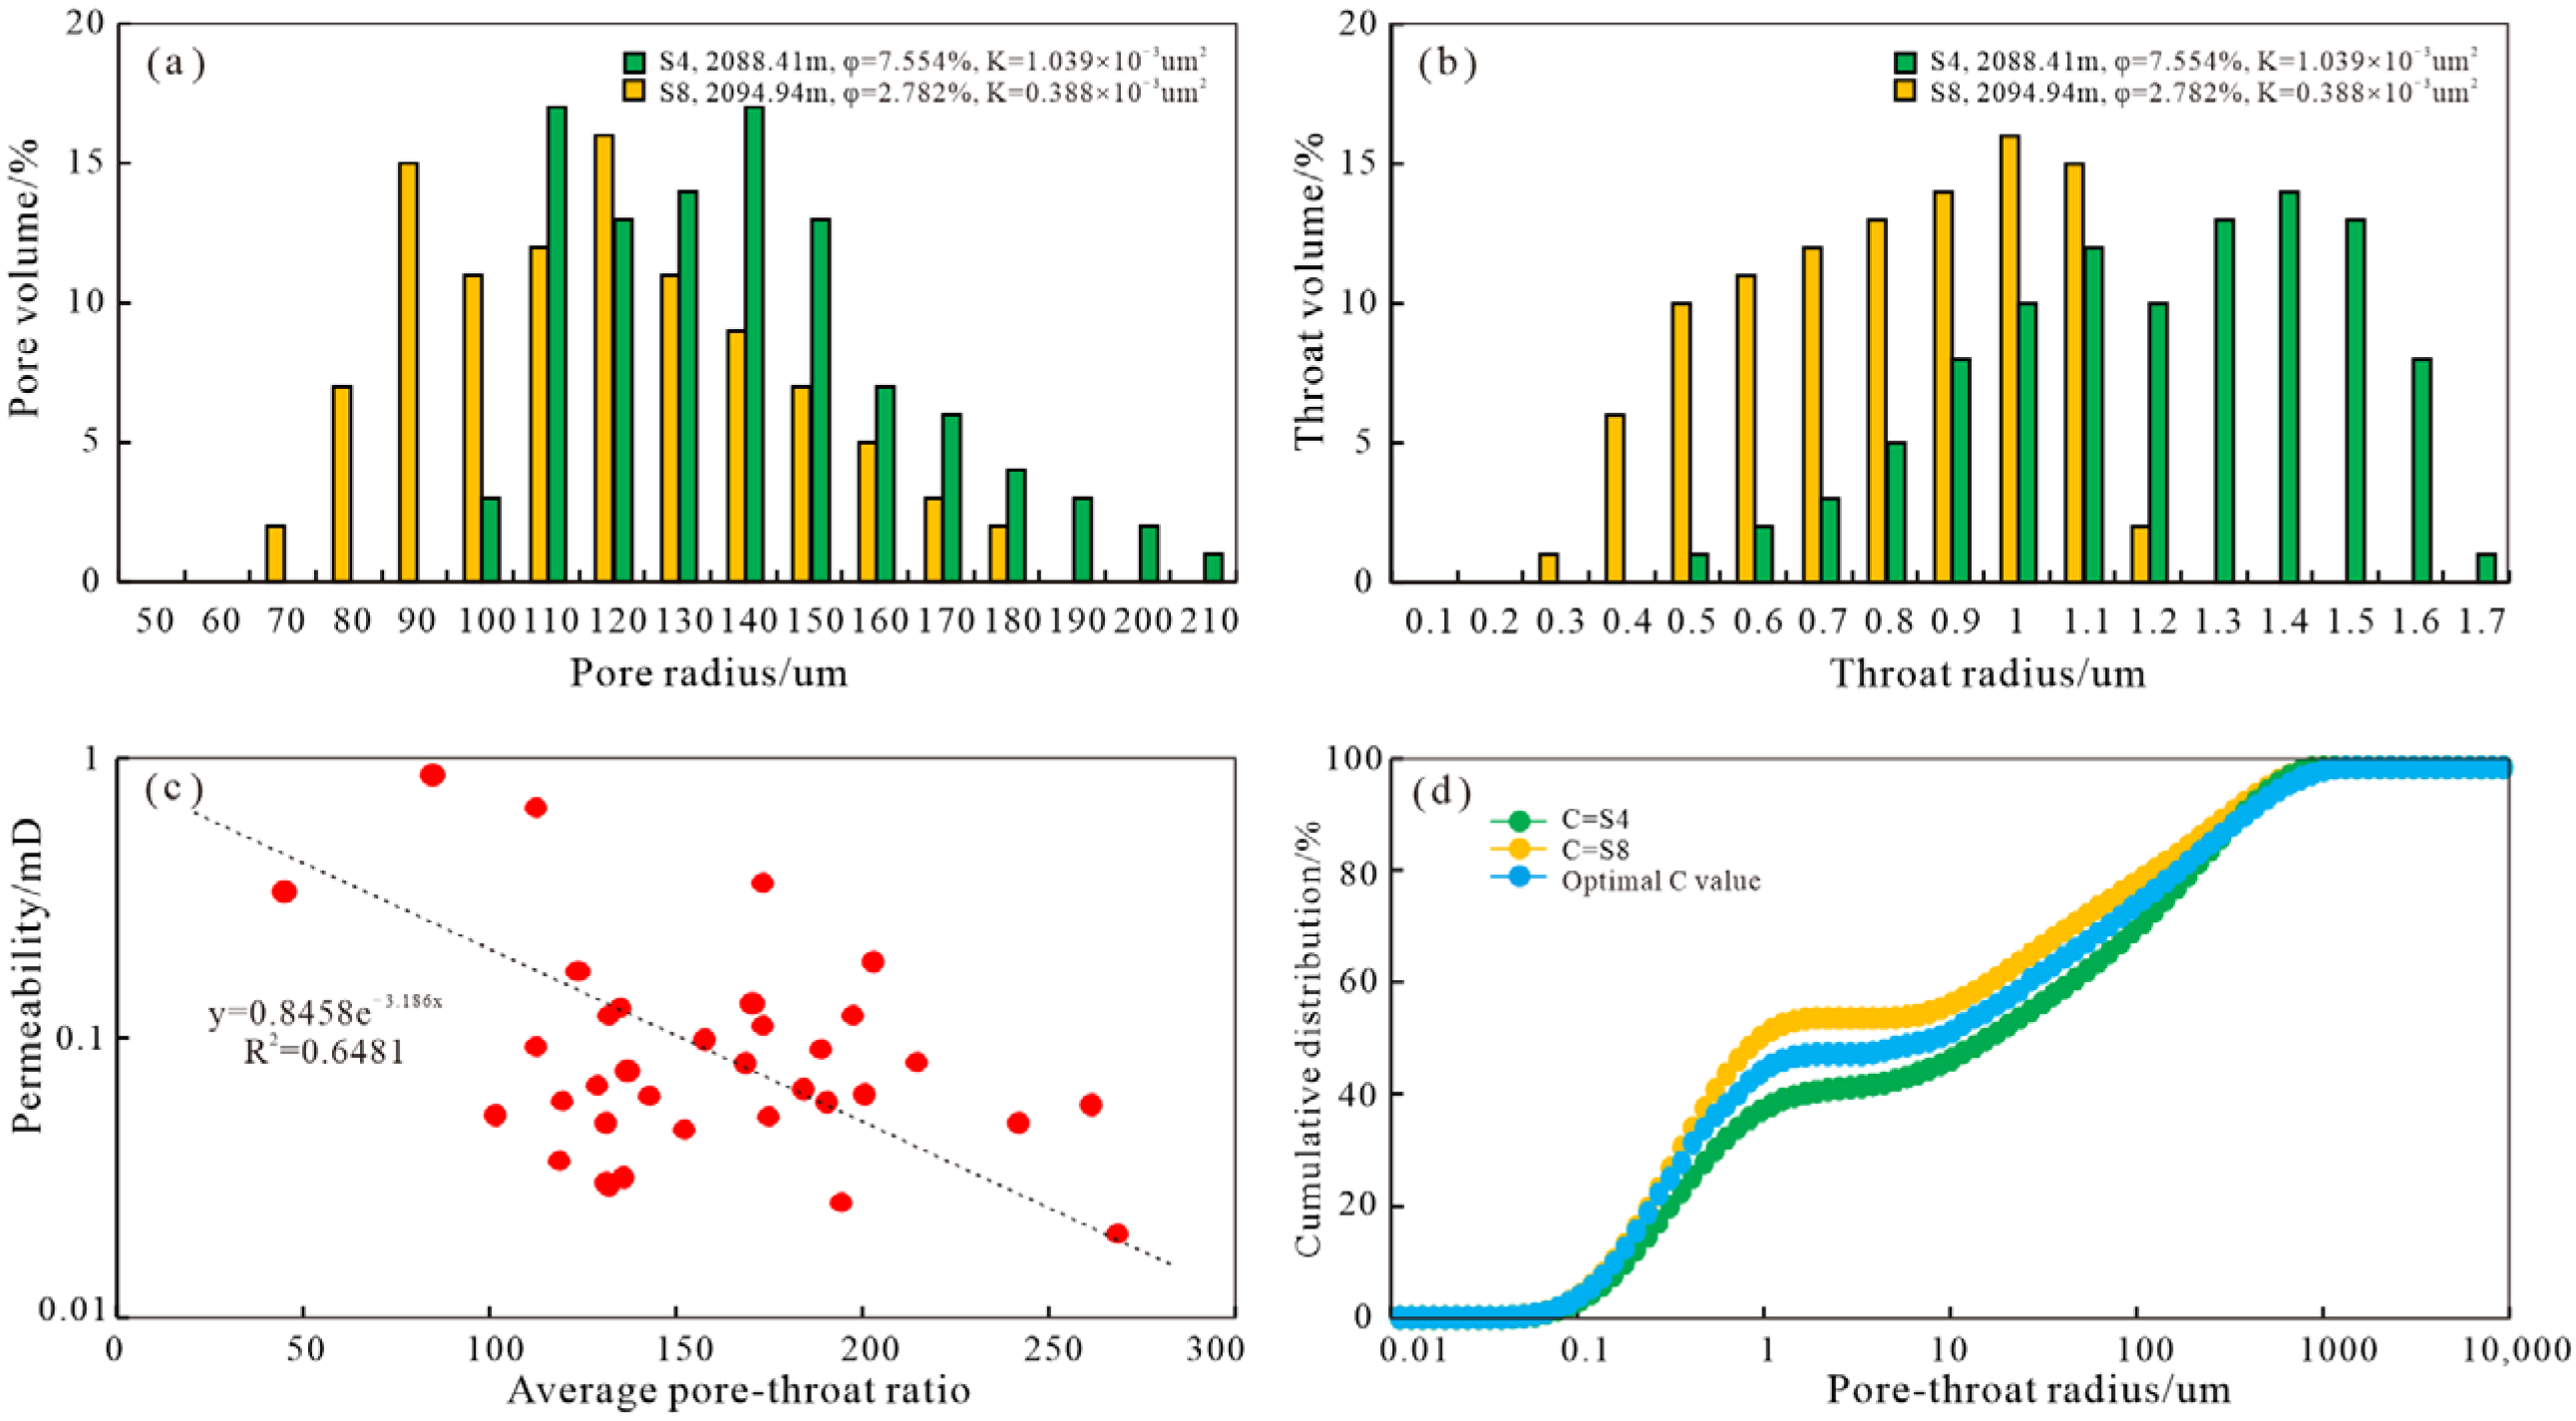
The pore radius range and distribution of the tight sandstone with high quartz content represented by sample S4 are slightly larger than those of sample S8 (Figure 11a). Moreover, according to Figure 11b, the throat radius of sample S4 is concentrated between 1 μm and 1.6 μm, which is larger than that of sample S8 (0.5 μm~1.1 μm) (Figure 11b). Therefore, the pore radius and throat radius of sample S4 are both superior to those of sample S8.
The control of permeability by pore structure was studied through regression analysis. The average pore-throat radius in the study area is mainly concentrated between 80 and 260 (Figure 11c). The conversion factor C is established to achieve the conversion of the T2 spectrum to the pore radius distribution. This method has been verified to work well in rocks such as sandstone (Figure 11d). The obtained C value is the optimal conversion factor, thereby achieving the quantitative conversion from the relaxation time domain to the real aperture domain. Through analysis, we can see that the pore size is a key factor in controlling the quality of the reservoir.
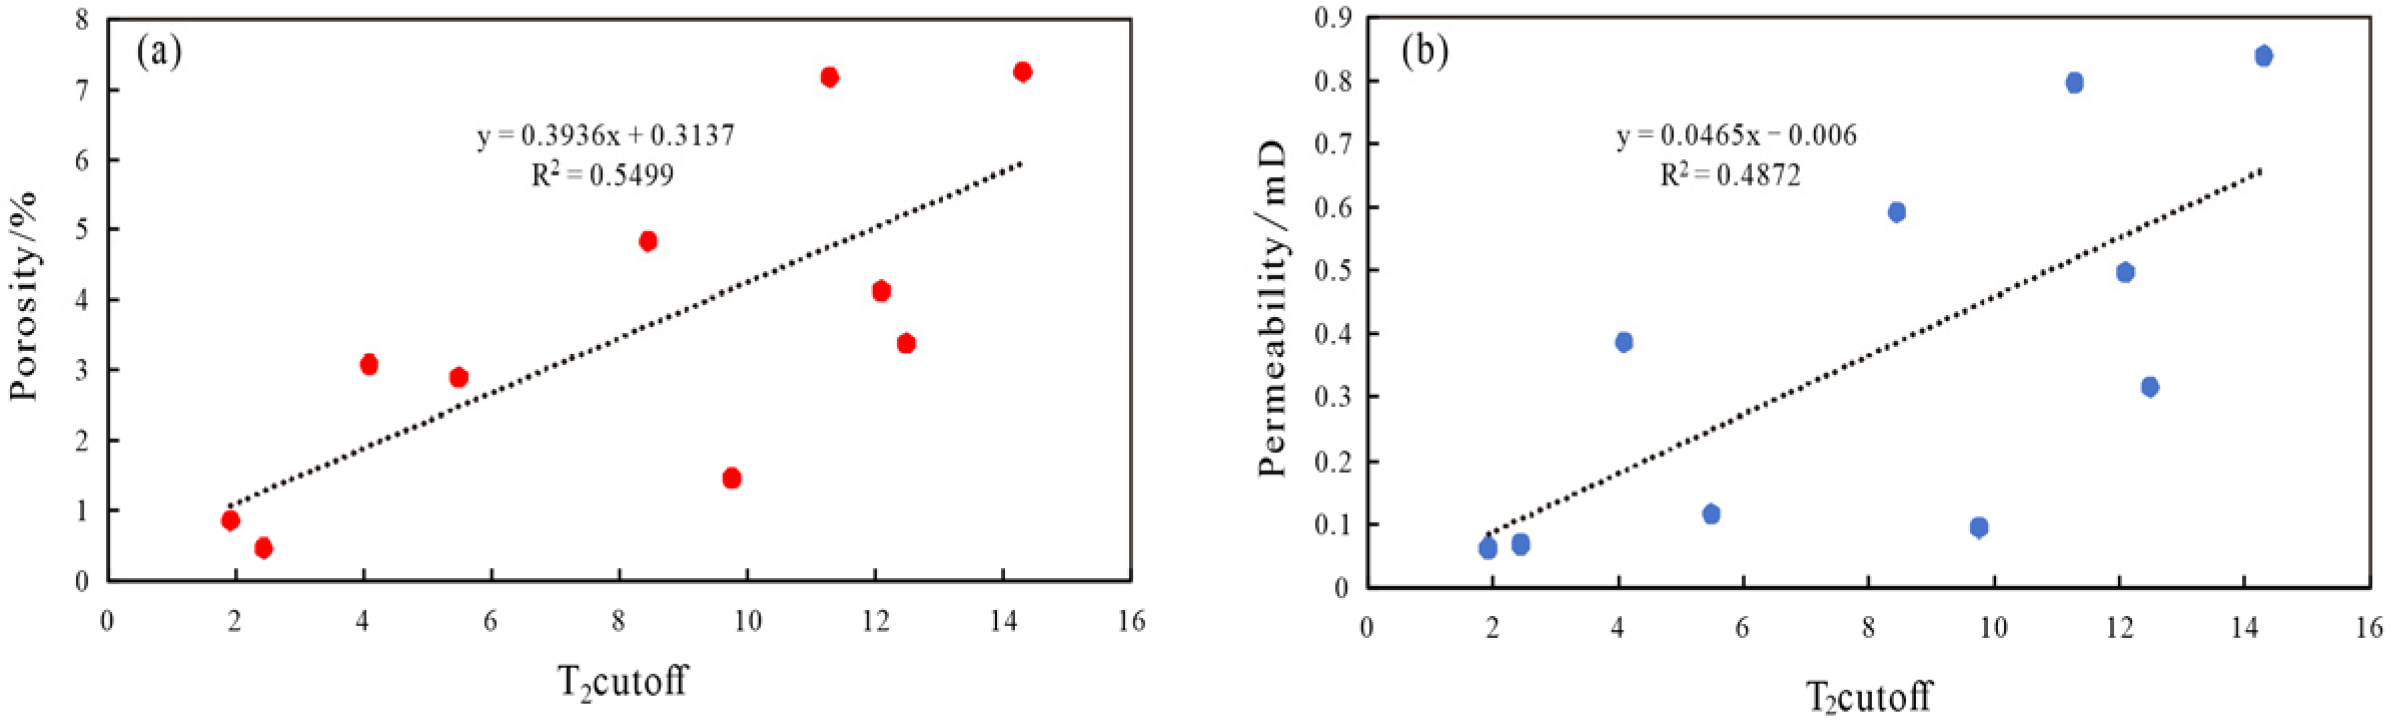
The correlation between the T2 cutoff values of 10 core samples and porosity and permeability is shown in Figure 12. There is no good correlation between the T2 cutoff values and the porosity and permeability of the core samples. Core samples with similar porosity or permeability may have significantly different T2 cutoff values, indicating that the NMR results are not only dependent on porosity and permeability, but may also be influenced by rock mineral composition, clay type and content, etc.
Reservoir porosity and permeability are strongly linked to fractal parameters [36]. We analyzed the correlation between reservoir porosity and permeability and the single fractal parameter and conducted a significance test (Table 5). Correlation analysis indicates that as Dl and Ds increase, porosity and permeability generally decrease. However, all R2 values were lower than 0.5, and all p-values were greater than 0.05, failing to reach the statistical significance level. The confidence intervals for porosity and permeability relative to Dl are [−0.9207, −0.1118] and [−0.8777, −0.1154], respectively, and relative to Ds they are [−0.8725, −0.1372] and [−0.9049, −0.0168], respectively. The ranges are relatively large. This might be due to the imprecision of the estimation with a small sample size. This makes it challenging to accurately assess the heterogeneity of the pore structure using single fractal parameters.

4.2. Multifractal Characteristics and Correlation Analysis

Multifractal theory can effectively quantify overall heterogeneity by decomposing complex pore structures into multiple self-similar subsets, providing an important means for pore structure characterization [37]. Using the nuclear magnetic resonance T2 spectrum as a basis (Figure 7), a multifractal model was applied with the moment order q ranging from −10 to 10, where D−10 and D10 correspond to the minimum and maximum multifractal dimensions, respectively. The multifractal parameters of each sample were calculated (Table 6). Dmin-Dmax and Dmin/Dmax are respectively called the symmetric multifractal difference and the symmetric multifractal dimension ratio. When the q value is positive, the pore probability Pi(ε) in the tight area is larger, and the dimension quantity quantifies the behavior of the tight area. Conversely, when the q value is negative, the pore probability Pi(ε) in the sparse area is larger, and the dimension quantity quantifies the behavior of the sparse area.

4.2.1. Correlation Between Physical Parameters and Multifractal Dimensions

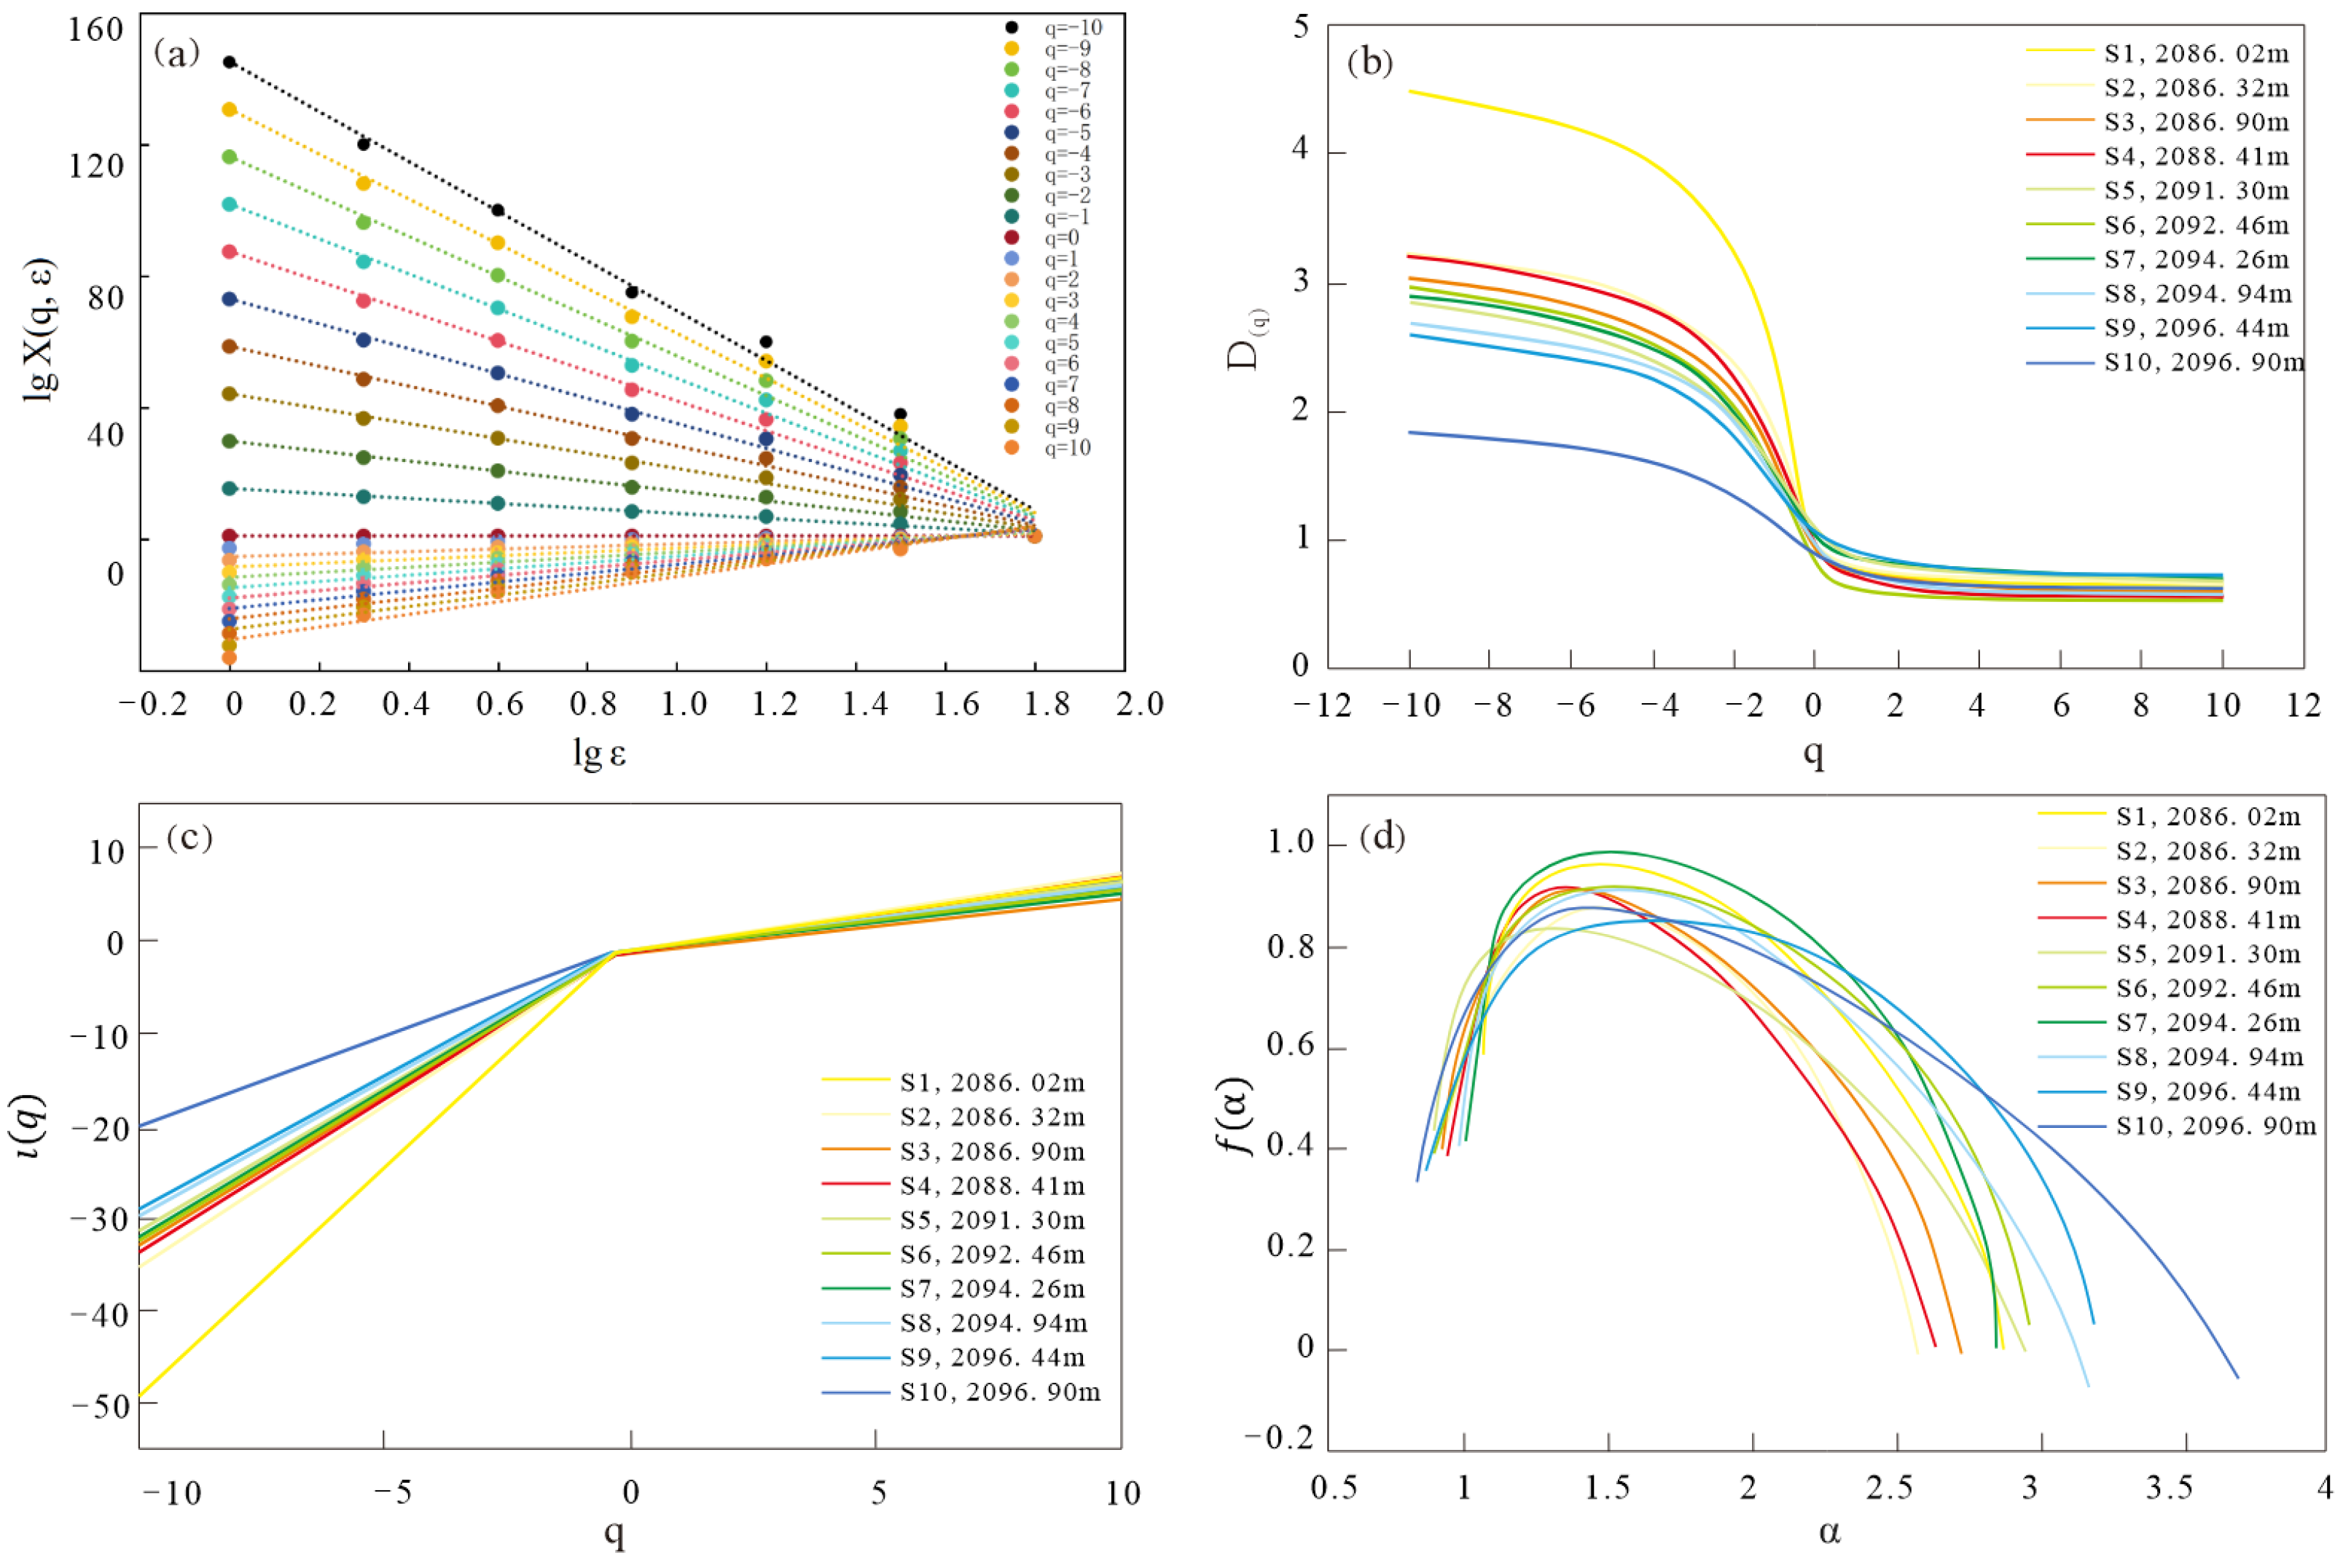
The multifractal discrimination parameters lgX(q, ε) and lgε showed a strict linear correlation (Figure 13a), verifying that the pore size distribution has multifractal characteristics [38]. The generalized dimension spectrum shows a monotonically decreasing function within the range of q ∈ (−10, 10), where D(q) rapidly decays in the interval when q < 0 and slowly decreases in the interval when q > 0 (Figure 13b). The curvature of spectral lines is positively correlated with the heterogeneity of pore distribution. Figure 13c explains the relationship between ı(q) and q. ı(q) strictly increases with q, presenting an upward convex characteristic. When q < 0, as q increases, (g) significantly increases, while when q > 0, as q increases, ı(q) increases slowly. Each group of curves in the multifractal singular spectrum shows a certain asymmetry (Figure 13d). The value range of △α is from 2.441 to 3.316, with an average value of 2.921.
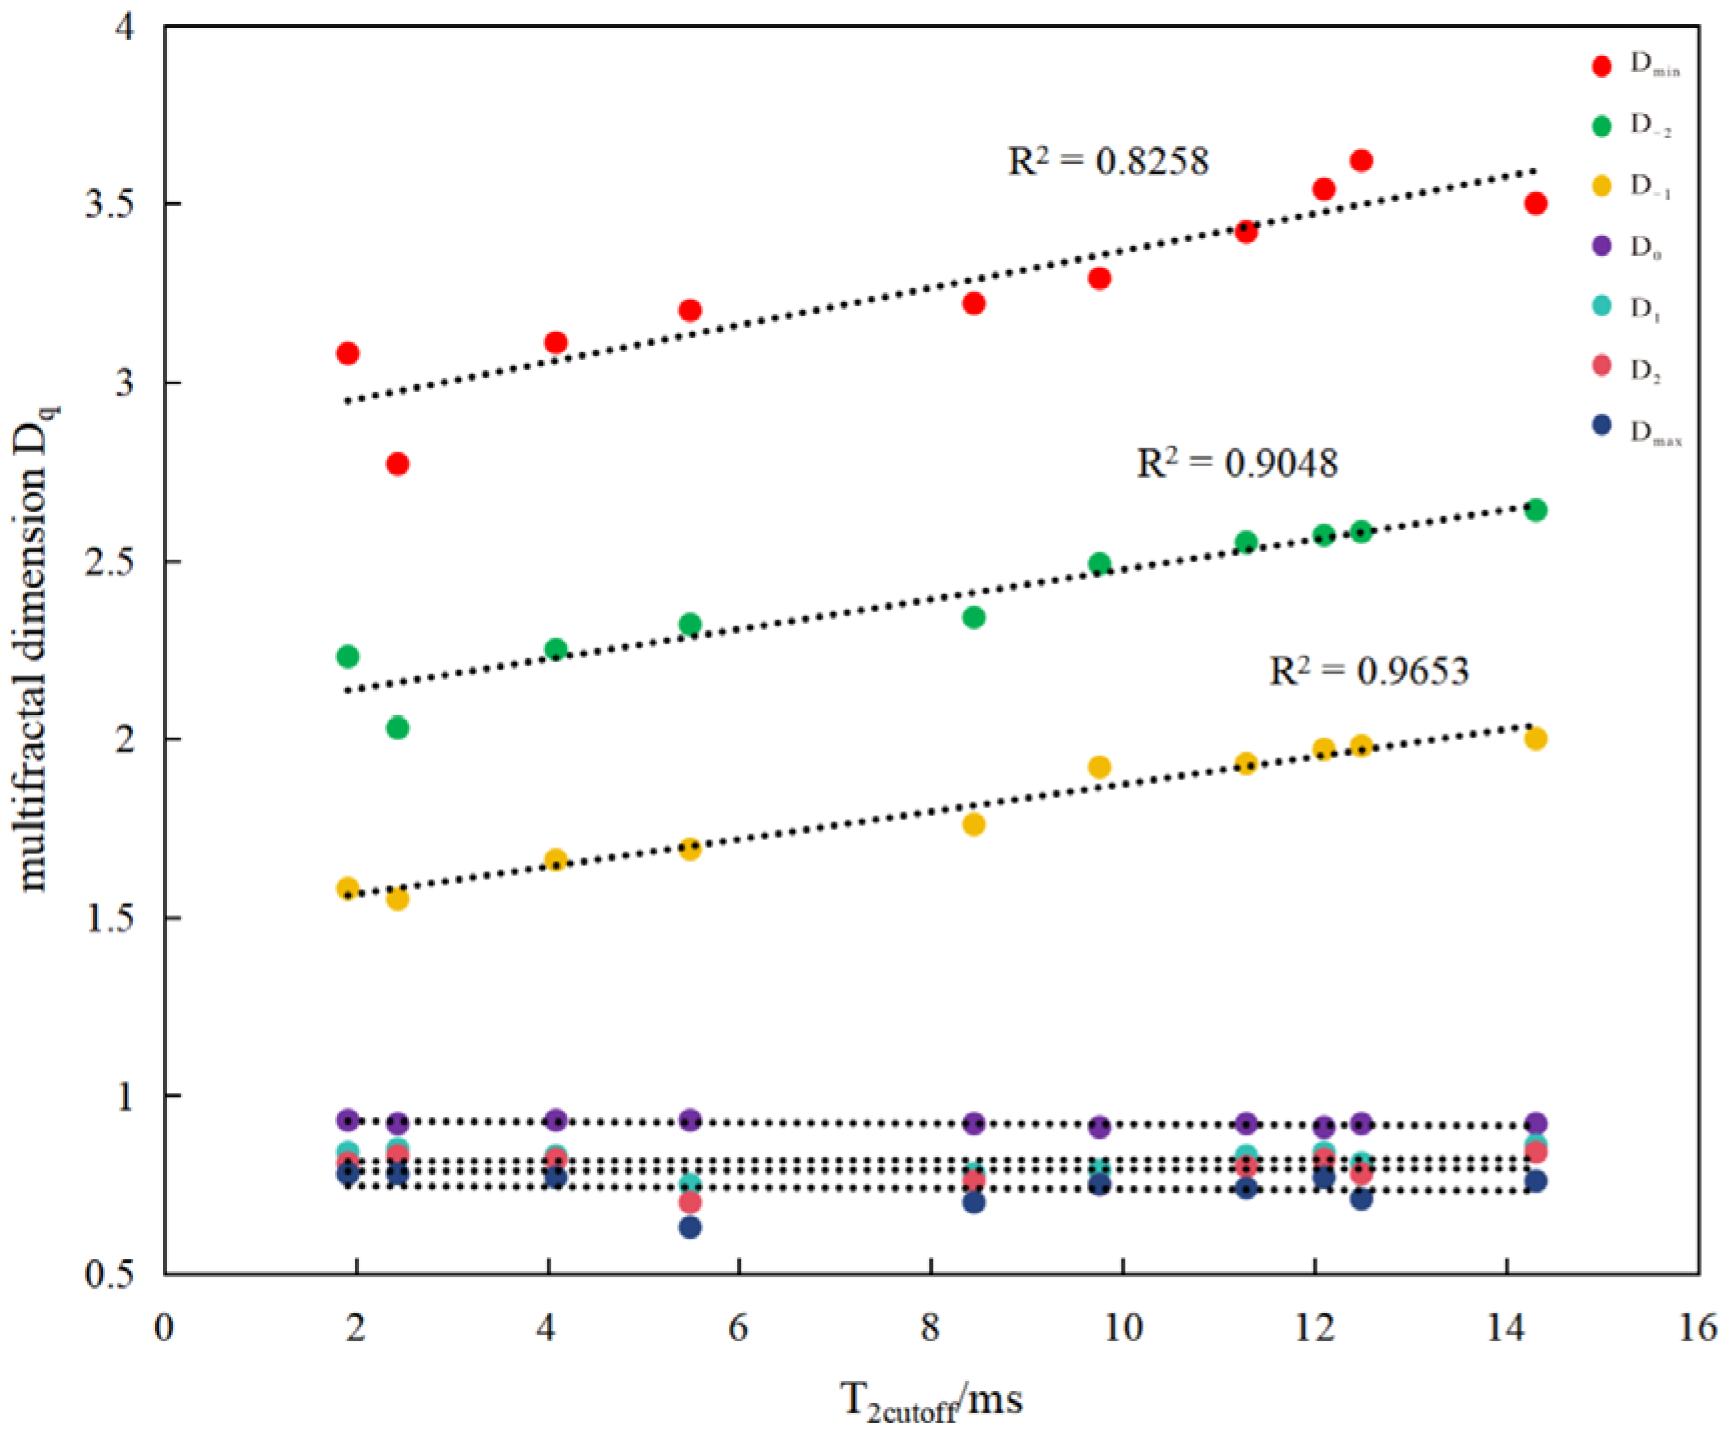
The T2 cutoff value of nuclear magnetic resonance (NMR) can be used for quantitative calculations of parameters such as pore structure evaluation and movable fluid saturation [39]. Figure 14 illustrates the relationship between the multifractal dimension Dq and the T2 cutoff value: when q < 0, a positive correlation is observed; when q > 0, a negative correlation exists; and as q approaches 0, the correlation coefficient decreases significantly.
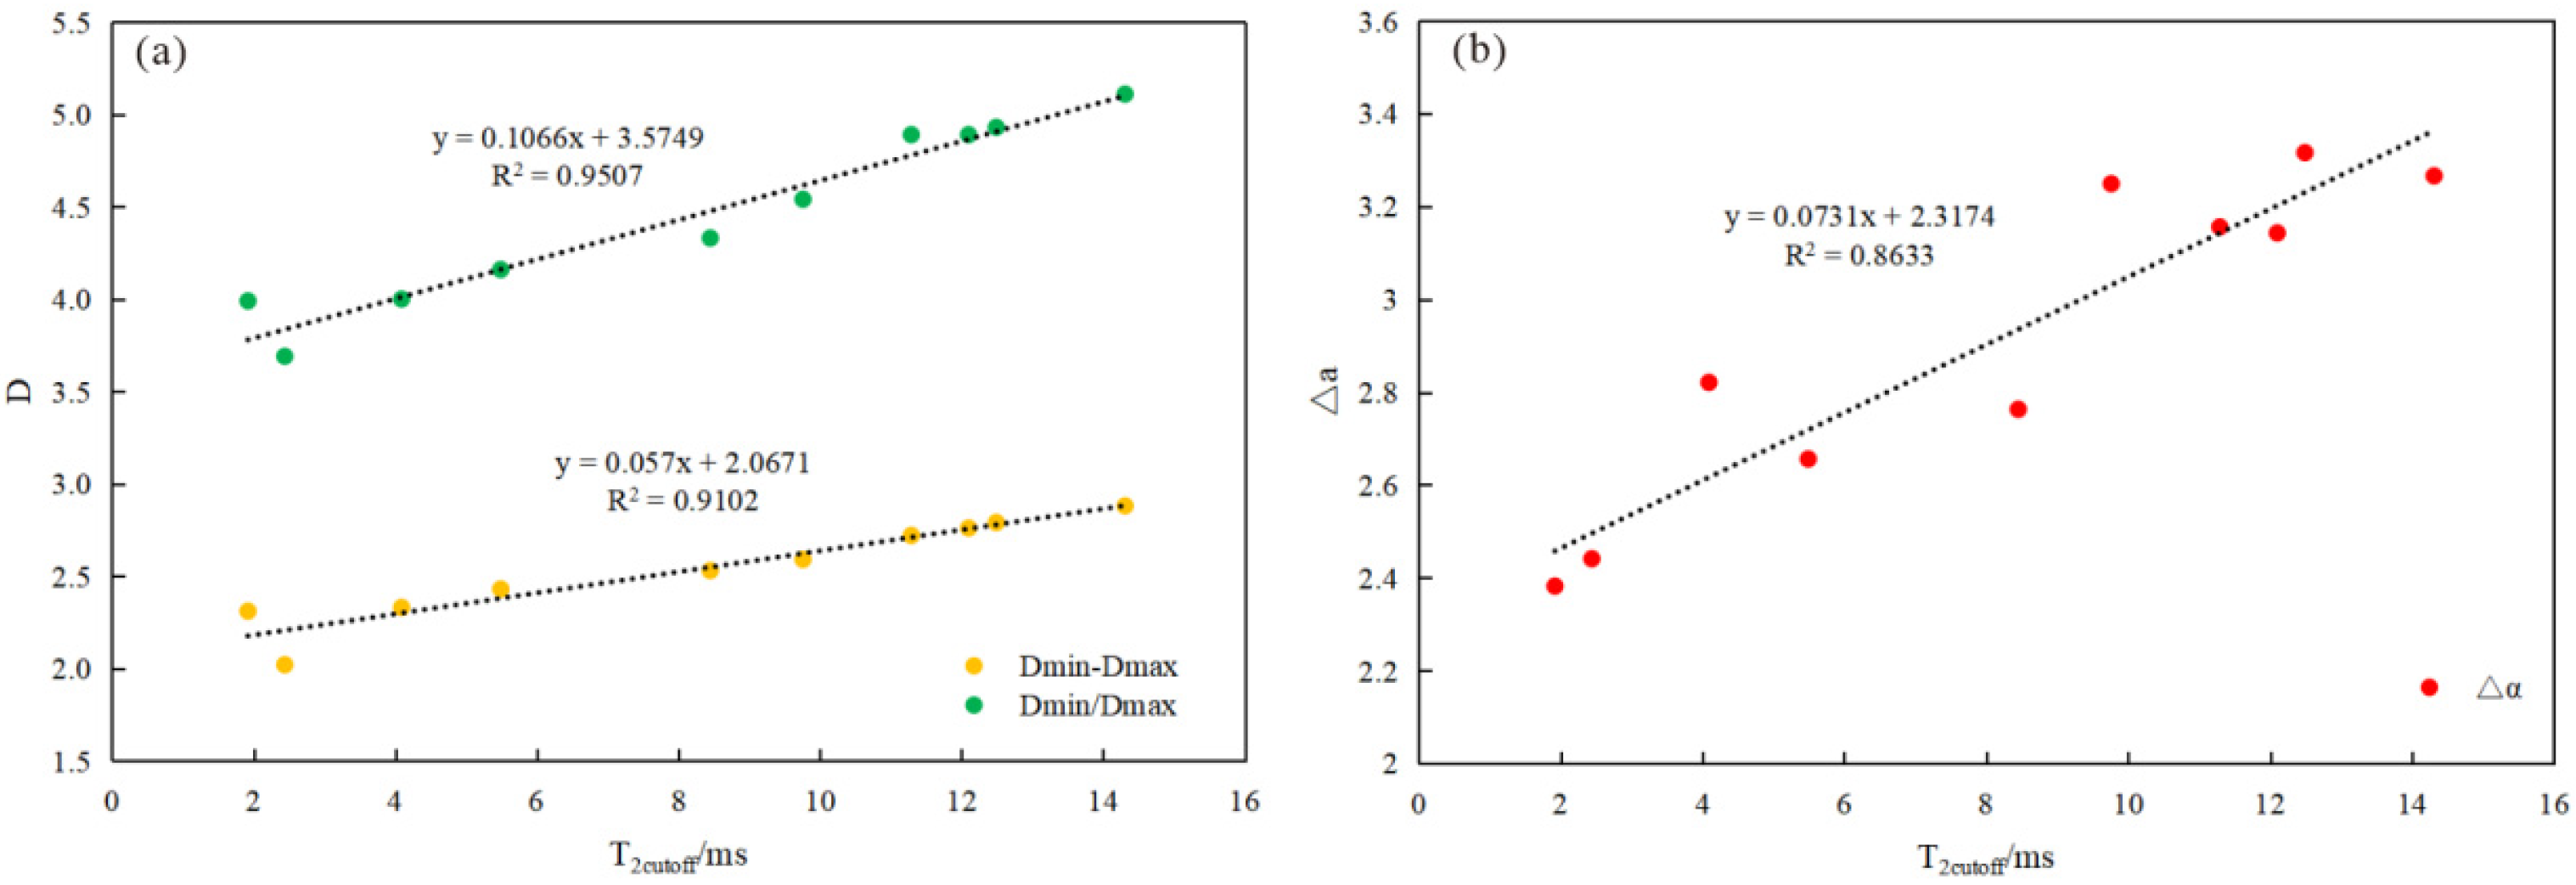
Given the close connection that both the T2 cutoff value and multifractal parameters have with pore structure and pore size distribution, exploring their relationship is crucial [40]. Figure 15 displays the correlation between multifractal dimensions (Dmin-Dmax, Dmin/Dmax, and △α) and the T2 cutoff value from nuclear magnetic resonance. Dmin-Dmax, Dmin/Dmax and △α all have good correlations with the T2 cutoff. The correlation between Dmin/Dmax and the T2 cutoff is the highest, with a correlation coefficient R of 0.9507 (Figure 15a). Therefore, the representative multifractal characteristic parameters selected for this study are Dmin-Dmax, Dmin/Dmax, and △α, which are used to explore their relationships with the reservoir material components.

4.2.2. Correlation Between Mineral Composition and Multifractal Dimensions

Multifractal parameters (Dmin-Dmax, Dmin/Dmax, △α) can more precisely characterize the pore development patterns under the control of different mineral components. Dmin and Dmax reflect the structural complexity of macropores and micropores, respectively. Dmin-Dmax and Dmin/Dmax can be used to evaluate the relative relationship between the structural complexity of macropores and micropores, while Δα reflects the strength of pore heterogeneity [41]. The following establishes their systematic relationships with quartz, calcite, clay minerals and pore structure.
Quartz
The volume proportion of primary intergranular pores shows a strong positive relationship with quartz (Figure 16a). An increase in quartz content is associated with greater preservation of these pores, implying that quartz contributes to resistance against mechanical compaction. Additionally, R50 and Smax increase with the increase in quartz content (Figure 16b,c), while the width of the anomalous index spectrum △α decreases (Figure 16d). This is attributable to quartz’s resistance to compaction and to the intragranular fractures generated by quartz breakage that enhance physical properties. Furthermore, quartz-rich samples such as S3 and S4 preserve more primary intergranular pores, which provide pathways for fluid migration and promote dissolution. Consequently, tight sandstone reservoirs enriched in quartz tend to exhibit weaker heterogeneity in both pore size and spatial distribution.
Calcite
Calcite is a key cementing material in the Benxi Formation reservoirs, covering products from the eogenetic and mesogenetic stages, among which eogenetic calcite is widely developed [42]. Its double-edged sword effect is significant: in the eogenetic stage, calcite fills the intergranular pores and blocks the throat, directly deteriorating the physical properties of the reservoir, but it also provides a material basis for later dissolution. The iron calcite formed during the mesogenic stage originates from the Ca2+ provided by eogenetic calcite and dissolved debris, as well as the Fe2+ released by the dissolution of feldspar. It is extremely difficult to dissolve in an acidic environment, causing severe damage to the pore structure. Statistical analysis shows that porosity and permeability are negatively correlated with calcite content (Figure 17a,b). The multiple fractal characteristic parameters Dmin-Dmax and Dmin/Dmax are weakly negatively correlated with the content of calcite (Figure 17c), and △α is positively correlated with the content of calcite (Figure 17d). This indicates that calcite usually has a negative impact on the pore structure. The increase in calcite content aggravates pore heterogeneity. Statistical analyses indicate that calcite content has a much stronger association with permeability than with porosity, implying that calcite mainly produces isolated voids by infilling pore spaces and occluding pore throats. Since pore-throat radius and connectivity are the primary controls on permeability, the suppressive effect of calcite on permeability far exceeds its impact on porosity.
Clay Minerals
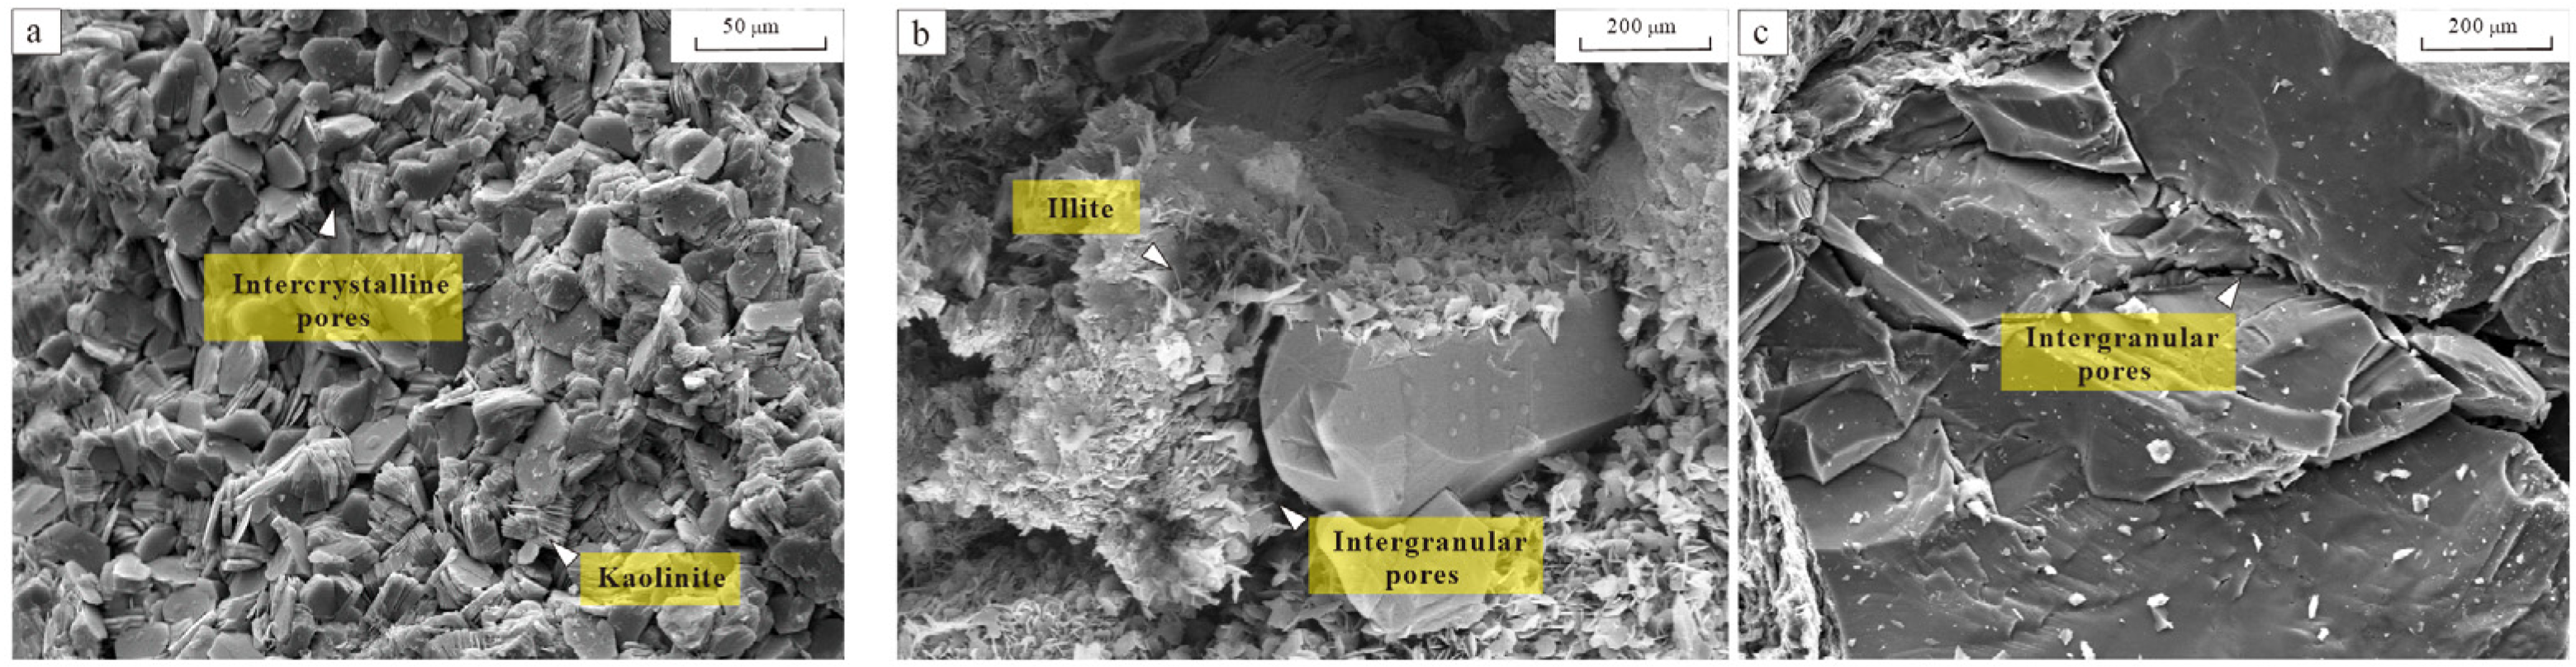
Clay minerals, as the main cementing components of the Benxi Formation (with an average content of 10.1%; Table 2), are mainly composed of kaolinite and illite, and their influence on the pore structure is complex [43]. Kaolinite mainly forms during the recrystallization process of feldspar dissolution products under the action of acidic fluids, often filling the pores in a book-like or worm-like manner (Figure 18a). Although the feldspar content in the studied layer was low, the large amount of organic acids released by hydrocarbon generation in the coal seam effectively promoted its dissolution, forming abundant kaolinite [44]. Illite and the illite/mongolite mixed layer are distributed in a filamentous pattern in the intergranular pores (Figure 18b), which are formed by the retention of K+ ions after the complete dissolution of potassium feldspar [45]. Within a certain range, the content of coated chlorite particles can inhibit the compaction process and have a positive impact on the pore structure (Figure 18c) [46].
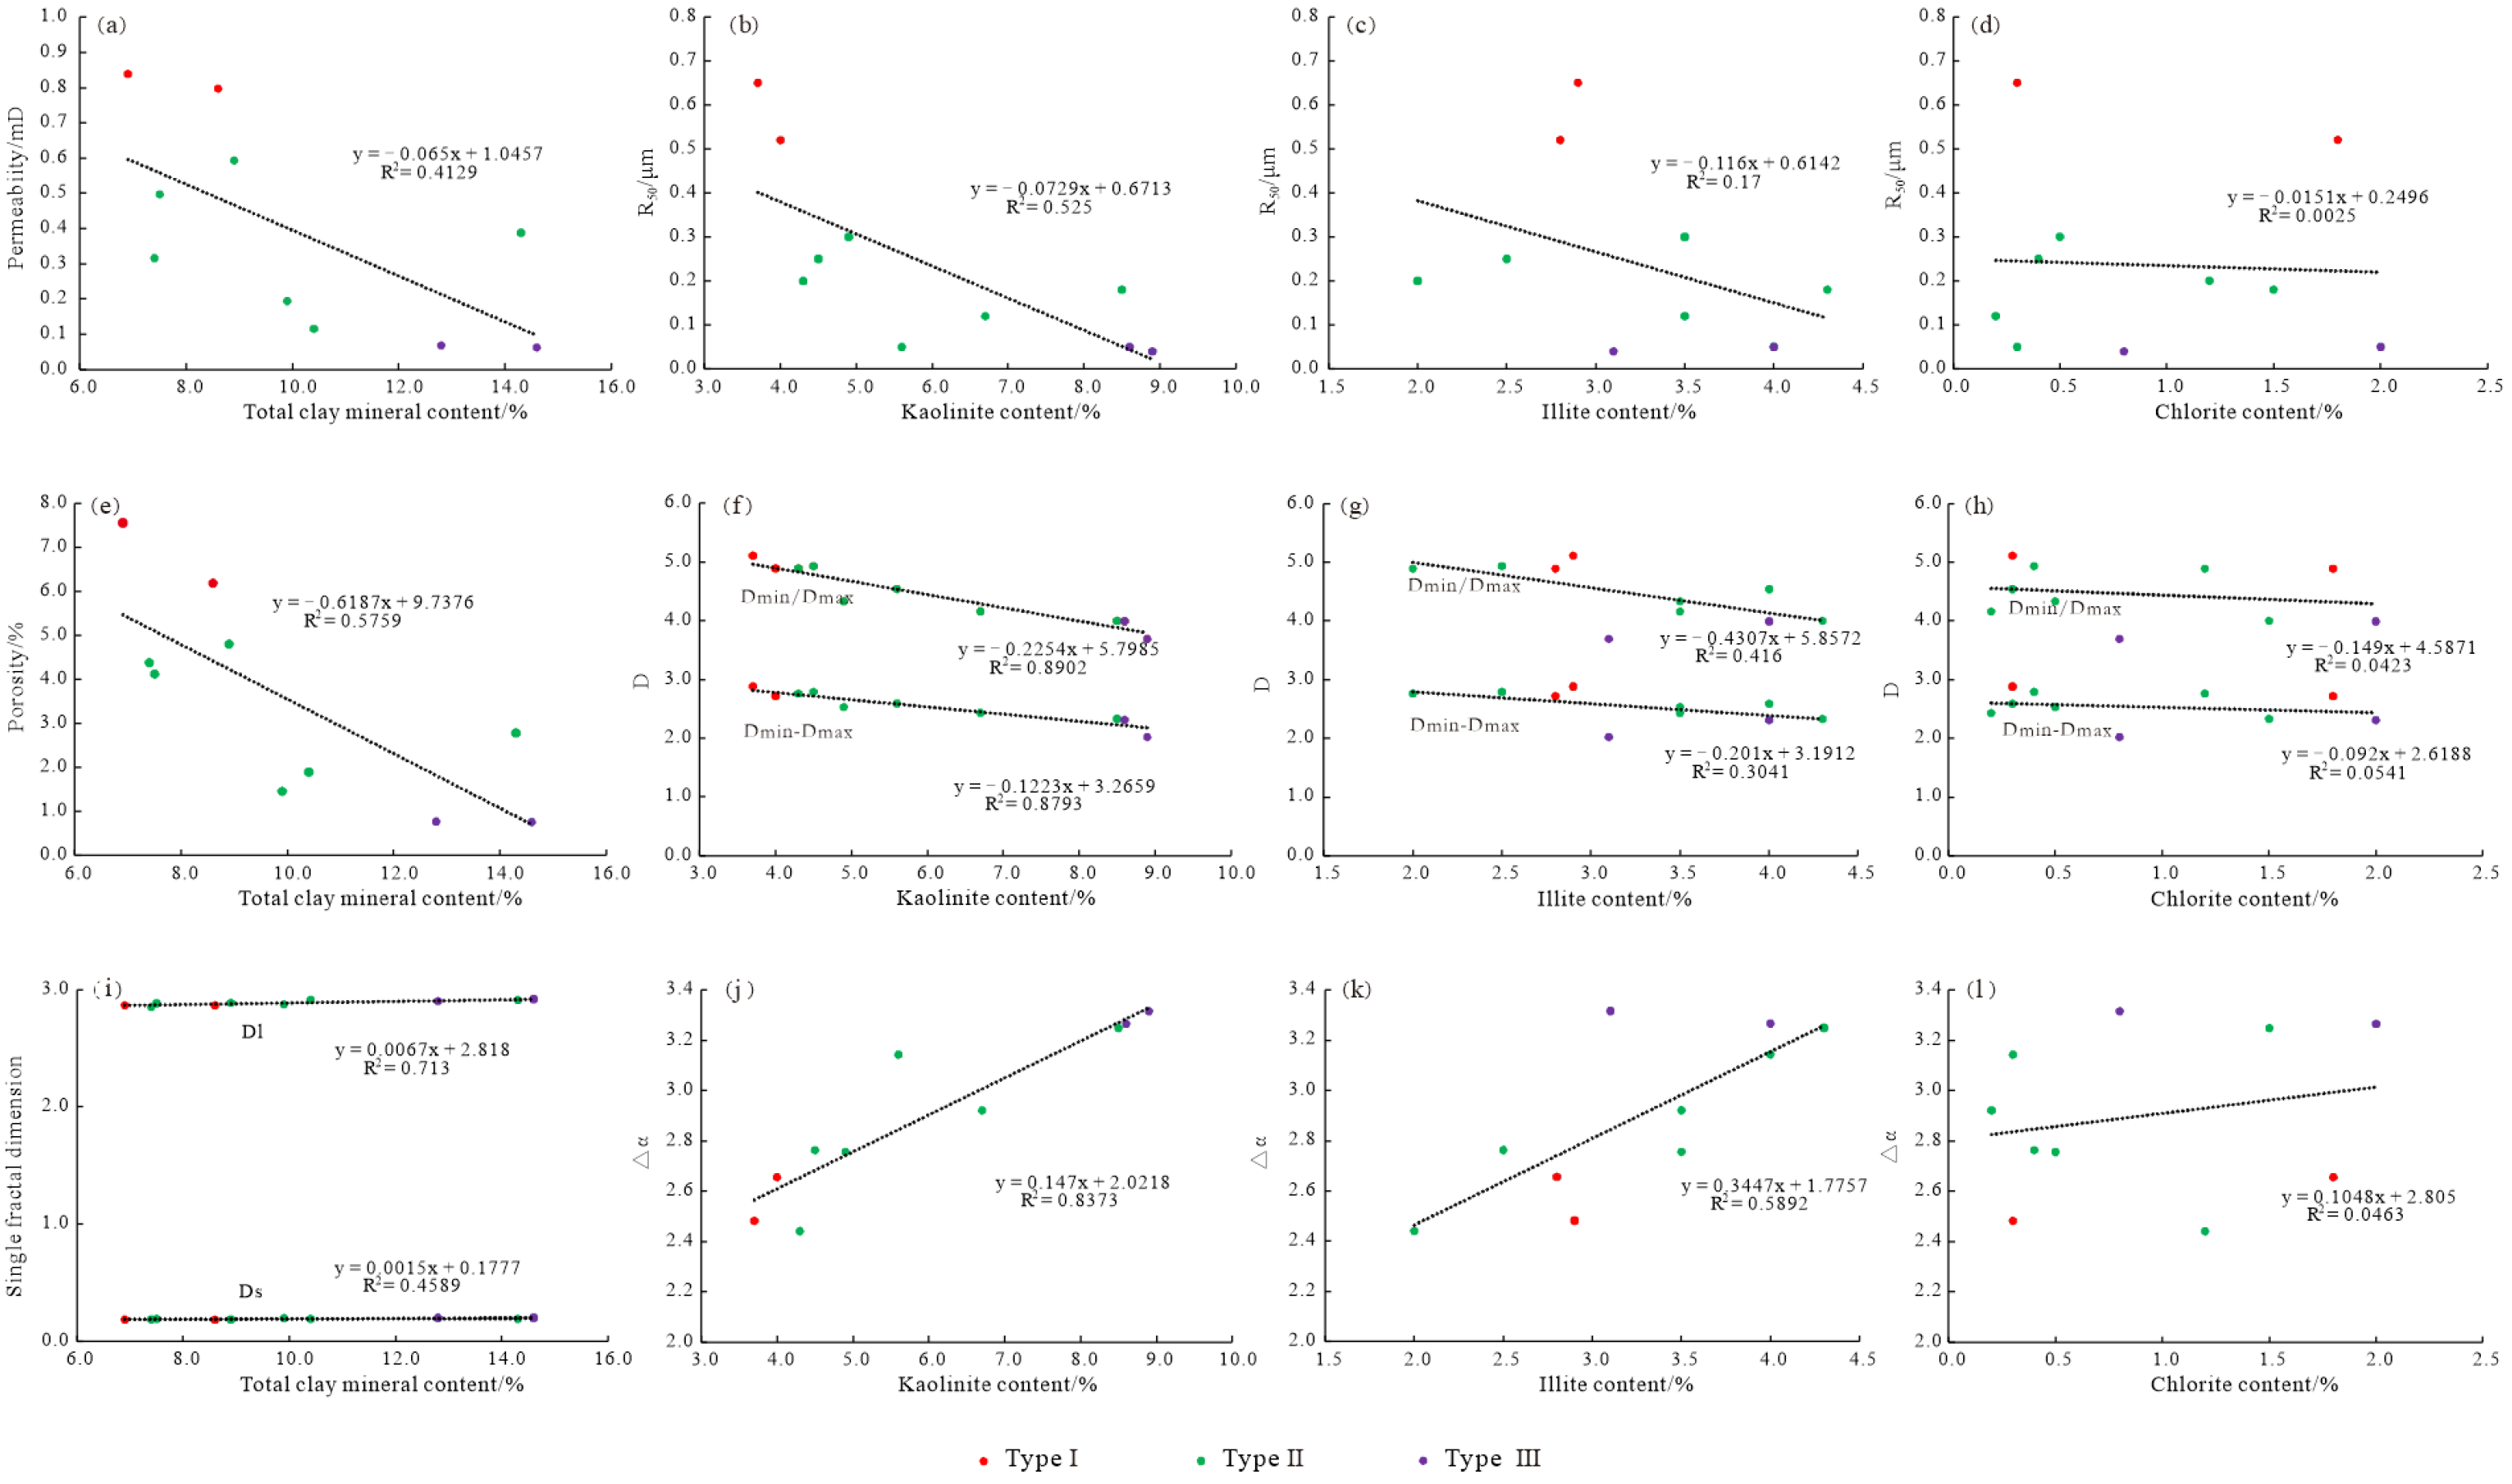
The total amount of clay minerals was significantly negatively correlated with the pore-throat parameters (Figure 19a,e), and had a stronger correlation with permeability, indicating that its increase led to a sharp decline in pore permeability. The correlation coefficient between total clay mineral content and Dl is 0.713, exceeding that for Ds, confirming that higher clay mineral content increases pore heterogeneity and exerts a stronger influence on macropore structure than on micropore structure. Kaolinite has the most significant influence on the size and connectivity of the orifice throat (Figure 19b–d). The correlation analysis between multifractal parameters and clay mineral content (kaolinite, illite, chlorite) indicates that Dmin-Dmax and Dmin/Dmax decrease with the increase in their content (Figure 19f–h), while △α increases accordingly (Figure 19j–l). Moreover, the correlation between kaolinite and the multiple fractal characteristic parameters is the highest, which also indicates that kaolinite has the greatest impact on the heterogeneity of reservoir pores. Due to the more complex shape and distribution of pores in Class III pore structures (samples S9, S10), the effective micropore space shrinks, and the multiple fractal characteristic parameters Dmin-Dmax and Dmin/Dmax are the highest, and △α is the lowest. Conversely, the reservoir physical properties of the Class I pore structures (samples S3, S4) are the best, and the pore heterogeneity is the weakest.
Principal Component Analysis
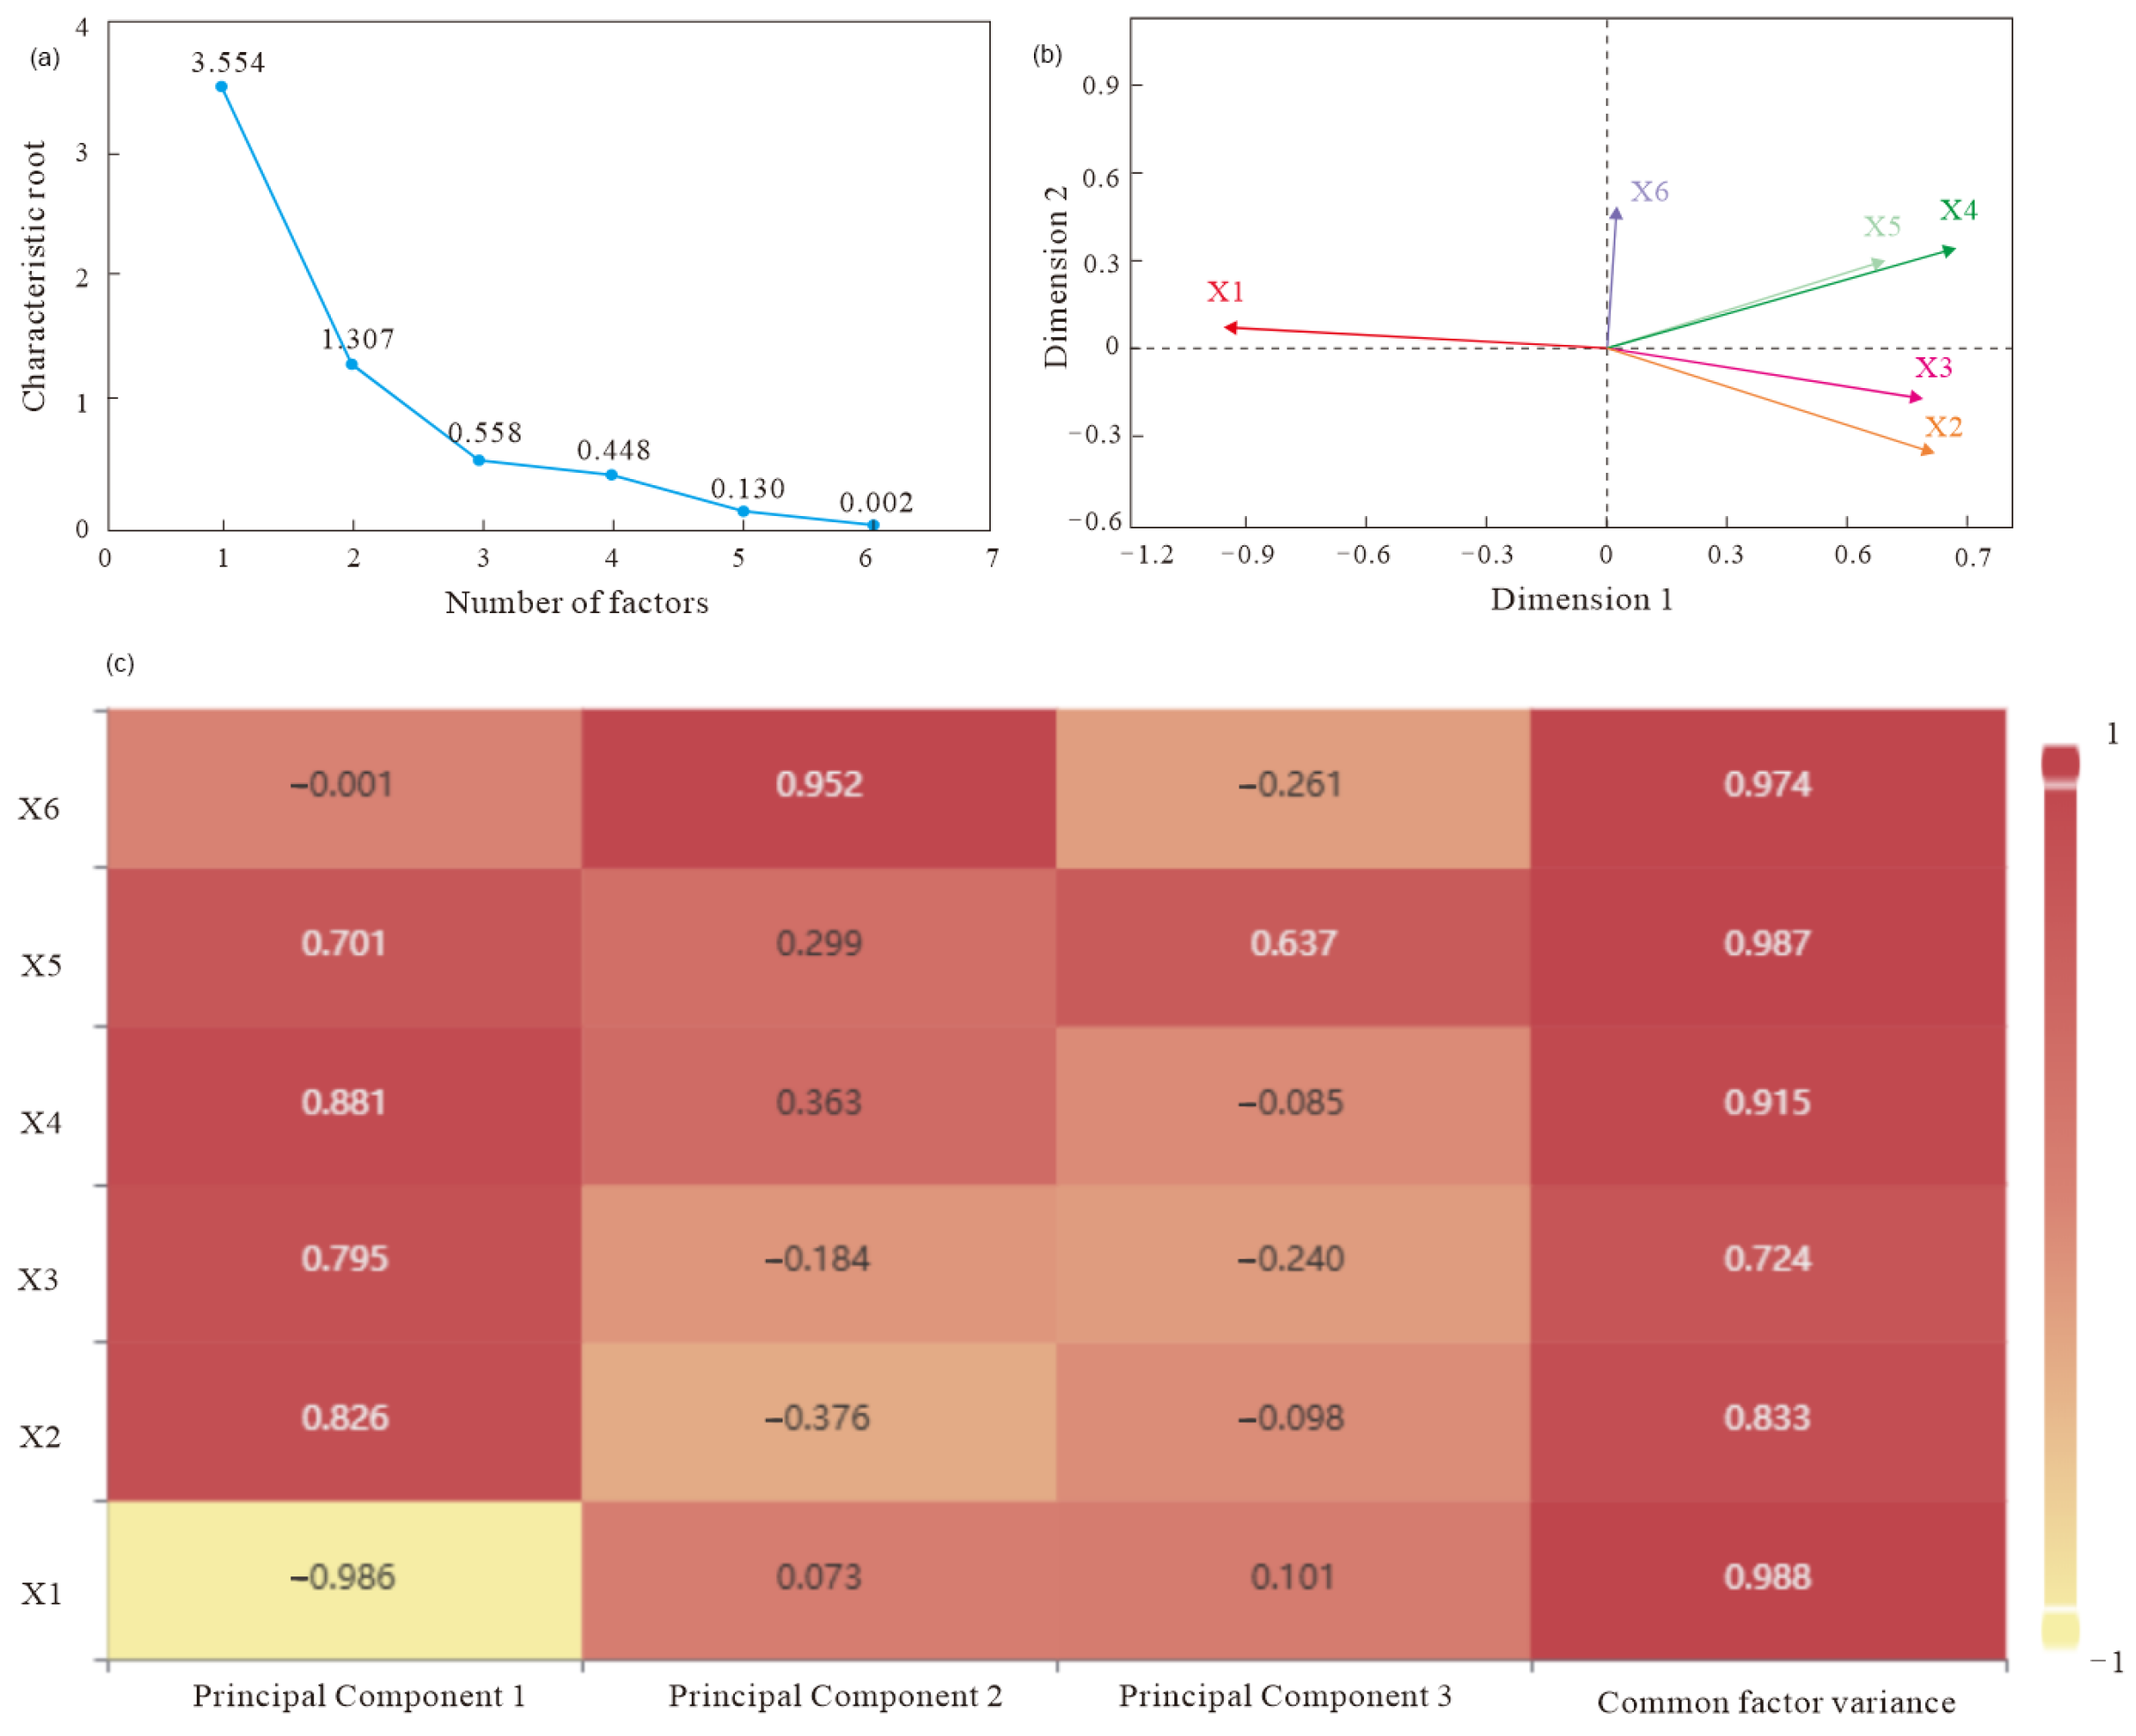
From the above analysis, it can be seen that different mineral components have different effects on the fractal characteristics. It is necessary to conduct multivariate analysis (such as principal component analysis or multiple regression) to distinguish the influence of mineralogical factors. Therefore, in order to quantitatively establish the degree of influence of each mineral on the pore structure, with reservoir porosity (Y) as the dependent variable, and with the contents of quartz (X1), rock fragments (X2), calcite (X3), kaolinite (X4), illite (X5), and chlorite (X6) as independent variables, principal component analysis is conducted. After processing the data with principal component analysis, the principal components and corresponding eigenvalues are used to draw the principal component analysis scree plot (Figure 20a). The turning point of the steepness of the line is the number of principal components that should be selected for principal component analysis. When the principal components are 3, the line starts to slow down, so the number of principal components selected in this study is 3. When drawing the graphs with principal components 1 and 2, the cumulative variance is 81.02%, which is greater than 60%, indicating that the extracted principal components 1 and 2 can basically reflect the overall characteristics of the data set, while the cumulative variance of principal components 1, 2, and 3 is 90.33%, indicating that the three principal components can reflect more characteristics of the data set.
The principal component analysis load plot was drawn based on the extracted feature vector matrix (Figure 20b). Generally, the longer the axis length of a variable on the load plot, the greater its contribution to the dimensionality reduction process of principal component analysis. The magnitudes of the loadings of each mineral component can be observed. Quartz, rock fragments, calcite, kaolinite, and illite have relatively large loadings, indicating that these mineral components have a significant contribution in distinguishing different tight sandstone pore structure types. Moreover, the distances between the loadings of each variable can also reflect some information. Closer distances indicate a certain correlation between these two variables. For example, the loadings of rock fragments and calcite are relatively close, indicating a certain correlation between them; similarly, kaolinite and illite also have a correlation, mainly because of the transformation of calcite to illite during burial and heating. Through the heat map of the load matrix, the importance of latent variables in each principal component can be analyzed (Figure 20c). The darker the color, the greater the correlation.

4.3. Classification of Reservoirs Based on Multifractal Parameters

Although the Benxi Formation tight sandstone is widely distributed in the study area, high-quality reservoirs (with high porosity and high permeability) are scarce and their spatial distribution is uncertain, which has become a key bottleneck restricting the efficient development of tight gas [47]. The diagenetic process of reservoirs is complex, resulting in significant differences in pore structure types and physical parameters, which further increases the difficulty of reservoir evaluation and prediction. Therefore, we classify tight sandstone gas reservoirs based on multifractal parameters.
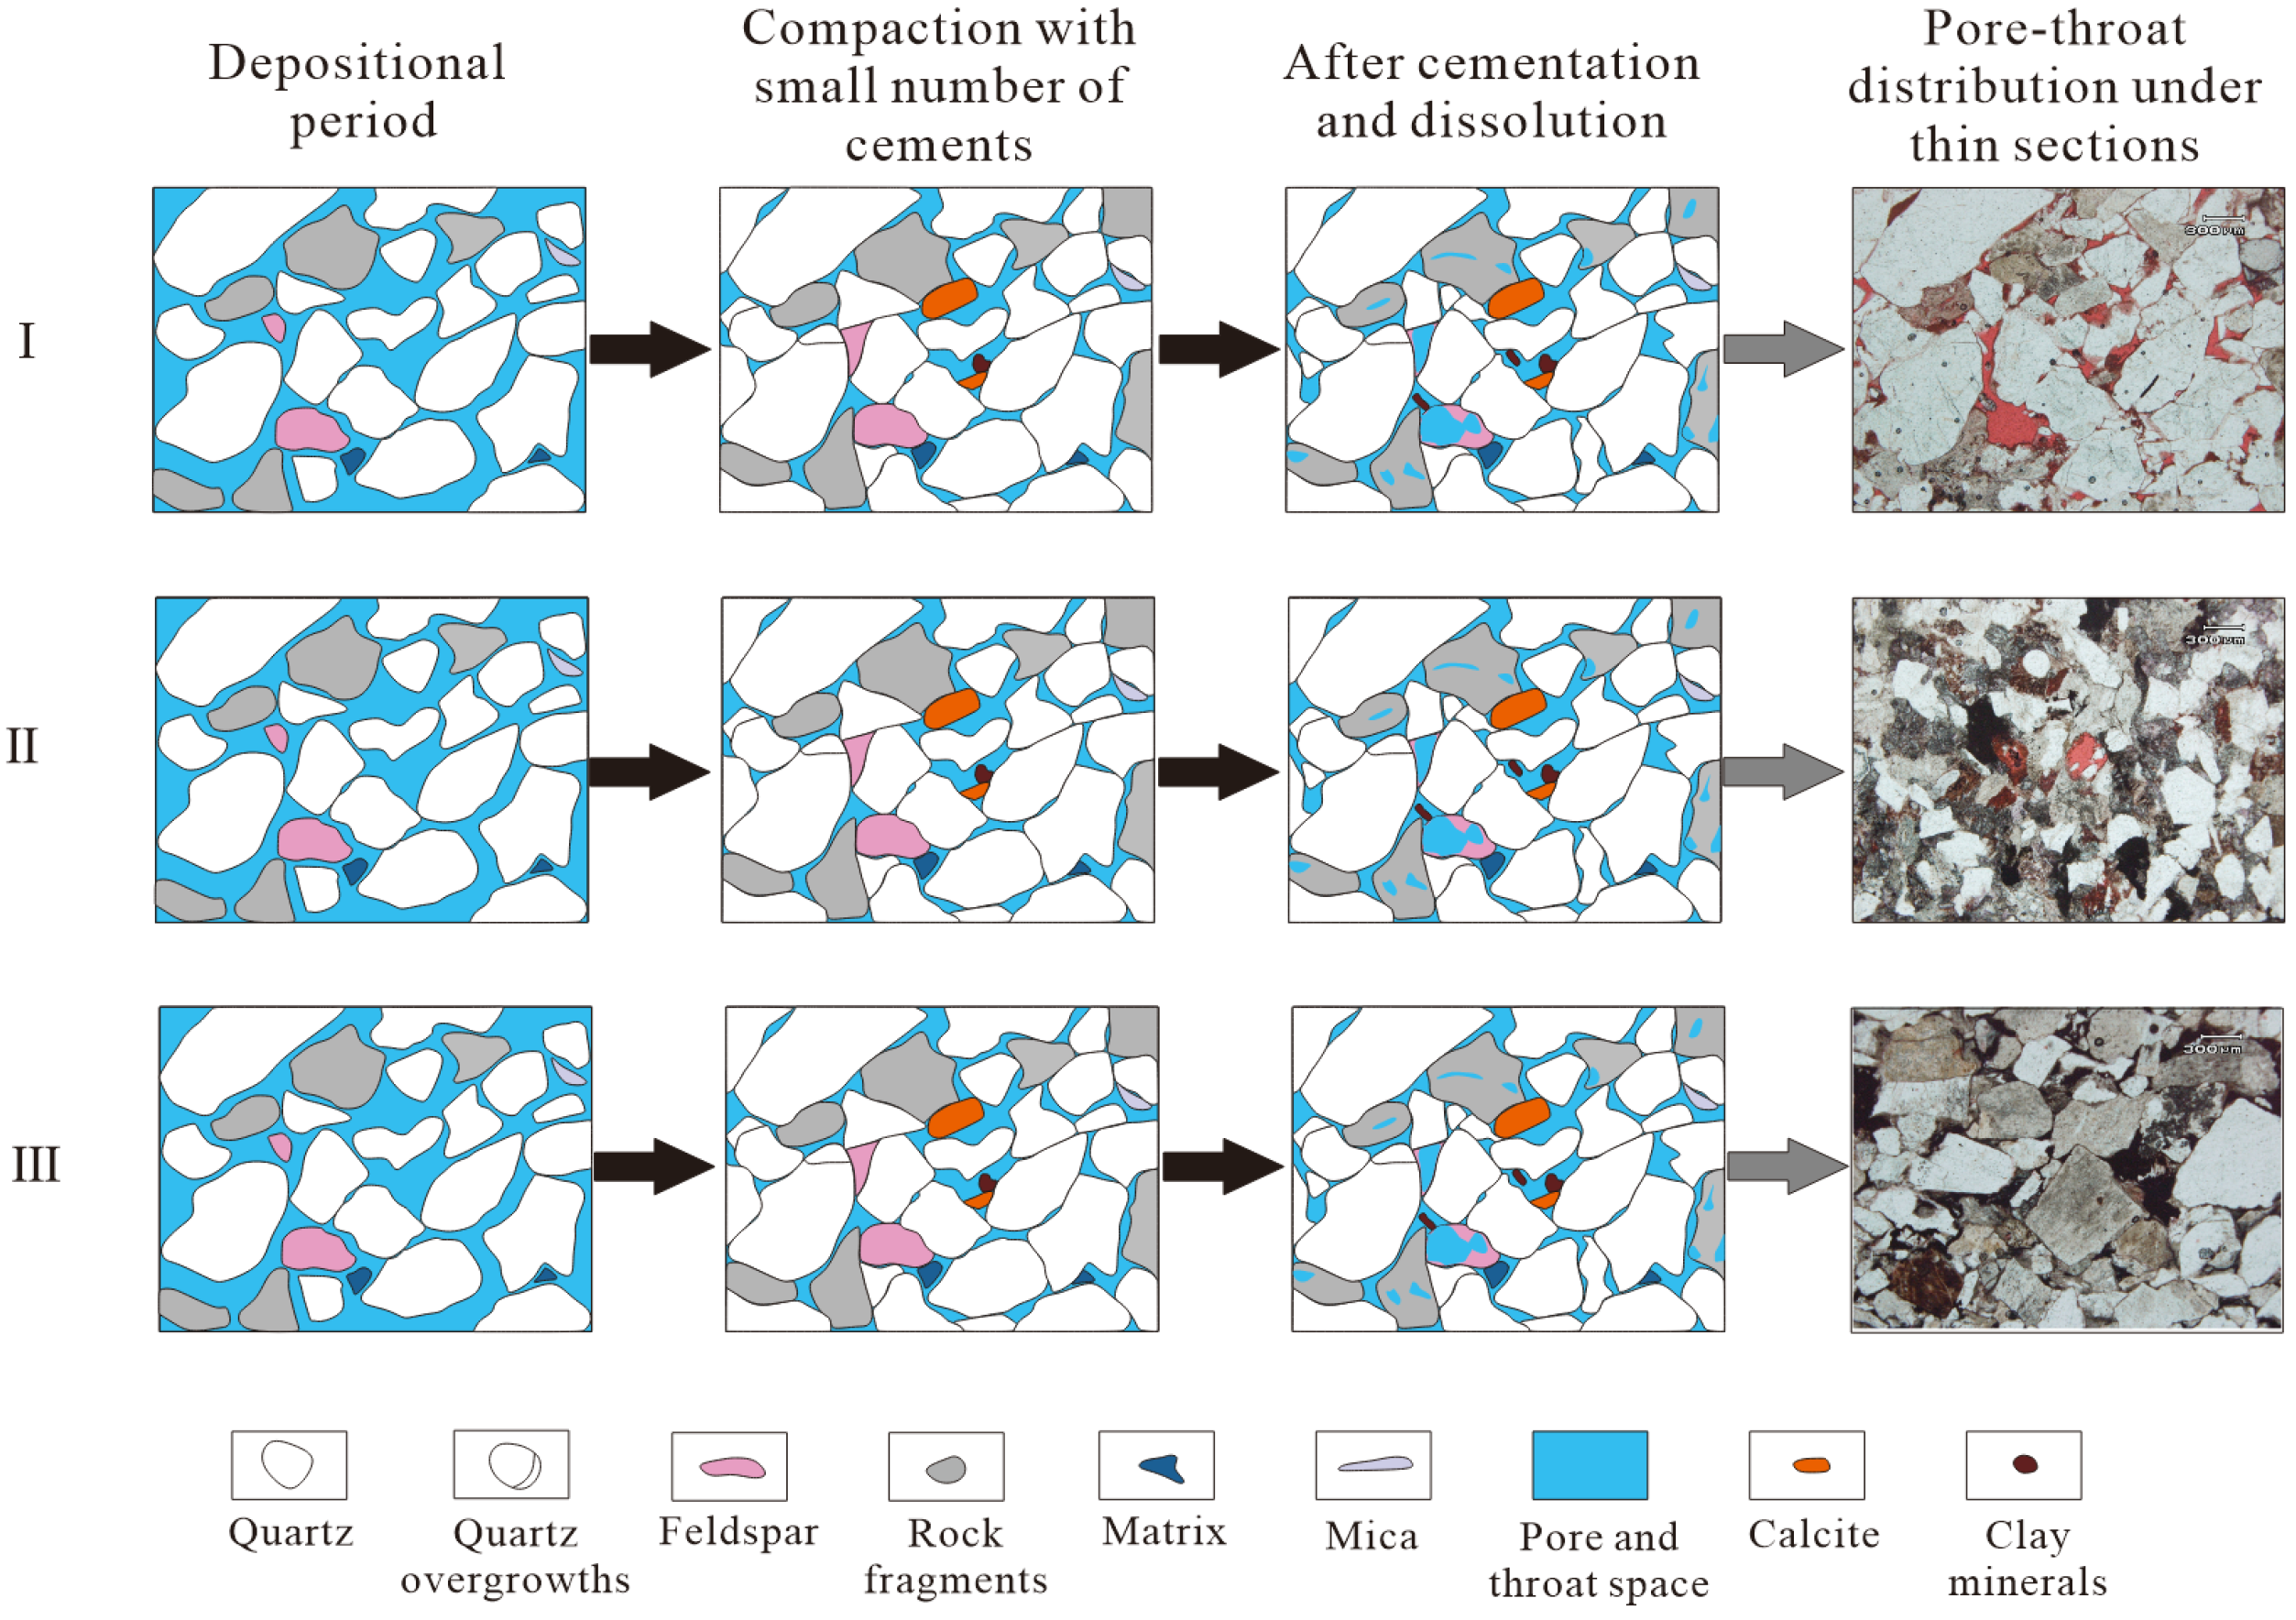
High-quality reservoirs are mainly distributed in Class I reservoirs with a relatively high quartz content. Due to the anti-compaction effect of quartz, they have undergone weak compaction, strong dissolution and weak cementation (Figure 21). Their multifractal characteristic parameters Dmin-Dmax and Dmin/Dmax are relatively high, while △α is relatively low, and the heterogeneity is weak, which is conducive to the charging and migration of hydrocarbons. Class II reservoirs have undergone relatively moderate compaction, dissolution and limited cementation, resulting in moderate reservoir quality. Their multifractal characteristic parameters (Dmin-Dmax, Dmin/Dmax, △α) all show medium values, reflecting a moderate degree of heterogeneity in the pore structure. Class III reservoirs are characterized by strong compaction, limited dissolution, and intense cementation. In particular, elevated clay mineral contents significantly reduce pore size and obstruct throats, leading to the widespread development of intragranular dissolution pores and intercrystalline micropores. This leads to poor pore structure connection and strong heterogeneity, resulting in poor reservoir quality. Overall, reservoirs that have not undergone intense compaction, cementation and other diagenetic modifications and have relatively weak heterogeneity are favorable areas for hydrocarbon exploration in the Benxi Formation.

5. Future Work

This study provides a new paradigm for reservoir quality prediction. We used the original NMR logging data to perform T2 spectrum inversion, calculated the multifractal spectrum using the box-counting method, then extracted the Dq, α, and f(α) parameters, calculated Dmin-Dmax, Dmin/Dmax, and Δα, and finally conducted reservoir classification and property evaluation. Future research can further combine nuclear magnetic resonance with three-dimensional digital core reconstruction technology to study the synergistic effect between mineral compositions. By coupling machine learning methods, an intelligent prediction model for minerals, fractal parameters and productivity is constructed, providing theoretical support and a technical guarantee for the efficient development of reservoirs [48].

6. Conclusions

(1)
The dominant minerals are quartz, clay minerals, rock fragments and calcite, while feldspar content is relatively minor. Due to the influence of various minerals, the pore structure shows significant heterogeneity. The pore types present include primary intergranular pores, intergranular dissolution pores, intragranular dissolution pores, intercrystalline micropores, and microfractures.
(2)
The nuclear magnetic resonance T2 spectra of the tight sandstone samples from the study area display a bimodal pattern. As the quartz content diminishes, there is a reduction in the number of macropores, while isolated pores become more prevalent, leading to a deterioration in the connectivity of pore throats. The typical experimental results of three types of nuclear magnetic resonance, namely the right-biased bimodal type, bimodal type, and left-biased bimodal type, were obtained through saturated and centrifugal T2 spectra. For all the samples, the single fractal dimension parameter Dl exceeds Ds. In this study area, the single fractal parameters fail to fully explain the heterogeneity of the pore structure of the tight sandstone.
(3)
The application of multifractal theory provides profound insights beyond single fractal analysis. The multifractal parameters can more precisely describe the pore development patterns controlled by different mineral components. Dmin-Dmax, Dmin/Dmax, and △α effectively quantify the overall heterogeneity of the pore network. Mineral composition has differentiated effects on fractal characteristics: Dmin-Dmax and Dmin/Dmax are positively correlated with quartz content, while they are negatively correlated with calcite and clay mineral (kaolinite, illite, chlorite) content. The increase in quartz content can retain more primary intergranular pores and promote dissolution, thus weakening pore heterogeneity. However, the increase in calcite and clay mineral content corresponded to the enhanced development of micropores and mesopores, thereby reducing the heterogeneity.
(4)
The pore structure classification method based on multiple fractal parameters can quantify the evolution of pore heterogeneity, thereby effectively evaluating the quality of the reservoir. In general, reservoirs with larger Dmin-Dmax and Dmin/Dmax values, smaller △α, weaker porosity heterogeneity, and better connectivity are favorable areas for hydrocarbon exploration and development in the study area.

Author Contributions

Conceptualization and methodology, P.L.; software, P.L.; formal analysis, Y.L., J.H.; investigation, P.L., L.B.; resources, L.B.; data curation, Q.C.; writing—original draft preparation, P.L.; writing—review and editing, J.H.; visualization, Y.L.; funding acquisition, J.H. All authors have read and agreed to the published version of the manuscript.

Funding

This research was funded by the National Natural Science Foundation of China (No.42072146).

Data Availability Statement

All of the data and models generated or used in the present study are available from the corresponding author upon request.

Conflicts of Interest

The authors declare that they have no known competing financial interests or personal relationships that might have influenced the work presented in this article.

Abbreviations

NMRNuclear magnetic resonance
PMIPressure-controlled mercury injection
SEMScanning electron microscopy
XRDX-ray diffraction
CTSComputed Tomography scanning
DFractal dimension
PdDisplacement pressure
P50Medium saturation pressure
RmaxMaximum pore-throat radius
R50Median pore-throat radius
SmaxMaximum intrusion mercury saturation
SpSorting factor
SbouBound fluid saturation
SmovMovable fluid saturation
R2Correlation coefficient
KThe slope of the fractal curve

References

  1. Abuamarah, B.; Nabawy, B.; Shehata, A.; Kassem, O.; Ghrefat, H. Integrated geological and petrophysical characterization of oligocene deep marine unconventional poor to tight sandstone gas reservoir. Mar. Pet. Geol. 2019, 109, 868–885. [Google Scholar] [CrossRef]
  2. Wen, Z.; Wang, J.; Wang, Z.; He, Z.; Song, C.; Chen, R.; Liu, X.; Ji, T.; Li, Z. Analysis of the current status of global oil, gas, and associated resources exploration in 2023. Pet. Explor. Dev. 2024, 51, 1465–1479. [Google Scholar] [CrossRef]
  3. Deng, X.; Bai, B. Whole petroleum system and main controlling factors of hydrocarbon accumulation in the Mesozoic of Ordos Basin, NW China. Pet. Explor. Dev. 2025, 52, 1150–1163. [Google Scholar] [CrossRef]
  4. Su, N.; Song, F.; Qiu, L.; Zhang, W. Diagenetic evolution and densification mechanism of the Upper Paleozoic tight sandstones in the Ordos Basin, Northern China. J. Asian Earth Sci. 2021, 205, 104613. [Google Scholar] [CrossRef]
  5. Dai, J.; Dong, D.; Ni, Y.; Gong, D.; Huang, S.; Hong, F.; Zhang, Y.; Liu, Q.; Wu, X.; Feng, Z. Distribution patterns of tight sandstone gas and shale gas. Pet. Explor. Dev. 2024, 51, 767–779. [Google Scholar] [CrossRef]
  6. Alghamdi, F.; Alquraishi, A.; Amao, A.; Laboun, A.; Fattah, K.; Kahal, A.; Lashin, A. Depositional setting, mineralogical and diagenetic implication on petrophysical properties of unconventional gas reservoir of the silurian qusaiba formation, northwestern arabian peninsula. Geoenergy Sci. Eng. 2023, 223, 211563. [Google Scholar] [CrossRef]
  7. Dong, X.; Meng, X.; Pu, R. Impacts of mineralogy and pore throat structure on the movable fluid of tight sandstone gas reservoirs in coal measure strata: A case study of the Shanxi formation along the southeastern margin of the Ordos Basin. J. Pet. Sci. Eng. 2023, 220, 111257. [Google Scholar] [CrossRef]
  8. Sarhan, M.; Selim, E. Integrated petrophysical evaluation of conventional and unconventional reservoirs: The Matulla sandstones and Thebes carbonates in the Geisum Field, Gulf of Suez, Egypt. J. Afr. Earth Sci. 2026, 234, 105930. [Google Scholar] [CrossRef]
  9. Farouk, S.; Sarhan, M.; Sen, S.; Ahmad, F.; Alkahtany, K.; Reda, M. Evaluation of the Lower Cretaceous Alam El Bueib Sandstone reservoirs in Shushan Basin, Egypt—Implications for tight hydrocarbon reservoir potential. J. Afr. Earth Sci. 2024, 218, 105386. [Google Scholar] [CrossRef]
  10. Paul, A.; Mukherjee, S.; Biswas, M. Global review on shale: Focus on hydrocarbon geoscience & carbon sequestration. Results Earth Sci. 2025, 3, 100088. [Google Scholar] [CrossRef]
  11. Zhang, F.; Li, J.; Wei, G.; Liu, X.; Guo, J.; Li, J.; Fan, L.; She, Y.; Guan, H.; Yang, S.; et al. Formation mechanism of tight sandstone gas in areas of low hydrocarbon generation intensity: A case study of the Upper Paleozoic in north Tianhuan depression in Ordos Basin, NW China. Pet. Explor. Dev. 2018, 45, 79–87. [Google Scholar] [CrossRef]
  12. Tong, Z.; Zhang, J.; Li, Z.; Wu, Y.; Wang, D.; Gong, D. Investigation of organic-shale nanopores in the Lower Cambrian Niutitang Formation using low temperature N2 and CO2 adsorption: Multifractality and classification. Microporous Mesoporous Mater. 2022, 337, 111935. [Google Scholar] [CrossRef]
  13. Krakowska, P.; Puskarczyk, E.; Jędrychowski, M.; Habrat, M.; Madejski, P.; Dohnalik, M. Innovative characterization of tight sandstones from Paleozoic basins in Poland using X-ray computed tomography supported by nuclear magnetic resonance and mercury porosimetry. J. Pet. Sci. Eng. 2018, 166, 389–405. [Google Scholar] [CrossRef]
  14. Chen, S.; Yu, H.; Fan, W.; Arif, M. Micro-CT based observations of pore structure in tight sandstone and residual oil under CO2 and water flooding. Fuel 2026, 410, 137764. [Google Scholar] [CrossRef]
  15. Xiao, L.; Li, J.; Mao, Z.; Lu, J.; Yu, H.; GuoH, Y.; Li, G. A method to determine nuclear magnetic resonance (NMR) T2cutoff based on normal distribution simulation in tight sandstone reservoirs. Fuel 2018, 225, 472–482. [Google Scholar] [CrossRef]
  16. Li, X.; Wei, W.; Wang, L.; Ding, P.; Zhu, L.; Cai, J. A new method for evaluating the pore structure complexity of digital rocks based on the relative value of fractal dimension. Mar. Pet. Geol. 2022, 141, 105694. [Google Scholar] [CrossRef]
  17. Zheng, S.; Yao, Y.; Liu, D.; Cai, Y.; Liu, Y.; Li, X. Nuclear magnetic resonance T2 cutoffs of coals: A novel method by multifractal analysis theory. Fuel 2019, 241, 715–724. [Google Scholar] [CrossRef]
  18. Yin, L.; Wang, D.; Lu, J.; Jin, J.; Gao, J.; Liu, Y. Multifractal characteristics of slate pore structure based on nuclear magnetic resonance in cold region. Cold Reg. Sci. Technol. 2026, 242, 104733. [Google Scholar] [CrossRef]
  19. Liu, W.; Xiao, X.; Gao, P.; Zhao, Y.; Xing, Y.; Fan, Q.; Meng, G.; Li, J.; Zhou, Q.; Li, T.; et al. Nanopore characteristics of lower Cambrian shale based on gas adsorption and multifractal analysis: Implications for gas development and CO2 storage. Fuel 2026, 406, 137047. [Google Scholar] [CrossRef]
  20. Xu, C.; Wang, W.; Wang, K.; Guo, L.; Tong, Y.; Nie, Z.; Shi, Y. Non-homogeneous characterisation of nanopore structures in low-, medium- and high-rank coals based on gas adsorption and multifractal theory. Fuel 2025, 401, 135947. [Google Scholar] [CrossRef]
  21. Zhang, N.; Wang, X.; Wang, S.; Wang, R.; Wu, J.; Li, Z.; Song, Y. Multifractal characteristics on pore structure of Longmaxi shale using nuclear magnetic resonance (NMR). Geoenergy Sci. Eng. 2024, 241, 213176. [Google Scholar] [CrossRef]
  22. Yang, W.; Hou, J.; Liu, Y.; Dou, L.; Wang, X. The pore structures of different lithofacies in low-permeability sandy conglomerate reservoirs and their diagenetic impacts: A case study from the Es4 member of the northern steep slope in Dongying Depression, Bohai Bay Basin, NE China. Mar. Pet. Geol. 2022, 136, 105481. [Google Scholar] [CrossRef]
  23. Han, Y.; Jiang, Z.; Liang, Z.; Lai, Z.; Wu, Y.; Shi, X.; Duan, X.; Zhang, Y.; Li, Y. Study on the multifractal characterization and seepage of the shale matrix: A case study of the Longmaxi Formation in southwestern Sichuan Basin, China. Geoenergy Sci. Eng. 2024, 238, 212924. [Google Scholar] [CrossRef]
  24. Wang, D.; Hu, H.; Wang, T.; Tang, T.; Li, W.; Zhu, G.; Chen, X. Difference between of coal and shale pore structural characters based on gas adsorption experiment and multifractal analysis. Fuel 2024, 371, 132044. [Google Scholar] [CrossRef]
  25. Jiang, Z.; Mao, Z.; Shi, Y.; Wang, D. Multifractal Characteristics and Classification of Tight Sandstone Reservoirs: A Case Study from the Triassic Yanchang Formation, Ordos Basin, China. Energies 2018, 11, 2242. [Google Scholar] [CrossRef]
  26. Wang, J.; Jiang, F.; Hu, Q.; Zhang, C.; Yang, X.; Mo, W.; Wang, X.; Qi, Z. A quantitative model and controlling factors of secondary pore development for tight sandstone reservoirs in the carboniferous Benxi Formation, Ordos Basin, China. Mar. Pet. Geol. 2023, 148, 106034. [Google Scholar] [CrossRef]
  27. Hu, Y.; Guo, Y.; Zhang, J.; Shangguan, J.; Li, M.; Quan, F.; Li, G. A method to determine nuclear magnetic resonance T2 cutoff value of tight sandstone reservoir based on multifractal analysis. Energy Sci. Eng. 2019, 8, 1135–1148. [Google Scholar] [CrossRef]
  28. Zhao, H.; Guo, Y.; Yang, Z.; Du, X.; Hu, Y.; Kang, R.; Shangguan, J. Micro-pore multifractal characteristics of Benxi Formation sandstone reservoir in Gaoqiao area, Ordos Basin. Bull. Geol. Sci. Technol. 2020, 33, 175–184. [Google Scholar] [CrossRef]
  29. Zhao, D.; Hou, J.; Sarma, H.; Guo, W.; Liu, Y.; Xie, P.; Dou, L.; Chen, R.; Zhang, Z. Pore Throat Heterogeneity of Different Lithofacies and Diagenetic Effects in Gravelly Braided River Deposits: Implications for Understanding the Formation Process of High-Quality Reservoirs. Geoenergy Science and Engineering 2023, 221, 111309. [Google Scholar] [CrossRef]
  30. Jácomo, M.; Hartmann, G.; Oliveira, E.; Rojas, D.; Leite, E. Estimating nuclear magnetic resonance transverse surface relaxivity in pre-salt carbonates of the Santos Basin, Brazil. J. Appl. Geophys. 2025, 242, 105913. [Google Scholar] [CrossRef]
  31. Xu, Y.; Li, X.; Wu, X.; Zheng, W.; Zhou, B.; Tong, J. Experimental study on pore fluid characteristics of fractured sandstone based on nuclear magnetic resonance technology. J. Pet. Sci. Eng. 2022, 214, 110408. [Google Scholar] [CrossRef]
  32. Zhou, Y.; Wu, S.; Zhu, R.; Jiang, X.; Hua, G. A new model for determining the effective permeability of tight reservoirs based on Fractal-Monte Carlo method. Pet. Sci. 2025, 22, 3101–3118. [Google Scholar] [CrossRef]
  33. Min, B.; Xiong, G. Multivariate singularity power spectrum distribution and its application to radar target detection. Chaos Solitons Fractals 2026, 205, 117851. [Google Scholar] [CrossRef]
  34. Zhu, W.; He, X.; Lei, G.; Wang, M. Complexity analysis of three-dimensional stochastic discrete fracture networks with fractal and multifractal techniques. J. Struct. Geol. 2022, 162, 104690. [Google Scholar] [CrossRef]
  35. Kong, X.; Fan, H.; Fan, T.; Gao, Y.; Wang, H.; Mu, P.; Xiao, D. Fractal research on pores in oil and gas reservoirs—Inspirations from over 700 high pressure mercury injection experiments. Mar. Pet. Geol. 2024, 170, 107086. [Google Scholar] [CrossRef]
  36. Zhou, Y.; Wu, S.; Zhu, R.; Jiang, X.; Hua, G. A novel intermingled fractal model for predicting relative permeability in tight oil reservoirs considering microscopic pore geometry. Pet. Sci. 2025, 22, 3880–3899. [Google Scholar] [CrossRef]
  37. Zhao, P.; Wang, Z.; Sun, Z.; Cai, J.; Wang, L. Investigation on the pore structure and multifractal characteristics of tight oil reservoirs using NMR measurements: Permian Lucaogou Formation in Jimusaer Sag, Junggar Basin. J. Nat. Gas Geosci. 2017, 86, 1067–1081. [Google Scholar] [CrossRef]
  38. Ge, X.; Fan, Y.; Zhu, X.; Chen, Y.; Li, R. Determination of nuclear magnetic resonance T2 cutoff value based on multifractal theory-An application in sandstone with complex pore structure. Geophysics 2015, 80, D11–D21. [Google Scholar] [CrossRef]
  39. Zhang, N.; Wang, S.; Li, Z.; Guo, S.; Wang, R. Application of Multifractal Theory for Determination of Fluid Movability of Coal-Measure Sedimentary Rocks Using Nuclear Magnetic Resonance (NMR). Fractal Fract. 2023, 7, 503. [Google Scholar] [CrossRef]
  40. Chen, X.; Zhang, R.; Zhao, X.; Yang, J.; Lan, Z.; Luo, C.; Cai, J. Multifractal estimation of NMR T2 cut-off value in low-permeability rocks considering spectrum kurtosis: SMOTE-based oversampling integrated with machine learnin. Pet. Sci. 2023, 20, 3411–3427. [Google Scholar] [CrossRef]
  41. Liu, C.; Ning, Z.; Cole, D.; Wang, Q.; Chen, M. Experimental investigation on T2 cutoffs of tight sandstones: Comparisons between outcrop and reservoir cores. J. Pet. Sci. Eng. 2020, 191, 107184. [Google Scholar] [CrossRef]
  42. Sun, W.; Zuo, Y.; Wu, Z.; Liu, H.; Xi, S.; Shui, Y.; Wang, J.; Liu, R.; Lin, J. Fractal analysis of pores and the pore structure of the Lower Cambrian Niutitang shale in northern Guizhou province: Investigations using NMR, SEM and image analyses. Mar. Pet. Geol. 2019, 99, 416–428. [Google Scholar] [CrossRef]
  43. Zhu, X.; Lu, J.; Li, Y.; He, Q.; Li, S.; Xiao, Z.; Jiang, Q.; Chen, R.; Shi, W. Full-scale pore structure characterization and main controlling factors of marine–continental transitional shale and coal reservoirs in the Shanxi Formation, Ordos Basin, China. J. Nat. Gas Geosci. 2025, 10, 383–397. [Google Scholar] [CrossRef]
  44. Melo, M.; Guimarães, G.; Chinelatto, A.; Giannini, P.; Pontes, H.; Chinelatto, A.; Atencio, D. Kaolinite, illite and quartz dissolution in the karstification of Paleozoic sandstones of the Furnas Formation, Paraná Basin, Southern Brazil. J. South Am. Earth Sci. 2015, 63, 20–35. [Google Scholar] [CrossRef]
  45. Luo, D.; Zhang, J.; Luo, J.; Feng, Z.; Deng, C.; Bai, Y.; Shao, H.; Yan, M.; Tan, Z. Effects of smectite-illitization and hydrocarbon generation on the pore structure: A case study from the continental shales in China. J. Palaeogeogr. 2026, 15, 100298. [Google Scholar] [CrossRef]
  46. Chen, J.; Li, Q.; Zhu, R.; Mao, Z.; Chen, H. Crystal chemistry and formation of authigenic chlorite: Influence on tight sandstone reservoir in the Yanchang formation, Ordos Basin, China. Mar. Pet. Geol. 2024, 165, 106874. [Google Scholar] [CrossRef]
  47. Xu, X.; Zeng, L.; Dong, S.; Li, H.; Liu, J.; Ji, C. The characteristics and controlling factors of high-quality reservoirs of ultra-deep tight sandstone: A case study of the Dabei Gas Field, Tarim Basin, China. Pet. Sci. 2025, 22, 3473–3496. [Google Scholar] [CrossRef]
  48. Zhu, G.; Jin, J.; Xiao, Q.; Wang, L.; Sheng, G.; Tang, J.; Meng, J.; Lu, Z.; Chen, C. Key geological and engineering technologies and research directions for shale gas exploration and development in western Hubei Province, China. Energy Geosci. 2025, 6, 100460. [Google Scholar] [CrossRef]
Figure 3. Ternary phase diagram of mineral composition of rock sample.
Fractalfract 10 00153 g003
Figure 4. The mineral composition maps of various samples from the Benxi Formation in the study area.
Fractalfract 10 00153 g004
Figure 5. Pore types of tight sandstone reservoirs in the Benxi Formation determined by casting thin sections. (a) Sheet throats in the primary intergranular pores and intergranular dissolution pores (S4); (b) intergranular pores and kaolinite intercrystalline micropores (S1); (c) intragranular dissolved pores formed in feldspar (S5); (d) intragranular dissolved pores formed in rock fragments (S6); (e) intercrystalline micropores developed by illite (S8); (f) microfractures formed by intense compaction (S9).
Fractalfract 10 00153 g005
Figure 6. The mercury pressure curves of all samples determined by PMI.
Fractalfract 10 00153 g006
Figure 7. The T2 spectrum of the rock sample.
Fractalfract 10 00153 g007
Figure 8. The typical experimental results of three types of nuclear magnetic resonance were obtained through saturated and centrifugal T2 spectra. (a) The right-biased bimodal type (S3); (b) the bimodal type (S5); (c) the left-biased bimodal type (S9).
Fractalfract 10 00153 g008
Figure 9. The pore structure characteristics of S4 and S8 samples from CTS. (a,d) Pore spatial distribution of samples S4 and S8, respectively. (b,e) Connected pore space volume of samples S4 and S8, respectively. (c,f) Isolated pore space volume of samples S4 and S8, respectively.
Fractalfract 10 00153 g009
Figure 10. The single fractal curves of each sample determined by NMR. ((aj) represent samples 1–10).
Fractalfract 10 00153 g010
Figure 11. Pore-throat characteristics of typical S4 and S8 samples from the Benxi Formation. (a) Pore radius distribution. (b) Throat radius distribution. (c) Correlation between the average pore-throat radius ratio and permeability. (d) Conversion coefficient C calculation process.
Fractalfract 10 00153 g011
Figure 12. The correlation between the T2 cutoff value and porosity and permeability. ((a) T2cutoff value and porosity; (b) T2cutoff value and permeability).
Fractalfract 10 00153 g012
Figure 13. Relationship diagram of pore multifractal parameters of Benxi Formation sandstone reservoir. (a) Multifractal theory discriminant diagram. (b) Multifractal generalized dimension spectrum. (c) Relationships between multifractal parameters q and τ(q). (d) Multifractal singular spectrum.
Fractalfract 10 00153 g013
Figure 14. Correlation diagram of multifractal dimension Dq and NMR T2cutoff.
Fractalfract 10 00153 g014
Figure 15. Correlation diagram between T2cutoff and multifractal parameters Dmin-Dmax, Dmin/Dmax, △α. ((a) T2cutoff value and Dmin-Dmax, Dmin/Dmax; (b) T2cutoff value and △α).
Fractalfract 10 00153 g015
Figure 16. The influence of quartz content on the microstructure parameters. ((a) Primary intergranular pore volume; (b) median pore-throat radius of PMI; (c) maximum mercury saturation; (d) fractal parameter △α derived from NMR).
Fractalfract 10 00153 g016
Figure 17. Plots showing the effects of calcite content on pore structure parameters. ((a) Porosity; (b) permeability; (c) fractal parameters Dmin-Dmax and Dmin/Dmax from NMR; (d) △α).
Fractalfract 10 00153 g017
Figure 18. The clay mineral composition of each sample of the Benxi Formation determined by SEM. (a) Intercrystalline pores of kaolinite (S6); (b) intergranular pores filled and modified by illite and other clay minerals (S8); (c) well-preserved and simple-shaped intergranular pores (S4).
Fractalfract 10 00153 g018
Figure 19. Plots of the effects of clay mineral content on the parameters of different types of pore structures. (a,e,i) are the effects of total clay mineral content on the porosity, permeability, and single fractal parameters Dl and Ds of different types of pore structures, respectively; (b,f,j) are the effects of kaolinite content on the median pore-throat radius, Dmin-Dmax, Dmin/Dmax, and △α; (c,g,k) are the effects of illite content on the median pore-throat radius, Dmin-Dmax, Dmin/Dmax, and △α; (d,h,l) are the effects of chlorite content on the median pore-throat radius, Dmin-Dmax, Dmin/Dmax, and △α.
Fractalfract 10 00153 g019
Figure 20. The degree of influence of each mineral on porosity as determined by PCA. (a) Principal component analysis scree plot; (b) principal component analysis loading plot; (c) load matrix thermal map.
Fractalfract 10 00153 g020
Figure 21. Evolution model of different pore structures in Benxi Formation reservoir.
Fractalfract 10 00153 g021
Table 1. Petrophysical properties of the investigated rock samples.
Sample NumberDepth (m)Density (g/cm3)Porosity (%)Permeability (mD)
S12086.022.5154.3820.316
S22086.322.5234.1270.497
S32086.902.5146.1840.797
S42088.412.5227.5540.839
S52091.302.5261.8930.115
S62092.462.5221.4610.094
S72094.262.5264.8370.593
S82094.942.5212.7820.388
S92096.442.5260.7590.062
S102096.902.5240.7710.068
Table 2. Petrological characteristics of the Benxi Formation sandstone reservoir in the study area.
Sample NumberDetrital ComponentsInterstitial Components
QuartzFeldsparLithic FragmentsCalciteDolomitePyriteKaoliniteIlliteChlorite
S178.2 0.1 8.5 4.9 0.2 0.7 4.5 2.5 0.4
S280.8 0.2 8.5 2.2 0.3 0.5 4.3 2.0 1.2
S384.6 0.2 4.0 2.2 0.0 0.4 4.0 2.8 1.8
S487.5 0.1 3.0 2.4 0.1 0.0 3.7 2.9 0.3
S566.3 0.3 15.5 7.4 0.0 0.1 6.7 3.5 0.2
S667.7 0.5 16.5 4.9 0.3 0.2 5.6 4.0 0.3
S777.3 0.1 6.0 6.2 0.4 1.1 4.9 3.5 0.5
S871.7 0.5 10.0 2.7 0.5 0.3 8.5 4.3 1.5
S967.4 0.2 9.2 8.2 0.3 0.1 8.6 4.0 2.0
S1063.7 0.3 15.5 7.3 0.1 0.3 8.9 3.1 0.8
Table 3. The mercury pressure parameters of each sample determined by PMI.
Sample NumberDepth
(m)
Porosity
(%)
Permeability
(mD)
Pd
(MPa)
P50
(MPa)
Rmax
(μm)
R50
(μm)
Smax
(%)
SpType
S12086.024.3820.3160.7 2.8 1.7 0.3 79.5 2.3 II
S22086.324.1270.4970.8 3.0 1.6 0.2 78.7 2.6 II
S32086.906.1840.7970.7 1.6 2.7 0.5 88.8 2.0 I
S42088.417.5540.8390.6 0.7 2.8 0.7 82.3 1.9 I
S52091.301.8930.1151.1 10.9 0.6 0.1 80.6 2.3 II
S62092.461.4610.0941.4 16.6 0.5 0.1 72.3 3.0 II
S72094.264.8370.5931.0 16.8 1.1 0.3 81.0 2.1 II
S82094.942.7820.3881.1 12.9 1.1 0.2 75.7 2.9 II
S92096.440.7590.0621.5 49.9 0.3 0.1 62.6 4.0 III
S102096.900.7710.0681.6 61.4 0.2 0.0 62.0 3.4 III
Table 4. Results for NMR single exponent fractal dimension.
Sample NumberNMR Experimental ParametersSingle Fractal Parameters
T2cutoff (ms)Sbou (%)Smov (%)KsDsR2KlDlR2
S112.49 43.08 56.92 0.9182 2.0818 0.9127 0.1482 2.8518 0.9434
S212.10 56.38 43.62 0.9471 2.0529 0.9210 0.1172 2.8828 0.9397
S311.29 48.68 51.32 0.9394 2.0606 0.9156 0.1357 2.8643 0.9211
S414.31 48.16 51.84 0.9582 2.0418 0.9254 0.1345 2.8655 0.9205
S55.49 58.96 41.04 0.9285 2.0715 0.9194 0.0896 2.9104 0.9331
S69.76 64.96 35.04 0.9487 2.0513 0.9235 0.1269 2.8731 0.9405
S78.45 57.15 42.85 0.9366 2.0634 0.9182 0.1135 2.8865 0.9242
S84.09 57.15 42.85 0.9421 2.0579 0.9215 0.0898 2.9102 0.9398
S91.92 60.68 39.32 0.9241 2.0759 0.9172 0.0815 2.9185 0.9559
S102.44 71.37 28.63 0.9191 2.0809 0.9191 0.0998 2.9002 0.9372
Table 5. Correlation between the results for NMR single fractal dimension and porosity and permeability.
Parametersp-ValueConfidence IntervalCorrelation Index
Dl and porosity0.0564 [−0.9207, −0.1118]0.48
Dl and permeability0.0962 [−0.8777, −0.1154]0.31
Ds and porosity0.1079 [−0.8725, −0.1372]0.29
Ds and permeability0.0563 [−0.9049, −0.0168]0.41
Table 6. Multifractal parameters of tight sandstone reservoir samples.
Sample NumberDminD−2D−1D0D1D2DmaxDmin-DmaxDmin/Dmax△α
S13.622.581.980.920.81 0.78 0.71 2.79 4.93 2.763
S23.542.571.970.91 0.84 0.82 0.77 2.76 4.89 2.441
S33.42 2.551.930.92 0.83 0.80 0.74 2.72 4.89 2.656
S43.50 2.642.00 0.92 0.86 0.84 0.76 2.88 5.11 2.482
S53.20 2.321.690.93 0.75 0.70 0.63 2.43 4.16 2.921
S63.29 2.491.920.91 0.79 0.75 0.75 2.59 4.54 3.143
S73.22 2.341.760.92 0.78 0.76 0.70 2.53 4.33 2.756
S83.112.251.660.93 0.83 0.82 0.77 2.33 4.00 3.249
S93.082.231.580.93 0.84 0.81 0.78 2.31 3.99 3.266
S102.772.031.550.920.850.830.782.02 3.69 3.316
Disclaimer/Publisher’s Note: The statements, opinions and data contained in all publications are solely those of the individual author(s) and contributor(s) and not of MDPI and/or the editor(s). MDPI and/or the editor(s) disclaim responsibility for any injury to people or property resulting from any ideas, methods, instructions or products referred to in the content.