Abstract
In an epoch characterized by the swift pace of digitalization and urbanization, the essence of community well-being hinges on the efficacy of urban management. As cities burgeon and transform, the need for astute strategies to navigate the complexities of urban life becomes increasingly paramount. This study employs time series analysis to scrutinize citizen interactions with the coordinate-based problem mapping platform in the Municipality of Patras in Greece. The research explores the temporal dynamics of reported urban issues, with a specific focus on identifying recurring patterns through the lens of seasonality. The analysis, employing the seasonal decomposition technique, dissects time series data to expose trends in reported issues and areas of the city that might be obscured in raw big data. It accentuates a distinct seasonal pattern, with concentrations peaking during the summer months. The study extends its approach to forecasting, providing insights into the anticipated evolution of urban issues over time. Projections for the coming years show a consistent upward trend in both overall city issues and those reported in specific areas, with distinct seasonal variations. This comprehensive exploration of time series analysis and seasonality provides valuable insights for city stakeholders, enabling informed decision-making and predictions regarding future urban challenges.
1. Introduction
In an epoch marked by escalating urbanization and digital transformation, adeptly handling civic challenges emerges as a critical axis for the enduring well-being of communities. The burgeoning complexities of urban life necessitate meticulous strategies and smart management to navigate the multifaceted landscape of communal prosperity. Urban big data analysis, when grounded in the powerful framework of time series methodology, offers a sophisticated and insightful lens to examine the sequential data points accumulated over time. This temporal-driven approach transcends the superficial analysis of data, immersing itself in the dynamic narrative of urban transformation. As urban landscapes undergo continuous metamorphosis, the emphasis on seasonality within this analytical framework becomes not merely advantageous, but indispensable. Seasonal patterns in data can reveal a diverse range of recurring variations, influenced by external factors. These variations can range from predictable changes associated with different seasons and holidays to subtle fluctuations driven by broader economic cycles [1,2,3,4,5].
The ramifications of unearthing such temporal insights extend far beyond the confines of statistical analysis. Indeed, the value inherent in these revelations resonates deeply within the realms of urban governance, planning, and decision-making. By discerning the cyclical patterns that characterize urban phenomena, policymakers gain a nuanced understanding of the ebb and flow of various elements within the urban landscape. Urban planners, armed with this temporal awareness, can tailor strategies that align with the rhythm of the city, ensuring that interventions and developments are synchronized with the evolving needs of the community. Local authorities stand to benefit immensely from this temporal perspective, as they navigate the intricacies of resource allocation, infrastructure development, and policy formulation [4,5,6,7,8,9].
The temporal nature of urban data, with its inherent seasonality, serves as a strategic compass for those steering the course of urban development. It not only allows for retrospective analyses that unveil historical patterns, but also empowers decision-makers to project into the future. By making informed predictions based on the cyclical nature of ur-ban data, policymakers can anticipate trends, prepare for challenges, and proactively design interventions that align with the city’s temporal rhythm. In essence, the emphasis on seasonality within urban data analysis transcends statistical methodologies; it becomes a visionary tool that equips those shaping urban futures with the foresight needed to navigate the complexities of dynamic cityscapes [3,7,9,10,11,12].
The research embarks on a journey through the time series data related to citizens’ issues reported over distinct time intervals. The objective is twofold: to identify recurring patterns or trends within specific time frames and to gain insights into the temporal dynamics of reported urban issues. To achieve these goals, the study employs the seasonal decomposition technique, a method that dissects time series data into its fundamental components of trend and seasonality. This analytical approach facilitates the unveiling of hidden patterns within the raw time series data, offering a deeper understanding of the contributing factors to reported issues.
Furthermore, the study extends its scope beyond retrospective analysis, venturing into the realm of forecasting. By projecting how urban issues are anticipated to evolve over time, this research equips city stakeholders with a comprehensive view, allowing for proactive decision-making and strategic planning. The inclusion of a 7-day moving average in the analysis enhances the ability to discern underlying trends by smoothing out seasonal fluctuations, thus providing a clearer picture of the evolving urban landscape.
The subsequent sections of this paper delve into the intricacies of the time series analysis, unveiling the patterns in reported city issues and the areas affected. Notably, the study explores the impact of external factors such as major weather events, construction projects, and changes in government policies. Through a meticulous examination of seasonal patterns, trends, and projections, this research contributes to a holistic understanding of how urban challenges manifest over time, fostering a data-driven approach to urban management.
To this end, the methodology section outlines the systematic approach employed in the study. It begins with data collection from the Municipality of Patras’ problem mapping platform, establishing the empirical foundation for subsequent analyses. The core of the methodology lies in time series analysis, featuring the application of a 7-day moving average and the seasonal decomposition technique. These tools facilitate the identification of patterns, trends, and seasonality within the reported urban issues. The forecasting component extends the analysis into the future, providing a forward-looking perspective. The use of statistical tools and Python programming enhances the rigor and precision of the methodology. The Results section unfolds the insights derived from the time series analysis. It commences with an exploration of daily areas, revealing a general upward trend in reported issues with distinct seasonal fluctuations. The application of a 7-day moving average refines this analysis, highlighting contributing factors and offering a clearer view of underlying trends. The seasonal decomposition technique dissects city areas and reported issues, unveiling stable seasonal patterns and a growing prevalence of reported issues over time. Projections for future urban challenges further reinforce the findings. Visual aids, including time-series plots and seasonal decomposition analyses, enhance the interpretability of the results.
Section 4 initiates the discussion that digs into the nuanced interpretation of the results. It elaborates on the implications of seasonality, the impact of external factors on fluctuations, and the dynamic interplay between city-wide trends and area-specific characteristics. The forecasting component is scrutinized for its relevance to urban management, offering insights into resource allocation and policy formulation. The discussion not only underscores the value of the findings for city stakeholders, but also acknowledges the study’s limitations, paving the way for future research directions. Ultimately, the discussion synthesizes the multifaceted aspects of the research, providing a comprehensive understanding of the temporal dynamics of citizen-reported urban issues.
The Conclusions, Section 5, serves as the culmination of the research, summarizing key findings and their implications. It reiterates the importance of a data-driven approach to urban management, emphasizing how the study contributes to this evolving field. The concluding remarks reflect on the broader significance of the research for policymakers, urban planners, and local authorities. The limitations are acknowledged, encouraging future research to refine methodologies and enhance the precision of urban issue forecasting. Overall, the conclusion reinforces the transformative potential of time series analysis and seasonality in unraveling the intricate web of citizen-reported urban challenges in the Municipality of Patras.
Related Work
In this comprehensive literature review, several studies contribute valuable insights into the spatiotemporal dynamics of critical challenges in different urban sectors. Reference [13] investigates the spatiotemporal dynamics of Information and Communication Technology (ICT-H + i) and socio-economic Sustainable Development Goals (SDGs) in European regions from 2011 to 2020. It highlights the significant progress made in the implementation of ICT-H + i and SDGs post-COVID-19, with the pandemic altering ICT-H + i usage and impacting SDGs in economic and social dimensions. The spatiotemporal approach underscores the importance of in-depth analysis of ICTs’ contribution to sustainability, particularly given the shortage of regional indicators for Europe, and emphasizes its relevance for regional policy development within Europe’s digital transformation strategy. Meanwhile, ref. [14] introduces an innovative spatiotemporal methodology aimed at addressing the global need for sustainable resources, with a specific focus on renewable feedstock. This comprehensive approach evaluates feasibility by considering both geographical and temporal factors, integrating dynamic assessments of processes with geospatial data to determine optimal configurations while minimizing costs. The study emphasizes the critical importance of incorporating both geographical and temporal characteristics for building a sustainable case, and encourages exploring various scenarios to analyze the temporal impact on decisions, thereby extending the methodology’s applicability to different frameworks, scenarios, and processing technologies.
In the study of [15], the authors employ the impervious surface aggregation-density method to extract urban built-up areas across 12 major cities in China from 1995 to 2015, examining the spatiotemporal evolution of urban expansion. The spatiotemporal analysis exposes significant differences in the area growth and expansion rate of southern and northern cities, urging policy adjustments at both regional and national levels. The findings provide a valuable spatiotemporal reference for global urbanization research, emphasizing the importance of sustainable development concepts in future urban policies. The article [16] incorporates a time series analysis to study urban resilience in 110 prefecture-level cities within the Yangtze River Economic Belt in China from 2005 to 2018. The study reveals a consistent upward trend in urban resilience, indicating improvement in the area’s ability to withstand risks. Fluctuations in resilience gaps between cities are observed, with economic factors playing a dominant role in spatial differentiation. These findings emphasize the importance of considering temporal dynamics in enhancing regional and national sustainable development policies.
This study [17] conducted in the Xiangjiang River Basin (XJRB) from 1990 to 2020 investigates the spatial and temporal distributions of ecosystem services (ESs) in the context of urbanization factors. The research identifies a nonlinear relationship between urbanization and ESs, with distinct thresholds indicating changes in this relationship. The change-over-time method highlights key periods of change (1992–1995 and 2008–2013) in the urbanization-ESs relationship. The impact of urbanization on ESs is revealed to be spatially heterogeneous, influenced by both natural and anthropogenic drivers. The researchers in [18] employ a comprehensive approach, emphasizing time series analysis to uncover shifts in spatiotemporal activity patterns during the last pandemic. Using a participatory GIS platform, citizens from three districts of a Dutch city map their activity routines before and during the lockdown, revealing evolving behavioral trends. This analysis offers insights into urban social resilience dynamics, highlighting district-specific variations influenced by local amenities, green spaces, and socio-economic factors. The study advocates for equitable resource distribution, functional flexibility, and thoughtful urban planning to address future challenges.
Another research [19] performs a comprehensive analysis of the spatial-temporal evolution of ecological quality in Chinese urban agglomerations. Utilizing GIS and Geo Detectors, the study reveals varying annual change rates in ecological quality, with higher levels observed in the east compared to the west. The spatiotemporal analysis highlights important patterns of agglomeration and underscores the importance of understanding time-varying drivers and spatial expressions for informing urban policies. In the comprehensive work of [20], the authors apply a multidisciplinary approach to investigate the early evolution of the last pandemic across 14 South American urban sites. Utilizing a spatiotemporal framework, the study analyzes daily new case incidence rates alongside meteorological and climatic variables. Significant associations are found between pandemic rates and various factors, including temperatures, relative humidity, precipitation, and demographic variables.
The study of [21] examines the relationship between urban growth and vegetation greenness in 340 Chinese cities using multi-temporal remotely sensed data. Despite typical vegetation greenness lagging behind urban growth, a trend of consistent acceleration is observed, challenging assumptions about inevitable vegetation loss during urbanization. The study emphasizes the need for balancing urban expansion with greenery protection for sustainable development. The paper [22] focuses on the 11th Sustainable Development Goal (SDG) related to sustainable cities. The research proposes a method to create temporal building height maps, correlating them with environmental variables from remote sensing satellites. Significant improvements over existing maps in Berlin and London are demonstrated. The study explores the correlation between environmental variables and height map features in neighborhoods, offering insights for urban planning and development. Researchers in [23] analyze carbon emissions from the urban public transportation system (UPTS) during the COVID-19 pandemic in Beijing. Conducting a spatiotemporal analysis of UPTS carbon footprints using smart card data, they introduce a novel multi-layer urban rail network model for estimating passenger volume and trip trajectories. Key findings include lower emissions during holidays, significant contributions from peak hours, and a positive correlation between bus and urban rail transit carbon footprints. In the research of [24], the authors introduce a novel framework for fine-grained information extraction and dynamic spatial-temporal awareness in disaster-stricken areas using social media data. Applied to a case study of urban floods in Anhui, China, the framework reveals significant spatial and temporal consistency between flooding hotspots and rainfall centers.
The article [25] explores the influence of urbanization on coastal processes and Sea Surface Temperature (SST) along Mumbai’s coast over a 20-year period. Using meteorological and air quality parameters, the research identifies a rising trend in SST through time-series analysis and modeling. The findings reveal significant warming along Mumbai’s coastline, emphasizing the city’s impact on coastal waters. The researchers in [26] explore the impact of ambient temperatures on mortality in Pune, India. Applying a time series regression model spanning from 2004 to 2012, the study analyzes daily mean temperature and all-cause mortality records. The study recommends the implementation of a weather-related early warning system to protect vulnerable groups, underscoring the importance of further investigations into the weather’s incremental impact on health. The primary objective of the paper [27] is to critically examine the impact of Urban Heat Islands (UHIs) on maximum (Tmax) and minimum daily temperatures (Tmin) in urban and non-urban observatories across five major cities in Spain. Through time series analysis, the study highlights the heightened influence of UHIs on Tmin, particularly in coastal cities, and their repercussions on morbidity and mortality during heatwaves. The findings emphasize the need for localized investigations to inform population adaptation strategies in the face of rising temperatures and climate change. Utilizing time series analysis, the research [28] investigates how UHIs impact temperature-related mortality in eight Swiss cities. Focusing on UHIs, residential greenness, and neighborhood socio-economic factors, the study examines individual death records from 2003 to 2016. Results indicate an escalation of mortality risk within certain temperature ranges during the warm season, with UHI areas showing in-creased risk compared to non-UHI areas. The research underscores the importance of comprehensive urban planning approaches and advocates for tailored early warning systems suited to specific urban conditions.
2. Materials and Methods
In a contemporary landscape marked by the swift advancements of smart urban methodologies and the transformative waves of digital evolution, a pivotal focus is arising on the necessity to confront challenges faced by citizens. The intricate network of urban life demands adaptable strategies and astute management to traverse the diverse landscape of community concerns. Leveraging urban big data analysis within the robust framework of time series methodology unveils a nuanced perspective, facilitating the meticulous exploration of successive data points gathered over time. This time-centric approach transcends conventional data analysis, delving into the dynamic realm of urban transformation.
This study focuses on exploring the dynamic urban landscape of the Municipality of Patras, Greece, which faces diverse challenges amid rapid urbanization. Utilizing a dataset comprised of 144 text files containing N = 93,053 citizen reports obtained through the Sense City platform API, this research delves into the multifaceted issues shaping the city’s development. Launched on 1 January 2018, the Sense City platform serves as a vital link between the municipality and its residents, enabling anonymous reporting of various issues via web and mobile applications. Citizens can submit reports detailing the type and location of problems using coordinates, with authentication via email or mobile phone. They receive updates on their requests’ progress via email, fostering interaction with municipal services and addressing urban challenges. The frequency of reports over time is quantified by the formula f(t) = T/N, where N represents the total number of citizen reports and T denotes the duration over which the reports were collected. This formula offers insights into the frequency of submissions within the dataset, facilitating a deeper understanding of urban dynamics.
Formatted in JSON, each report is composed of essential details, including a distinctive report identifier (id), a bug identifier (bug_id), the present status of the reported issue (status), geographical coordinates (loc), the type of reported issue (issue), a bilingual description in both Greek and English (value_desc), and the timestamp indicating when the report was submitted (reported). These details contribute to a comprehensive understanding of reported incidents, covering aspects such as nature, location, and reporting status. Below is an exemplar of a solitary report from an individual citizen in JSON format:
{
“_id”: “65185ddc679a5c9c140e1ca3”,
“bug_id”: 143041,
“status”: “CONFIRMED”,
“loc”: {
“type”: “Point”,
“coordinates”: [
21.7293576,
38.2445062
]
},
“issue”: “lighting”,
“value_desc”: “\u039a\u03b1\u03bc\u03bc\u03ad\u03bd\u03bf\u03c2 \u039b\u03b1\u03bc\u03c0\u03c4\u03ae\u03c1\u03b1\u03c2”,
“reported”: “2023-09-30T17:41:50.558Z”
},
The detailed report encompasses the following key elements: _id: “65185ddc679a5c9c140e1ca3” (Unique identifier for the report), bug_id: 143041 (Bug identifier associated with the report), status: “CONFIRMED” (Current status of the reported issue, indicating that it has been confirmed), loc: {“type”: “Point”, “coordinates”: [21.7293576, 38.2445062]} (Location information for the reported issue, specifying that it is a point on the Earth’s surface with latitude 38.2445062 and longitude 21.7293576), issue: “lighting” (Type or category of the reported issue, indicating a problem related to lighting), value_desc: “Καμμένος Λαμπτήρας” (It is encoded using Unicode escape sequences specifically in Greek. When decoded, it represents the text “Καμμένος Λαμπτήρας”, which translates to “Burnt Lamp” in English; this is a common method of representing non-ASCII characters in a Unicode string using escape sequences), reported: “2023-09-30T17:41:50.558Z “(Date and time when the issue was reported, which is 30 September 2023, at 17:41:50 UTC).
This report offers comprehensive information regarding a confirmed issue concerning the lighting in a public area within a neighborhood. The reported problem specifically pertains to a burnt lamp. The report includes crucial details such as location coordinates, current status, and a timestamp indicating when the issue was reported. Both the “bug_id” and “id” function as unique identifiers, enabling efficient tracking and referencing of the report. The reports cover a wide range of locations in Patras, demonstrating the diversity of citizen concerns across the city. This spatial distribution offers valuable insights into localized challenges and contributes to a deeper understanding of the dynamics of urban issues. Categorizing reported problems in the “issue” field highlights the breadth of concerns raised by citizens, ranging from road construction to public space issues.
From an anonymity perspective, the provided JSON structure appears to prioritize the details of the reported issue and its location, avoiding the disclosure of personal information about the reporting citizen.
Embarking on our exploration of the intricate mosaic of urban life, the study delves deep into the neighborhood level, where the temporal transformative influence of citizen report analytics and predictive modeling takes center stage. This study seamlessly integrates Extract, Transform, Load (ETL) processes, placing a profound emphasis on time series analysis and leveraging the capabilities of Python programming language. Time series analysis stands out as a foundational methodology within this framework, methodically revealing temporal patterns and trends woven into sequential data. This analytical approach empowers researchers to extract invaluable insights, make informed predictions, and cultivate a profound understanding of the dynamic nature inherent in urban issues. As we immerse ourselves in time series analysis for both urban and region-specific issues, our overarching objective is to furnish policymakers with a robust toolbox for deciphering the concealed underlying patterns within the data.
The methodology gets underway with an examination of daily reported issues extracted and processed from a vast data repository. An initial time series plot unveils the underlying trends, providing a foundational understanding of the issue landscape. Subsequently, the paper employs a 7-day moving average to smooth out the granular fluctuations, revealing subtler patterns and assisting in identifying discernible trends. These techniques effectively illustrate the ebb and flow of reported issues on a daily basis, establishing a solid foundation for further in-depth analyses.
Moving beyond the basics, this methodology incorporates seasonal decomposition for a detailed understanding of cyclical patterns within the data. This process breaks down the time series into components—trend, seasonality, and residuals—providing a comprehensive picture of the underlying dynamics. In addition, this paper extends the analysis to urban areas, recognizing that the dynamics of the mentioned issues may differ significantly between different areas. Using similar time series techniques, it gains insight into the temporal dynamics of both urban issues and neighborhoods, providing a holistic picture of the challenges facing the city.
In this neighborhood-centric approach, the article also incorporates prediction techniques such as Triple Exponential Smoothing Holt-Winters. This enables the projection of future values, facilitating proactive decision-making based on expected trends. Through this multifaceted methodology, researchers can not only visualize historical patterns but also anticipate future challenges and opportunities, ultimately contributing to more efficient urban planning and resource allocation. Exploration through time series analysis is part of the initial stage in uncovering the complexity of urban issues and regions. Figure 1 illustrates the time series analysis methodology.
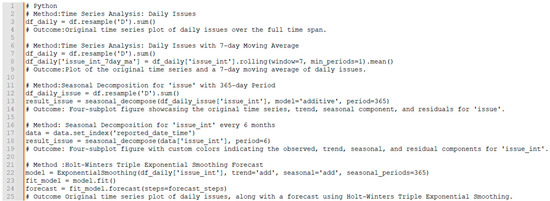
Figure 1.
Time series analysis methods.
Table 1 serves as a comprehensive statistical summary of the output from the data lake, providing a detailed overview of the entities within the dataset, encompassing distribution, central tendency, and variability of the numerical columns. The terminal output furnishes a statistical breakdown of the generated data, and the following is an elaborate explanation of each segment:

Table 1.
The statistical summary of the generated data.
Count: These columns display the total number of non-null entries in the dataset, denoting the overall record count.
Unique: This section showcases the count of unique values within each column.
Top: It reveals the most frequently occurring value in each specified column.
Freq: Indicates the frequency of occurrence for the top value in the respective columns.
Mean: Represents the average value for each numeric column.
Std: Displays the standard deviation, reflecting the dispersion of values in each numeric column.
Min: Shows the minimum value present in each numeric column.
25%, 50%, 75%: These values denote the quartiles, providing insights into the distribution of the data.
Max: Displays the maximum value present in each numeric column.
The table presents a valuable initial overview, facilitating the identification of common areas and prevalent issues through the ‘Top’ and ‘Freq’ columns. Stakeholders can discern the areas most frequently reported and the predominant issues in the dataset. Moreover, the statistical measures—such as mean, standard deviation, and quartiles—offer insights into the distribution and variability of numeric columns. For instance, examining the spread of reported dates and times through quartiles provides a nuanced understanding of when issues are more likely to be reported.
Essentially, this section has delineated the methodological framework utilized in examining the temporal dynamics of citizen-reported urban challenges. It includes a Time Series Analysis focusing on neighborhood issues derived from citizen reports across various city areas. The detailed presentation elucidates the nature and distribution of the data, providing readers with a solid foundation as they progress to the subsequent section for a deeper exploration of the study’s outcomes.
3. Results
This section presents the results of the previous methodologies to analyze data derived from citizen interaction with the coordinate-based problem mapping platform of the Municipality of Patras.
Time series analysis is a powerful statistical technique used to analyze sequential data points collected over time. This method provides meaningful insights, identifies patterns, and makes predictions based on the temporal order of observations. One key aspect of time series data is seasonality, a recurring pattern that occurs at regular intervals. Seasonality refers to the periodic fluctuations or patterns that repeat over a specific time frame, often influenced by external factors such as seasons, holidays, or business cycles. Understanding seasonality is crucial for various fields, including finance, economics, meteorology, and, in this case, urban data analysis.
In this analysis, the work delves into the time series data related to citizens’ issues reported over time. The paper explores the concept of seasonality, investigating whether there are recurring patterns or trends within specific time intervals. The goal is to gain insights into the temporal dynamics of reported urban issues, helping us identify regularities, anomalies, and potential factors contributing to the observed patterns.
To accomplish this, we will employ the seasonal decomposition technique, a method that breaks down a time series into its components—trend, seasonality, and residuals. By dissecting the data in this manner, we aim to uncover underlying patterns in reported city issues and city areas that may be obscured in the raw time series.
Furthermore, we extend our analysis to include forecasting, providing a comprehensive view of how urban issues are anticipated to evolve over time. By examining the temporal nature of the data, this exploration of time series analysis with a focus on seasonality equips us to make informed decisions and predictions regarding future urban challenges. This analysis will provide a holistic view of how urban issues vary over time, enabling city stakeholders to make informed decisions and predictions based on the temporal nature of the data.
Let us begin this exploration of time series analysis with a focus on seasonality and forecasting to unravel the dynamics of urban issues over distinct time intervals.
Figure 2 generates a time series plot of the sum of areas by day, for the entire time span of the data. The plot shows that there has been a general increase in the sum of areas over time, with some seasonal fluctuations. The seasonal fluctuations are likely due to the fact that some types of issues are more common during certain times of year (e.g., some issues are more common during the summer months). The plot also shows that there have been some spikes in the sum of areas at certain points in time. These spikes could be due to a number of factors, such as: Major weather events (e.g., storms, floods, etc.), Construction projects, Changes in government policy or regulations, and Increased awareness of the platform and its features.
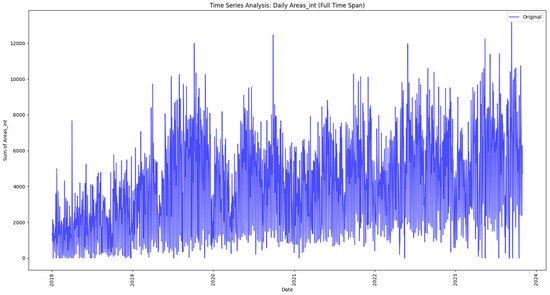
Figure 2.
Time analysis of daily areas.
The simple time analysis of daily areas shows a general upward trend in the sum of areas over time. This indicates that the total number of issues being reported to the SenseCity platform is increasing. However, the simple time analysis does not provide any insights into the underlying causes of this trend or the seasonal fluctuations in the data. The time series plot of daily areas with a 7-day moving average reveals a more nuanced picture of the data (Figure 3). The general upward trend is confirmed, but the 7-day moving average helps to smooth out the seasonal fluctuations. This makes it easier to identify spikes in the data, which can be helpful for identifying potential contributing factors.
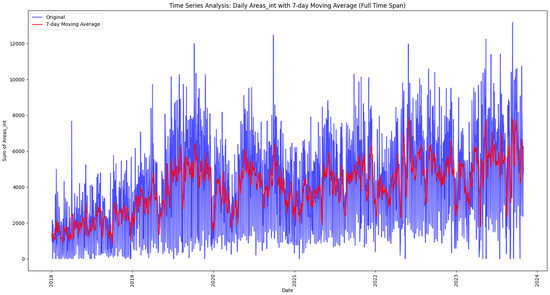
Figure 3.
Time analysis of daily areas with a 7-day moving average.
The key difference between the simple time analysis and the time series plot with a 7-day moving average lies in their ability to reveal the underlying trend and seasonal fluctuations in the data. The simple time analysis only shows the raw values of the data, which can make it difficult to see the overall trend or the impact of seasonal factors. The time series plot with a 7-day moving average, on the other hand, effectively smooths out the seasonal fluctuations and highlights the spikes in the data, making it easier to identify potential contributing factors.
The time series plot of daily areas with a 7-day moving average shows a clearer upward trend in the sum of areas over time compared to the time series plot of daily areas. This is because the 7-day moving average smooths out the seasonal fluctuations in the data, allowing us to focus on the overall trend. In addition, the time series plot of daily areas with a 7-day moving average highlights the spikes in the data. These spikes can be helpful for identifying potential contributing factors, such as weather events, construction projects, or public awareness campaigns.
A more detailed analysis of the spikes in the time series plots of reported areas is presented in Table 2.
Table 2.
Detailed analysis of spikes in the time series plots of reported areas.
The time series plot of Figure 4 shows the number of issues reported to the platform in Patras, Greece, from 2018 to 2023. The absence of the 7-day moving average in the analysis of daily city issues returns the general trend of the number of issues reported to the city platform time and is a useful way to see the overall trend of issue reporting, but it can be difficult to see the smaller fluctuations in the data. The trend is generally upward, with some seasonal fluctuations and spikes. This suggests that the number of issues being reported to the platform is increasing over time. The presence of the 7-day moving average analysis, Figure 5, is a useful way to confirm the overall trend of the issue report and the fluctuations in the data. This means that it calculates the average of the issue for each day, taking the previous seven days into account. In summary, it plots the number of issues reported each day and applies a smoothing technique to visualize trends. The blue line represents the original time series, and the red line represents the 7-day moving average. The plot shows that there has been a general increase in the number of issues reported over time. There are also some seasonal fluctuations, with more issues being reported during the summer months. The 7-day moving average helps to smooth out these fluctuations and reveal the underlying trend. The following are some key observations from the plot: the number of issues reported has been increasing steadily over time; there are some seasonal fluctuations, with more issues being reported during the summer months; the 7-day moving average shows a more gradual increase in the number of issues reported; there were some peaks in the number of issues reported in early 2021 and mid-2022.
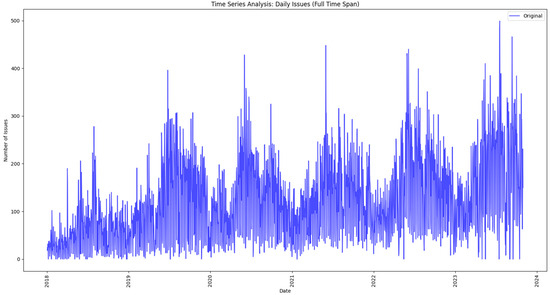
Figure 4.
Time analysis of daily city issues.
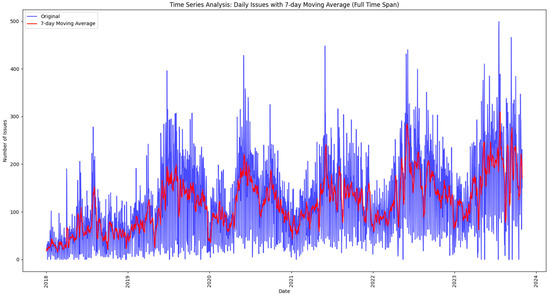
Figure 5.
Time series analysis: daily issues with a 7-day moving average.
The seasonal fluctuations are likely due to a variety of factors, such as the weather, tourism (especially domestic tourism), and the availability of outdoor activities. For example, there are more issues reported during the summer months, when there are more tourists in Patras and people are more likely to be spending time outdoors. The spikes in the data could be due to a number of factors, such as construction projects, public awareness campaigns, and changes in government policy or regulation. For example, there was a spike in the data in early 2021, which could be due to the increased awareness of the platform following its updates in late 2020. Overall, the time series plot suggests that the number of issues being reported to the city platform in Patras is increasing. This is a positive sign, as it indicates that the platform is being used more regularly by residents and that the city is becoming more aware of the issues that need to be addressed. The following Table (Table 3) is a detailed analysis of the spikes in the time series analysis of the issues.
Table 3.
Detailed analysis of spikes in the time series plots of reported issues.
Time series analysis of the number of issues reported on the city platform shows a general upward trend, with some seasonal fluctuations and peaks. The time series analysis of areas, on the other hand, shows a stronger upward trend, with fewer seasonal fluctuations and peaks. This suggests that the number of issues reported on the city platform is growing at a faster rate than the number of areas with high concentrations of reported issues. The time series analysis of areas shows that the number of areas with high concentrations of reported issues is increasing at a slower rate than the number of issues being reported to the city platform. This suggests that the issues in the city are becoming more widespread, with more areas experiencing issues. This could be due to a number of factors, such as increased urbanization, as the city becomes more densely populated, it is more likely for issues to arise. Changes in demographics, the city’s demographics are changing, with an increasing proportion of elderly residents and young families. These groups may be more likely to experience certain types of issues, such as accessibility. Changes in the built environment: the city’s built environment is changing, with new development projects and infrastructure upgrades. These changes may also lead to new issues.
The following analysis improves understanding of the underlying patterns of city areas and issues as reported by citizens, including any trends, seasonality, and residual patterns. The ‘seasonal_decompose’ function from ‘statsmodels.tsa.seasonal’ decomposes the time series into these components, making it easier to analyze and interpret the individual contributions to the overall behavior. Figure 6 presents a seasonal decomposition time series analysis for the city areas and highlights that there is a clear seasonal pattern in the area data. The number of areas with high concentrations of reported issues is typically higher during the summer months and lower during the winter months. This is likely due to a number of factors, such as increased external and internal tourism, increased construction activity, and changes in weather patterns. The trend component of the time series analysis shows that there is a general upward trend in the number of areas with high concentrations of reported issues. This suggests that the problem of areas with high concentrations of reported issues is becoming more widespread. The seasonal component of the time series analysis shows that the seasonal pattern in the data is relatively stable over time. The residual component of the time series analysis shows that there is some variability in the data that is not explained by the trend or seasonal components. This variability could be due to a number of factors, such as random events.
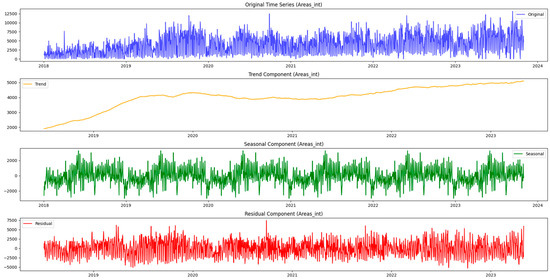
Figure 6.
A seasonally decomposed time series analysis for areas.
Figure 7 illustrates the time series analysis of the issues and highlights that there is a clear seasonal pattern in the data and, in general, is in alignment with the seasonally decomposed time series analysis of areas. The number of issues reported to the platform is typically higher during the summer months and lower during the winter months. The trend component shows that there is a general upward trend in the number of issues. This suggests that the problem of issues in Patras is becoming more widespread over time.
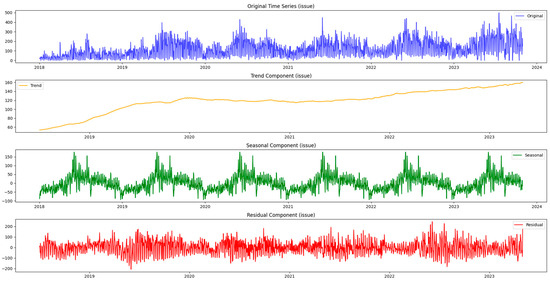
Figure 7.
A seasonally decomposed time series analysis for issues.
The seasonal component of the time series analysis shows that the seasonal pattern in the data is relatively stable over time. The residual component of the time series analysis shows that there is some variability in the data that is not explained by trend or seasonal components and may be due to random events. Figure 8 and Figure 9 present the analysis of the time interval of 3 and 6 months for the city issues.
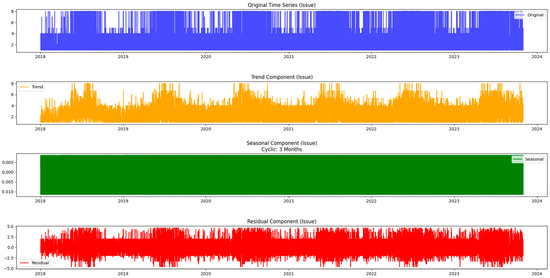
Figure 8.
The seasonal component indicates a 3-month cyclical behavior for issues.
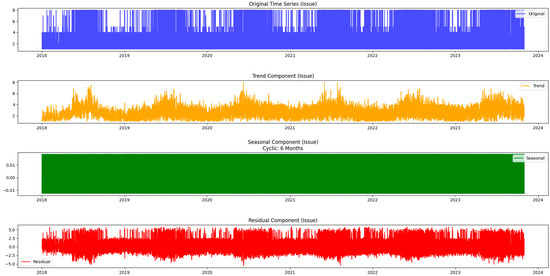
Figure 9.
The seasonal component indicates a 6-month cyclical behavior for issues.
The main difference between the two images is that the cyclical component of the data in the 6-month image is a little more pronounced than the one in the 3-month image. This could suggest that cyclical fluctuations in the data occur over a longer period of time than previously thought. Another difference between the two images is that the trend component of the data in the 6-month image is more upward-sloping than the trend component of the data in the 3-month image. This likely suggests that the number of issues reported on the city’s platform is increasing at a faster rate than previously thought.
Figure 10 and Figure 11 present the analysis of the time interval of 3 and 6 months for the city issues. Both graphs show that the number of areas reported is steadily increasing and provides strong seasonal but more stable trends in area-specific reports compared to issues. The residual component of the time series analysis in images shows that the variability in the data is due to random events such as various annotations of instructions or other markings made by citizens.
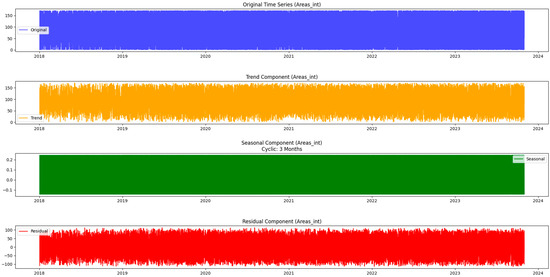
Figure 10.
The seasonal component indicates a 3-month cyclical behavior for Areas.
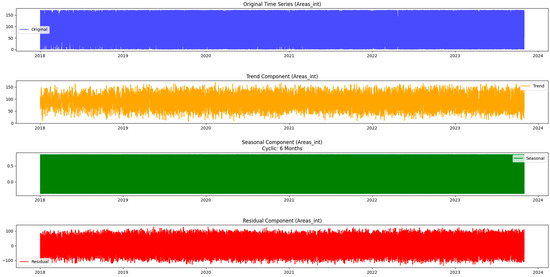
Figure 11.
The seasonal component indicates a 6-month cyclical behavior for Areas.
Because of the trends depicted in the data set, researchers extend the time series analysis by applying the Holt–Winters method, which is particularly useful when dealing with trending time series data. More specifically, this work uses Holt–Winters Triple Exponential Smoothing, a time series forecasting technique that extends the Holt–Winters method to handle trend and seasonality as well. The result provides a visual representation of the original time series and the forecasted values, allowing somebody to capture future trends and seasonality in the data. Figure 12 and Figure 13 highlight the projected values of city and town issues over the coming years.
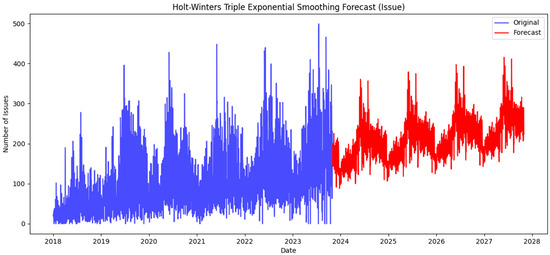
Figure 12.
The Holt–Winters Triple Exponential Smoothing Forecast for city issues.
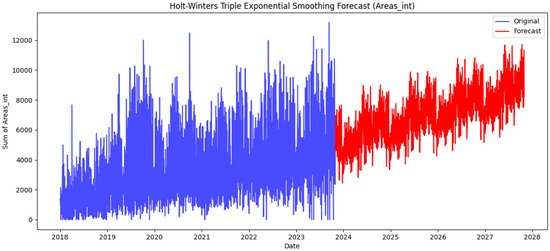
Figure 13.
Τhe Holt–Winters Triple Exponential Smoothing Forecast for city areas.
An initial observation reveals a consistent upward trend in both the overall issues reported in the city and the issues reported in specific areas over the next few years. For the city-wide problems, the seasonal variations exhibit a constant pattern, marked by pronounced peaks during the summer months. This suggests a recurring pattern of increased reporting during these warmer seasons. In contrast, when examining issues within specific regions, the seasonality is intricately woven into the overall trend. The trend reflects the dynamic nature of areas in reporting problems, highlighting fluctuations that align with the unique characteristics of each neighborhood. This nuanced approach captures the interplay between the overarching trend and the seasonal dynamics of reported issues in different areas.
4. Discussion
The authors of this study developed a custom Python approach to emphasize the significance of temporal analysis in understanding citizen engagement with urban issues. They emphasize the transformative power of time series analysis in comprehending the temporal patterns of citizen-reported concerns. This investigation delves into this contemporary context, focusing on the dynamic fabric of civic life within the Municipality of Patras, Greece—a setting navigating the intricate interplay of smart challenges and opportunities brought about by the rapid digital and urban growth taking place within its borders. By introducing the concept of seasonality, the groundwork is laid for a detailed exploration of recurring patterns and trends within the dataset derived from the city heart. Table 4 summarizes the main points concisely in a structured manner, making it easier for readers to grasp the key findings of the study.
Table 4.
The summary of the main points of this study.
While the analysis of this study provides valuable insights, it is essential to acknowledge certain limitations. The dataset’s completeness and representativeness, as well as the potential biases in citizen reporting, could influence the results. Future research could delve into the refinement of forecasting models, incorporating additional variables, and refining the granularity of area-specific analyses for more precise insights.
In comparison to the existing literature on spatiotemporal dynamics in various urban sectors, the methodology employed in this study offers several distinct advantages:
Focus on Citizen-Reported Urban Challenges: Unlike many studies in the literature that focus on broader urban phenomena such as ICT implementation, urban expansion, or environmental quality, this study uniquely centers on the temporal dynamics of citizen-reported urban challenges within a specific municipality. By leveraging citizen engagement and digital platforms, it provides insights into the evolving nature of civic concerns over time.
Comprehensive Time Series Analysis: The methodology employed in this study utilizes a comprehensive time series analysis approach, including techniques such as seasonal decomposition and Holt–Winters Triple Exponential Smoothing. This allows for a detailed examination of temporal patterns in citizen-reported issues, offering valuable insights for urban management and policy formulation.
The Holt–Winters Triple Exponential Smoothing method stands out as a robust and effective technique among the plethora of available methods. One of its primary advantages lies in its capability to handle complex seasonal patterns inherent in time series data. Unlike simpler forecasting methods, Holt–Winters accounts for both trend and seasonality simultaneously, making it particularly suitable for datasets with pronounced seasonal variations. This characteristic ensures that the forecasts generated by Holt–Winters are not only accurate but also reflective of the underlying patterns present in the data. Additionally, Holt–Winters Triple Exponential Smoothing is an adaptive technique, adjusting its forecasts based on the most recent observations. This adaptability is crucial in dynamic environments where underlying patterns in the data may change over time. By incorporating the latest information available, Holt–Winters ensures that its forecasts remain relevant and accurate, even in the face of evolving trends or seasonality. This technique provides confidence intervals for its forecasts, allowing analysts to assess the uncertainty associated with the predictions. This feature is invaluable for decision-making, enabling stakeholders to understand the range of potential outcomes and make informed choices accordingly. By quantifying uncertainty, Holt–Winters enhances the reliability and usefulness of its forecasts in practical applications. Moreover, Holt–Winters Triple Exponential Smoothing exhibits robustness against outliers and irregularities in the data. Through its smoothing process, the method mitigates the impact of noise and anomalies, resulting in more stable forecasts. This robustness ensures that Holt–Winters remains effective even in the presence of data artifacts, enhancing its reliability and utility in real-world forecasting scenarios. Furthermore, this technique is versatile and adaptable to various types of time series data. It can accommodate different levels of trend smoothing and seasonality smoothing, as well as handle both additive and multiplicative seasonality. This flexibility allows Holt–Winters to accurately model a wide range of time series datasets, making it a valuable tool in diverse forecasting applications [29,30].
Tailored Interventions and Forward-looking Perspective: Through distinct analyses for city-wide trends and areas, this study highlights the dynamic relationship between overall trends and neighborhood characteristics. Furthermore, the forecasting component provides a forward-looking perspective on urban issues, enabling stakeholders to anticipate challenges and allocate resources efficiently.
Contribution to Smart Urban Management: This study contributes to the evolving field of smart urban management by emphasizing the importance of citizen engagement and data-driven decision-making. By unraveling intricate patterns and trends in civic concerns, it provides a valuable roadmap for addressing dynamic urban challenges.
In summary, the methodology employed in this study offers a unique and valuable contribution to the literature by focusing on citizen-reported urban challenges and employing a comprehensive time series analysis approach. Through careful consideration of limitations and future directions, the aim is to enhance the effectiveness and applicability of the methodology in addressing the evolving dynamics of urban issues.
5. Conclusions
This effort digs into the temporal dynamics of citizen-reported urban challenges within the vibrant Municipality of Patras, Greece. By emphasizing the significance of citizen engagement and leveraging digital platforms, particularly through the lens of time series analysis, the research sought to unravel the intricate patterns and trends inherent in civic concerns. Essentially, by adopting a robust methodology based on time series analysis, this study makes a substantial contribution to the evolving field of smart urban management. It provides a valuable road map for effectively addressing the dynamic and asynchronous nature of today’s civic challenges.
Analyzing seasonality in the dataset unveiled variations in urban issues, peaking in summer and decreasing in winter, offering crucial insights into the influence of external factors like tourism, construction, and weather patterns. The utilization of a 7-day moving average played a key role in identifying factors contributing to reported issue fluctuations, encompassing major weather events and policy changes. Distinct analyses for city-wide and specific areas highlighted the dynamic relationship between overall trends and unique neighborhood characteristics, facilitating tailored interventions.
The forecasting component provided a forward-looking perspective, revealing a consistent upward trend in urban issues. This emphasized the enduring necessity for civic engagement and proactive urban management. Historical data-based projections emerged as a valuable tool, aiding city stakeholders in anticipating challenges and optimizing resource allocation efficiently. The implications of this study for urban management and policy formulation are substantial. Deciphering the temporal dynamics of citizen-reported urban issues provides stakeholders with a thorough comprehension of the likely timing and locations of challenges. This awareness empowers proactive decision-making, allowing for resource allocation in anticipation of needs and facilitating the implementation of targeted interventions.
As Holt–Winters Triple Exponential Smoothing remains a popular choice for its simplicity and efficiency, future exploration of alternative methods may provide additional information and improve prediction accuracy in some scenarios. Prophet is a forecasting tool developed by Facebook that combines components of time series decomposition, regression, and seasonal effects modeling. It is designed to handle time series data with multiple seasonality and irregular trends. Prophet automatically detects changepoints and holidays in the data and provides intuitive parameter tuning options, making it user-friendly for non-experts. Long Short-Term Memory (LSTM) networks are a type of recurrent neural network (RNN) that can capture long-term dependencies in sequential data. Unlike traditional statistical methods like Holt–Winters, LSTM networks can learn complex patterns and relationships from the data without explicit feature engineering. LSTM networks are particularly effective for time series forecasting tasks with large amounts of data and nonlinear relationships [29,30].
Furthermore, while the analysis provides valuable insights, certain limitations, such as dataset completeness, representativeness, and potential biases in citizen reporting, have been acknowledged. Future research directions may involve refining forecasting models, incorporating additional variables, and enhancing the granularity of area-specific analyses for more precise insights. More specifically, the implementation of time series models in smart cities presents challenges that demand careful consideration for effective implementation. These models heavily rely on substantial amounts of high-quality data. In numerous instances, smart city data may exhibit sparsity, noise, or incompleteness. It is imperative to enhance data collection infrastructure, deploy data cleaning techniques, and explore methods to address missing data [31,32,33].
Managing sensitive data in smart cities introduces privacy concerns, as time series models have the potential to unveil personal information or patterns susceptible to misuse. Mitigating these risks involves implementing robust data anonymization techniques, encryption, and adopting privacy-preserving methodologies while ensuring compliance with data protection regulations. Certain time series models, particularly deep learning models, may be intricate and challenging to interpret. This becomes a significant concern in applications where decision-makers require a clear understanding of model outputs. Addressing this issue involves the development of interpretable models or methods to explain model predictions, fostering transparency and trust [32,33,34,35].
Smart city applications often demand real-time processing, and some time series models may pose challenges due to high computational demands, leading to latency issues. Addressing this involves optimizing algorithms for real-time processing, exploring edge computing solutions, and leveraging hardware acceleration where applicable [30,33,34,35].
With the growth of smart cities, the volume of data to be processed increases, and many time series models may not efficiently scale to handle this growing data load. Overcoming scalability challenges requires the design of scalable architectures, consideration of distributed computing frameworks, and exploration of cloud-based solutions. Smart city environments are dynamic, leading to changing patterns in data over time. Some time series models may struggle to adapt to these changes. Implementing adaptive models that can learn and adjust to changing patterns, along with regular updates based on the latest data, is essential. Smart city data originates from diverse sources and formats. Integrating heterogeneous data into time series models poses a challenge. Addressing this requires the development of data integration standards, utilization of interoperable data formats, and the exploration of techniques for harmonizing data from different sources [32,33,34,35,36,37].
Author Contributions
Methodology, A.F.G. and V.S.V.; software, A.F.G.; validation, A.F.G.; formal analysis, A.F.G., S.K., G.F. and V.S.V.; investigation, A.F.G.; resources, A.F.G. and S.K.; data curation, A.F.G.; writing—original draft preparation, A.F.G., S.K., G.F. and V.S.V.; visualization, A.F.G. and V.S.V.; supervision, A.F.G. and V.S.V.; project administration, A.F.G. All authors have read and agreed to the published version of the manuscript.
Funding
This research received no external funding.
Institutional Review Board Statement
Not applicable.
Informed Consent Statement
Not applicable.
Data Availability Statement
The data is produced by the platform of the Municipality of Patreon, and due to the digital transformation of the city, no more information is given beyond what is mentioned in the article.
Conflicts of Interest
The authors declare no conflicts of interest.
References
- Gkontzis, A.F.; Kotsiantis, S.; Feretzakis, G.; Verykios, V.S. Enhancing Urban Resilience: Smart City Data Analyses, Forecasts, and Digital Twin Techniques at the Neighborhood Level. Future Internet 2024, 16, 47. [Google Scholar] [CrossRef]
- Arafet, K.; Berlanga, R. Digital Twins in Solar Farms: An Approach through Time Series and Deep Learning. Algorithms 2021, 14, 156. [Google Scholar] [CrossRef]
- Hu, W.; He, Y.; Liu, Z.; Tan, J.; Yang, M.; Chen, J. Toward a Digital Twin: Time Series Prediction Based on a Hybrid Ensemble Empirical Mode Decomposition and BO-LSTM Neural Networks. J. Mech. Des. 2020, 143, 051705. [Google Scholar] [CrossRef]
- Zhang, T.; Liu, X.; Luo, Z.; Dong, F.; Jiang, Y. Time series behavior modeling with digital twin for Internet of Vehicles. EURASIP J. Wirel. Commun. Netw. 2019, 2019, 271. [Google Scholar] [CrossRef]
- Wang, F. Does the construction of smart cities make cities green? Evidence from a quasi-natural experiment in China. Cities 2023, 140, 104436. [Google Scholar] [CrossRef]
- Fu, H.; Hong, N.; Liao, C. Spatio-temporal patterns of Chinese urban recovery and system resilience under the pandemic new normal. Cities 2023, 140, 104385. [Google Scholar] [CrossRef]
- Damianou, A.; Vayona, A.; Demetriou, G. An actionable maturity planning model for smart, circular cities. Cities 2023, 140, 104403. [Google Scholar] [CrossRef]
- Oh, J.; Seo, M. Measuring Citizens-Centric Smart City: Development and Validation of Ex-Post Evaluation Framework. Sustainability 2021, 13, 11497. [Google Scholar] [CrossRef]
- Mai, G.; Huang, W.; Sun, J. On the Opportunities and Challenges of Foundation Models for Geo-spatial, Artificial Intelligence. ACM 2018. [Google Scholar] [CrossRef]
- Nejadshamsi, S.; Eicker, U.; Wang, C.; Bentahar, J. Data sources and approaches for building occupancy profiles at the urban scale—A review. Build. Environ. 2023, 238, 110375. [Google Scholar] [CrossRef]
- Ju, J.; Liu, L.; Feng, Y. Citizen-centered big data analysis-driven governance intelligence framework for smart cities. Telecommun. Policy 2018, 42, 881–896. [Google Scholar] [CrossRef]
- Xu, X.; Hu, X.; Zhao, Y. Urban short-term traffic speed prediction with complicated information fusion on accidents. Expert Syst. Appl. 2023, 224, 119887. [Google Scholar] [CrossRef]
- Lucendo-Monedero, Á.L.; Ruiz-Rodríguez, F.; González-Relaño, R. The information society and socio-economic sustainability in European regions. Spatio-temporal changes between 2011 and 2020. Technol. Soc. 2023, 75, 102337. [Google Scholar] [CrossRef]
- De Meyer, A.; Bastiaens, L.; Schoeters, F. Spatio-temporal techno-economic assessment of the algae-based supply chain: A proof-of-concept for North-West Europe. Algal Res. 2023, 76, 103312. [Google Scholar] [CrossRef]
- Yin, C.; Meng, F.; Yang, X. Spatio-temporal evolution of urban built-up areas and analysis of driving factors —A comparison of typical cities in north and south China. Land Use Policy 2022, 117, 106114. [Google Scholar] [CrossRef]
- Ye, C.; Hu, M.; Lu, L. Spatio-temporal evolution and factor explanatory power analysis of urban resilience in the Yangtze River Economic Belt. Geogr. Sustain. 2022, 3, 299–311. [Google Scholar] [CrossRef]
- Li, J.; Xie, B.; Dong, H. The impact of urbanization on ecosystem services: Both time and space are important to identify driving forces. J. Environ. Manag. 2023, 347, 119161. [Google Scholar] [CrossRef]
- Champlin, C.; Sirenko, M.; Comes, T. Measuring social resilience in cities: An exploratory spatio-temporal analysis of activity routines in urban spaces during COVID-19. Cities 2023, 135, 104220. [Google Scholar] [CrossRef]
- Zhang, L.; Fang, C.; Zhao, R. Spatial–temporal evolution and driving force analysis of eco-quality in urban agglomerations in China. Sci. Total Environ. 2023, 866, 161465. [Google Scholar] [CrossRef]
- Mantilla, C.G.C.; Rusticucci, M.; Suli, S. Spatio-temporal multidisciplinary analysis of socio-environmental conditions to explore the COVID-19 early evolution in urban sites in South America. Heliyon 2023, 9, e16056. [Google Scholar] [CrossRef]
- Yu, S.; Leichtle, T.; Zhang, Z. Does urban growth mean the loss of greenness? A multi-temporal analysis for Chinese cities. Sci. Total Environ. 2023, 898, 166373. [Google Scholar] [CrossRef]
- Kakooei, M.; Baleghi, Y. Spatial-Temporal analysis of urban environmental variables using building height features. Urban Clim. 2023, 52, 101736. [Google Scholar] [CrossRef]
- Shang, W.-L.; Chen, Y.; Yu, Q. Spatio-temporal analysis of carbon footprints for urban public transport systems based on smart card data. Appl. Energy 2023, 352, 121859. [Google Scholar] [CrossRef]
- Yan, Z.; Guo, X.; Zhao, Z. Achieving fine-grained urban flood perception and spatio-temporal evolution analysis based on social media. Sustain. Cities Soc. 2024, 101, 105077. [Google Scholar] [CrossRef]
- Bhattacharjee, S.; Lekshmi, K.; Bharti, R. Time series analysis of urbanisation impact on the temperature variations off Mumbai coast. Int. Arch. Photogramm. Remote Sens. Spat. Inf. Sci. 2021, 43, 31–37. [Google Scholar] [CrossRef]
- Ingole, V.; Sheridan, S.C.; Juvekar, S. Mortality risk attributable to high and low ambient temperature in Pune city, India: A time series analysis from 2004 to 2012. Environ. Res. 2022, 204, 112304. [Google Scholar] [CrossRef]
- Cuerdo-Vilches, T.; Díaz, J.; López-Bueno, J.A.; Luna, M.Y.; Navas, M.A. Impact of urban heat islands on morbidity and mortality in heat waves: Observational time series analysis of Spain’s five cities. Sci. Total Environ. 2023, 890, 164412. [Google Scholar] [CrossRef] [PubMed]
- Wicki, B.; Flückiger, B.; Vienneau, D. Socio-environmental modifiers of heat-related mortality in eight Swiss cities: A case time series analysis. Environ. Res. 2024, 246, 118116. [Google Scholar] [CrossRef] [PubMed]
- Lim, B.; Zohren, S. Time-series forecasting with deep learning: A survey. Philos. Trans. R. Soc. 2020, 379, 20200209. [Google Scholar] [CrossRef] [PubMed]
- Han, Z.; Zhao, J.; Leung, H.; Ma, K.F.; Wang, W. A Review of Deep Learning Models for Time Series Prediction. J. IEEE Sens. 2021, 21, 7833–7848. [Google Scholar] [CrossRef]
- Gubareva, R.; Lopes, R.P. Literature Review on the Smart City Resources Analysis with Big Data Methodologies. SN Comput. Sci. 2024, 5, 02457. [Google Scholar] [CrossRef]
- Gkontzis, A.F.; Kalles, D.; Paxinou, E.; Tsoni, R.; Verykios, V.S. A Big Data Analytics Conceptual Framework for a Smart City: A Case Study. In Building on Smart Cities Skills and Competences; Fitsilis, P., Ed.; Internet of Things; Springer: Cham, Switzerland, 2022. [Google Scholar] [CrossRef]
- Hammad, S.S.; Iskandaryan, D.; Trilles, S. An unsupervised TinyML approach applied to the detection of urban noise anomalies under the smart cities environment. Internet Things 2023, 23, 100848. [Google Scholar] [CrossRef]
- Kuang, Z.; Chen, C. Research on smart city data encryption and communication efficiency improvement under federated learning framework. Egypt. Inform. J. 2023, 24, 217–227. [Google Scholar] [CrossRef]
- Monje, L.; Carrasco, R.A.; Rosado, C.; Sánchez-Montañés, M. Deep Learning XAI for Bus Passenger Forecasting: A Use Case in Spain. Mathematics 2022, 10, 1428. [Google Scholar] [CrossRef]
- Nauman, A.; Alruwais, N.; Alabdulkreem, E.; Nemri, N.; Aljehane, N.O.; Dutta, A.K.; Assiri, M.; Khan, W.U. Empowering smart cities: High-altitude platforms based Mobile Edge Computing and Wireless Power Transfer for efficient IoT data processing. Internet Things 2023, 24, 100986. [Google Scholar] [CrossRef]
- Jnr, B.A.; Sylva, W.; Watat, J.K.; Misra, S. A Framework for Standardization of Distributed Ledger Technologies for Interoperable Data Integration and Alignment in Sustainable Smart Cities. J. Knowl. Econ. 2023, 1868–7873. [Google Scholar] [CrossRef]
Disclaimer/Publisher’s Note: The statements, opinions and data contained in all publications are solely those of the individual author(s) and contributor(s) and not of MDPI and/or the editor(s). MDPI and/or the editor(s) disclaim responsibility for any injury to people or property resulting from any ideas, methods, instructions or products referred to in the content. |
© 2024 by the authors. Licensee MDPI, Basel, Switzerland. This article is an open access article distributed under the terms and conditions of the Creative Commons Attribution (CC BY) license (https://creativecommons.org/licenses/by/4.0/).