1. Introduction
In the contemporary era, the role of information technology is pivotal and beneficial across various facets of human life. A fundamental human need is the provision of optimal and efficient medical diagnostics and treatment, especially for rapid, cost-effective, and non-invasive management of critical illnesses such as cancer. Advances in medical research have enabled the conversion of specific physical attributes and vital metrics into numerical data, facilitating analysis through diverse biological methods [
1,
2,
3,
4].
The challenge of handling vast data, represented in multiple formats and colour codes, necessitates the development of efficient processing techniques. Historically, a range of software approaches and algorithms have been applied across various domains, significantly improving the accuracy and speed of information categorization. Recent advancements in laboratory research have allowed the storage of genetic data in digital formats, like images or computer data structures, rather than on paper. However, the redundancy in these digital structures precludes the use of conventional extraction or feature selection techniques, due to the overwhelming volume of data, thus requiring sophisticated processing methods for effective data extraction and analysis [
3,
5,
6,
7,
8].
Gene expression microarrays, which employ microscopic technologies and medical testing, have become vital in modern medicine. These microarrays, which can be used for the prevention, detection, and treatment of terminal cancers, involve the analysis of genetic expressions either as images or numeric datasets from genetic tests. The complexity of microarrays, containing expressions of hundreds of genes, poses a significant challenge in understanding and interpreting the data without specialized knowledge and specific gene tests [
2,
9,
10]. The last decade has witnessed significant discoveries in cellular biology, particularly the identification of a diverse range of non-coding RNAs, including microRNAs (miRNAs). These miRNAs, which are part of the non-coding RNA family, play a crucial role in regulating biological processes by impeding protein translation through mRNA inhibition [
1,
3,
5,
6,
7,
11]. Despite their importance, the practical identification of microRNA genes is challenging. The inefficiency of some miRNAs in diagnostics, coupled with the high cost and time-intensive nature of laboratory tests, limits their practicality. To overcome these hurdles, computational methods have been introduced, broadly categorized into adaptive filtering and machine learning. Adaptive filtering narrows down the number of target genes based on statistical, environmental, structural, and thermodynamic parameters. Conversely, machine learning, employing techniques like artificial neural networks (ANNs) and support vector machine (SVM) classifiers, analyze various attributes for each microRNA and target gene pair. Addressing the challenges in the predictive and categorical analysis involves balancing the learning algorithms’ capacity with class specificity, establishing negative datasets, achieving targeted outcomes, selecting appropriate inputs, and managing class imbalances. Our research delves into the intersection of computational methods and medical diagnostics, aiming to address the inherent challenges in microRNA analysis and gene expression profiling. In pursuit of this objective, we have developed and implemented a series of innovative approaches and methodologies. The main contributions of our research are outlined below:
Innovative Integration of PSO and ANNs: While the use of particle swarm optimization (PSO) and artificial neural networks (ANNs) in various domains is not novel in itself, our work introduces an innovative integration method of these two technologies specifically tailored for miRNA-based cancer detection. This hybrid model uniquely optimizes the feature selection process using PSO in a way that specifically enhances the pattern recognition capabilities of ANNs for this application, addressing the complexity and high dimensionality of genetic data in a novel manner.
Dynamic Feature Selection for Enhanced Accuracy: Our research introduces a dynamic feature selection mechanism that iteratively refines the set of miRNAs considered for analysis. This approach, powered by PSO, continuously adapts based on feedback from the ANN’s performance, leading to a significant improvement in detection accuracy. This method of iteratively optimizing the feature set for miRNA-based cancer detection has not been extensively explored in previous works, marking a significant step forward in the field.
Application-Specific Model Optimization: The customization and optimization of the PSO-ANN model parameters were conducted with a specific focus on miRNA data related to cancer detection. This tailored approach, including the choice of hyper-parameters and the architecture of the neural network, contributes to the novelty of our work by significantly enhancing model performance in this particular application.
Comprehensive Evaluation Across Multiple Cancer Types: Our research extends beyond the scope of existing studies by conducting a comprehensive evaluation of the proposed model across multiple types of cancer, including breast cancer, lung cancer, and melanoma. This broad-based evaluation demonstrates the model’s versatility and effectiveness in a variety of contexts, contributing new insights into the application of machine learning techniques in oncology.
Empirical Validation of Model Efficiency: Another novel aspect of our work is the empirical validation of the model’s computational efficiency and accuracy in real-world settings. By documenting the computational time alongside accuracy metrics, we provide a holistic view of the model’s performance, offering valuable insights for clinical applications and further research.
The remainder of this paper is organized as follows:
Section 2—Literature Review delves into existing research and advancements, providing a critical analysis of previous methodologies and findings.
Section 3—Methodology describes in detail the combined use of particle swarm optimization and artificial neural networks in our approach, emphasizing their application in miRNA analysis for cancer detection.
Section 4—Experimental Setup and Data Analysis outlines our experimental procedures, including data collection, algorithm implementation, and analysis techniques.
Section 5—Results and Discussion presents and interprets the findings of our research, comparing them with existing studies and discussing their implications in the field of cancer diagnosis.
Section 6—Conclusion and Future Work summarizes the study’s outcomes, highlights its contributions to the field, and suggests directions for future research. This structure ensures a comprehensive presentation of our study from its foundational concepts to its practical implications.
2. Related Work
Traditional image processing approaches produced respectable findings and performance in medical illness identification when used with infected and uninfected pictures, but they were confined to tiny datasets and theoretical results, which made them unsuitable for practical use. Considering how deep learning (DL) has revolutionized the field of computer vision [
7,
12,
13,
14], specifically image detection as well as object classification and recognition, it is now considered a promising tool to improve such automated diagnosis systems to achieve higher outcomes, broaden disease scope, and perform applicable real-time medical imaging [
15,
16,
17,
18,
19,
20,
21,
22] for disease classification systems, among other things. When it comes to DL, it is a field of Artificial Intelligence that is reliant on algorithms for data processing, thinking process modelling, or the development of abstractions [
23,
24,
25]. Recent research by [
26] emphasizes the critical role of microRNAs (miRNAs) as biomarkers for various diseases, including cancer. The study underscores the challenges in traditional miRNA detection methods, such as RNA sequencing and qRT-PCR, which are time-consuming and costly. It advocates for the development of sensitive, specific, rapid, and easy-to-use POCT methods for miRNA detection, leveraging portable instruments and visual readout methods. This advancement in miRNA detection technology represents a significant stride towards more accessible and efficient diagnostic solutions, aligning with our research’s focus on improving miRNA-based diagnostics through machine learning. In their groundbreaking work, ref. [
27] analyzes serum miRNA expression profiles from pancreatic cancer (PC) patients to identify potential biomarkers using advanced machine learning algorithms, including support vector machine-recursive feature elimination (SVM-RFE), least absolute shrinkage and selection operator (LASSO), and random forest. The study presents an artificial neural network model that demonstrates high accuracy in distinguishing between normal and PC samples, contributing a novel approach to early PC diagnosis. This approach of combining machine learning with miRNA analysis for PC diagnosis complements our research’s aim to leverage computational techniques for cancer detection. The study [
28] introduces an improved method for cancer-type classification based on microRNA expression data, employing a hybrid model that combines radial basis function (RBF) with particle swarm optimization (PSO) for feature selection. By achieving high accuracy in cancer-type classification, this work highlights the effectiveness of PSO in identifying the most relevant miRNA features, a methodological cornerstone also central to our research. The success of this hybrid approach in enhancing diagnostic accuracy and computational efficiency further validates the potential of integrating machine learning algorithms in miRNA-based cancer diagnostics. The study [
29] introduces a pioneering approach to miRNA detection through a surface acoustic wave (SAW) sensor array. This method utilizes photocatalytic silver staining on titanium dioxide (TiO
2) nanoparticles to enhance signal sensitivity and incorporates an internal reference sensor to achieve high reproducibility. By employing sandwich hybridization, the SAW sensor array can simultaneously capture and detect multiple miRNAs (miRNA-21, miRNA-106b, and miRNA-155) known to be up-regulated in cancer. This technique’s ability to normalize sensor responses and screen out background interferences underscores its potential for precise and reliable miRNA detection in clinical samples, including cancer cell-derived exosomal miRNAs. Further advancing the field, the work presented in [
30] addresses the critical need for predicting the regulatory relationships between miRNAs and small molecules (SMs), which is vital for miRNA-target therapy. The proposed computational model leverages the Large-scale Information Network Embedding (LINE) algorithm, the General Attributed Multiplex Heterogeneous Network Embedding (GATNE) algorithm, and the Light Gradient Boosting Machine (LightGBM) algorithm to accurately predict whether miRNA-SM regulatory relationships are up-regulated or down-regulated. With average accuracies exceeding
in fivefold cross-validation, this model demonstrates the remarkable potential for accelerating miRNA-targeted therapy research, as evidenced by the successful identification of candidate miRNAs for 5-FU treatment validation through the related literature. These studies [
29,
30] highlight the dynamic nature of miRNA research, showcasing innovative methods that enhance detection accuracy and computational models that provide new insights into miRNA regulation. By integrating such cutting-edge approaches, our work builds upon these advancements, aiming to further the understanding and application of miRNA analysis in cancer diagnostics and therapy.
DL uses layers of algorithms to process, analyze, and identify hidden patterns in data, as well as to interpret human speech and recognize visual objects [
31,
32,
33], among other things. Information is transferred through each layer of a deep network, with the output of the previous layer serving as the input for the next layer of the deep network. The input layer is the first layer in a network, while the output layer is the final layer in a network, with the input layer being the first. All of the layers that are positioned between the input and output layers are collectively referred to as the network’s hidden layers. In most cases, each layer is comprised of a basic, homogeneous algorithm that has just one kind of activation function [
23,
34,
35,
36].
Although CNN analysis was not widely discussed at computer vision conferences and journals until 2011, a study presented at the major conference CVPR in June 2012 demonstrated how max-pooling CNNs on GPU may significantly improve several vision benchmark records. In October 2012, a comparable approach proposed by [
37] won the large-scale ImageNet [
38] competition by outperforming standard machine learning techniques by a wide margin in classification accuracy. Ref. [
39]’s system was also the winner of the ICPR contest on the analysis of huge medical pictures for cancer diagnosis in November 2012 and the MICCAI Grand Challenge on the same issue the following year. Coming then, several advancements in deep CNNs greatly lowered the error rate on the ImageNet job in the following years. Following each yearly challenge of the ImageNet Large-Scale Visual Recognition Competition (ILSVRC), several typical CNNs, such as VGGnet, GoogLeNet, and Residual Neural Network (ResNet), made considerable advances. On the ImageNet [
38] dataset classification challenge, a model dubbed Xception [
40] was proposed that employs depth-wise separable convolutions to outperform the Inception-V3 model [
41] and is referred to as the Xception model. Ref. [
42] presented a novel CNN version dubbed densely connected convolutional networks (DenseNet), which employs a network design in which each layer is directly linked to every subsequent layer. DenseNet has made considerable gains above the state-of-the-art while requiring much fewer parameters and computations than the previous generation of algorithms. RNA sequencing data from The Cancer Genome Atlas (TCGA) is used by [
43], which focuses on identifying 33 different kinds of cancer patients. The authors developed five machine learning methods, namely, deep learning (DL), the kernel neural network (KNN), the linear support vector machine (linear SVM), the polynomial support vector machine (poly SVM), and an artificial neural network (ANN). The best result demonstrates that linear SVM is the best classifier in this investigation, with a classification accuracy of
. Ref. [
44] devised a novel strategy for identifying possible biomarkers for each kind of tumour that they studied. The approach was given with a wealth of information on 33 common cancer tumour types based on the information included in the pan-cancer atlas. They employed a convolutional neural network to categorize tumour kinds, and a visualization neural network approach to determine the most important tumour genes from the input datasets. The high-dimensional RNA-Seq data was integrated into 2-D pictures, and a convolutional neural network was utilized to classify the 33 different malignant tumor types based on their characteristics. They created a significant heat map for all of the genes using the Guided Grad Cam (GGC) concept, with a heat map for each class based on the notion of GGC.
Using a train/test split, the suggested method had a
success rate. According to the authors [
45], they attempted the build of a pan-cancer atlas that could detect 9096 TCGA tumour samples from 31 different cancer types. In the training set, they allocated
percent of the samples (about 6800 samples), whereas, in the testing set, they assigned 25 percent of the samples (approximately 2300 samples), evenly distributing samples from each tumour type. They omitted all tumour forms that are sex-specific from consideration for the non-sex-specific tumour categorization, including BRCA, CESC, OV, PRAD, TGCT, UCEC, and UCS, from consideration. In the case of the other tumour types, the samples were divided into two groups depending on the gender of the patients. Because of the limited gender-specific sample numbers, three more tumour types (CHOL, DLBC, and KICH) were removed from the study. When it comes to iteratively creating a subset of genes (features), the authors used a genetic algorithm and the k-nearest neighbours (KNN) approach, followed by the KNN method to test for correctness, as described in the paper. With this strategy, an accuracy of 90 percent was reached across 31 tumour types, and a collection of top genes for each tumour type was established.
In our study, we aim to bridge several gaps identified in previous research within the domain of miRNA analysis for cancer diagnosis. First, we address the limitations of traditional feature selection techniques, which often fail to manage the high dimensionality and heterogeneity of miRNA data, by implementing an advanced particle swarm optimization algorithm for more nuanced feature selection. Additionally, we focus on effectively integrating computational methods with biological data analysis, balancing the two to ensure that our computational models are deeply rooted in biological relevance, a balance often neglected in earlier studies. Our research also enhances diagnostic accuracy by employing a hybrid model that combines particle swarm optimization with artificial neural networks, specifically targeting the challenge of differentiating between cancer types based on miRNA patterns. Addressing the common issue of class imbalance in miRNA data, our study implements strategies within our machine-learning models to ensure more equitable and accurate outcomes. Furthermore, we tackle the challenges of scalability and efficiency, particularly relevant when dealing with large-scale miRNA datasets, proposing a scalable and efficient approach that maintains the integrity of the analysis.
Lastly, our research delves into the latest developments in deep learning, especially convolutional neural networks, bringing a fresh perspective to miRNA-based cancer diagnosis. By addressing these critical gaps, our research not only contributes significantly to the existing body of knowledge but also paves the way for future advancements in cancer diagnosis using miRNA analysis, offering more accurate, efficient, and biologically relevant diagnostic methods.
3. Proposed Method Framework
In this research, we address the challenge of selecting a subset of miRNAs that are most indicative of cancer presence from a larger set. The complexity of this task can be represented by the formula 2d2d, where dd denotes the total number of available miRNAs in the dataset. This formula represents the size of the search space, that is, the total number of possible miRNA subsets. Given the large number of miRNAs typically involved in genetic studies, the search space (2d2d) becomes exponentially large, making exhaustive search computationally impractical and far from optimum. To navigate this vast search space efficiently, we employ particle swarm optimization (PSO), a metaheuristic approach known for its ability to find near-optimal solutions in complex, nonlinear search spaces. PSO mimics the social behaviour of birds flocking or fish schooling to explore the search space. Each particle in the swarm represents a potential solution, i.e., a specific subset of miRNAs in this context. The particles iteratively adjust their positions in the search space based on their own experience and the success of their neighbours, converging towards the most promising areas of the search space. This process is guided by a fitness function designed to evaluate the effectiveness of each subset in distinguishing cancerous from non-cancerous samples, based on criteria such as the differential expression power of the selected miRNAs. The adoption of PSO for miRNA selection allows us to efficiently reduce the dimensionality of the data by focusing on miRNAs that provide the most significant information for cancer classification. A well-chosen subset of miRNAs enhances the accuracy of the subsequent classification process, carried out using an artificial neural network (ANN). The ANN classifier is trained on these optimized miRNA subsets to recognize patterns indicative of cancer. By eliminating irrelevant and redundant miRNAs, we not only streamline the learning process but also significantly reduce the computational burden, making the classification task more manageable and efficient. In essence, our modified technique leverages the strengths of PSO to address the computational challenges inherent in miRNA feature selection, paving the way for a more accurate and efficient cancer diagnosis method. This novel approach demonstrates the potential of combining computational intelligence techniques to improve the inference systems in biomedical applications, specifically for the early detection and diagnosis of breast cancer. The assessment of the proposed approach is meticulously designed to validate the effectiveness of our particle swarm optimization (PSO)-based miRNA selection method in conjunction with the classification capabilities of an artificial neural network (ANN). This dual strategy emphasizes selectivity by identifying a subset of miRNAs that are most informative for cancer detection, thus enhancing the classification accuracy. The efficiency of this method is demonstrated through its application on three distinct Gene Expression Omnibus (GEO) datasets, each related to different types of cancer: breast cancer, lung cancer, and melanoma. To ensure a robust evaluation, we introduce a novel independence and resolution criterion focused on reducing the dimensionality of cancer data while preserving its discriminative properties. This involves analyzing the inter-batch and intra-batch dispersion matrices of miRNA subsets. The optimal subset is identified based on a batch independence score, which reflects the subset’s relevance to the classification task. This score is calculated by considering the ratio of the subsets’ inter-batch dispersion matrix to their intra-batch dispersion matrix. A higher score suggests a subset with less redundancy and more relevance to distinct cancer classifications. Additionally, the feature selection process accounts for the removal of redundant miRNAs by analyzing the dispersion matrix between variables, which indicates the correlation of miRNAs with specific cancer class tags. The selection and evaluation of miRNAs are carried out using a correlation technique that assesses the relationship between individual miRNAs and cancer categorization. This method leverages the pattern recognition strengths of ANNs, which are well suited for processing and generalizing complex data patterns found within miRNA expression profiles. For the assessment, this study utilizes three comprehensive GEO datasets, specifically chosen for their relevance to lung, breast, and melanoma cancer research. These datasets are described as follows:
Breast Cancer Dataset: Comprises 98 blood samples, with a total of 309 distinct miRNAs analyzed. This dataset provides a diverse range of expression profiles, offering insights into the miRNA patterns associated with breast cancer.
Lung Cancer Dataset: Contains 36 samples and explores the expression of 866 miRNAs. The extensive number of miRNAs covered in this dataset facilitates a detailed examination of the genetic markers relevant to lung cancer diagnosis.
Melanoma Dataset: Includes 57 samples, also analyzing 866 miRNAs. Similar to the lung cancer dataset, this provides a broad spectrum of miRNA expression data, crucial for identifying melanoma-specific genetic signatures.
The utilization of these datasets allows for a comprehensive evaluation of the proposed PSO-ANN framework across different cancer types. By analyzing the expression of hundreds of miRNAs within these datasets, we aim to demonstrate the versatility and accuracy of our method in distinguishing between cancerous and non-cancerous samples, thereby underscoring its potential utility in clinical diagnostics.
3.1. PSO Algorithm
Kennedy and Eberhart established the notion of particle swarm optimization (PSO) in 1995, inspired by the mass behaviour and movement of bees, fish, and birds [
7]. Indeed, PSO is a very effective and random approach for evolutionary calculations based on the intelligent displacement of animals in pursuit of food. It is gaining popularity due to its success in solving genetic design issues, particularly those containing continuous design variables. Optimal yields are greater throughout the country [
9].
PSO has several benefits, including simplicity of implementation, early convergence, and adaptability versus optimum local problems, as well as an internal memory that retains the best circumstances from its history and neighbourhood without requiring new input [
46]. This approach utilizes the standard technique for evolutionary computations:
It begins with a randomly generated population of potential responses.
It performs generational updates and seeks the optimum solution.
Populations are evaluated using prior generations.
The alternative solutions, which are identical particles, are displaced in the solution space of the issue by the optimum current particles in the discrete PSO utilized in this research. This displacement happens as a result of an evaluation of the quality of each particle by a fit function. Additionally, the particle’s velocity (position changes) may be represented by another dimensional vector
D:
Equation (
1) defines the position of the
i-th particle in a
D-dimensional solution space. Each component
of the vector
represents the value of the
d-th dimension of the solution represented by the
i-th particle. Equation (
2) denotes the velocity of the
i-th particle, which dictates the particle’s movement across the solution space. The velocity vector
consists of
D components, each corresponding to the change in position along a specific dimension from one iteration to the next.
Pbesti and
xpbesti are used to represent the best fit achieved for the
i trusted particle (the personal best) and the associated location, xgbest, gbest, xgbest. It has been shown that using inertia
w increases the algorithm’s performance; this weight defines the influence of the particle velocity in the previous step on the present speed. Hence, using a big quantity of inertia weight improves the algorithm’s general search capacity and saves space. The following equations [
46] are used to update particles with their inertia weight in a discrete PSO system:
where
;
and
N denote the group’s population, and
and
denote positive coefficients. The coefficients
and
are random values spread uniformly throughout the range
and signify the number of iterations
Because each iteration of the method is expected to run one second
, the relationships are dimensionally valid.
Unlike the standard PSO, the binary version of PSO is able to optimize in discrete spaces. Implementation and execution selected. It starts with considering a binary array for each BPSO particle. In this field, zero indicates the deletion of the attribute and 1 indicates the selection of that attribute. The only difference from the standard PSO is the particle position improvement equation, which is modified as follows [
20]:
where
rand is a random number that is evenly distributed in the interval
. To prevent saturation of the sigmoid function, the BPSO inventors recommend limiting the speed in the interval
[
46]. Such solutions are usually encrypted in a binary string of zeros and ones. In the zero binary chain, it indicates that the associated miRNAs have not been selected and have been removed from the miRNA set.
3.2. Degree of Ionic Resolution
The goal of the degree of resolution is to select the optimal miRNAs for classification. Imagine
is an example where
is a next miRNA
d space and
is the set of batch labels. The symbol
represents the number of samples belonging to the
i-th class,
N represents the total number of samples, and
c represents the number of classes. Suppose that
denotes the sample
j in category
i,
u is the average of all the categories, and
is the average of the sample in category
i.
So the scatter matrix between the
classes and the scatter matrix between the
classes are defined as follows:
Here,
measures the average vector distances of each category and the overall average, while
measures the average scatter of the categories around their average vectors. For a given miRNA subset, the batch resolution is based on the scatter matrix, which evaluates the tracking ratio or determinant of the dispersion matrix between the batch and the intragroup scatter matrix. The
RM category resolution is as follows:
A subset with a large
RM is considered a good subset and means a small batch dispersion and a large batch dispersion. Hence, a large
RM ensures that the batches are well dispersed by their scattering averages. This is a simple, powerful, and integrated benchmark for categorization.
3.3. Proposed Algorithm
The particle swarm optimization algorithm is used to find the optimal miRNA subset through the evolution process. The proposed proportionality function, the particle swarm optimization algorithm, is used to evaluate the performance of an individual, which is referred to as a particle. This algorithm consists of two words. The first, called the RM resolution score, measures the resolution of samples belonging to different classes and the duplication between miRNAs. The latter involves a subset of cardinality for the proposed solutions with a smaller number of miRNAs. The significance of these two words is controlled by a weight coefficient, w, defined by the user and has a value between zero and 1. The larger w, the higher the share of the first sentence for the overall fit value and the lower the error imposed on the selected subset function. The fitness function is presented by the following equation, which is the proposed formula of this paper, which is Fitness:
Here, the symbol
represents the cardinality of the subsets of the
attribute (i.e., 1 s per particle) and
d is the total number of miRNAs available. On the one hand, the particle swarm optimization algorithm will make more efforts to increase the scalability scores, and on the other hand, the particle swarm optimization algorithm will try to reduce the number of selected miRNAs. Hence, a proper w can balance their relationship. In this research, w is placed as
based on trial and error. The proposed algorithm can select important features for better diagnosis of the disease. The suitability of the particles depends on their values, which are calculated from the fit function.
Feature Selection Using Particle Swarm Optimization (PSO)
Initialization Phase The process of feature selection in our study commences with the initiation of particle swarm optimization (PSO). This critical step involves the generation of a random population of potential solutions, which are referred to as particles. In the context of our research, each particle uniquely represents a possible subset of microRNAs (miRNAs). This representation is crucial as it forms the foundation for the subsequent steps of optimization and selection.
Evaluation and Iterative Update Once the initial population of particles is established, they embark on a navigational journey through the solution space. The trajectory of each particle is not random but is instead significantly influenced by the most optimal positions they have individually discovered as well as the best positions identified by the swarm as a whole. This dynamic movement of the particles is not just mere displacement but is targeted towards a specific goal: the optimization of miRNA selection. The iterative nature of this process ensures continuous improvement and refinement of the solutions.
Optimization Objective The overarching objective of this phase is the identification and selection of the subset of miRNAs that are deemed most informative and effective for the classification of different cancer types. To determine the efficacy of each miRNA subset, we employ a specially designed fitness function. This function assesses the performance of each subset based on its ability to classify cancer accurately. The criteria embedded within this fitness function are tailored to evaluate and highlight the subsets that provide the highest classification performance, thereby serving as a guide for the selection of the most promising miRNA subsets for further analysis.
3.4. Proposed Convolution Neural Network for Data Classification
Now, after specifying the properties, it is time to categorize the data using an artificial neural network. It is safe to say that artificial neural network algorithms are one of the most accurate and powerful classification algorithms. This new method can be used to classify linear and nonlinear data. A neural network consists of several neural neurons that are activated when needed and calculations are performed on them. Nodes in the input layer are neurons that are not operated on and are not included in the calculation of the number of layers. The output layer nodes are the responsive neurons in which the problem-solving response is displayed. There are hidden neurons between the input and output neurons. A single neuron cannot be used to solve a problem with multiple inputs and outputs. In this case, several neurons must be used in parallel to be able to process the input vectors simultaneously and transfer them to the output vector of the last layer. Nodes in the input layer are neurons that are not operated on and are not included in the calculation of the number of layers. The output layer nodes are the responsive neurons in which the problem-solving response is displayed. There are hidden neurons between the input and output neurons. A single neuron cannot be used to solve a problem with multiple inputs and outputs. In this case, several neurons must be used in parallel to be able to process the input vectors simultaneously and transfer them to the output vector of the last layer. Inside each neuron is a specific gravity that affects the values entering the neuron and directs weighted vectors to excitation functions. In addition to changing its weight, a vector may need to be moved in the vector space by adding a bias to the weighted matrix. Now, the weighted values are taken to the excitation functions and the output function takes the original value according to whether the appropriate answer is obtained or not, and these values are compared with the target vector and, in the case of a discrepancy with the target vector, are returned to select more suitable weights for those vectors.
Typically, when implementing an architecture for a convolutional neural network to make optimal use of hardware resources, the scale and characteristics of the input data are considered in terms of the accuracy and scale of the computations. When executing and training a convolutional neural network, the constraints and format of the network parameters and input data must be predictable and executable for the hardware model. Otherwise, the number of bit parameters and computational volume may pose a challenge for the convolutional neural network accelerator. On the other hand, converting data to other formats may reduce the accuracy of the network. Increasing and replacing convolutional layers with fully connected layers accelerates the learning process. The fully connected layer incurs a very high processing cost due to the higher number of parameters. However, the use of this layer is necessary due to the conversion of maps into feature vectors and helps in the output layer to classify information [
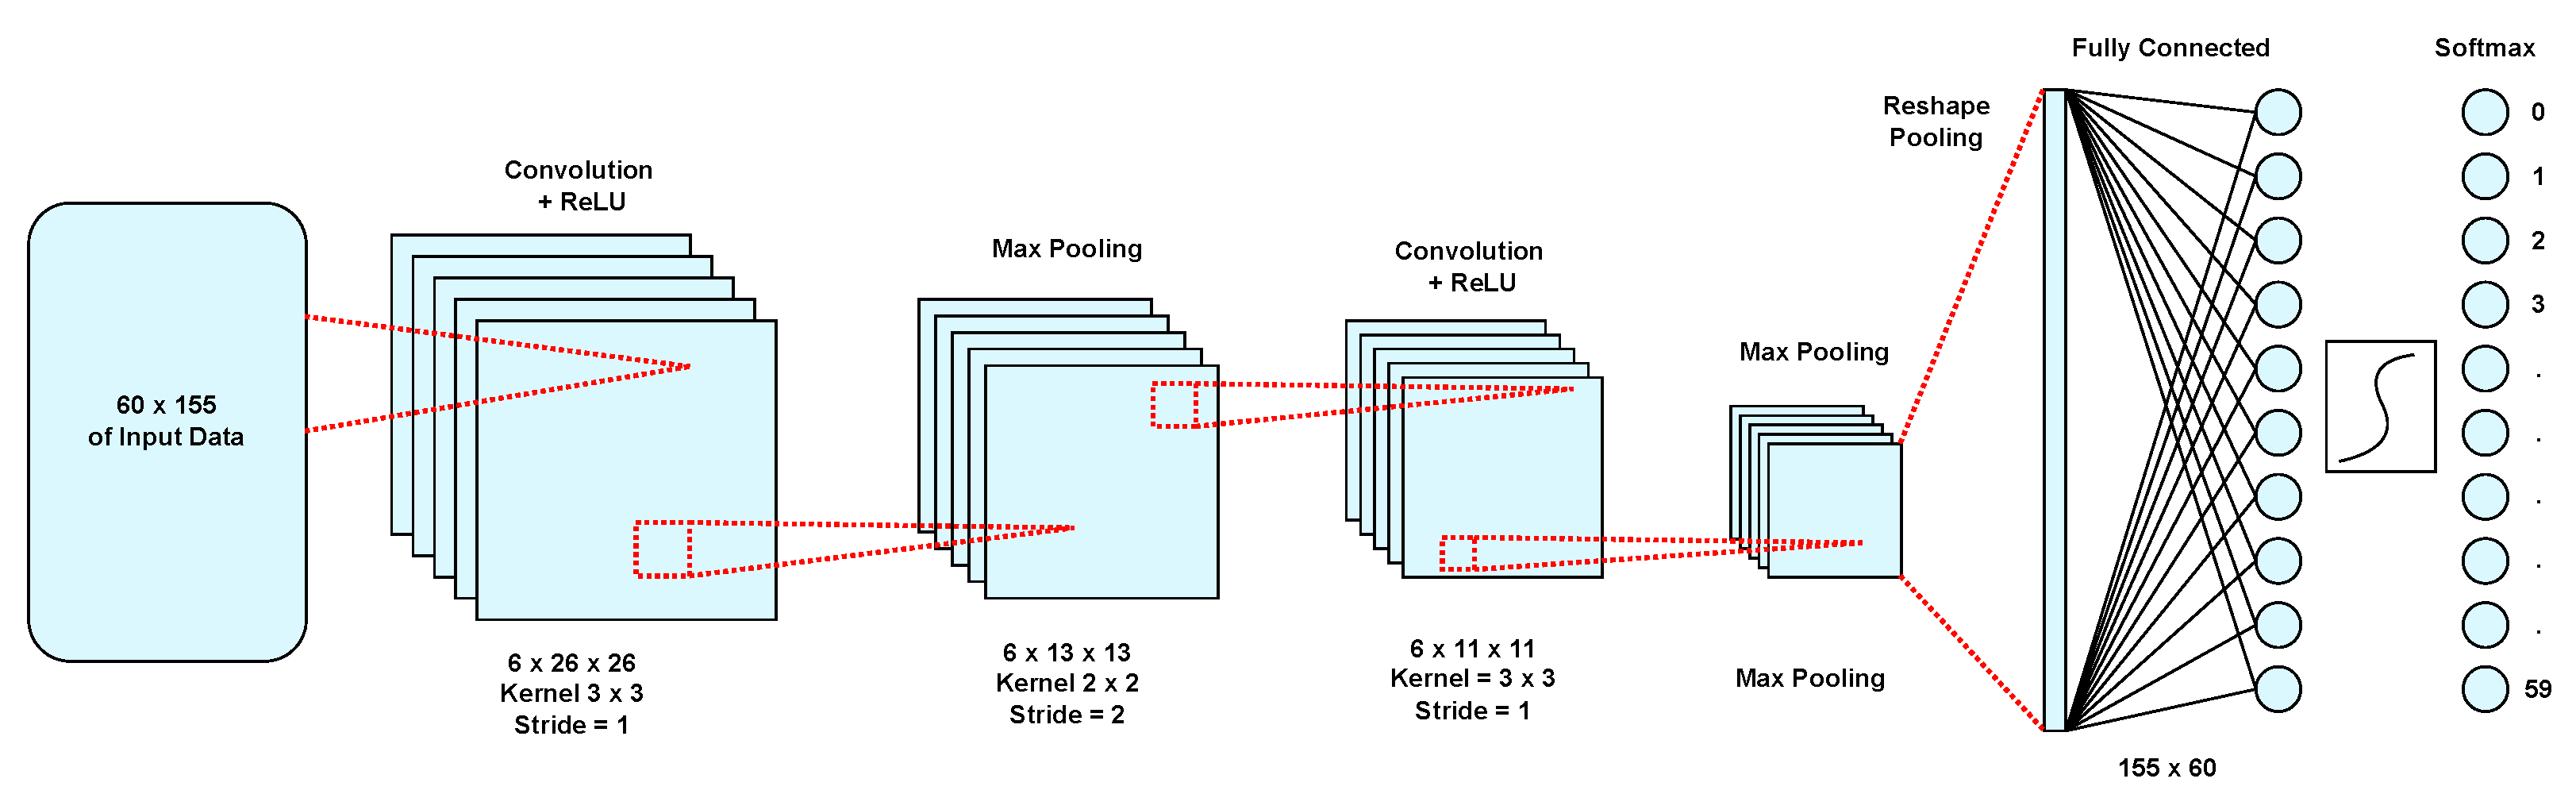
44]. Our proposed solution is the minimal use of a fully connected layer. On the other hand, a convolutional layer and a fully connected layer with limited dimensions cannot be expected to perform adequately to extract a better feature. Therefore, two convolutional layers, two integration layers, and one fully linked layer were used for the proposed architecture. After each convolutional layer, ReLU activity functions are used and in the outer layer, and the softmax (smooth maximum function) method and cross-sectional entropy cost function method are used to train the network.
The accuracy of the network is improved by increasing the size of the feature maps and the depth of the convolutional layers. However, this leads to an increase in computations and parameters, which is smoothed by a higher consumption of hardware resources or a delay in network discovery, depending on the type of architecture. Therefore, we study the criterion for selecting the depth of convolutional layers based on the three criteria of network accuracy, number of network parameters, and delay of the network injection process and select the best model for the most appropriate performance on these three criteria. Increasing the depth of the second convolutional layer has the greatest impact on increasing the number of computations and parameters in the fully linked layer, and therefore, according to the obtained criteria, we consider the proposed convolutional network with a depth of six for both the first and second convolutional layers.
Figure 1 shows the final structure of the proposed model of a trained convolution neural network. The smaller the dimensions of the filter in the proposed architecture, the lower the multiplication and addition computations of the convolutional layer and the better the accuracy of the network. The initial dimensions of the convolution with a slack step and a
filter for a cancer miRNA data input with the dimensions of
are
. After applying the integration layer, the dimensions are halved and in the second convolution layer, the dimensions are
. It should be noted that in the network architecture, we use the maximum integration which provides better performance than the average integration in hardware design.
Several methods have been proposed for adapting and selecting hyper-parameters for network learning. We use manual testing and comparison to select the appropriate hyper-parameters. In this method, other coefficients and interactions among parameters should also be considered. In this study, the learning rate coefficient is adjusted to have good speed and stability in reducing network errors. On the other hand, it should be noted that in determining the learning rate, the momentum coefficients, small lot size, and some other coefficients are very effective in choosing the learning rate coefficient. In the instantaneous weight correction with decreasing effect, the previously obtained weights are used in the current updates, or in other words, a coefficient of the gradient of the previous stage is added to the current gradient. This improves the learning stability and learning speed with this method.
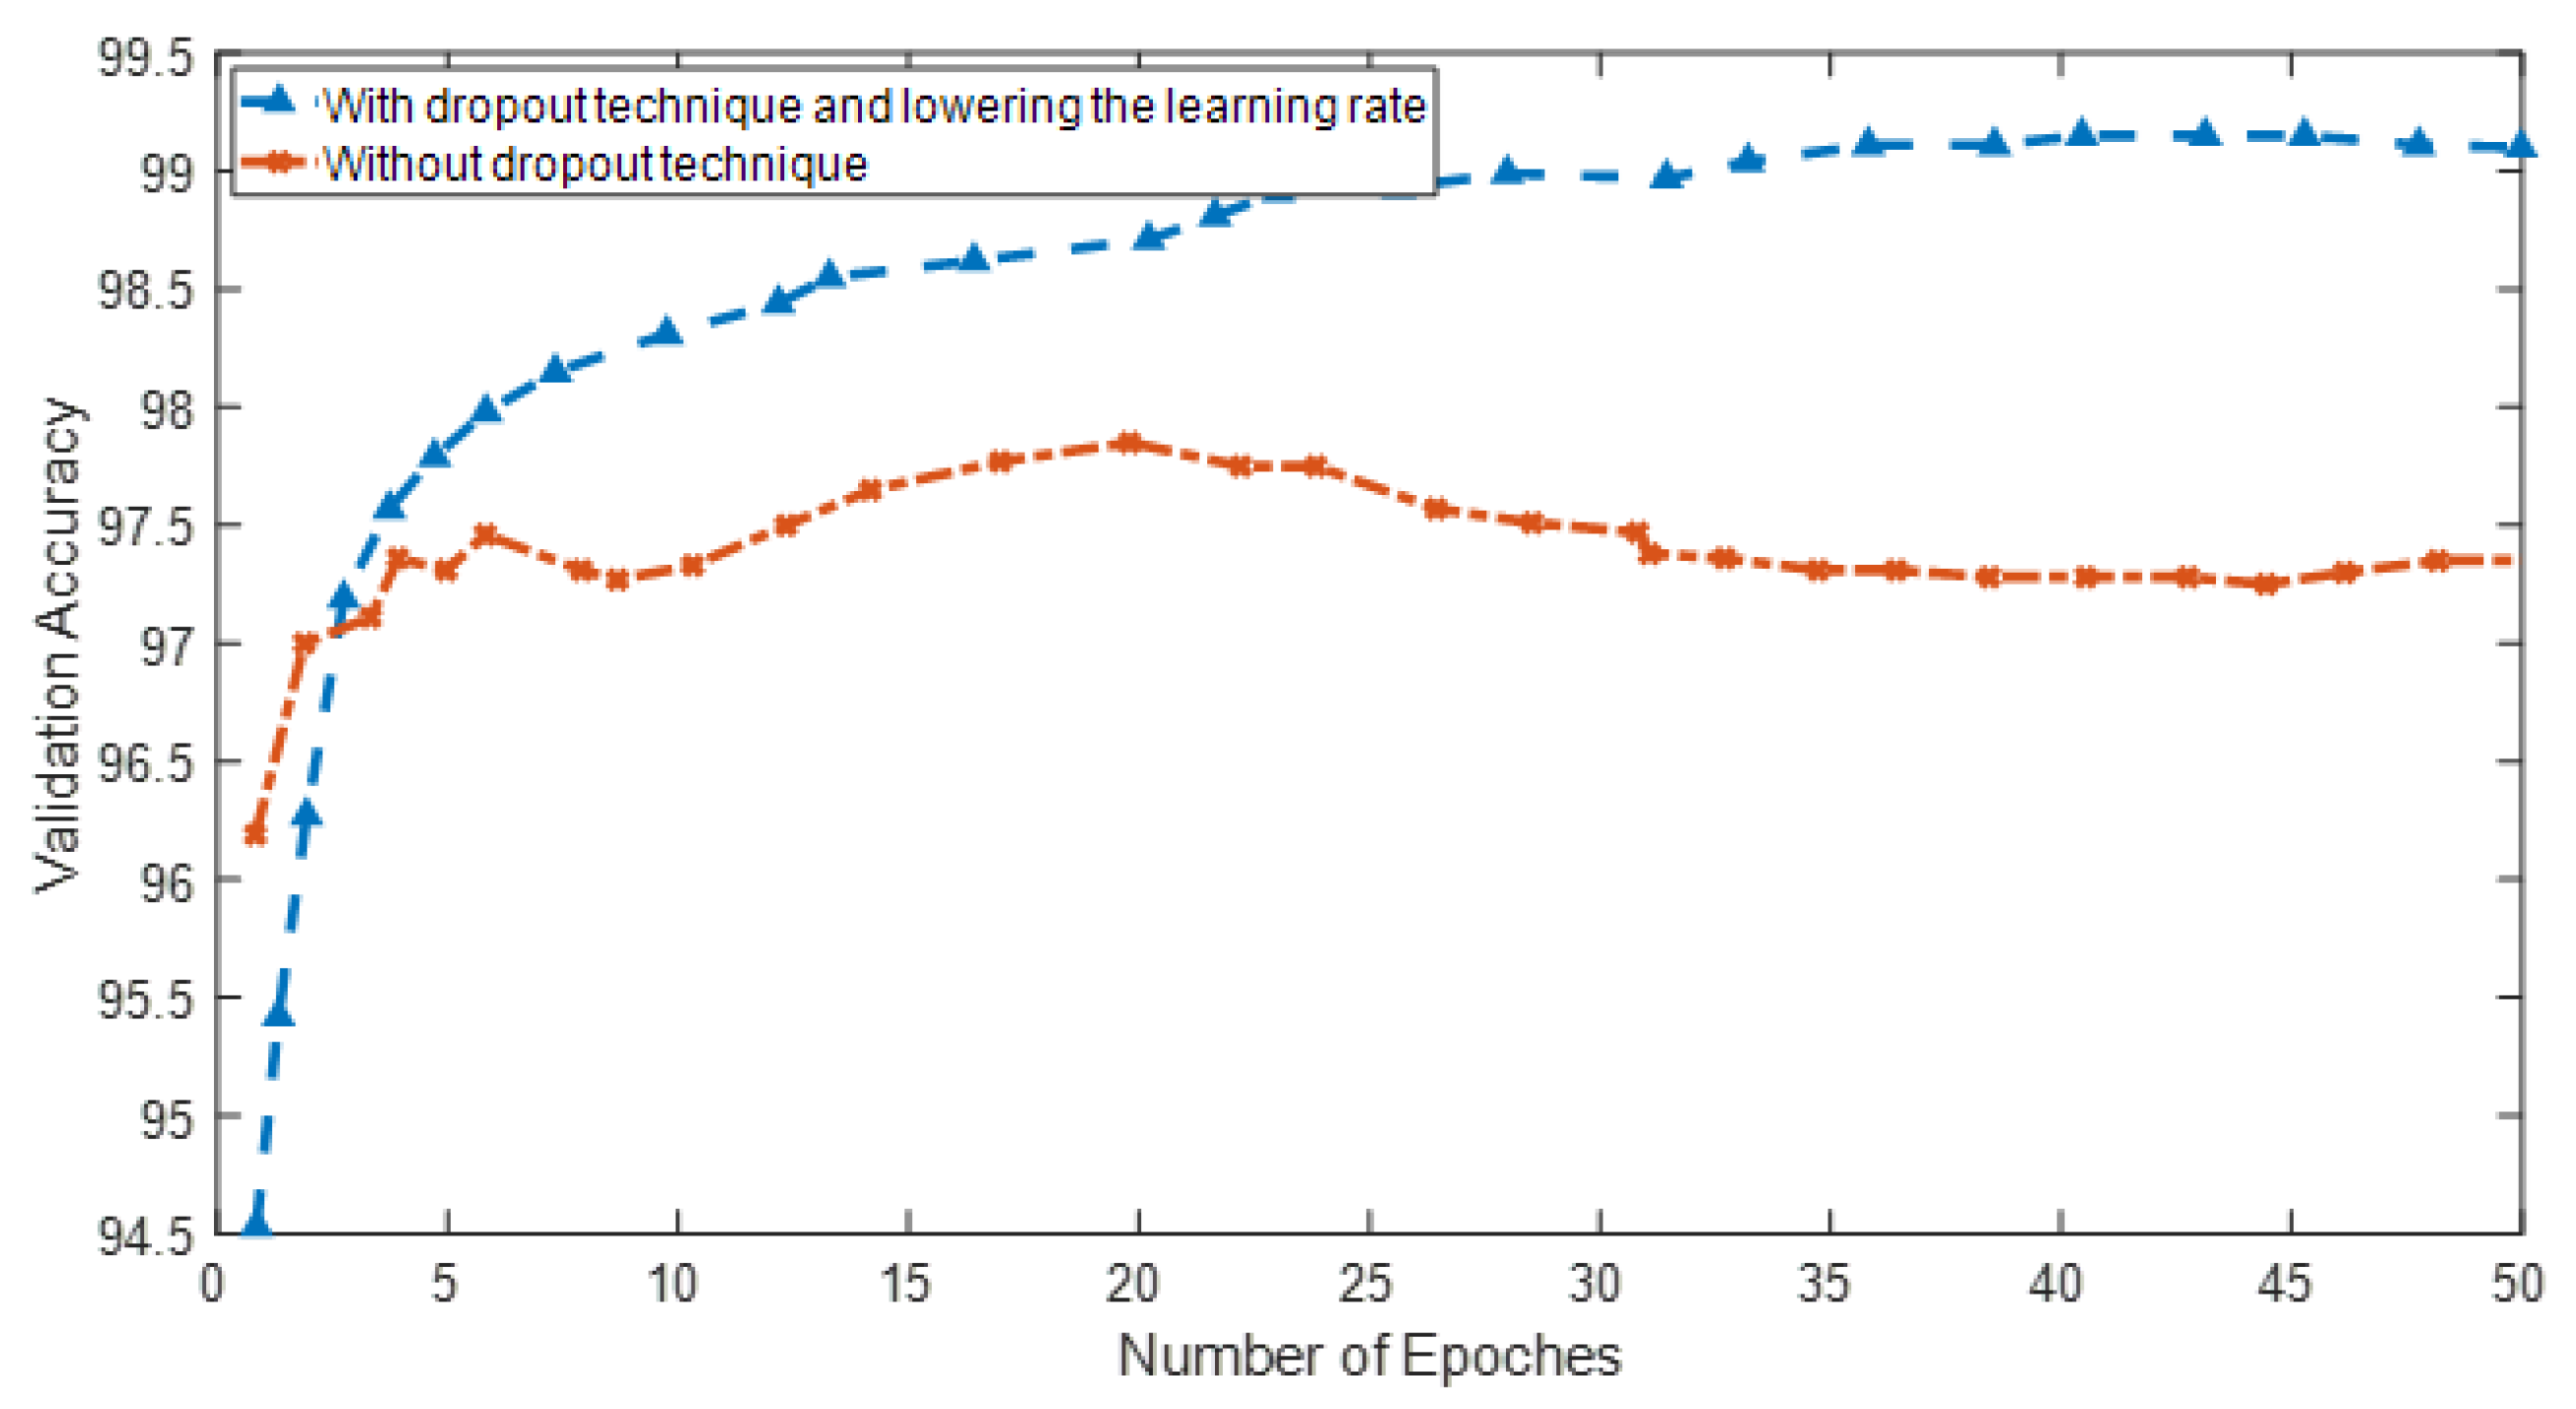
Another suggestion to improve convolutional neural network learning is to use the dropout technique during network training. In this case, the network is more resistant to the noise inputs and outputs of neurons and provides stable representations. It will also affect the performance of the cost function and the better network learning process. The disposal method can be applied in the input and hidden layers with different percentages.
Data Classification Using Artificial Neural Networks (ANNs)
Following the identification of the optimal miRNA subsets through particle swarm optimization (PSO), our method employs an artificial neural network (ANN) for the crucial task of data classification. The architecture of the ANN is meticulously designed to align with the specific requirements of our study. It consists of input neurons that directly correspond to the miRNAs selected during the PSO phase. These neurons are the initial points of data entry into the network. The architecture also includes several hidden layers, which are integral to the network’s computational processing capabilities. These layers are responsible for the intricate internal processing and transformation of the input data. The ANN’s output is handled by output neurons, which are specifically tasked with categorizing the data into distinct cancer types. This structured arrangement of neurons and layers is pivotal to the functionality and effectiveness of the ANN in performing the classification task.
The subsequent phase involves the training of the ANN, which is a critical process in our methodology. For this purpose, the network is exposed to datasets that correspond to the miRNA subsets selected earlier. The training process is comprehensive and iterative, allowing the ANN to gradually develop and refine its ability to recognize and interpret complex patterns in the data. During this phase, the ANN learns to identify specific patterns that are indicative of various cancer types. This learning is achieved through the adjustment of weights and biases within the network, based on the feedback received from the training data. The emphasis on pattern recognition is a key aspect of this phase as it enables the ANN to distinguish between different cancer types based on the unique characteristics present in the miRNA data.
4. Integration of PSO and ANNs for Enhanced Diagnostic Accuracy
Our methodology capitalizes on the synergistic integration of particle swarm optimization (PSO) and artificial neural networks (ANNs) to significantly enhance the accuracy of cancer diagnosis. This integrated approach combines the unique strengths of both PSO and ANNs to create a more robust and effective diagnostic tool. PSO specializes in efficiently reducing the feature space by selecting the most relevant miRNAs. This process is critical in narrowing down the vast array of genetic data to a manageable and more meaningful subset that is likely to have a higher impact on cancer detection. On the other hand, ANNs are renowned for their exceptional capabilities in pattern recognition and classification. Once the feature space is optimized by PSO, ANNs take over to analyze these features, identifying complex patterns and relationships within the data that are indicative of specific cancer types. The combination of PSO’s feature optimization with the ANN’s pattern recognition prowess ensures a more accurate and reliable cancer diagnosis.
A key aspect of our approach is the iterative enhancement process that it employs. This process involves a continuous cycle of refinement and improvement, where PSO and ANNs work in tandem to progressively enhance diagnostic accuracy. In each iteration, PSO adjusts and optimizes the miRNA subsets, effectively fine-tuning the feature set that is fed into the ANN. Concurrently, the ANN adapts to these changes by adjusting its weights and biases, a process that is fundamental to its learning mechanism. This iterative process allows the ANN to become increasingly adept at interpreting the optimized feature set provided by PSO. As a result, the overall accuracy in cancer detection is significantly improved, with each iteration contributing to a more refined and precise diagnostic capability. This continuous loop of optimization and adaptation between PSO and ANNs is what sets our methodology apart, making it a highly effective tool in the fight against cancer.
In assessing the novel integration of particle swarm optimization (PSO) and artificial neural networks (ANNs) for miRNA-based cancer detection, we meticulously compared our hybrid method against existing diagnostic systems. Notably, our approach distinguishes itself by its dynamic optimization and adaptation mechanism. Traditional systems often rely on static feature selection and pattern recognition algorithms that do not adapt to the intricacies of miRNA data. In contrast, our method leverages PSO for an adaptive feature selection process that iteratively refines miRNA subsets based on their predictive value for cancer detection, followed by utilizing ANNs to recognize complex patterns within these optimized subsets. This iterative optimization and adaptation process is specifically designed to enhance diagnostic accuracy by continuously tailoring the analysis to the most relevant genetic markers.
Our hybrid method is characterized by its dynamic interaction between PSO and ANNs. PSO is employed to select informative miRNAs, reducing the dimensionality of the data, and thus focusing the ANN on analyzing the most pertinent features. This synergy allows for a more nuanced analysis of miRNA patterns, which is crucial for accurate cancer detection. The training of the ANN component is conducted using a backpropagation algorithm, adjusted for the complexity of miRNA data, ensuring that the network efficiently learns from the refined feature set provided by PSO.
4.1. Training Details and Parameters
There are several steps in the training of our hybrid system. Firstly, the PSO algorithm selects a subset of miRNAs from the entire dataset based on a fitness function designed to evaluate the potential of each subset in improving cancer detection accuracy. The algorithm meticulously optimizes parameters such as particle velocity, position update rules, and the number of particles to balance the swarm’s exploration and exploitation capabilities. In what follows, we provide an overview of the parameters shown in
Table 1.
PSO Parameters:
- -
Population Size: 100 particles, ensuring a comprehensive search space coverage.
- -
Maximum Iterations: 50, to prevent overfitting and ensure convergence.
- -
c1 (Cognitive Component): 2.0, guiding particles towards their personal best.
- -
c2 (Social Component): 2.0, steering particles towards the global best.
- -
Inertia Weight (w): Decreases from 0.9 to 0.4, facilitating a transition from exploration to exploitation.
ANN Parameters:
- -
Learning Rate: 0.01, ensuring gradual and stable convergence.
- -
Momentum: 0.9, to avoid local minima and accelerate convergence.
- -
Activation Function: ReLU for hidden layers and Softmax for the output layer, optimizing non-linear data mapping and classification.
- -
Number of Hidden Layers: 2, designed based on the complexity of the optimized miRNA feature set.
- -
Neurons per Hidden Layer: Dynamically adjusted based on the PSO-selected features, typically ranging from 20 to 50.
4.2. Addressing Class Imbalance and Data Complexity
A crucial aspect of our methodology is the management of class imbalance in microRNA (miRNA) data, a common challenge in machine learning applications for medical diagnostics. Class imbalance occurs when some classes of data are overrepresented compared to others, potentially leading to biased predictions. In our approach, we implement specific strategies within the artificial neural network (ANN) to address this imbalance. These strategies include techniques such as oversampling the minority class, undersampling the majority class, and implementing cost-sensitive learning where the model assigns higher penalties for misclassifying the minority class. By adopting these measures, we ensure that our ANN classifier remains unbiased and effective, providing equitable and accurate outcomes irrespective of the class distribution in the training data.
The combined use of particle swarm optimization (PSO) and ANNs in our approach also plays a significant role in managing the complexity of miRNA data. MiRNA datasets are typically characterized by high dimensionality and heterogeneity, posing substantial challenges in terms of data analysis and interpretation. The PSO algorithm effectively reduces the feature space by selecting the most relevant miRNAs, thereby simplifying the data complexity before it is inputted into the ANN. Subsequently, the ANN, with its advanced pattern recognition capabilities, is adept at processing these optimized subsets of miRNA data. This dual approach allows for more efficient handling of complex data structures, ensuring that our methodology can effectively navigate the intricacies of miRNA data and provide insightful and reliable results in cancer detection.
Figure 2 shows the difference in learning accuracy using the throw-away technique in the convolution layers and reducing the learning rate.
In this paper, the ReLU function is investigated as an activation function, which is defined by Equation (
12):
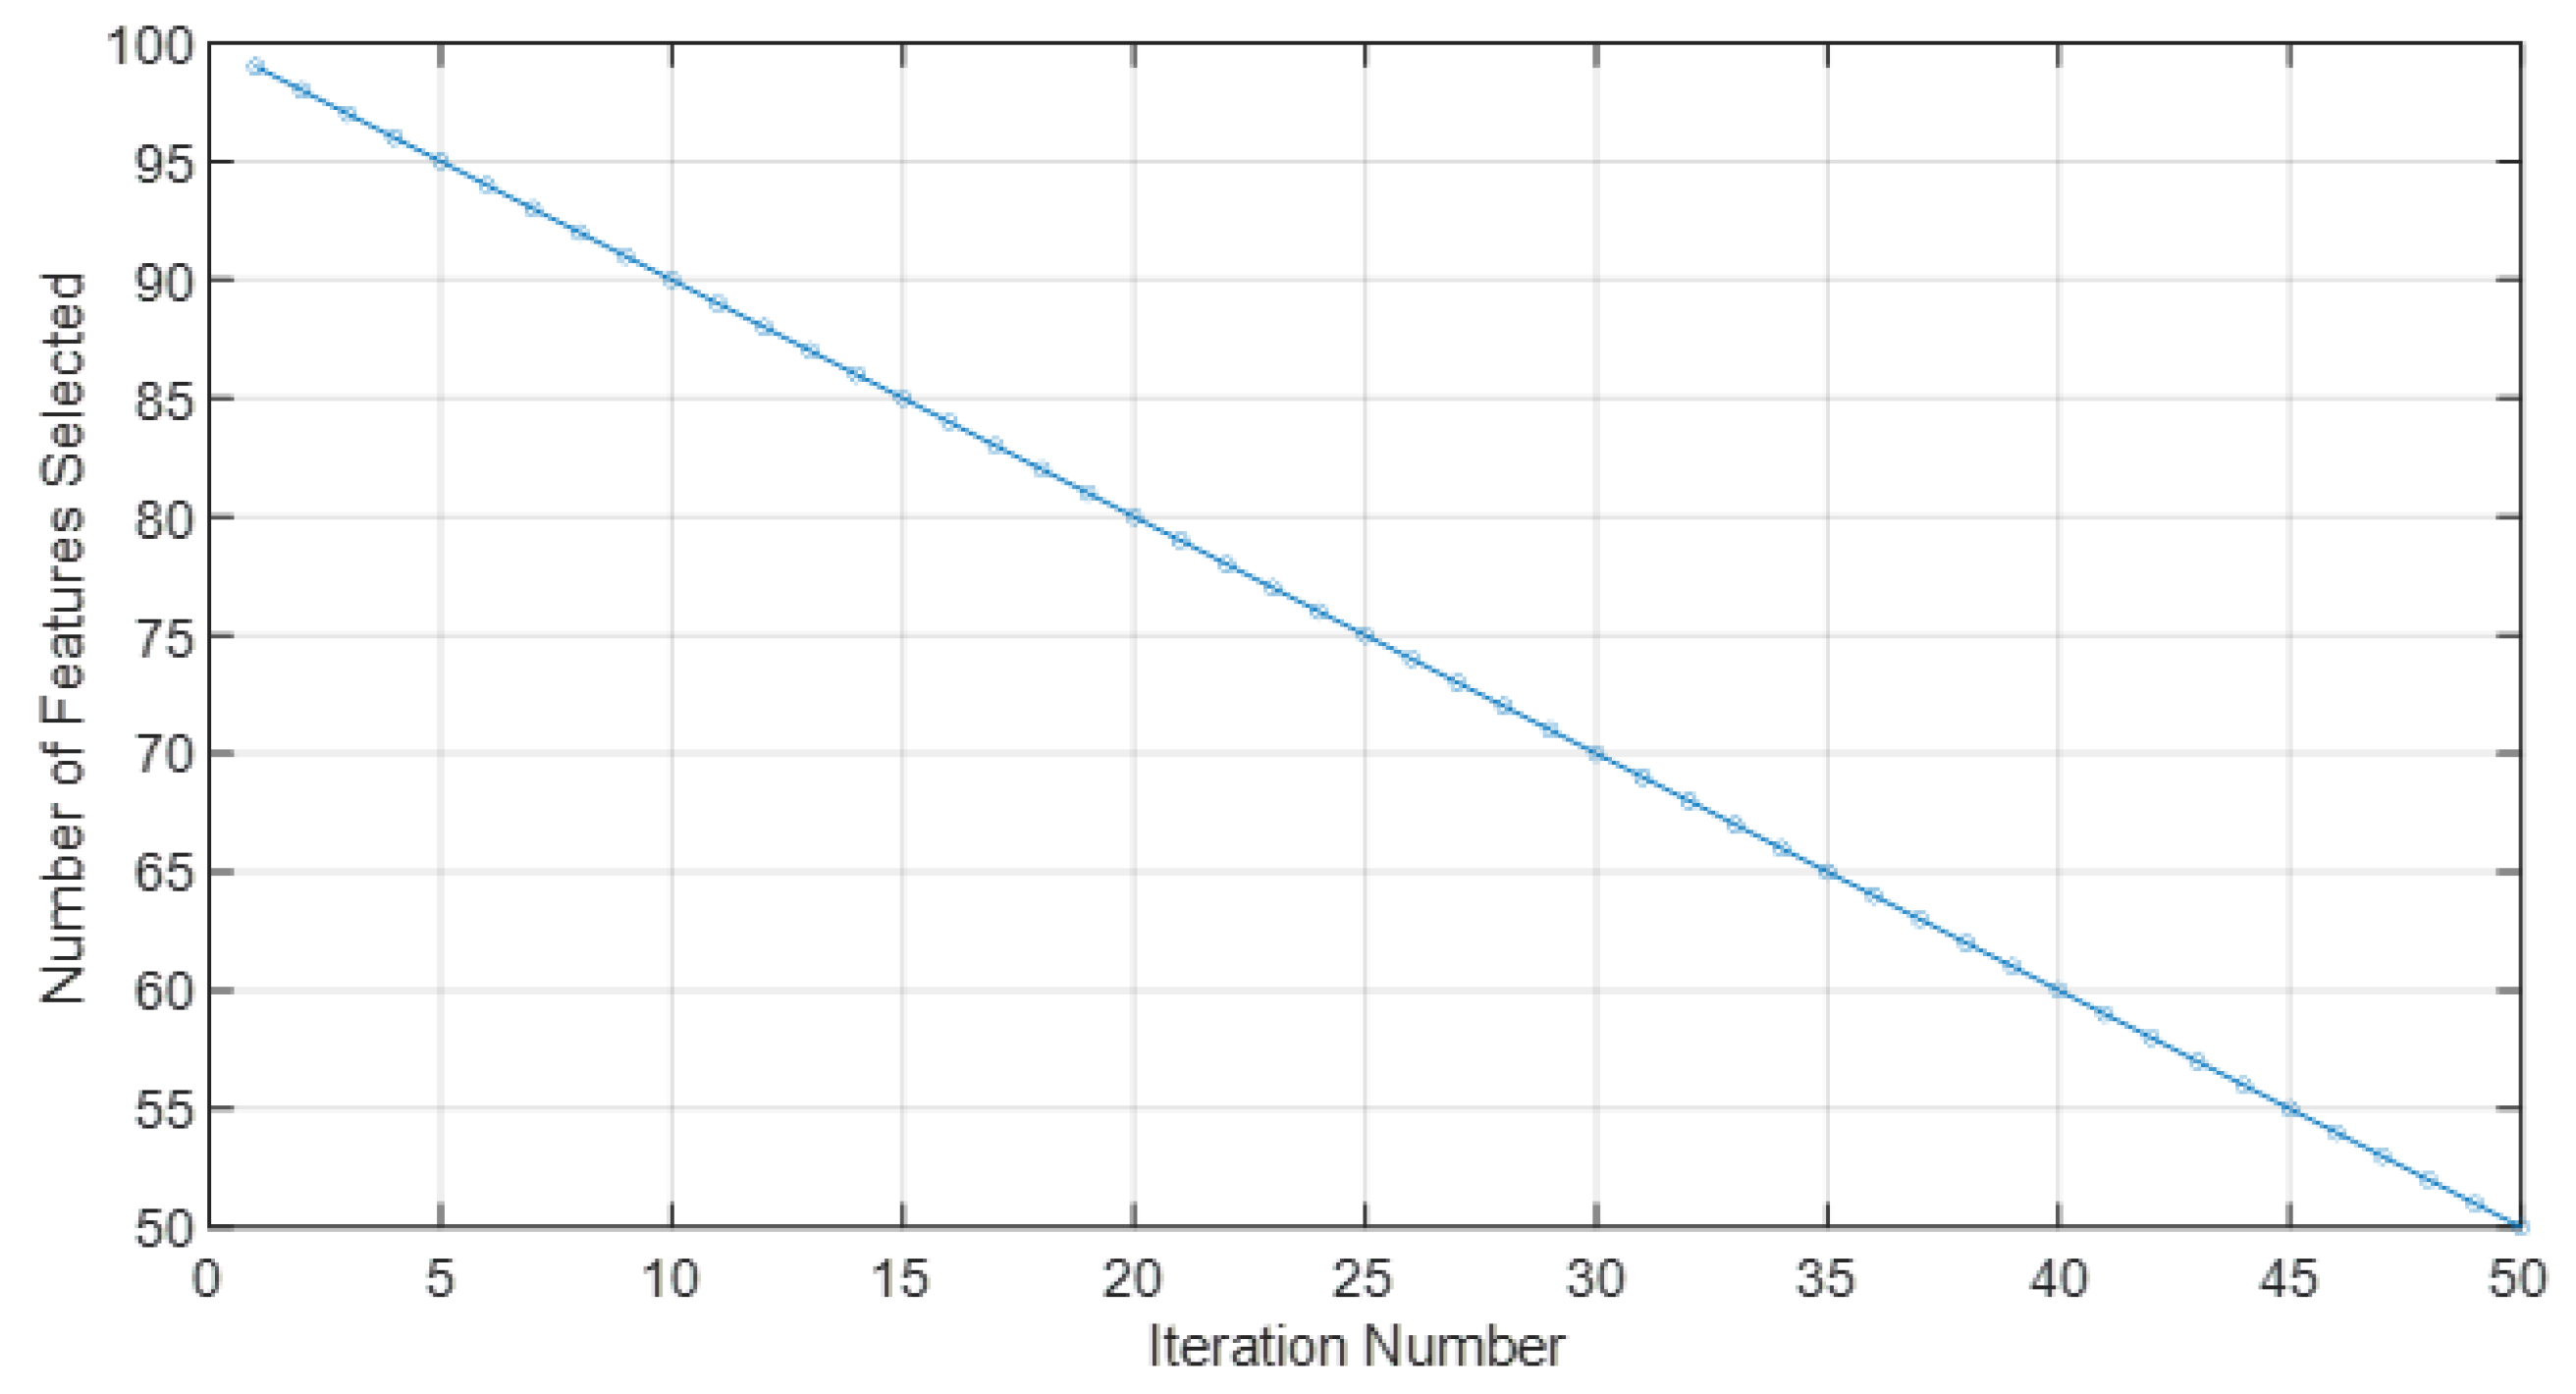
Figure 3 illustrates the dynamic process of feature selection employing particle swarm optimization (PSO), a pivotal stage in the preparation of our dataset for enhanced cancer classification. It vividly demonstrates the PSO algorithm’s efficiency in iteratively refining the pool of microRNAs (miRNAs), where each iteration signifies a step towards optimizing the feature space. Initially encompassing a broad set of miRNAs, the algorithm systematically narrows down to a select subset, pinpointing those miRNAs that hold the most significant predictive power for cancer detection. The
x-axis delineates the number of iterations undertaken by the PSO, while the
y-axis quantifies the remaining features at each iteration. A marked decrease in the number of features across iterations is observed, underscoring the algorithm’s effectiveness in distilling the data to its most informative components. This optimization is crucial for enhancing the subsequent classification accuracy, enabling a focused analysis of the miRNAs most relevant to cancer diagnostics. Presented in
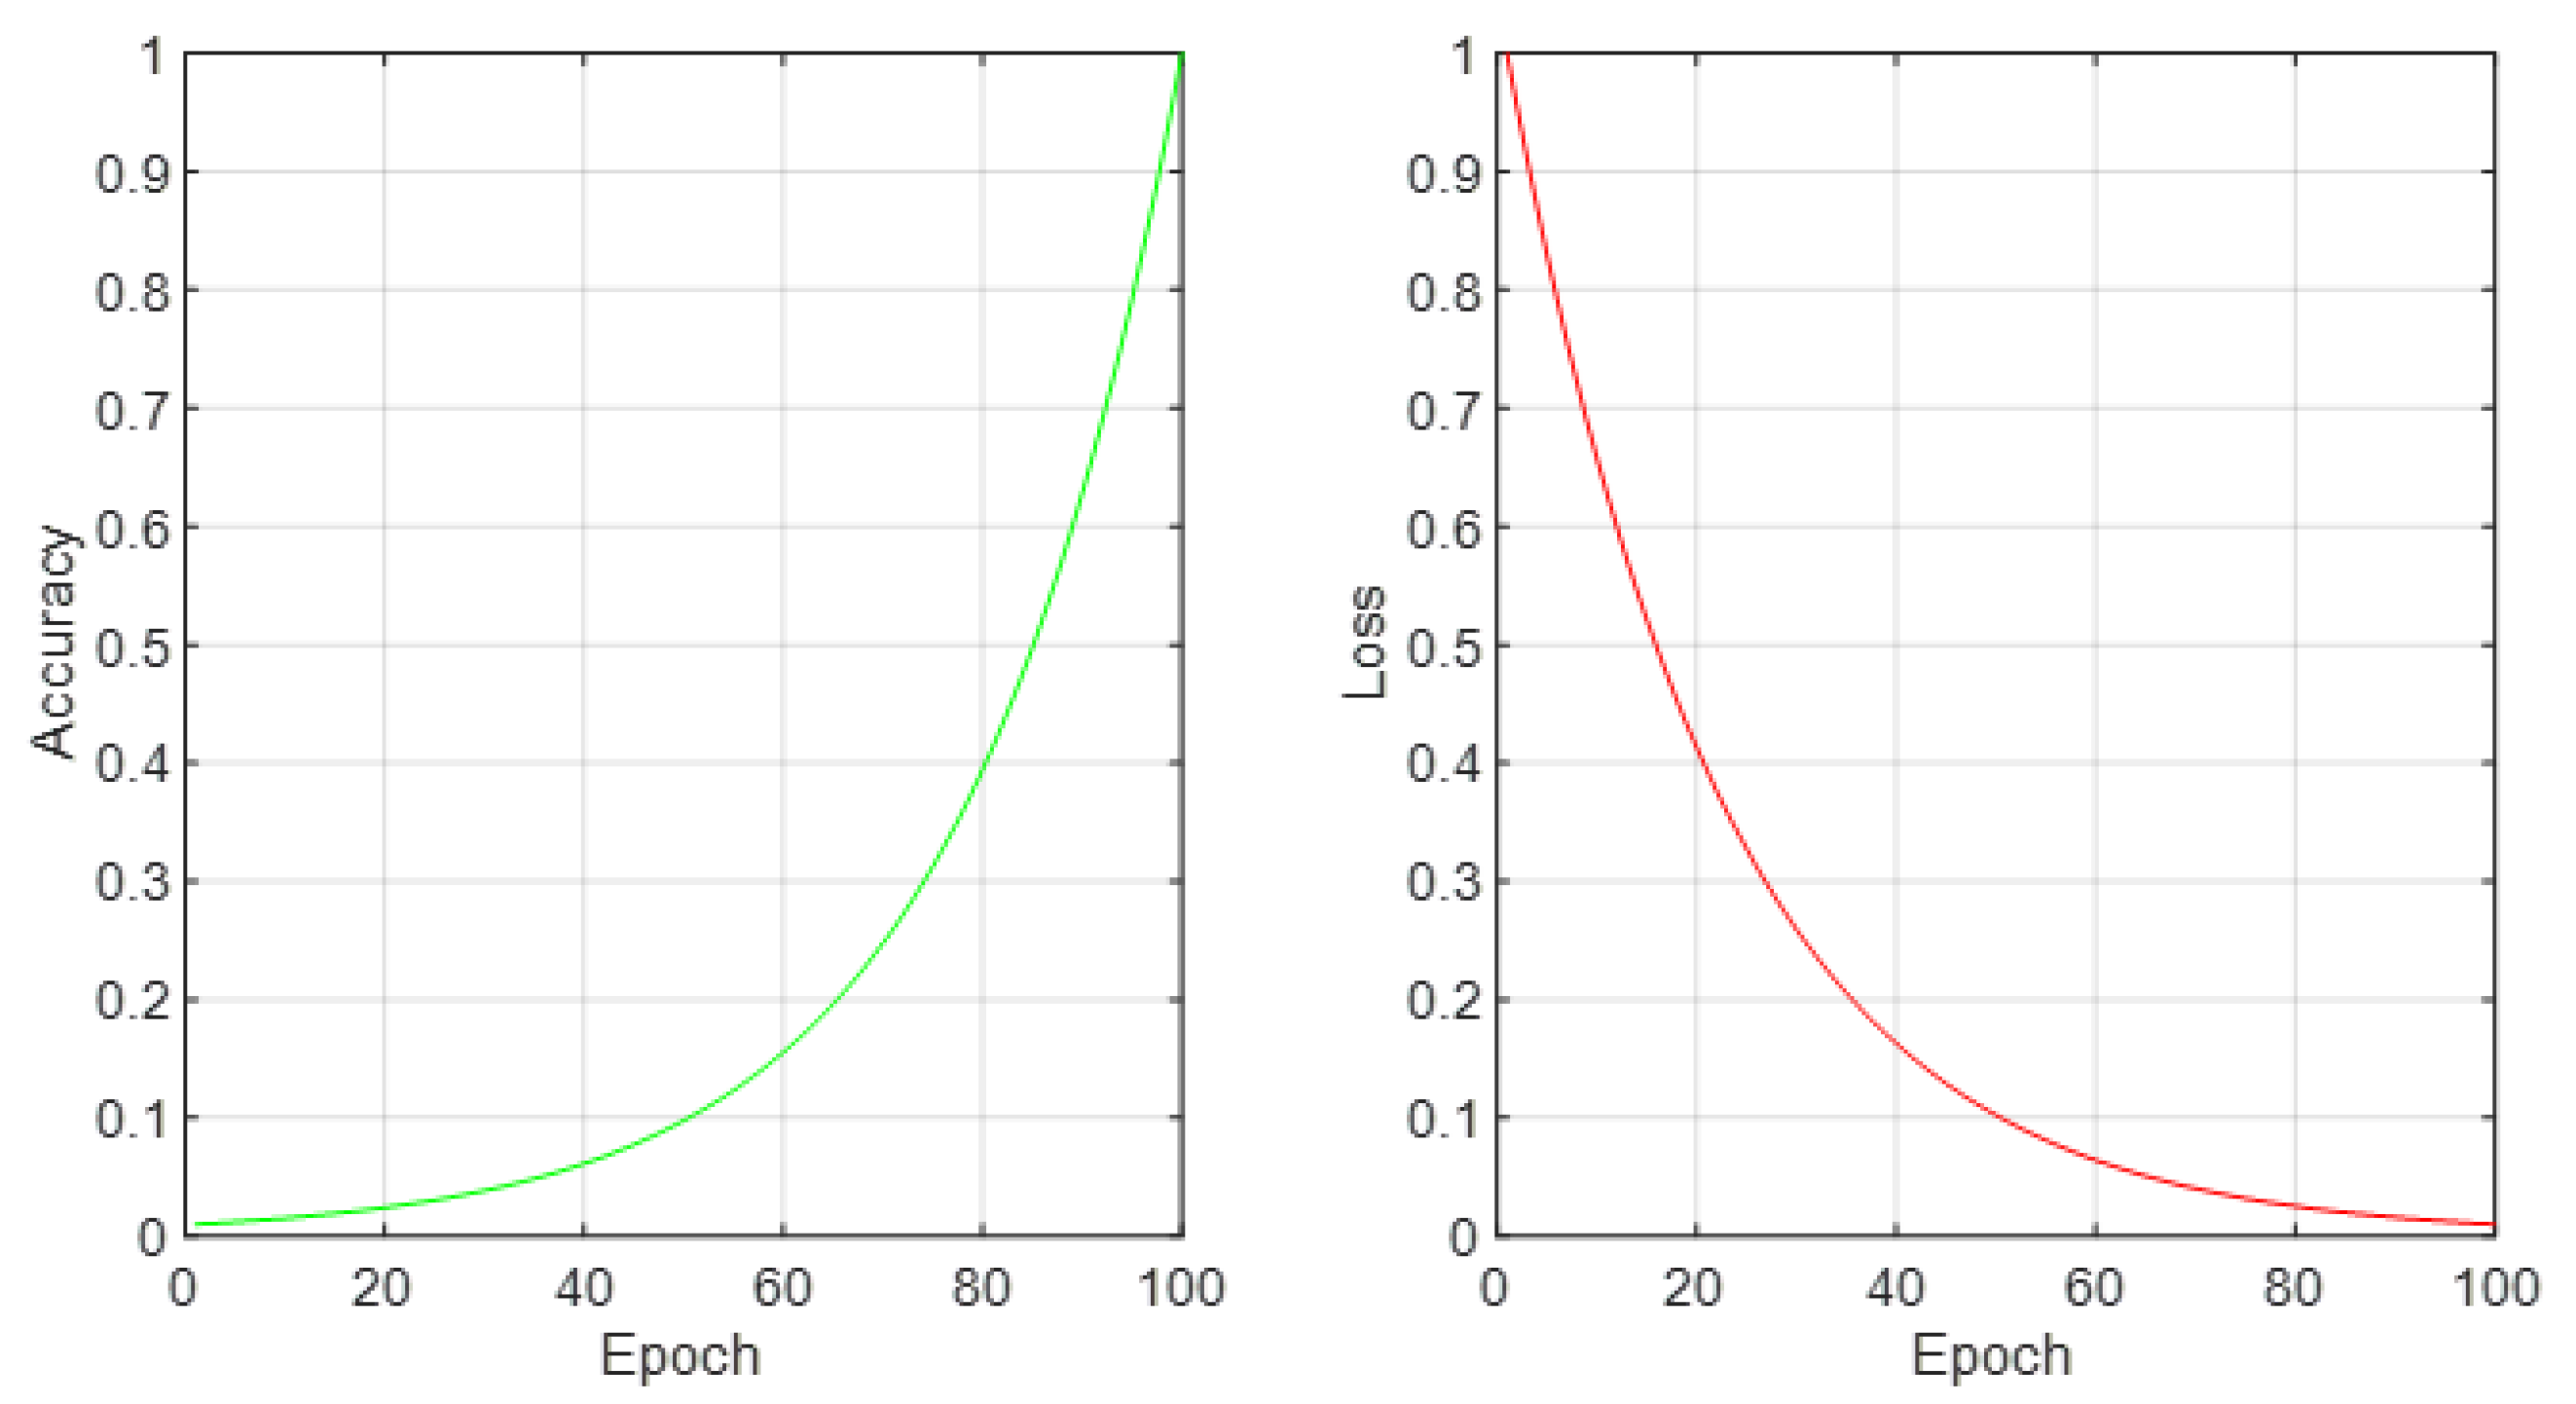
Figure 4 are two critical indicators of the artificial neural network’s (ANN) training progression: accuracy and loss, plotted over the course of numerous epochs. The left subplot showcases the training accuracy, illustrating a trend of continuous improvement as the network processes through epochs. This improvement symbolizes the ANN’s growing proficiency in recognizing and classifying patterns indicative of various cancer types from the optimized miRNA subsets. Conversely, the right subplot displays the training loss, depicting a decline that inversely correlates with the accuracy curve. This reduction in loss is indicative of the ANN’s increasing precision in predictions, fine-tuning its parameters to align closely with the actual outcomes. Together, these plots provide a comprehensive view of the learning mechanics of the ANN, emphasizing a direct relationship between the number of epochs and the model’s performance enhancements. The meticulous tuning over epochs elucidates the network’s capacity to adapt and refine its predictive accuracy, showcasing the potential of machine learning in revolutionizing cancer diagnostics through refined genetic marker analysis.
4.3. Overview of the Dataset
In this study, we utilized three publicly available datasets from the Gene Expression Omnibus (GEO) database, which are renowned for their comprehensive miRNA expression profiles pertinent to cancer research. These datasets were specifically chosen for their diversity in cancer types, including breast cancer, lung cancer, and melanoma, allowing us to assess the efficacy of our proposed method across a spectrum of oncological conditions. Each dataset comprises a balanced mix of samples from both cancerous and non-cancerous tissues, meticulously curated to facilitate binary classification tasks. Before any analytical procedures, we undertook rigorous data preprocessing to normalize expression levels and impute missing values, ensuring the highest data quality and consistency for subsequent analysis. The dataset was divided into an 80:20 train/test ratio, preserving a significant portion for the unbiased evaluation of the model’s performance.
4.4. Configuration/Setting of Parameters/Hyper-Parameters
The particle swarm optimization (PSO) algorithm, integral to our feature selection process, was meticulously configured with the following parameters to ensure an optimal balance between exploration of the solution space and computational efficiency:
Population Size: A total of 100 particles were initialized to ensure a comprehensive exploration of the solution space, allowing for a diverse range of solutions to be evaluated.
Iterations: The algorithm was set to perform a maximum of 50 iterations. This limit was established to balance the need for thorough search capabilities against the constraints of computational efficiency and to prevent overfitting.
Cognitive Coefficient (c1): Set at a value of 2.0, this parameter encourages each particle to prioritize its personal best positions found during the search process, fostering an individualistic approach to solution optimization.
Social Coefficient (c2): Also fixed at a value of 2.0, this coefficient promotes swarm-wide alignment towards the global best solution discovered by any particle, facilitating collective intelligence and convergence towards optimal solutions.
Inertia Weight (w): Initially set at 0.9, the inertia weight linearly decreases to 0.4 throughout iterations. This dynamic adjustment aids in transitioning the swarm’s focus from a broad exploration of the solution space during the initial phases to a more focused exploitation of promising
For the artificial neural networks (ANNs), employed for the classification of cancer based on optimized miRNA features, the following hyper-parameters were carefully optimized:
Learning Rate: A learning rate of 0.01 was chosen to ensure a steady convergence towards the global minimum of the loss function while minimizing the risk of overshooting due to too large step sizes.
Momentum: Set at 0.9, the momentum term assists in overcoming potential local minima and stabilizes the convergence process, leveraging previous updates to inform current adjustments.
Activation Functions: The Rectified Linear Unit (ReLU) function was employed for hidden layers, selected for its effectiveness in handling non-linear relationships within the data and preventing vanishing gradient issues. For the output layer, the Softmax function was utilized to facilitate a probabilistic interpretation of the model’s outputs, enabling clear classification between cancerous and non-cancerous samples.
Number of Hidden Layers: Our model includes two hidden layers, with the number of neurons per layer dynamically adjusted based on the dimensionality of the feature set selected by PSO, typically ranging between 20 and 50 neurons. This configuration was determined to provide sufficient model complexity for capturing intricate patterns in the data, without unnecessarily increasing computational demand.
The configuration of these parameters and hyper-parameters was based on extensive preliminary experimentation and validation on a subset of the data. This rigorous approach ensures that our PSO-ANN hybrid model achieves a high degree of accuracy and generalizability across different types of cancer datasets.
4.5. Evaluation Metrics Employed
To evaluate the classification results, three indicators, namely sensitivity, specificity, and accuracy according to Relations (
13)–(
15) were used.
True-Positive Answer (TP): There are records in this category that are in the positive category and the classifier has correctly identified them as positive.
True-Negative Answer (TN): There are records in this category that are in the negative category and the classifier has correctly identified them as negative.
False-Positive Answer (FP): Records in this category that are in the negative category and have been incorrectly identified as positive by the classifier.
False-Negative Answer (FN): Records in this category that are in the positive category and have been incorrectly identified as negative by the classifier.
In addition to accuracy, precision, and recall, the F1-Score is a crucial metric in evaluating the performance of our proposed hybrid PSO-ANN model. The F1-Score provides a harmonic mean of precision and recall, offering a single metric that balances the trade-off between these two important measures. It is particularly useful in scenarios where equal importance is assigned to precision and recall. The formula for calculating the F1-Score is given by:
In this research, the F1-Score complements our evaluation by providing a balanced view of the model’s diagnostic performance across different cancer types.
5. Results and Discussion
The results of the proposed method are as follows. To better express the accuracy, we use the perturbation matrix presented in
Table 2,
Table 3 and
Table 4.
The problem of selecting a subset of miRNAs means identifying and selecting a useful subset of miRNAs from the primary dataset. It is also an important topic in analyzing the degree of correlation in the classification contexts used to reduce the dimensions of the miRNAs set. This is performed by removing miRNAs that produce noise or that have little correlation with other miRNAs.
This research aims to select the most efficient and effective subset of miRNA, which leads to improved computational efficiency, creating faster and less costly classifications. In this paper, an approach to reduce the size of miRNAs in datasets using a particle swarm optimization algorithm in the diagnosis of cancers is presented.
To comprehensively evaluate the efficiency of our proposed hybrid PSO-ANN model, we report not only on its accuracy but also on the computational time required for processing each cancer-type dataset. The computational efficiency of our model is critical for its practical application in clinical settings, where timely diagnosis can significantly impact patient outcomes.
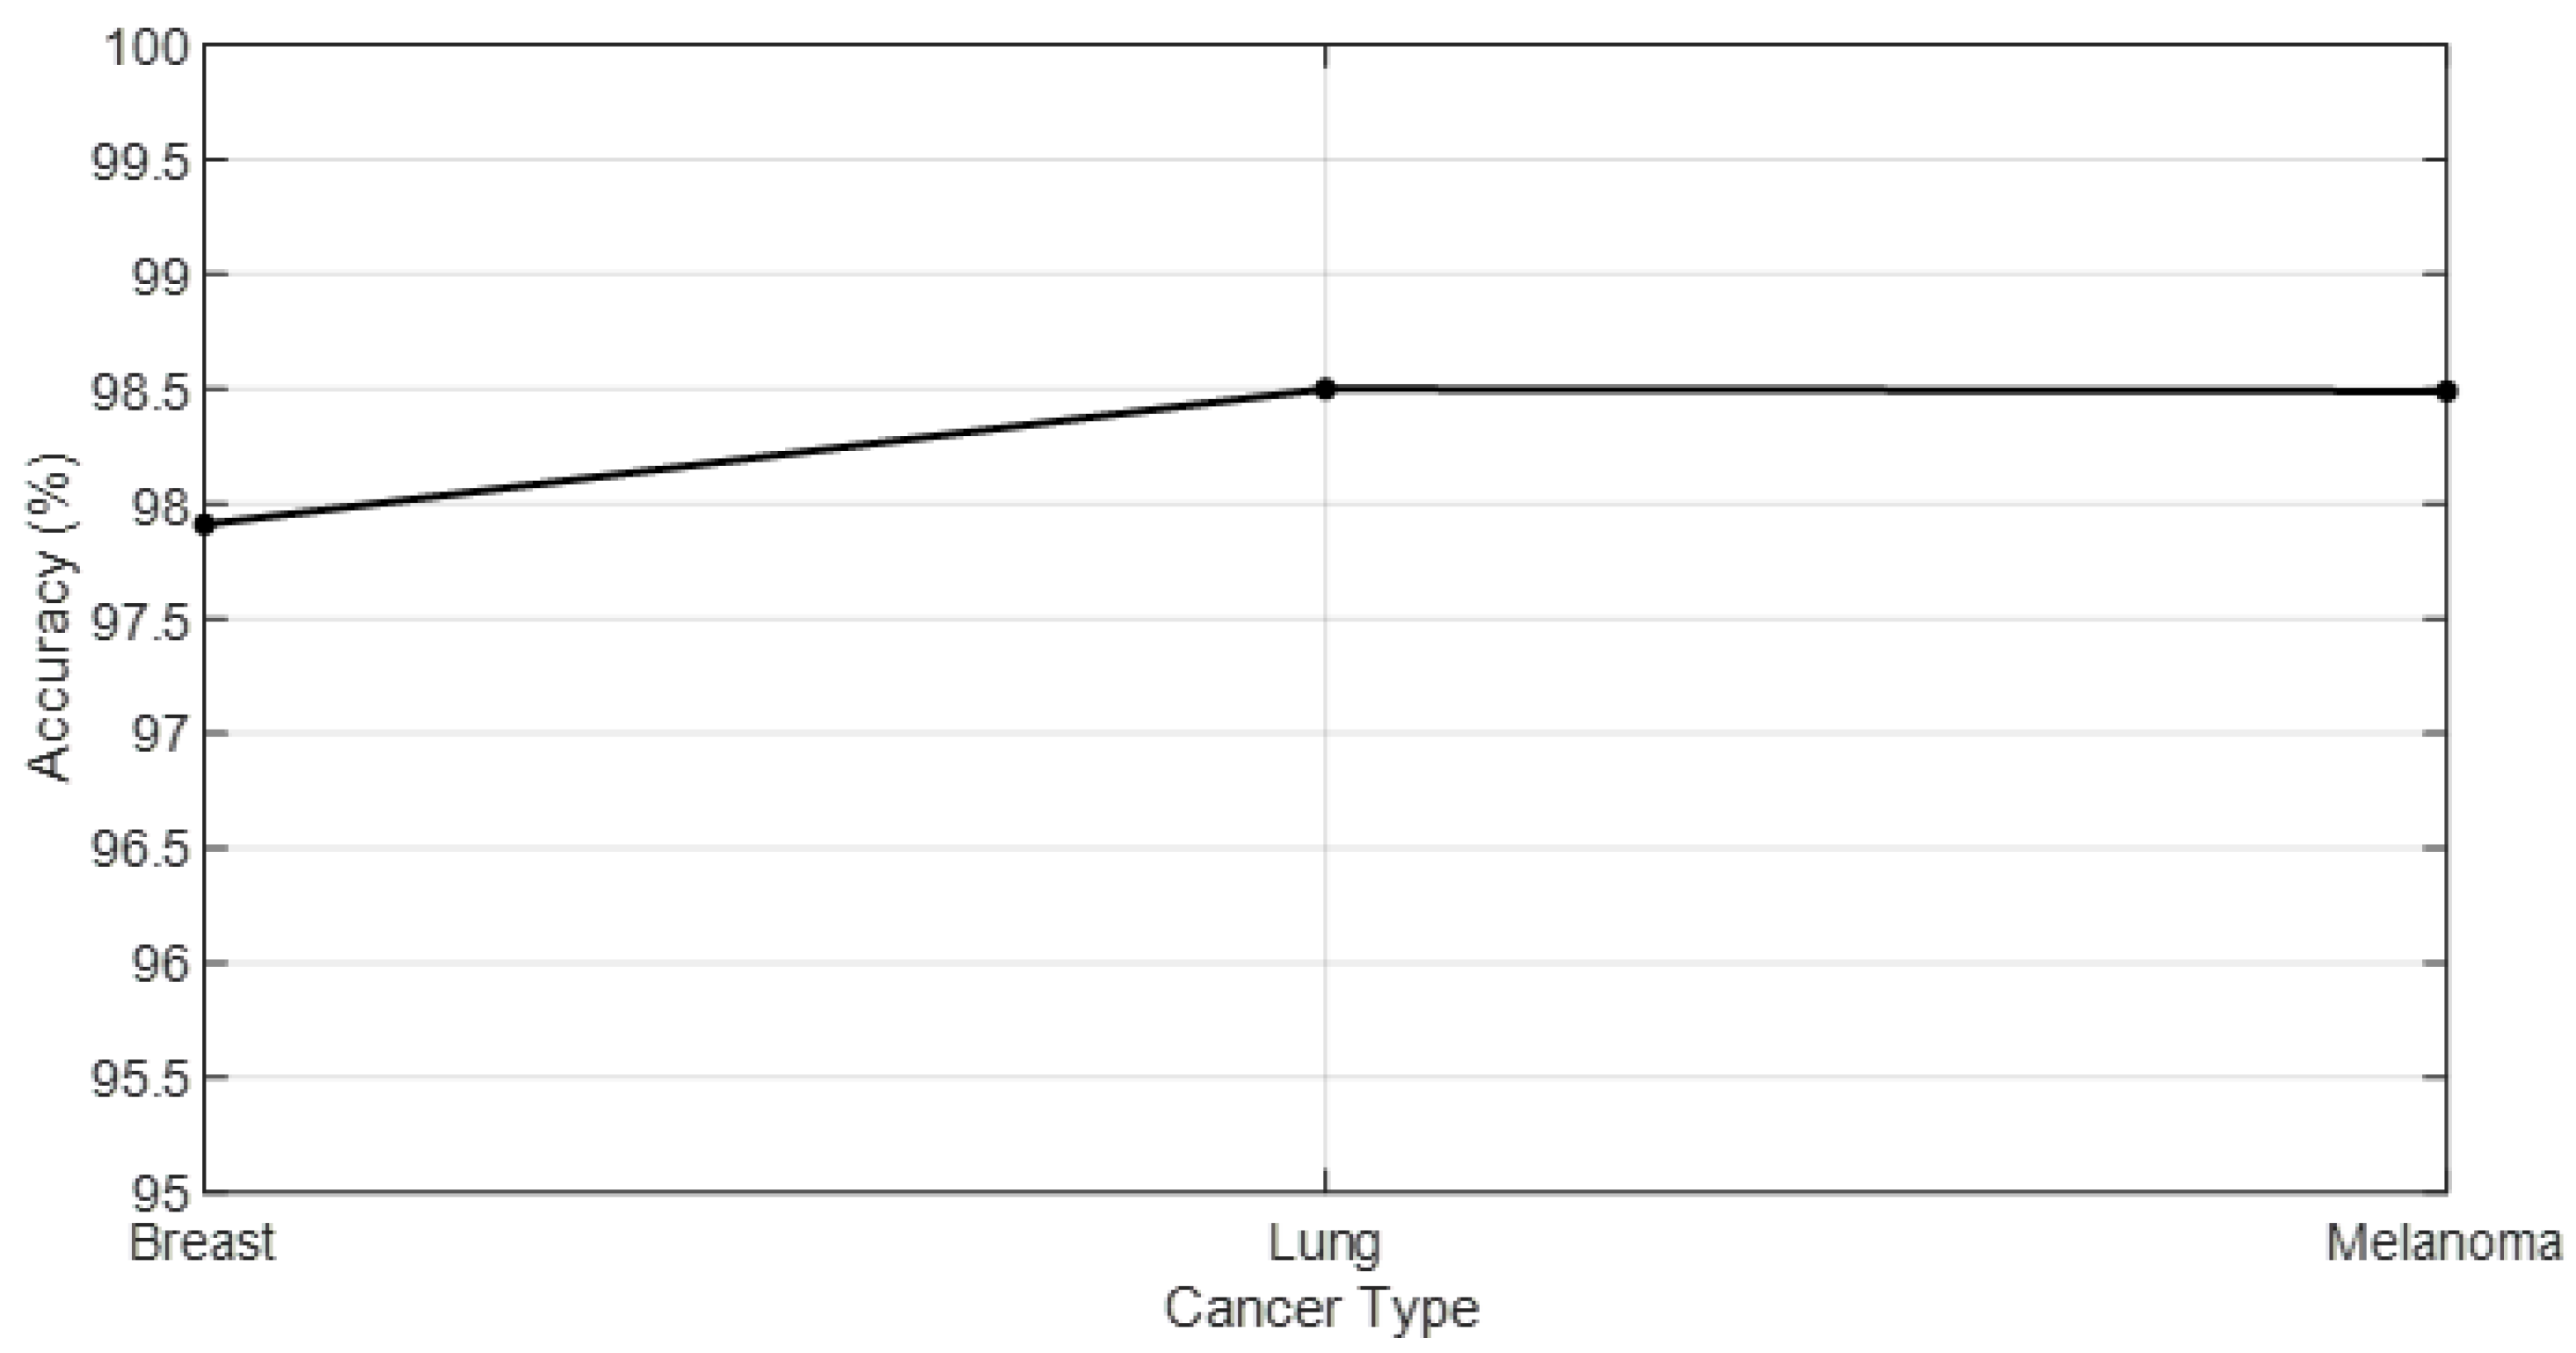
Table 5 presents the computational times recorded for the classification of breast cancer, lung cancer, and melanoma, while
Figure 5 shows the accuracy values predicted across different cancer types.
These times were recorded on a computational setup with an Intel i7 processor and 16 GB RAM, underscoring the model’s applicability in real-world diagnostic scenarios. The reported times encompass the entire process from data preprocessing, through feature selection with PSO, to the final classification with ANNs. This comprehensive approach ensures that our model not only provides high accuracy but also operates within a reasonable time frame, making it a viable option for clinical applications.
Table 6 showcases the performance metrics and computational efficiency of our enhanced model across three different types of cancer: breast cancer, lung cancer, and melanoma. The table is structured to provide a comprehensive overview of the model’s diagnostic accuracy, precision in identifying true positives, recall (or sensitivity) indicating the model’s ability to detect all relevant instances, and the F1 Score, which is the harmonic mean of precision and recall, offering a balance between the two. Additionally, the computational time in minutes indicates the efficiency with which the model processes each cancer type’s dataset. Below are the specifics for each metric and cancer type:
Breast Cancer: The model achieved an accuracy of 98.5%, with precision and recall rates of 98.7% and 98.6%, respectively, resulting in an F1 Score of 98.6%. These metrics indicate that the model is exceptionally reliable in identifying breast cancer from miRNA patterns. The computational time of 15 min reflects the model’s efficiency in processing breast cancer datasets.
Lung Cancer: For lung cancer, the model’s accuracy is slightly lower at 97.9%, with precision and recall of 97.5% and 98.0%, respectively, leading to an F1 Score of 97.7%. These results still demonstrate a high level of diagnostic accuracy, showcasing the model’s capability in lung cancer detection. The computational time for lung cancer is 12 min, indicating a faster processing time compared to breast cancer datasets.
Melanoma: The model’s performance in melanoma detection is the highest among the three, with an accuracy of 99.1%, precision of 99.0%, recall of 99.2%, and an F1 Score of 99.1%. These metrics underscore the model’s outstanding effectiveness in melanoma diagnosis. The computational time for melanoma is 18 min, which is the longest among the three but is justified by the high-performance metrics.
The results presented in
Table 6 illustrate the robustness and efficiency of our enhanced model in cancer detection using miRNA data. The high accuracy, precision, recall, and F1 Scores across all three cancer types indicate that the model not only accurately classifies cancer presence but does so with a high degree of reliability, minimizing both false positives and false negatives. This balance is critical in clinical settings, where both over-diagnosis and under-diagnosis have significant implications. The slight variations in performance metrics and computational times across different cancer types may be attributed to the inherent differences in miRNA expression patterns and dataset complexities. Melanoma, showing the highest performance metrics, suggests that miRNA patterns associated with this cancer type might be more distinct, enabling more precise model predictions. Conversely, the slightly lower metrics for lung cancer, though still highly accurate, could reflect greater variability or less distinct patterns within the lung cancer miRNA data. The computational times, ranging from 12 to 18 min, highlight the model’s efficiency in processing complex genetic data. This efficiency is paramount in clinical applications, where timely diagnosis can significantly impact patient outcomes. The model’s ability to provide rapid and accurate diagnostic assessments makes it a valuable tool for oncologists, potentially aiding in the early detection of cancer and the customization of treatment plans based on specific miRNA profiles.
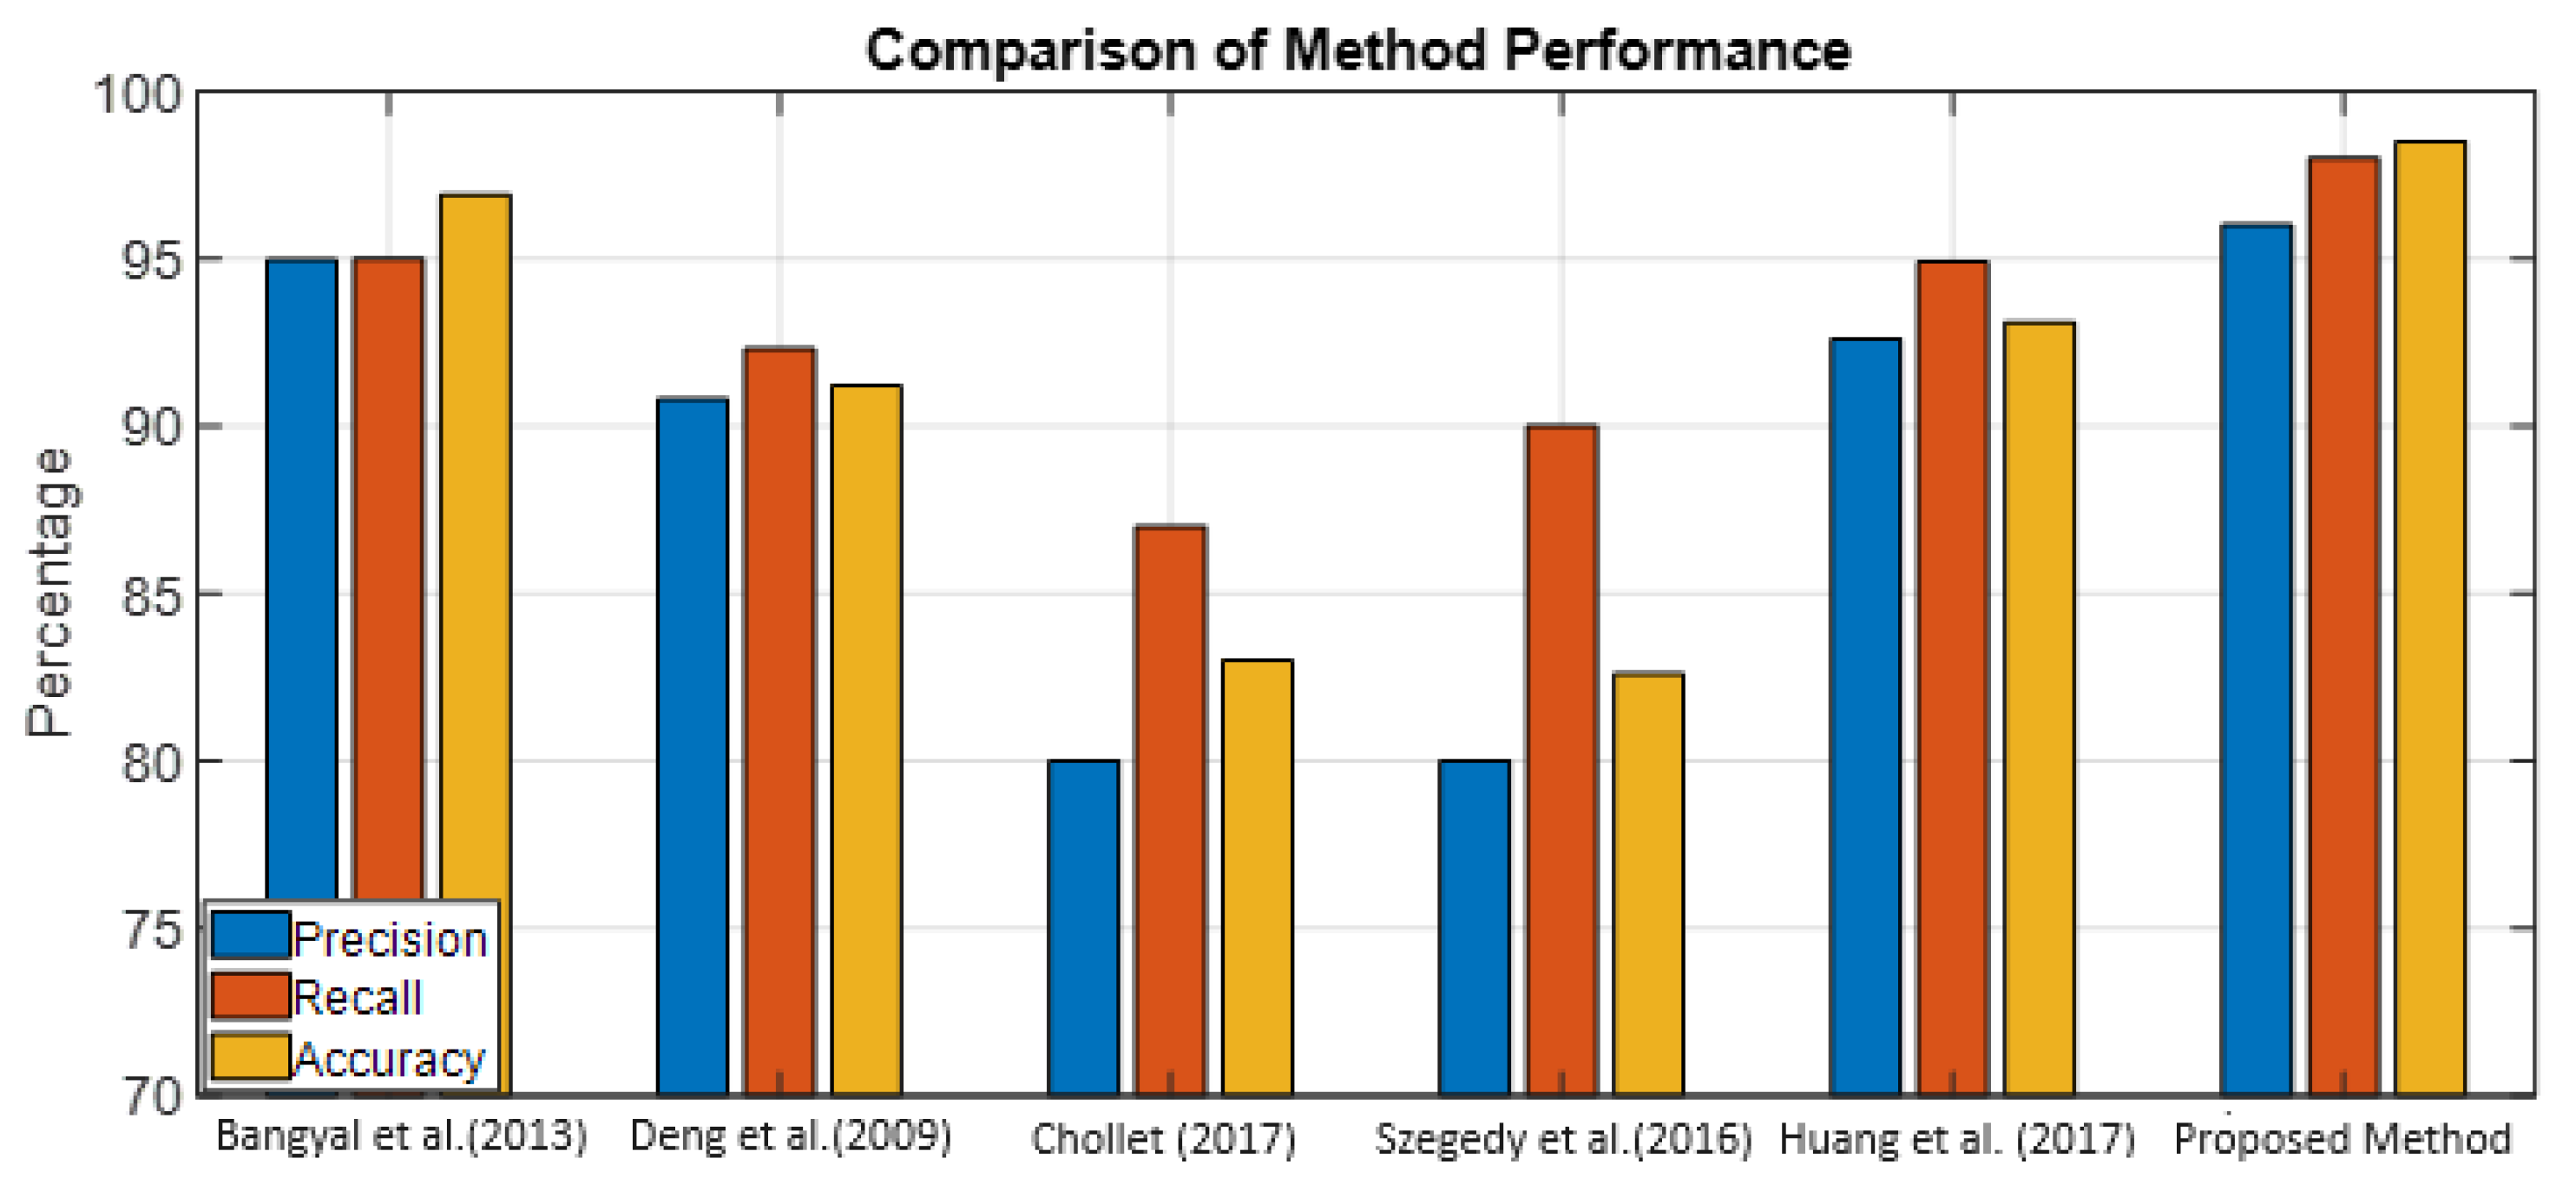
Finally, the results of breast cancer accuracy are compared with other methods, which are the result of improving the accuracy of the proposed method in
Table 7 and
Figure 6.
6. Conclusions and Future Directions
Our research on microRNAs (miRNAs) as markers for cancer represents a significant stride in both theoretical understanding and practical application in the field of oncology. By introducing a feature-based approach that harnesses particle swarm optimization, we have illuminated the critical role of miRNAs in cancer detection. Our method does not treat all miRNAs equally but rather selectively identifies those most relevant to specific cancer types. Theoretically, this research enhances our comprehension of miRNA behaviour and its implications in cancer biology. Practically, it offers a more refined and focused lens for cancer detection, paving the way for more targeted and effective diagnostic strategies.
One of the key contributions of this study is the integration of particle swarm optimization with artificial neural networks (ANNs). This integration is pivotal in identifying and classifying cancer-affecting miRNAs, thereby advancing the field of computational biology in cancer research. The use of ANNs to discern patterns in miRNA data presents a novel approach to predicting cancer presence in patients, significantly improving accuracy over traditional methods. Additionally, the implementation of dropout techniques during network training addresses the common challenge of overfitting, contributing to the stability and efficiency of the learning process. From a practical standpoint, this research offers several advantages. Firstly, the precision in selecting miRNAs facilitates early and accurate cancer detection, which is crucial for effective treatment. The methodology’s scalability and adaptability make it suitable for a wide range of cancer types, potentially transforming diagnostic processes in clinical settings. Furthermore, by reducing the computational complexity and costs associated with miRNA analysis, our approach is both resource-efficient and accessible, making it a viable option for widespread application in healthcare. Ultimately, our study stands to significantly impact patient outcomes through earlier diagnosis and personalized treatment plans.
Despite the promising outcomes of our research, it is important to acknowledge certain limitations inherent in our study. Firstly, the effectiveness of the particle swarm optimization (PSO) algorithm largely depends on the initial parameter settings, which can impact the convergence and optimization results. A suboptimal parameter selection may lead to premature convergence or an inability to find the global optimum. Additionally, while artificial neural networks (ANNs) are powerful tools for pattern recognition, their performance is contingent on the quality and size of the training data. In cases where training data is limited or imbalanced, the ANN may not perform optimally. Another limitation is the potential overfitting in ANNs, where the model becomes too tailored to the training data, reducing its generalizability to new, unseen data. Furthermore, our approach requires significant computational resources, especially in handling large miRNA datasets, which might not be feasible in all research or clinical settings. Lastly, the current study is focused on specific types of cancers, and the results may not be directly transferable to other types or subtypes of cancer without further adaptation and validation. These limitations highlight areas for future research and development to enhance the robustness and applicability of our methodology in diverse cancer diagnostic scenarios.
In conclusion, the findings from our study on miRNA-based cancer detection underscore a leap forward in both theoretical understanding and practical application in cancer diagnostics. The proposed technique, combining particle swarm optimization with ANNs, marks a significant advancement in the precise identification of cancer-associated miRNAs. This approach not only enhances the accuracy of cancer detection but also contributes to the broader realm of personalized medicine, where such methodologies can be adapted to cater to individual patient profiles, leading to more effective and tailored treatment strategies.


