1. Introduction
Every online interaction, social media post, financial transaction, sensor reading, and digital communication generates data. The proliferation of digital technologies, the widespread use of the internet, and the advent of connected devices have contributed to this massive growth in data. Furthermore, organizations accumulate vast amounts of data in the form of customer records, sales transactions, operational logs, and so on. As a result, an unprecedented amount of data is available for processing and analysis. A data warehouse is a central repository that deals with highly structured, cleansed, processed, stored, and integrated data from a variety of sources to give business intelligence users and decision-makers a single view [
1]. These data are processed by an Extract–Transform–Load (ETL) process. The are two types of processes for extracting data from various sources: full extraction and incremental extraction. The data are then transformed through actions such as joining, converting, filtering, cleaning, aggregation, and so on. Finally, these transformed data are loaded into a data warehouse [
2,
3]. Full extraction is employed when replicating data from a source for the first time or when some sources cannot identify changed data, necessitating a complete reload for the entire table. Incremental extraction is utilized when some data sources cannot provide notifications about updates but can identify modified records and extract them [
4]. Cleaning is essential for data warehouses before data are stored; for example, erroneous or misleading information will result from duplicated, inaccurate, or missing data. Data cleaning is regarded as one of the most difficult tasks in data warehousing throughout the ETL process due to the vast variety of possible data discrepancies and the enormous amount of data [
5]. Recently, there has been a growing interest in the ELT approach, which prioritizes loading data into a data warehouse before performing transformations. This approach gains speed by delaying the transformation until it is necessary. This ELT process is becoming popular where business requirements are rapidly changing. ‘EL’ essentially implies data replication in numerous real-world scenarios, and the problem is to accomplish it efficiently and with high accuracy. ELT has grown in popularity owing to a variety of causes. Data are being created in ever-increasing quantities, frequently without human intervention. Storage is becoming more affordable, whether on-premises or in the cloud. With the proliferation of open-source technologies (e.g., Apache Spark, Apache Hadoop, and Apache Hive) and cloud solutions (e.g., Microsoft Azure, Google Cloud, and AWS), the cloud provides low-cost solutions for analyzing disparate and dispersed data sources in an integrated environment [
6]. Based on the sources of the internet, the growth of data has increased incredibly with different types of structured, semi-structured, and unstructured data, and that gives an idea of how much the volume of data has increased [
7,
8]. Structured data are information that is well ordered and stored in a relational database or a spreadsheet. Semi-structured data are data that have not been recorded in standard ways. Nevertheless, the data are not entirely unstructured; examples include metadata and emails. Text, photos, and videos are examples of unstructured data. Text data have garnered special attention among various forms of unstructured data, as they stand out as the most suitable technique for describing and conveying information [
9]. These data are distinguished by their complexity, variety, volume, and application specificity and are generally referred to as big data.
Big data are a large number of datasets that are difficult to store and process using existing database management tools [
10]. Big data have some characteristics, denoted by 5Vs: volume, velocity, veracity, variety, and value [
11]. Volume refers to the size of the data, velocity refers to the speed of the data from the sources to the destination (data flow), variety refers to different format types of the data, veracity refers to the quality of the data, and value refers to the importance of the data collected without analysis and insight [
12]. Lastly, the characteristics have become more than ten, like volatility and visualization value [
13]. Recently, organizations aimed to obtain a comprehensive overview of big data within a data warehouse, encompassing all unstructured data, posing a significant challenge. Many researchers and developers are making efforts to learn how to use big data in data warehouses. These challenges impose significant constraints on building, storing, transforming, and analyzing a data warehouse in a timely and scalable manner without impacting end users, which led to the emergence of the concept of a data lake.
The approach outlined in this paper employs the concept of a “data lakehouse” to formulate an ECLT model aimed at reducing the processing time for unstructured data through four steps: extract, clean, load, and transform (ECLT). In our approach, we take into account both volume and variety, utilizing Spark as a processing engine to extract all text data into RDD. During the data cleaning phase, the approach is designed to identify errors, duplicated data, and any noisy data, addressing and resolving these issues to ensure that all data are cleaned before being loaded into a data lake storage. The subsequent step in the data lake loading phase involves converting text data into tabular data using a regular expression pattern. Following this, a Hive table is created to store the tabular data, facilitating easy handling and querying of the data for potential transformations using Spark SQL, such as aggregation, filtering, or counting. ECLT is designed to process unstructured data with a focus on text data, making it suitable for various textual data types, including medical reports or Wikipedia articles. In this paper, log data are employed as a case study to measure the execution time of the proposed model and compare it with other models.
The summary of the contribution is outlined as follows: (1) reducing execution time in a pre-processing model; (2) developing the proposed model (ECLT), consisting of four phases; (3) incorporating a cleaning stage after data extraction to expedite the conversion from text to table, with the transformation stage not significantly extending the overall time; (4) converting data from unstructured to structured during the loading phase; (5) loading structured data into the Hive table; (6) conducting experiments on different models using two datasets; (7) evaluating the proposed model (ECLT) in comparison to other models.
The rest of the paper is structured as follows:
Section 2 provides an overview of the concepts of data lakes and the technology used in the proposed model.
Section 3 reviews the related work.
Section 4 describes the proposed model ECLT for big data, defines the cleaning phase before the loading, and describes the result of execution time when applying the ECLT using the data lake. Next,
Section 5 presents the results from our experiments, and then, in
Section 6, we discuss them. Finally,
Section 7 concludes the paper and presents future work.
2. Overview
2.1. Data Lake
A data lake is a headquartered repository that keeps massive amounts of raw, unprocessed, and diversified data in its natural format [
14,
15]. It is intended to hold structured, semi-structured, and unstructured data, offering an expandable and affordable data storage and analysis solution. Data are gathered in a data lake through a variety of sources, such as databases, log files, social media feeds, and sensors. Data lakes, unlike typical data storage platforms, do not impose a fixed structure or schema on data at the moment of input. Instead, data are saved in their raw form, keeping their natural structure and inherent flexibility. Because the structure and purpose of the data may be specified later within the analysis phase, this strategy allows businesses to gather huge volumes of data without the requirement for prior data modeling. So, on the other hand, it is seen as the next stage in displacing data warehouses as an enhanced present approach to raw analytics information storage [
16,
17]. While a data lake has tremendous benefits, it also has certain drawbacks. Because data lakes hold raw and unprocessed data, they are exposed to data quality, security, and privacy challenges. Without effective governance and data management techniques, a data lake may quickly devolve into a data swamp. A data swamp is a data lake that has become bloated with inconsistent, incomplete, erroneous, and ungoverned data. It is frequently caused by a lack of processes and standards that are not effectively regulated. As a result, data in a data swamp are difficult to locate, process, and analyze. Users may need to invest substantial time and effort in data searches and understanding the data’s context when there is no defined data model or schema [
18]. Given the advantages and disadvantages of both data warehouses and data lakes, a recent approach has emerged, known as a data lakehouse.
A data lakehouse is a combination of both a data warehouse and a data lake. A data lakehouse is a single and integrated platform that combines a data lake’s scalability and flexibility with a data warehouse’s structured querying and performance improvements. It provides enterprises with a unified platform for organized, semi-structured, and unstructured data. It removes the need for separate storage systems and enables users to effortlessly access and analyze various kinds of data. A data lakehouse allows for schema evolution. It supports schema-on-read, allowing users to apply schemas and structures while querying data. In addition, cloud-based storage and computation resources are used in a data lakehouse, allowing enterprises to expand resources as needed and employ sophisticated query engines, such as Apache Spark or Presto, to analyze enormous amounts of data quickly and efficiently [
19,
20].
2.2. Spark and Hive
Spark is a powerful distributed processing system that provides a simple tool for analyzing heterogeneous data from various sources. It supports batch processing, real-time processing, and near-real-time processing (DStream). Spark can be deployed as a stand-alone cluster (if associated with a capable storage layer) or as an alternative to the MapReduce system by connecting to Hadoop. Spark uses a model called Resilient Distributed Datasets (RDDs) to implement batch calculations in memory, which allows it to maintain fault tolerance without having to write to disk after each operation [
21]. As a result, the buffer memory enables it to process a large volume of incoming data, increasing overall throughput, and thus, in-memory processing contributes significantly to speed. Batch processing in Spark offers incredible advantages in terms of speed and memory consumption. Spark, which stores intermediate results in memory, is only influenced by the HDFS configuration when reading the initial input and writing the final output [
22]. In ELT, new data sources can be easily added to the model. Consequently, various transformations may be applied to the data as needs vary. When raw data are loaded, numerous transformations can be implemented based on changes in requirements [
23]. There are big data processing technologies like Map-Reduce, Storm, Kafka, Sqoop, and Flink; the best technology for parallelism is Spark. Spark Core serves as the foundational execution engine for the Spark platform, serving as the base for all other functionalities. It offers capabilities for working with Resilient Distributed Datasets (RDDs) and performing in-memory computing tasks. PySpark serves as a Python interface for Apache Spark, enabling the development of Spark applications and the analysis of data within a distributed environment and allowing users to write data from Spark DataFrame or RDDs to Hive tables [
24].
Hive is a data warehousing infrastructure tool based on the Hadoop Distributed File System (HDFS) [
25,
26] used for analyzing, managing, and querying large amounts of data distributed on the HDFS. Reading and writing data are supported by Hive. Hive is mainly used for structured data, but for this paper, we can load text data using SerDe, which stands for “Serializer and Deserializer”. When an object is transformed into a binary format for writing to permanent storage, such as the HDFS, this process is referred to as serialization, while the process of converting binary data back into objects is known as deserialization. Tables are turned into row elements in Hive, and then row objects are put onto the HDFS using a built-in Hive serializer. These row objects are then transformed back into tables using a built-in Hive Deserializer. Hive is allowed to integrate with other data processing tools. For example, the HCatalog SerDe allows reading and writing Hive tables via Spark.
3. Related Work
Unstructured data are critical to decision-making, as several studies have shown [
27]. According to the white paper [
28], 80% of a corporation’s data consists of semi-structured and unstructured data.
3.1. ETL in Big Data
In [
29], the author proposed a scalable dimension ETL called Cloud-ETL using Hadoop as a platform and Hive as a warehouse system. Although experiments were performed using map-reduce and proved that cloud ETL is faster than Hadoop++ and ETLMR, they were not mentioned in ELT. In [
30], the author proposed a new approach called BigDimETL for processing unstructured data using MapReduce and HBase as a warehousing system using the NoSQL database. It speeds up data handling by providing distributed storage capabilities. An experiment was performed to measure execution time using a join algorithm, but there was no comparative analysis, in particular, in Spark and Hive. The authors of [
31] used the ETL application to process and analyze the streaming data and compared Spark SQL and Hive QL, and the results showed that the execution time of Spark SQL is less than that of Hive QL and that Spark SQL has better performance.
The author of [
32] developed a processing model of ETL for unstructured data in a data warehouse using MapReduce for processing and Pig for querying data. After the extraction stage, the data are cleaned, transformed, and finally loaded into the HDFS. There has been no experiment performed to prove this process model. In [
33], the author discussed the proposed on-demand ETL approach for processing data, but applying it to achieve transformation in a parallel way leads to reduced processing time but continual maintenance of the complex parallel system, so the author needed to propose three blocks to obtain the data: first, converting from ETL to ELT; second, on-demand processing; and third, a monitoring component to ensure that consumers can be aware of data, even if queries demanding the data have not been executed yet.
The work presented in [
34] is a scalable ETL in big data streaming that uses three scenarios for common ETL. Three scenarios exist: without aggregated data, aggregated data based on a predefined time, and aggregation within a single user session. In [
35] and [
36], the authors proposed an architecture to integrate data warehouse architecture with big data technologies such as Hadoop and Apache Spark for handling unstructured data and huge datasets using a data lake without any experiments. In [
37], the author suggested an ETLMR architecture that uses MapReduce to run separate ETL processes in parallel and supports common ETL operations for dimensional schemas. However, it does not support dynamic partitioning, which would enable it to adjust to parallel execution automatically when nodes are added to or removed from a cluster.
The authors of [
38] proposed Os-ETL, a novel ETL solution developed to combine heterogeneous data with large-scale data warehousing environments. This solution intends to increase the speed, flexibility, and performance of data integration operations. By using Scala’s open-source nature and scalability, it may deliver major gains in managing a variety of data sources inside data warehousing systems.
The authors of [
39] proposed a new distributed architecture called Open ETL, which supports both batch and stream processing and is implemented within the Spark framework. They provided a real-life case study using the LUBM benchmark, which involves heterogeneous data sources, to evaluate their approach through three separate experiments. The first experiment focused on the scalability of the proposed system, the second compared the response time of the proposed system with the PDI tool, and the third evaluated the loading time of the ETL process after a change in the sources.
3.2. ELT in Big Data
In [
40], the author proposed ELTL using Spark. The process involves extracting the data, loading the ingested data into the data lake to enable real-time analytics, and then transforming the loaded data before ultimately loading them into a data warehouse. This approach requires additional resources for the data transformation step. The work presented in [
41] developed the Extract–Load–Transform–Analysis (ELTA) model and showed the difference between ETL and ELT. It proved that ELT is better than ETL. Ref. [
42] describes the ETL pre-processing step for collecting and analyzing data from multiple data sources to ensure the data are reliable and help with decision-making in an academic data analysis model.
According to the author of [
43], the transformation stage is divided into two parts: cleaning and transformation. The cleaning stage involves cleaning dirty and inconsistent data and storing the cleaned data in the middle library, and then these data are transformed. This division enhanced the performance but did not work with big data. In [
44], the author proposed an approach called DETL (delayed ETL) that delays the decision of how to perform a transformation until the context of the analysis is understood. The experiment proved that the proposed approach is better than ETL and ELT when using large volumes of data. So, this approach was taken in our experiment.
3.3. Big Data Warehouse and Data Lake
In [
45], a DL architecture using web server access logs (WSALs) that facilitates the storage of massive amounts of raw log files is proposed. These logs can then undergo transformation and advanced analytic procedures without the need for a structured writing scheme that transforms log files into Parquets, consequently reducing the storage space compared to the original size. The study in [
2] recommends the use of big data technologies in conjunction with a data warehouse to aid top-level management decision-making at universities. It is advised that Hadoop be used as a big data analysis tool for data ingestion and staging. The study investigates the distinctions between traditional data warehouses and current data warehouses, emphasizing the modern data warehouse’s ability to manage large amounts of data in the educational system. In [
18], the suggested method identifies and eliminates bad data, leaving only high-quality research material in the CRIS domain. This results in more accurate insights and data-driven decisions. A data lake combined with data wrangling provides a scalable platform for storing and analyzing huge volumes of research data, turning various data kinds and formats into structured data without the need for programming. In [
46], the author describes the design of the BigO system, which collects large-scale data from children using sensor technologies in order to construct obesity prevalence models for data-driven predictions concerning particular policies at the community level. The paper suggests a three-layered data warehouse architecture for the proposed system, comprising a back-end layer for data collection, an access control layer with role-based permissions, and a controller layer that oversees data access protocols [
20]. It is considered that the existing data warehouse design will be replaced by the lakehouse architecture, which is built on open direct-access data formats, enables machine learning and data science workloads, and provides cutting-edge performance. On TPC-DS, reporting results from a lakehouse system utilizing Parquet are competitive with popular cloud data warehouses.
3.4. Cleaning Data
Cleaning data involves detecting, revising, changing, and organizing raw data. Relax EEG is a data cleaning pipeline model proposed by the authors. It aims to enhance the quality and reliability of EEG data by systematically addressing various types of artifacts and noise [
47]. In [
48], the authors focused on cleaning data, especially focusing on outlier identification techniques, and a comprehensive survey was performed for outlier detection algorithms. The authors discussed the approaches utilized for cleaning large data streams, detecting potential cleaning concerns, and assessing the effectiveness of the techniques used.
Methodologies utilized to assess the efficacy of these treatments were also discovered [
49]. Missing values, duplicated data, outliers, and irrelevant data were listed as cleaning concerns that may arise throughout the cleaning process. It is believed that the prospects of cleaning huge data streams prompt the investigation of dynamic functional continuous monitoring and real-time feedback to enhance cleaning algorithms and methodologies.
As described in Ref. [
50], ATDC is a revolutionary evidence-based training data cleaning approach that automatically verifies and corrects labels of noisy training data, boosting classification performance without the need for further human interaction. A mechanism for automatically finding and rectifying labeling errors in texts was proposed. Experiments were conducted to validate the higher quality of document selection based on tougher evidence-validation approaches for training. The authors of [
51] proposed a cleaning algorithm in cloud computing using Map-Reduce for massive data mining and analysis. The approach, based on a data parallel strategy, significantly reduced MapReduce job start and scheduling time, enhancing the efficiency of the data cleaning procedure in the cloud computing environment. The experimental findings revealed that the data cleaning technique was fast and capable of handling large datasets.
The authors of [
52] analyzed and visualized unstructured data on air pollution, demonstrating the prevalence of numerous dangerous gases in the atmosphere. The authors emphasized the need for data cleaning in dealing with the problems caused by dirty data, such as null values, incomplete data, missing values, and inconsistent sampling date formats. The study gives an overview of ways to clean undesirable, filthy, and unclear data, providing insights into several data cleaning procedures. By applying data cleaning techniques and algorithms, the paper obtains well-structured data that can be used for further analysis and visualization. The work presented in [
53] proposed an approach for the automated modification of power failure records using natural language processing technology. This approach reduced the workload of data cleaning and significantly enhanced the efficiency of processing unstructured data. The experimental results showed that this method reduced more than 70% of the workload and was helpful in improving the quality of the data.
While previous studies have played a crucial role in the realm of unformatted data storage and have addressed certain challenges associated with big data, ELT falls short in some aspects, particularly concerning unstructured data and a reduction in execution time. Limitations become evident when the requirement arises for processing unstructured data, especially text, within a constrained timeframe, and the existing model proves inadequate. Consequently, there is a need to enhance execution time by incorporating a cleaning phase after extraction and converting unstructured data to a structured format during the loading phase. The processing models are summarized in
Table 1 and
Table 2.
4. ECLT Model
In this part, we describe the ECLT model for processing text data, mining needed data, and converting them to a structured format for parallel big data processing using Spark. The primary purpose of ECLT is to reduce the execution time and transform big data from text to tabular data. The ECLT technique is a Python-based model that is implemented atop Spark. Unlike the ELT and ETL models, ECLT can handle millions of text lines without wasting time or memory.
The ECLT model is shown in
Figure 1 and categorized into four phases: (1) extraction phase, (2) cleaning phase, (3) loading phase, and (4) transformation phase. The upcoming subsections thoroughly explore each of these four phases. These four phases will be explained in depth in the following subsections.
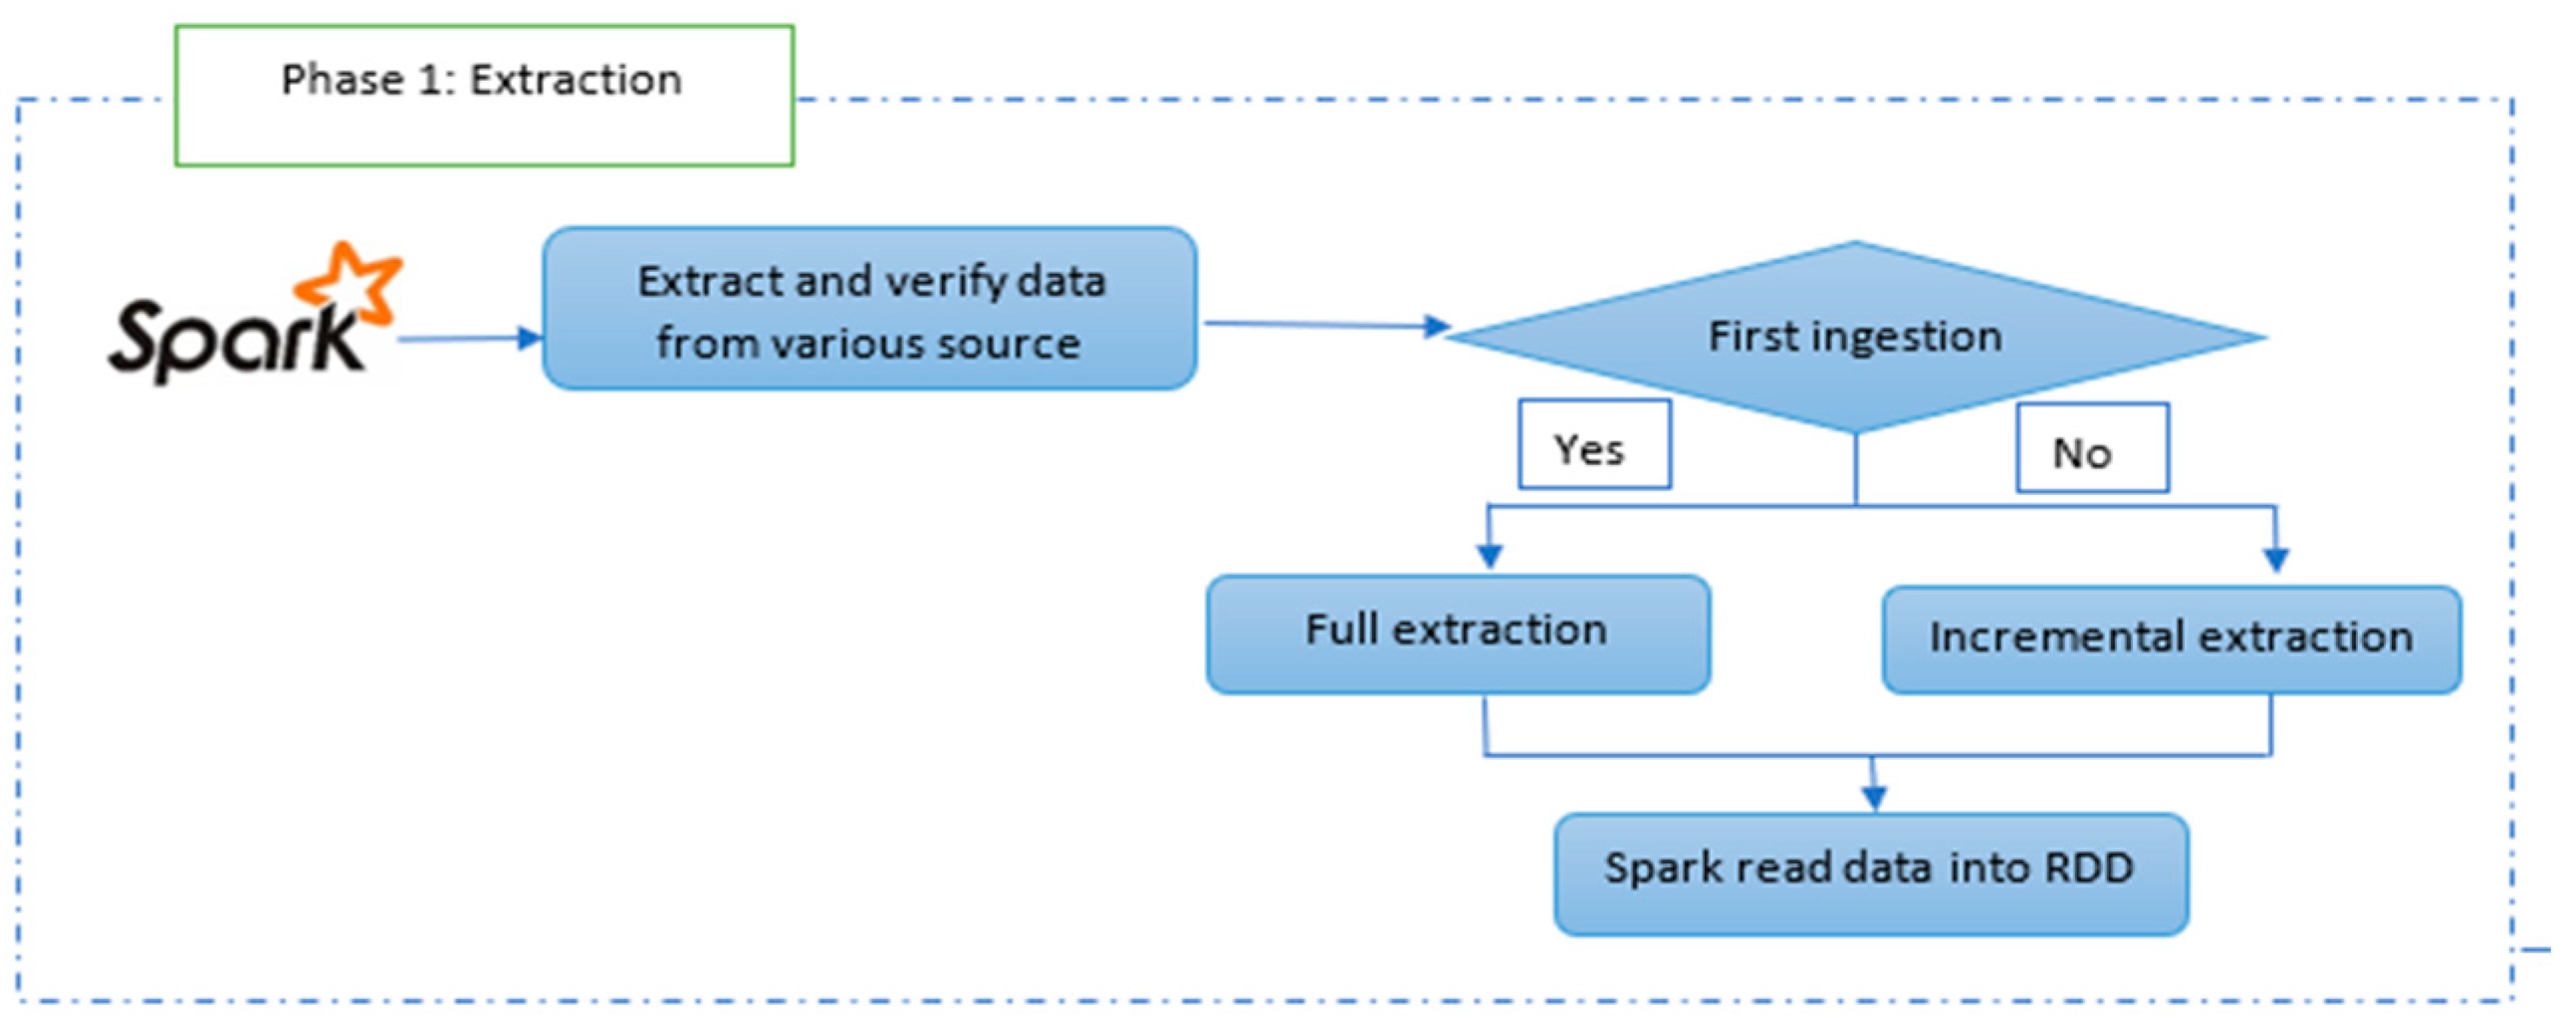
4.1. Extraction Phase
The primary goal of this phase is to retrieve textual data using read text and collect functions during full extraction, and subtract and union operations during incremental extraction. This phase serves as the initial step in ECLT. If it is the first ingestion, the extraction will be full, whereas if the data have previously been extracted and stored in the Spark RDD, it will be incremental. The datasets provided as inputs for this phase are in text format.
Figure 2 illustrates the progression of this phase within ECLT, which involves data extraction by determining whether it is the initial ingestion or a full extraction. In cases where it is not the first-time ingestion, the incremental extraction approach is employed, and both approaches entail reading the text data into the Spark RDD. Upon completion of this phase, unstructured text data are loaded into the RDD.
Algorithm 1 presents the pseudo-code that introduces the isFirstIngestion flag to track whether it is the first ingestion or not. Initially, the flag is set to true. If it is indeed the first ingestion (isFirstIngestion is true), the algorithm reads the text file using spark.read.text(F) and assigns the resulting RDD1 to Txt_RDD, which is then cached in memory. Caching the RDD using the “cache()” function allows for improved performance by avoiding redundant computations, as it will be reused multiple times. The processedData is used to keep track of the data that have already been processed.
Subsequently, we update the isFirstIngestion flag to false, indicating that subsequent iterations will not be the first ingestion. During each ingestion, the text file is read into RDD1. The “subtract()” function is then employed to extract new or updated records by subtracting the processedData set from RDD1. If there are indeed new or updated records (newRecords.count() > 0), we check if Txt_RDD already exists. If it does, we merge the newRecords with the existing Txt_RDD. However, if Txt_RDD is null, we set it as the initial RDD. After updating Txt_RDD, we cache it in memory using “Txt_RDD.cache()”. Finally, we update the processedData by performing a union operation with newRecords. This allows the combination of RDDs from multiple ingested files into a single RDD without overwriting or duplicating the data. In the case of incremental extraction, only the updated data will be processed and added to Txt_RDD, while the previously processed data will be skipped.
| Algorithm 1. Extraction |
| Input: F // text file |
| Output: Txt_RDD // unstructured text data |
|
1. var isFirstIngestion = true // Flag to track if it is the first ingestion |
|
2. var processedData = Set () // Set to track the already processed data |
|
3. For each data in F do |
|
4. RDD1←Spark.read.text (F) |
|
5. If isFirstIngestion then |
|
6. Txt_RDD←RDD1 |
|
7. Txt_RDD. Cache () // Cache the RDD in memory |
|
8. processedData←RDD1.collect(). toSet () // Collect and store all records as processed data |
|
9. isFirstIngestion = false // Update the flag to false for subsequent iterations |
|
10. Else |
|
11. newRecords←RDD1.subtract(processedData) // Incremental extraction for subsequent ingestions |
|
12. If newRecords. Count () > 0 then |
|
13. Txt_RDD. Union (newRecords) // Union the RDDs if it is not the first ingestion |
|
14. Txt_RDD. Cache () // Cache the RDD in memory |
|
15. processedData←processedData. Union (newRecords. Collect (). toSet ()) // Update the processed dataset |
|
16. End If |
|
17. End If |
|
18. End For |
|
19. Return Txt_RDD |
4.2. Clean Phase
The objective of this phase is to perform cleansing on the extracted text data stored in SparkRDD. Often, the text data contain irrelevant characters, symbols, or extraneous information. By cleansing the text dataset, we can eliminate unnecessary data and ensure that it consists solely of relevant information. It is common for text data extracted from various sources to contain spelling or grammar errors. Cleansing the text dataset involves addressing these issues to ensure consistency and enhance the overall quality of the dataset. Furthermore, the dataset may contain incomplete data, requiring the task of imputing missing values. In numerical data, missing values are typically filled using calculations such as the mean or median. However, in our case, since the data are textual, we employ the most frequent value approach to fill in the missing data. Duplicate items within a text dataset can introduce distortions in subsequent steps of the ECLT model. To ensure data quality and prevent such distortions, the cleansing process includes identifying and removing duplicate items. Cleaning the text dataset is crucial in preparing the data to create a cleaner, more consistent, and standardized dataset. This, in turn, improves the accuracy and effectiveness of the ECLT model.
Figure 3 depicts the progression of phase two within the ECLT framework. This phase holds significant importance in our model for several compelling reasons. Firstly, by eliminating irrelevant data, the feature space undergoes reduction, resulting in a more focused and streamlined set of features for the subsequent loading phase. Secondly, this reduction in feature space leads to notable improvements in model execution time, particularly when dealing with larger datasets. Thirdly, the elimination of redundancy enhances data accuracy and consistency, thereby enhancing ECLT performance and facilitating faster query execution during the transformation stage, which represents the final step. Lastly, the process of filling in missing values enhances the overall quality and reliability of the text data, rendering ECLT a robust model better suited for data processing. While the cleaning of text data itself may require some processing time, the time saved during subsequent phases, such as loading and transformation, can be substantial. By the conclusion of this phase, all text data are thoroughly cleansed and loaded into a new RDD, ready for further processing.
Algorithm 2 provides the pseudo-code that initiates an iteration through each line in the Txt_RDD dataset using a for loop. To address duplicated data, the algorithm employs the dropDuplicates() function, ensuring that each line remains unique. Furthermore, it checks for irrelevant data, such as digits, within the text dataset using the find() function, and subsequently removes unrelated data using the filter() function. The algorithm also examines missing values by utilizing the isna() function. In cases where incomplete data are encountered, the line is split into separate elements using the split() function. The algorithm then creates a counter object to tally the frequency of each element in Txt_split and identifies the most common element using the Counter.Most_common(Txt_count) function.
| Algorithm 2. Cleaning |
| Input: Txt_RDD // raw data |
| Output: Cleaned_RDD // cleaned data |
|
1. For each line item in Txt_RDD |
|
2. If line is duplicated then |
|
3. drop Duplicated () |
|
4. Else If Txt_RDD. Find (irrelevant data) then |
|
5. Txt_RDD. Filter (line) // to remove irrelevant data |
|
6. Else If Txt_RDD. Isna () then // detect missing value |
|
7. { |
|
8. Txt_split←RDD. Split (lines) // split the line into small parts as words |
|
9. Txt_count←Counter (Txt_split) // count the number of words |
|
10. Counter. Most_common (Txt_count) // detect the most frequent words |
|
11. Txt_RDD. Fillna (Most_common (Txt_count)) // complete the missing value with the most frequent word in RDD |
|
12. } |
|
13. Else |
|
14. Break; |
|
15. End If |
|
16. Cleaned_RDD←Txt_RDD |
|
17. End for |
|
18. Return Cleaned_RDD |
Finally, the missing values in Txt_RDD are filled with the most common element found using the fillna() function.
Figure 4 illustrates the architecture for handling dirty data within the text dataset. When working with text data, common issues such as duplicate entries arise. To address this, the recommended approach is to remove duplicates using the RDD.DropDuplicates() function and store the unique lines in the cleaned RDD. Similarly, when identifying irrelevant data within the text dataset, the RDD.find() function is utilized, followed by the removal of unwanted data using the RDD.filter() function, resulting in the cleaned RDD. Text data may also contain incomplete information, requiring a strategy for filling in the missing values. While various techniques exist for this purpose, such as calculating means, medians, or most frequent values, in our model, focused solely on text, the most appropriate solution is the most frequent technique. Firstly, the RDD.isna() function is employed to identify missing data. Secondly, the text lines are divided into words using the RD. Split() function. Thirdly, the RDD.counter() function calculates the frequency of each word obtained from the split function. Finally, the RDD. Counter.Most_Common() function is used to determine the most frequently occurring word in the text. Subsequently, the RDD.fillna() function is applied to fill the missing data with the most frequent word, and the result is stored in the cleaned RDD.
4.3. Loading Phase
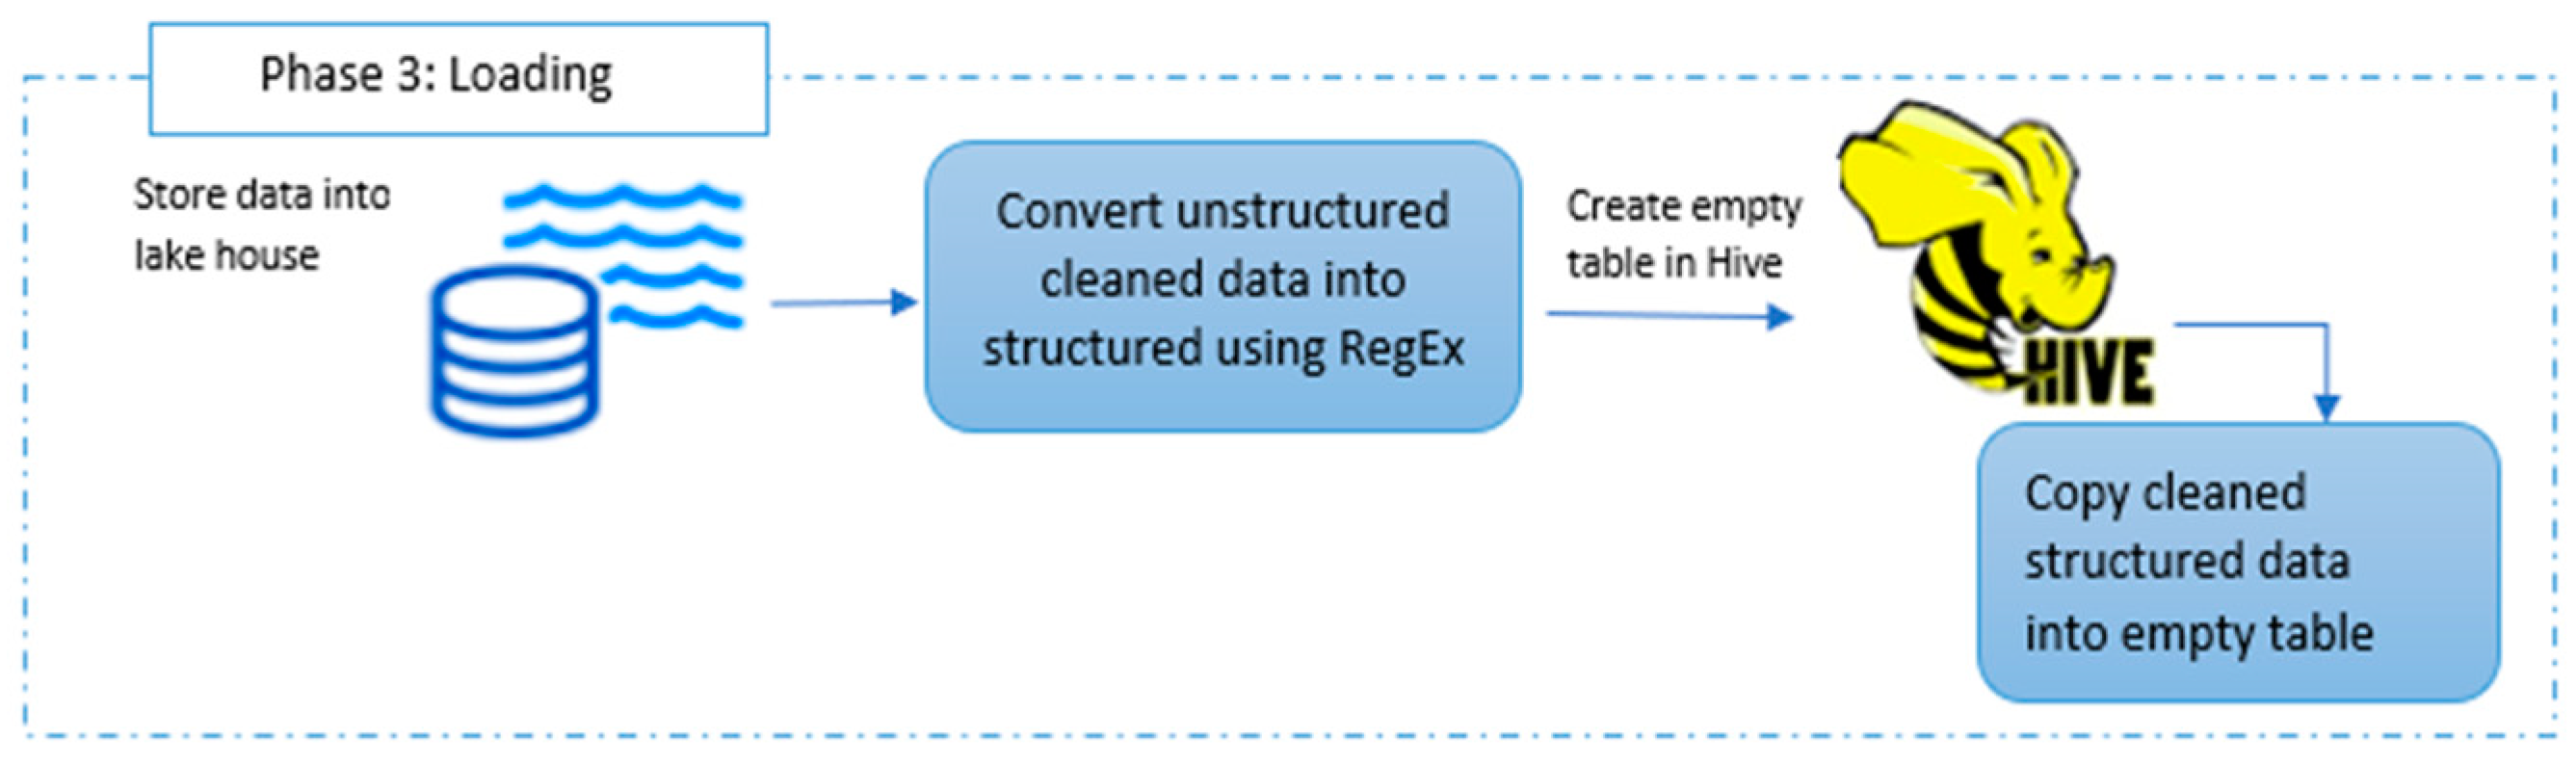
The primary objective of this phase is to load the cleaned data into a lakehouse and convert the text data into a structured columnar file. Since Hive does not have its own Hadoop Distributed File System (HDFS), the cleaned data RDD needs to be transformed into a data frame. Additionally, the detection of regex patterns extracts the relevant data from the text and creates an empty table in Hive with a number of columns based on the regex pattern. Finally, the results of the regex pattern are stored in the created Hive table, and the structured data are saved in the Parquet format. By the end of this phase, the data are successfully loaded into a table within the lakehouse.
Figure 5 showcases the progress of the third phase in ECLT, which involves storing the data frame of cleaned data in the lakehouse and applying regular expression patterns. After the creation of the Hive table, the data are copied into this table. Consequently, at the conclusion of this phase, the structured and cleaned data within the table are ready for transformation.
Algorithm 3 provides the pseudo-code for the process, starting with the definition of a variable regular expression pattern to be applied to the dataset. The pattern is designed to extract specific elements, such as dates (\d{2}-\d{2}-\d{4}) and alphabetic characters [A-Za-z]. It is a flexible pattern that can vary depending on the dataset. In the lakehouse, the algorithm checks if the table “S” exists within the lakehouse (LH) only once. If the table does not exist, it creates “S” with the specified columns based on the number of parts in the regex pattern (two columns). The RDD is converted to a data frame using Cleaned_RDD.toDF() to enable storing the cleaned data in the lakehouse. An empty data frame, Df_matches, with the same schema as “S” is created. The regex pattern is then applied to the data frame “Df” using the rlike() function, which filters the data frame based on the pattern. The resulting matches are stored in the data frame “Df_matches”. Subsequently, the data frame “Df_matches” is appended to the existing table “S” in the lakehouse. This is accomplished using the append mode in the write operation, with data being inserted into the table using the insertInto() function. Finally, the text data are stored in the data lakehouse in the Parquet file format, which enhances data read/write speed and reduces storage requirements.
| Algorithm 3. Loading |
| Input: Cleaned_RDD // cleaned data, LH // lakehouse |
| Output: S // structured table |
| 1. Regex pattern = ” \d{2}-\d{2}-\d{4} [A-Za-z]” |
| 2. If table does not exist then |
| 3. Create S (date, category) // initially create two columns, and according to the dataset, more columns can be created. |
| 4. End if |
| 5. Df ← Cleaned_RDD.toDF () //convert cleaned data rdd into DataFrame |
| 6. Df_matches← Df.filter(col(“text”).rlike(Regex pattern)) // Apply the regex pattern to Df and store the matches in Df_matches |
| 7. Df_matches. write.format (“parquet”). mode(‘append’). insertInto(‘S’). save (LH) // Append Df_matches to the table S in LH |
| 8. Return S |
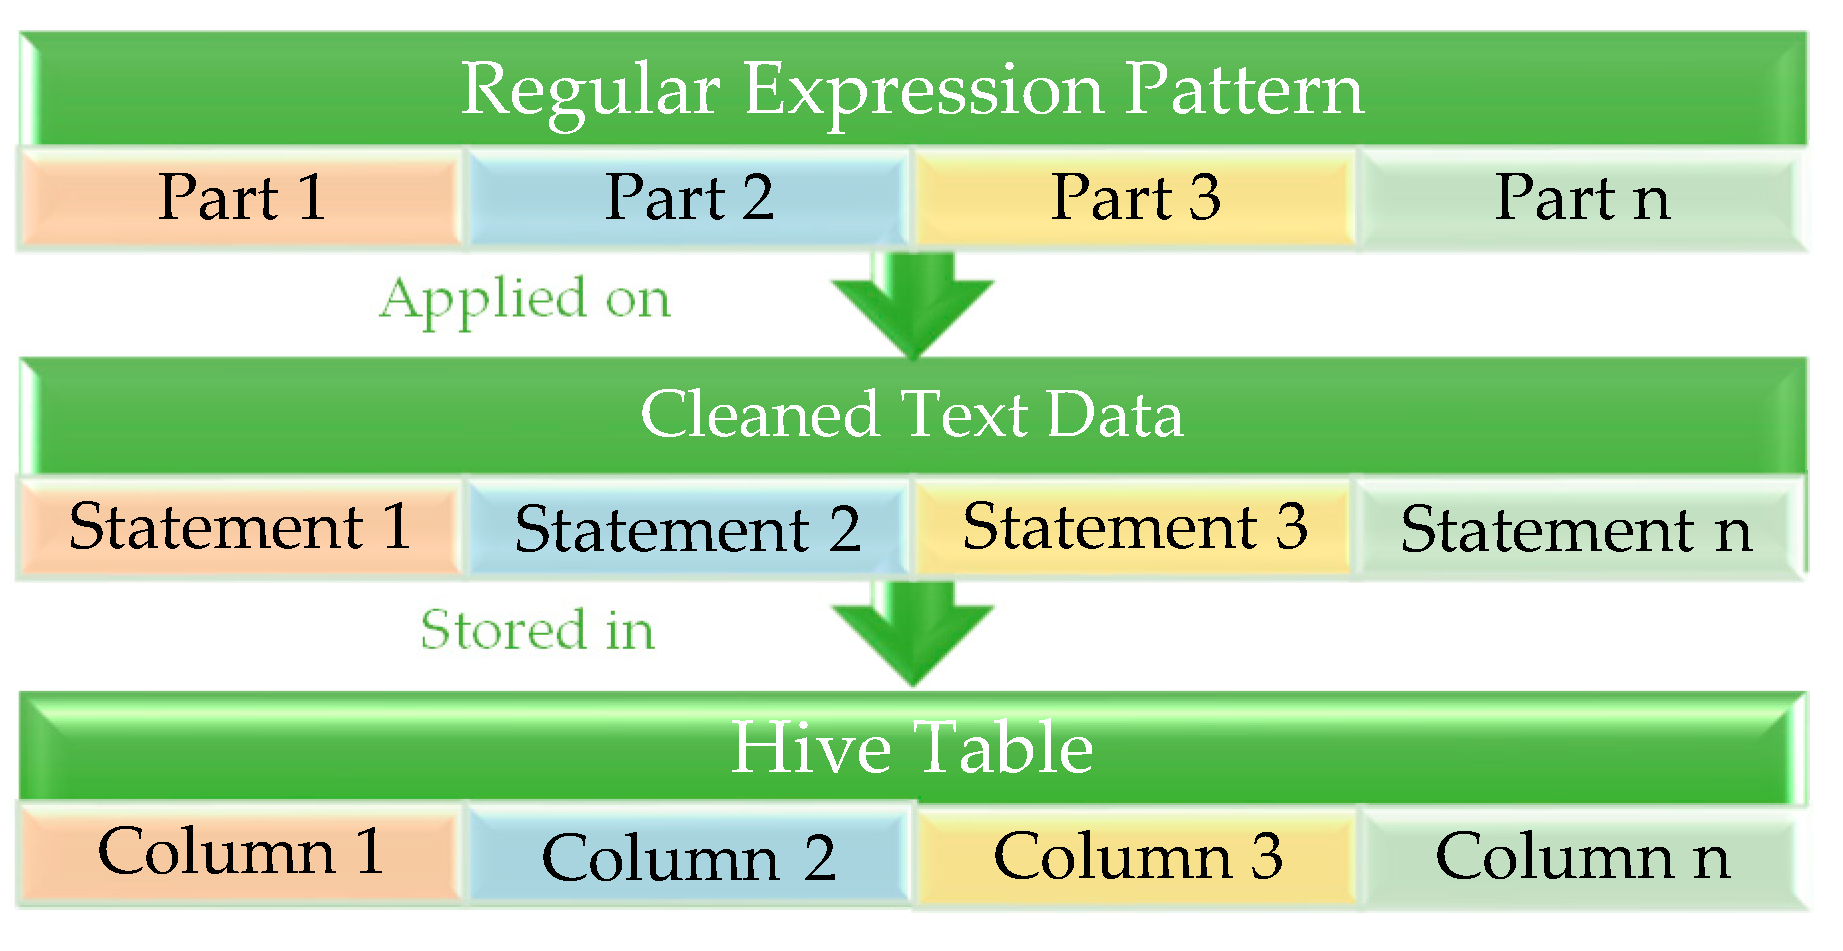
Figure 6 illustrates the process of converting the cleaned text dataset into a structured table during the loading phase. Following the data cleaning phase, the new RDD is prepared for loading into the lakehouse. Initially, the regular expression pattern is defined to partition the text into smaller parts. This pattern is not fixed but varies based on the specific dataset and the desired data extraction. The figure assumes the regex pattern has multiple parts, labeled as part 1, part 2, part 3, and so on up to part “n”. The pattern is then applied to the cleaned text, resulting in separate statements for each part. This process is repeated for each part until all statements are extracted. Finally, a Hive table is created, with the number of columns determined by the number of parts in the pattern. The extracted statements are stored in this table, facilitating structured storage of the text data.
4.4. Transformation Phase
The primary objective of this phase is to transform the data in a way that facilitates business intelligence usage or analytics. It is not necessary to transform all the extracted data; only the data relevant to the analysis step need to be transformed. The specific data to be transformed are determined based on the requirements of the business intelligence (BI) analysis. Transformations can take the form of functions or actions. Transformations are lazily evaluated, meaning they are not executed immediately when called, but rather create a plan for executing the operation when an action is triggered. Actions, such as count(), collect(), aggregate(), and reduce(), help reduce the time required for the transformation process.
Figure 7 depicts the progress of the fourth phase in ECLT. Once the transformation is applied, the result becomes immutable. However, when an action is applied to the transformed data table, the time consumption decreases, leading to a more efficient system. The result is then ready for further analytics.
From the previous phase, we have a structured table “S” with two columns, such as “date” and “category”. Algorithm 4 provides the pseudo-code for this phase. It begins by creating an empty table to store the transformed data. Next, an iteration loop is created to process each row in the input table “S”. Within this loop, an empty row called “Transformed_row” is created to store the transformed values for each column. The “ConvertToDate()” function is utilized to convert the input date string to a desired date format, specified as “dd-mm-yyyy”. The transformed date is stored in the variable “transformed_date”, which is then assigned to “Transformed_row[‘date’]”. The input category string is converted to lowercase using the “lower()” function to ensure consistent case formatting for the transformed category. The “StripWhitespace()” function is applied to remove leading and trailing whitespace from the transformed category, helping standardize the category values. The results of these functions are stored in the variable “transformed_category”, which is then assigned to “Transformed_row[‘category’]”. At the end of each iteration, the transformed row is inserted into the transformed table. Various operations such as count() on the category column to calculate the frequency of category occurrences or filter() on the date to display specific dates can be applied. By the end of this phase, the data are transformed, enriched, and structured for analysis and visualization. Business intelligence users and decision-makers can easily make informed decisions based on these prepared data.
| Algorithm 4. Transformation |
| Input: S// Structured table |
| Output: TS // Transformed structured table |
|
1. TS ← Empty_table // create an empty table for storing the transformed data. |
|
2. For each row in S |
|
3. Transformed_row ← Empty_row // Create an empty row for storing the transformed values. |
|
4. transformed_date ← ConvertToDate(date, “dd-mm-yyyy”) // Apply transformations to the “date” column. |
|
5. Transformed_row[“date”] ← transformed_date // Store this variable to the empty row called date. |
|
6. transformed_category ← category.lower() // Convert the category to lowercase |
|
7. transformed_category← StripWhitespace(transformed_category) // Remove leading and trailing whitespace |
|
8. Transformed_row[“category”] ← transformed_category // Store this variable to empty row called category. |
|
9. TS ← AppendRow(TS, Transformed_row) //Add the transformed row to the transformed table. |
|
10. End for |
|
11. Num_catg ← Category.count() // Count the number of categories repeated. |
|
12. Specific_date ← filter(lambda x: x ==“dd-mm-yyyy”, date) // Display text with specific date |
| 13. Return TS |
5. Performance Evaluation
In this section, we compare the execution time of the ECLT model with the most commonly used models, namely ETL, ELT, ELTL, ELTA, and DELT, in order to evaluate the performance of the ECLT model. The ELTL model utilizes Spark, while the DELT model employs MapReduce to measure the execution time. To ensure a fair and accurate comparison among ETL, ELT, ELTL, ELTA, and DELT, we implemented them in the same environment as the ECLT model. To measure the execution time of the ECLT model, we utilized a single node with an Intel (R) Core (TM) i7-5500U CPU running at 2.40 GHz. The node was equipped with two cores, 16 GB of RAM, 1 TB of SSD, and 1 TB of HDD. The operating system installed on the node was Windows 10, and the software stack included Hadoop 2.7.0, Hive 3.1.3, Spark 3.3.1, and Python 3.9. By conducting the performance evaluation in this standardized environment, we ensured that the comparison of ETL, ELT, ELTL, ELTA, and DELT was based on the same specifications.
5.1. Dataset
In this part, we provide the features of the datasets utilized in the evaluation. The proposed model (ECLT) was tested using the two most popular datasets for text data in big data.
Table 3 shows the properties of the datasets used in execution time evaluation. The first dataset is the Spark log data dataset [
60], which was collected and examined in [
61] to serve academic researchers. The second dataset is the Wikipedia article dataset [
62], which is increasing by over 17,000 articles per month, and the articles were compressed without media.
5.2. Experiment and Result
This section will present the experimental results of the ECLT model in comparison to the ETL, ELT, DELT, ELTL, and ELTA models, focusing on the aspect of execution time. We applied the log data and Wikipedia article datasets to our model and others to measure the execution time.
5.2.1. Spark Log Dataset
Figure 8 shows the conversion of cleaned log data text to a table. The regex pattern used is “([0-9]{2}/[0-9]{2}/[0-9]{2}) ([0-9]{2}: [0-9] {2}: [0-9]{2}) [a-zA-Z] * ([a-zA-Z0-9.] *): (.*)
$”. This pattern has five parts. The first part is [0-9]{2}/[0-9]{2}/[0-9]. Here, {2} is a date that has a number from 0 to 9 and just two digits, even the year. The second part, [0-9]{2}: [0-9] {2}: [0-9] {2}, is time that has hours, minutes, seconds, and also two digits. The third part, [a-zA-Z]*, is the log level, which only has characters from a to z, whether they are uppercase or lowercase and * is used to match zero or more instances of the character that came before it. The fourth part ([a-zA-Z0-9.] *) is the action of the event that could be characters, so a-z, or could be digits, so 0-9, or both. The fifth part (. *) is the content of the remaining text. Each timestamp in these data represents an action and has a set of information about this action separated by spaces. In the log text, the first line has the 15/09/01 18:16:44 INFO executor. The executor runs task 806.0 in stage 0.0 (TID 513). The first part is the date, the second part is the time, the third part is the log level, the fourth part is an action, and the final part is the remaining text.
Figure 9 illustrates the execution time for each phase of the ECLT (extraction, cleaning, loading, and transformation) model when working with a data size of 1 TB. Initially, we executed the required programs on a single node and employed an “if” condition during the extraction of log data. This condition was used to identify the first ingestion of all data, while subsequent ingestions only updated the data. The extraction phase took 5.31 s to complete. The cleaning phase, which followed extraction, consisted of two steps. The first step involved detecting outliers or errors, while the second step focused on fixing the errors or removing outliers. After the detection functions such as filtering and the fixing functions like dropping were performed, this step took 17.69 s. In the loading phase, the cleaned data were stored in a data lake and transformed from unstructured to structured data. During the creation of an empty table in Hive, we specified a regular expression pattern to parse the text and store the data in the table, ensuring their structure and quality. This step took 8.6 s. The final phase, transformation, involved taking the structured data, conducting simple aggregations, and converting column types to suitable formats. This phase required 10.2 s.
Figure 10a presents a comparison of execution times for the ETL, ELT, ECLT, ELTL, ELTA, and DELT models using the same 1 TB data size. We applied each model separately to ensure accurate results. The recorded execution times were as follows: The ETL model had the longest execution time of 521.34 s, indicating it is not suitable for handling big data due to its time-consuming nature. The ELT model recorded a time of 315.8 s as it stored the data after extraction before the transformation process began. The ELTA model took 283.16 s, demonstrating that despite the addition of an analysis stage after the conversion stage, the conversion process only prepared the data for analysis at a specific moment. The ELTL model recorded a time of 254.74 s because it stored the transformed data again in the data warehouse. The DELT model achieved a time of 129.66 s due to its delayed stage, making it a favorable choice. Finally, the ECLT model outperformed the others by recording a time of 41.8 s.
Figure 10b focuses on a comparison of memory usage between the ECLT model and the other models. The ETL model consumed 75% of the highest recorded memory, while the ELT, ELTL, ELTA, and DELT models consumed 68%, 32%, 45%, and 18% respectively. Remarkably, the ECLT model outperformed all other models by consuming only 9% of memory, resulting in significant memory savings.
5.2.2. Wikipedia Dataset
Figure 11 shows the conversion of the Wikipedia article dataset text to a table. The regex pattern used is “\|\s*Last\s*edited\s*=\s*(.*?)\s*}} ^=+\s*(.*?)\s*=+.*? \
[\
[Category:(.*?)\
]\
] (.+?)”. This pattern has four parts. The first part is “\|\s*Last\s*edited\s*=\s*(.*?)\s*}}”. The date of the last revision can be found at the bottom of every page. The second part, “^=+\s*(.*?)\s*=+.*? \”, is the title, which is the name of the subject of the article. Sometimes the article topic has no name; it may be a description of the topic. There are no two articles with the same title. The third part, “[\
[Category:(.*?)\]\
]”, is the category to which the topic has been assigned in the article that is found at the bottom of the article and * is used to match more instances of the character that came before it, which means that the category might have subcategories. The fourth part (.+?) is the remaining content of the article.
Figure 12 illustrates the execution time of the ECLT (extraction, cleaning, loading, and transformation) process when applied to 1 million articles. In the extraction phase, ECLT extracted the articles from the dataset, which took approximately 14.8 s. Subsequently, the data underwent a cleaning process. During this phase, we identified and removed repeated data and external links. We also addressed missing values by completing them. To streamline the scope, we excluded table content and section headers. The cleaning phase was completed in 56.2 s. Moving on to the loading phase, the cleaned data were processed using a regex pattern and stored in a Hive table within a lakehouse. This phase recorded a time of 24.6 s. Finally, the transformation phase, which focuses on preparing the necessary data for BI users or analysts, took 23.93 s to execute.
Figure 13a presents a comparison among the ECLT, ETL, ELTL, DELT, and ELTA models using Wikipedia articles. It is evident that ECLT achieves faster execution times than all other models. ETL recorded a time of 863.2 s, while ELT and ELTL recorded times of 704.65 s and 471.79 s, respectively. Notably, DELT achieved a time of 250.4 s, which is nearly half the time recorded by ELTA, which was 544.31 s. It is important to note that ETL, with its three phases instead of four, recorded the longest execution time.
In
Figure 13b, a comparison of memory usage is made among the ECLT, ETL, ELTL, DELT, and ELTA models. ELTA consumes 66% of memory, which is more than twice the amount consumed by DELT, which is 29%, primarily due to execution time. As expected, ETL consumes a high percentage (89%), while ELT consumes 82%. Remarkably, ECLT only consumes 16% of memory for execution, reaffirming its superior performance over all other models.
6. Discussion
Table 4 presents the average execution times in seconds for the ECLT model and other models across different dataset sizes. Considering the log dataset, the results indicate that the ECLT model achieved the best performance, recording 41.8 s for the 1 TB dataset. In comparison, the DELT model achieved an intermediate performance with a recorded time of 129.66 s, while the ETL model exhibited the worst performance, taking 521.43 s. The ECLT model demonstrated outstanding performance and proved to be well suited for handling log data with millions of lines. This success can be attributed to the thorough data cleaning process, which identifies errors, eliminates duplicates, and filters out irrelevant information effectively. Furthermore, the ECLT model excels at handling large amounts of data by splitting text into smaller segments and storing them in a structured table without causing memory leaks due to increased size. It is a scalable model capable of processing substantial data volumes.
For instance, when the dataset size was increased to 1.5 TB, the ETL model exhibited the highest execution time, recording 918.33 s. This is because all of the extracted data are transformed and then loaded into a data warehouse. The ELTA and ELTL models recorded times of 398.6 and 423.84 s, respectively. Although these times were lower than those of ETL and ELT, they were still higher than that of DELT. On the other hand, DELT recorded a time of 206.3 s, which is lower than that of ECLT. Despite the increase in log data size to 1.5 TB, the ECLT model achieved the shortest execution time, outperforming all the compared models.
Shifting focus to the Wikipedia dataset, when we scaled the dataset to 2 million articles, all models exhibited nearly twice the execution time, including ECLT. However, ECLT still demonstrated the lowest execution time.
Figure 14a,b clearly illustrate that memory consumption increases significantly when the data are scaled, with ECLT surpassing all other models in memory usage and performance.
The ECLT model stands out as the optimal solution for efficiently processing text data within a short timeframe, utilizing the Spark framework. Spark enables parallel processing of data and facilitates the conversion of text into a structured Hive table with clean data. By leveraging tools such as Apache Kafka and Apache Nifi, the integration of ECLT into the data flow of a platform is feasible. This integration involves configuring Kafka consumers to extract raw text data and utilizing Nifi processors to execute the cleaning, loading, and transformation phases. Additionally, ECLT can seamlessly integrate with major cloud providers like Amazon Web Services (AWS) or Microsoft Azure. By defining data pipelines that incorporate the ECLT process, businesses can leverage the pre-built connectors, data transformation capabilities, and scalable infrastructure offered by these cloud services, simplifying the integration of ECLT into existing frameworks. By applying the ECLT approach to text data, businesses and researchers gain valuable insights from unstructured data. They can leverage sentiment analysis to understand customer attitudes and entity extraction to extract pertinent entities for research purposes. Through the ECLT approach, unstructured text data can be transformed into structured formats compatible with existing analytical tools and models. This enables more data-driven decision-making based on a comprehensive understanding of the text data. The utilization of Spark and Hive in automating the ECLT process allows organizations to expedite their data processing activities. This enhancement significantly improves decision-making capabilities by increasing efficiency in processing and analyzing large volumes of text data.
However, there are certain limitations to our approach that should be acknowledged. First, the proposed ECLT approach can be used on textual data only and relies on the definition of application-dependent RegEx; performance evaluation could be dependent on the adoption of the Spark environment, for which alternative approaches might not be optimized. Secondly, our application of ECLT is focused solely on batch data processing and does not encompass real-time data processing. Lastly, the accuracy of the ECLT process heavily depends on the quality of the dataset used. If the initial text data contain errors or inconsistencies, the overall quality of the structured data produced could be adversely impacted.
For future work, we recommend exploring the integration of the ECLT process into real-time data processing frameworks that handle streaming text data. Additionally, it would be beneficial to investigate and develop more advanced text cleaning techniques to address specific challenges such as misspellings or language-specific issues. Comprehensive evaluations and benchmarking studies should be conducted to assess the effectiveness of the ECLT process in various domains and datasets. These efforts will contribute to further refining and enhancing the ECLT approach for text data processing.
7. Conclusions
The Extract–Transform–Load (ETL) process holds significant importance in data management and analytics. It involves extracting data from various sources, transforming them into a suitable format, and ultimately loading them into a data warehouse or data lakehouse. These data storage solutions play a crucial role in handling big data, which are vast and complex information that traditional data processing programs struggle to handle efficiently. A data lakehouse represents a concept that combines the capabilities of a data lake and a data warehouse, enabling the storage of both structured and unstructured data in their original formats. Consequently, ETL operations play a vital role in ensuring that valuable insights can be derived from the extensive data stored in data warehouses or data lakes.
In this paper, we have extensively investigated the effectiveness of the ECLT (Extract–Clean–Load–Transform) process for text data processing. Our focus was primarily on its ability to extract, clean, load, and transform data from various sources. Through our investigation, we discovered the remarkable efficiency and performance of the ECLT process, particularly when dealing with large-scale datasets.
The first phase of the ECLT process, extraction, allowed us to seamlessly access and retrieve text data from diverse sources. Leveraging advanced techniques within the ECLT framework, we successfully handled data from log files, Wikipedia articles, and other textual resources. The flexibility of the ECLT process in accommodating multiple data sources proved to be a significant advantage, enabling us to work with a wide range of text data. The subsequent cleaning phase of the ECLT process was crucial in addressing the inherent challenges associated with textual data, such as noise, misspellings, and inconsistencies. By applying various cleaning techniques, including handling missing values, removing irrelevant characters, and eliminating duplicates, the ECLT process effectively improved the quality and integrity of the extracted text data. This step played a pivotal role in ensuring the reliability and accuracy of subsequent analyses. Furthermore, the loading phase of the ECLT process demonstrated its efficiency in seamlessly integrating the cleaned text data into a data lakehouse architecture. Leveraging its compatibility with data lakehouse technologies like Apache Parquet, the ECLT process facilitated the smooth transition of the cleaned text data into a scalable table and accessible storage system. This capability proved instrumental in managing and querying vast volumes of text data, ensuring their availability for subsequent transformations and analyses. Finally, the transformation phase of the ECLT process showcased its superior performance when compared to alternative models. The ECLT process exhibited exceptional efficiency and effectiveness in transforming the text data, further enhancing their value for downstream analysis and decision-making. Overall, our research highlights the significant advantages of the ECLT process in text data processing, emphasizing its efficacy in extraction, cleaning, loading, and transformation. These findings contribute to the body of knowledge in data processing and provide valuable insights for future research and practical applications.
Through our experiments using log datasets and Wikipedia datasets, we conducted a thorough evaluation of various models to compare their execution times. The results consistently demonstrated that the ECLT (Extract–Clean–Load–Transform) process outperformed all other models. The advanced processing capabilities of the ECLT process, combined with its support for distributed computing, enabled faster and more efficient transformations of text data. The reduction in execution time signifies the practical benefits of the ECLT process, particularly in time-sensitive applications where real-time decision-making is critical.
In conclusion, our research emphasizes the significant advantages and capabilities of the ECLT process in handling text data from multiple sources. The ECLT process exhibited remarkable efficiency in loading data into a data lakehouse, and its superior performance in reducing execution time was evident through rigorous experimentation with log and Wikipedia datasets. The findings of this paper provide compelling evidence for the effectiveness of the ECLT process, establishing it as a valuable tool for practitioners and researchers engaged in text data processing and analysis.


