Visual Analysis of a Smart City’s Energy Consumption


Abstract
:1. Introduction
1.1. Electricity and Gas Consumption: Background
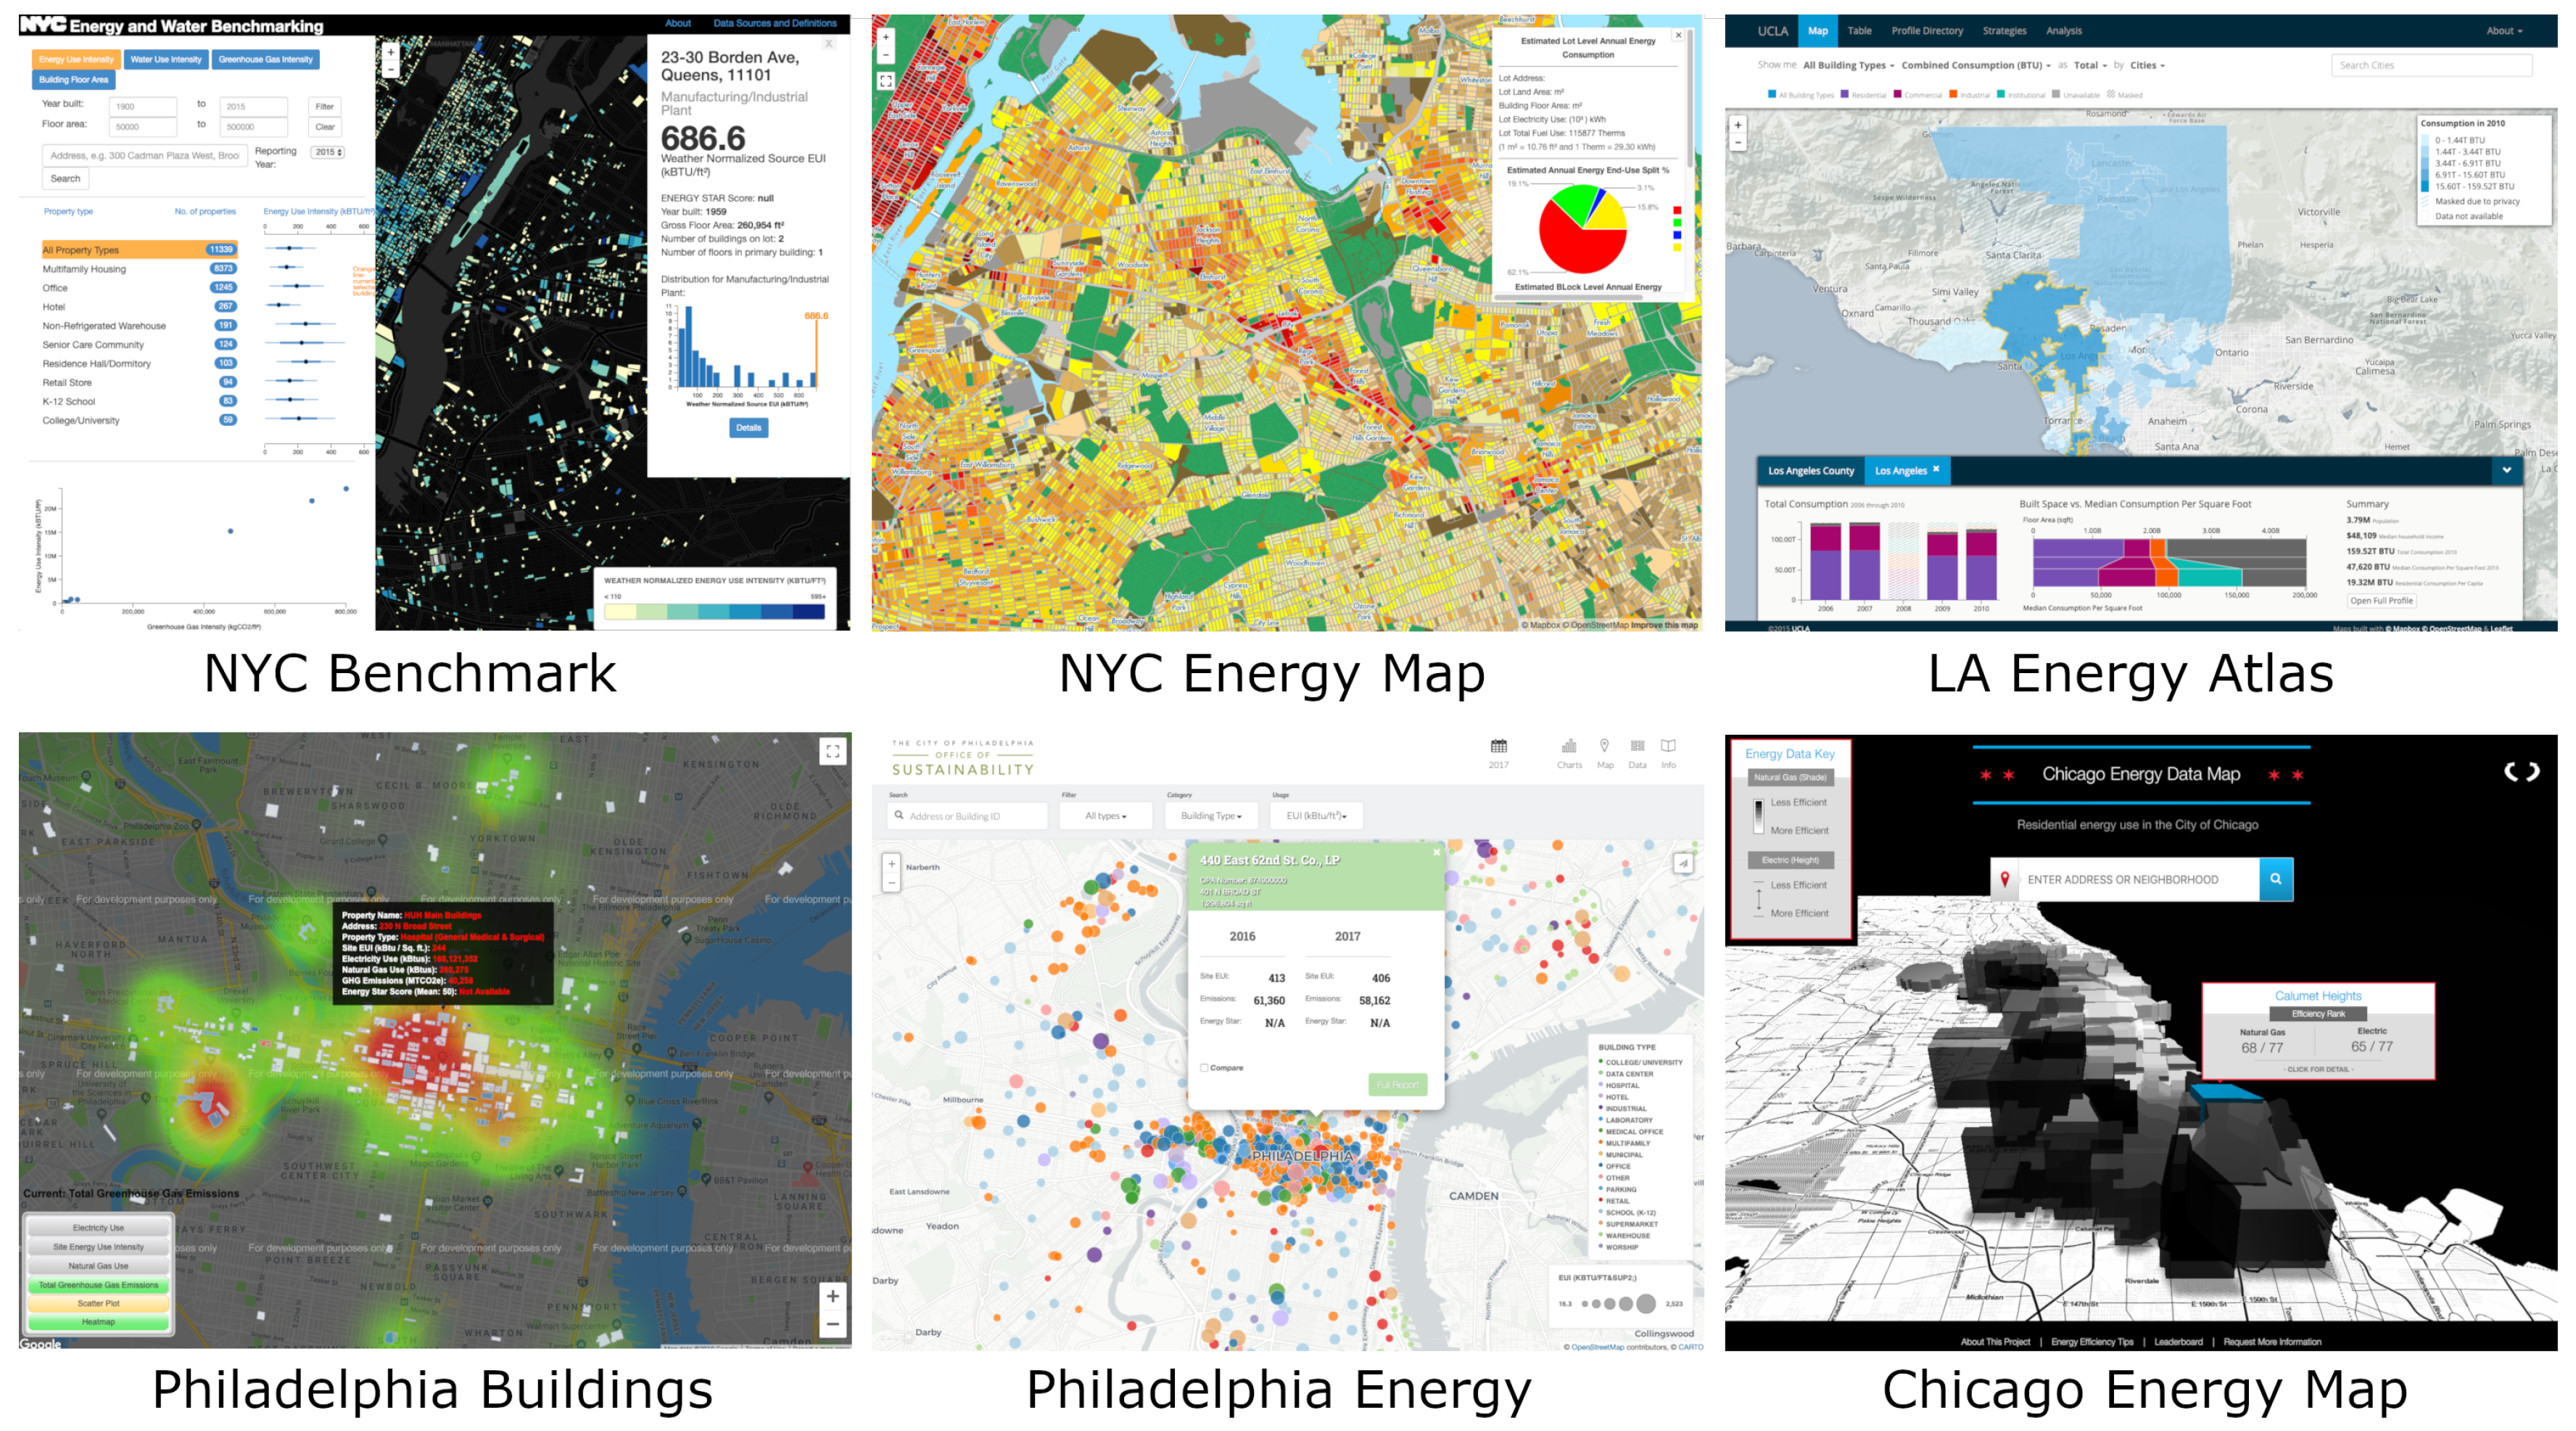
1.2. Energy Visualization Systems
2. Materials and Methods
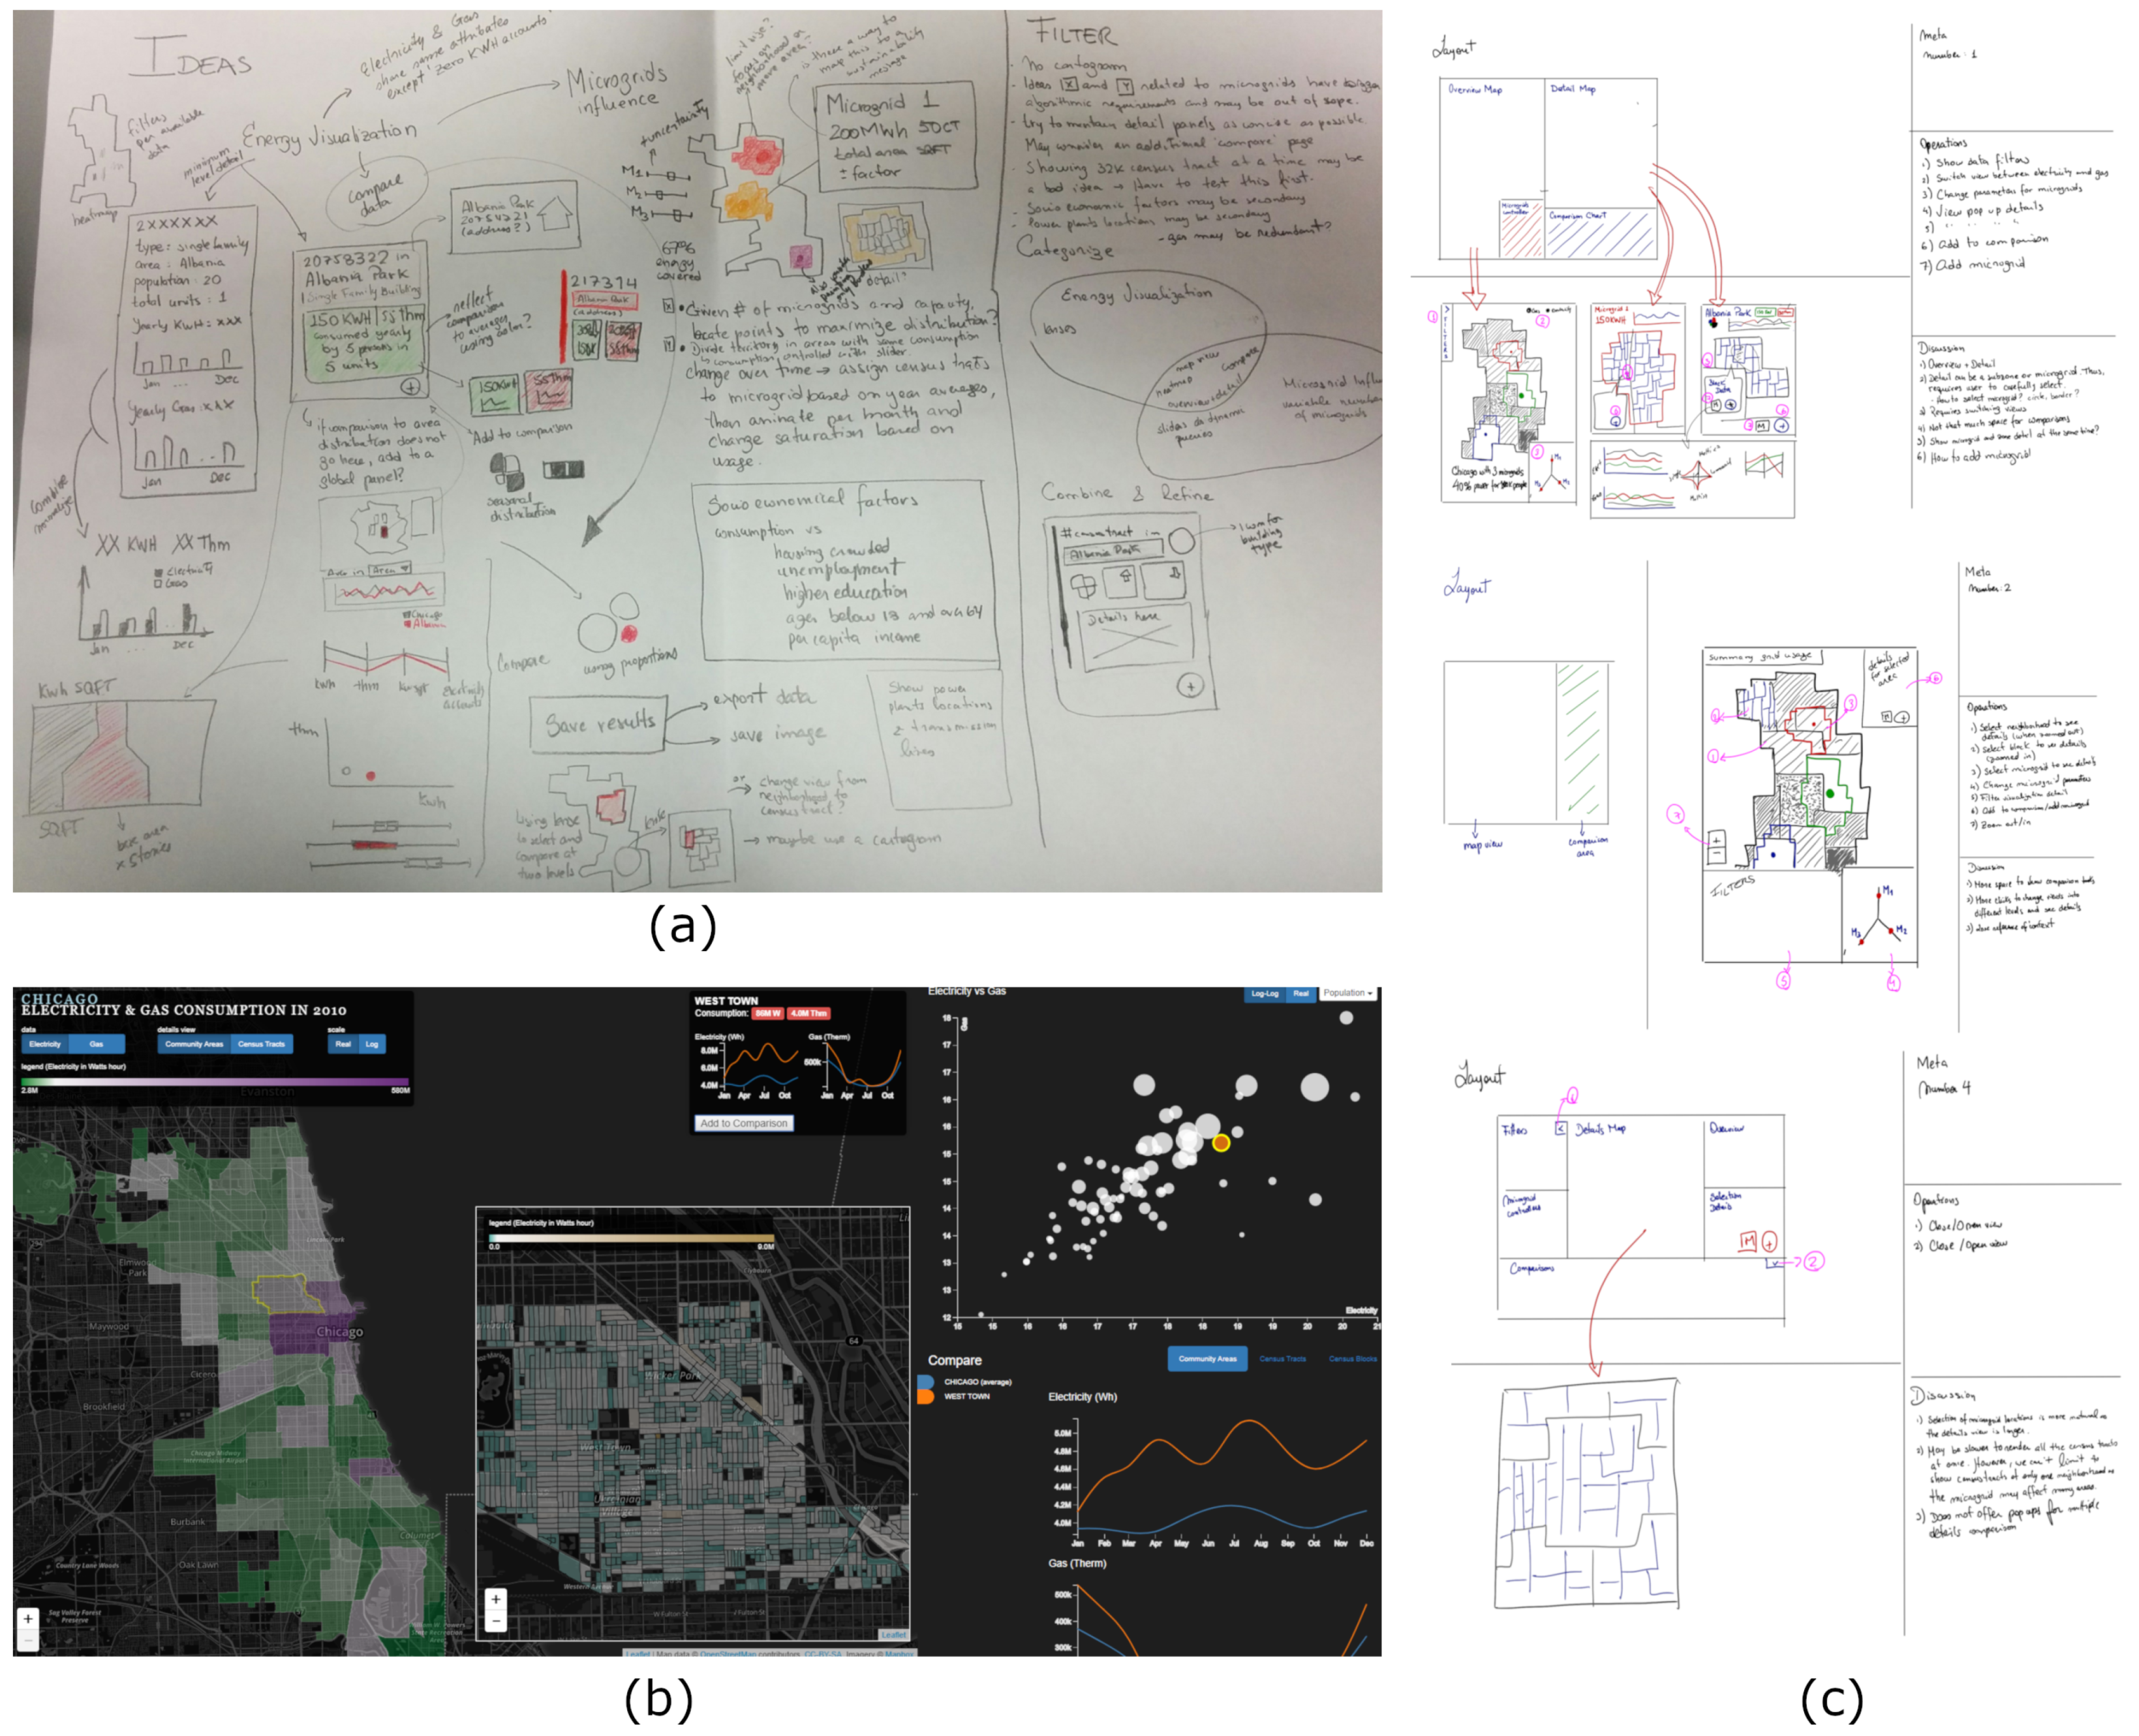
2.1. Requirements and Workflows
2.2. Data Aggregation
2.3. Visual Encodings and Interaction Design
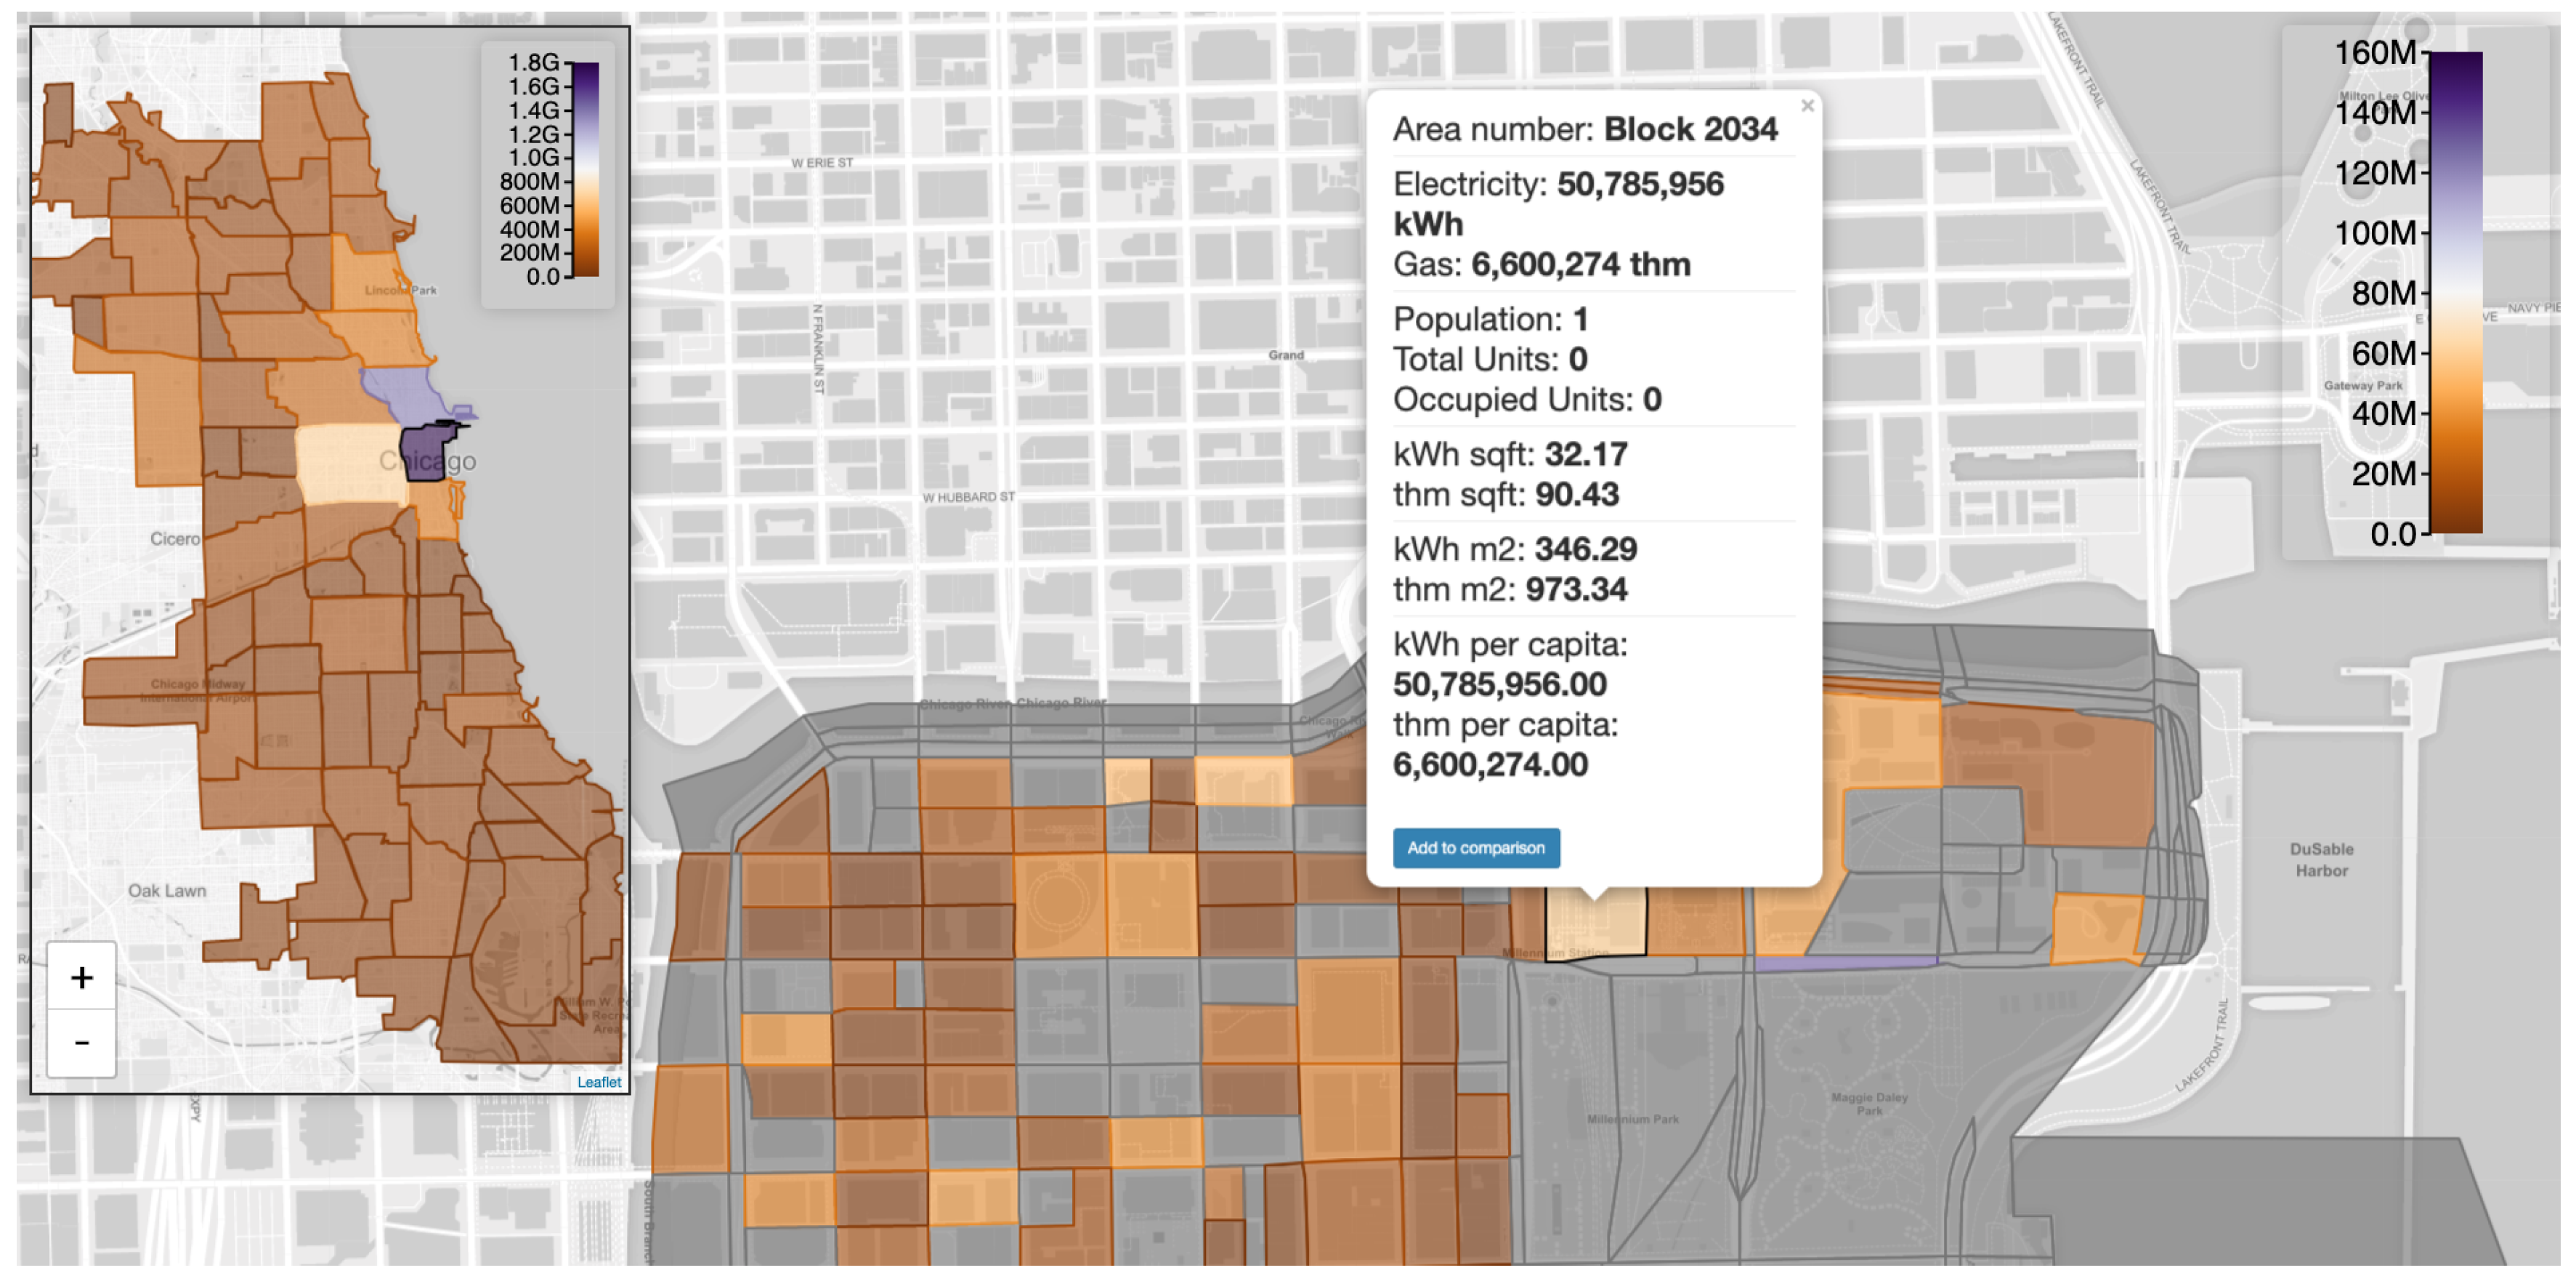
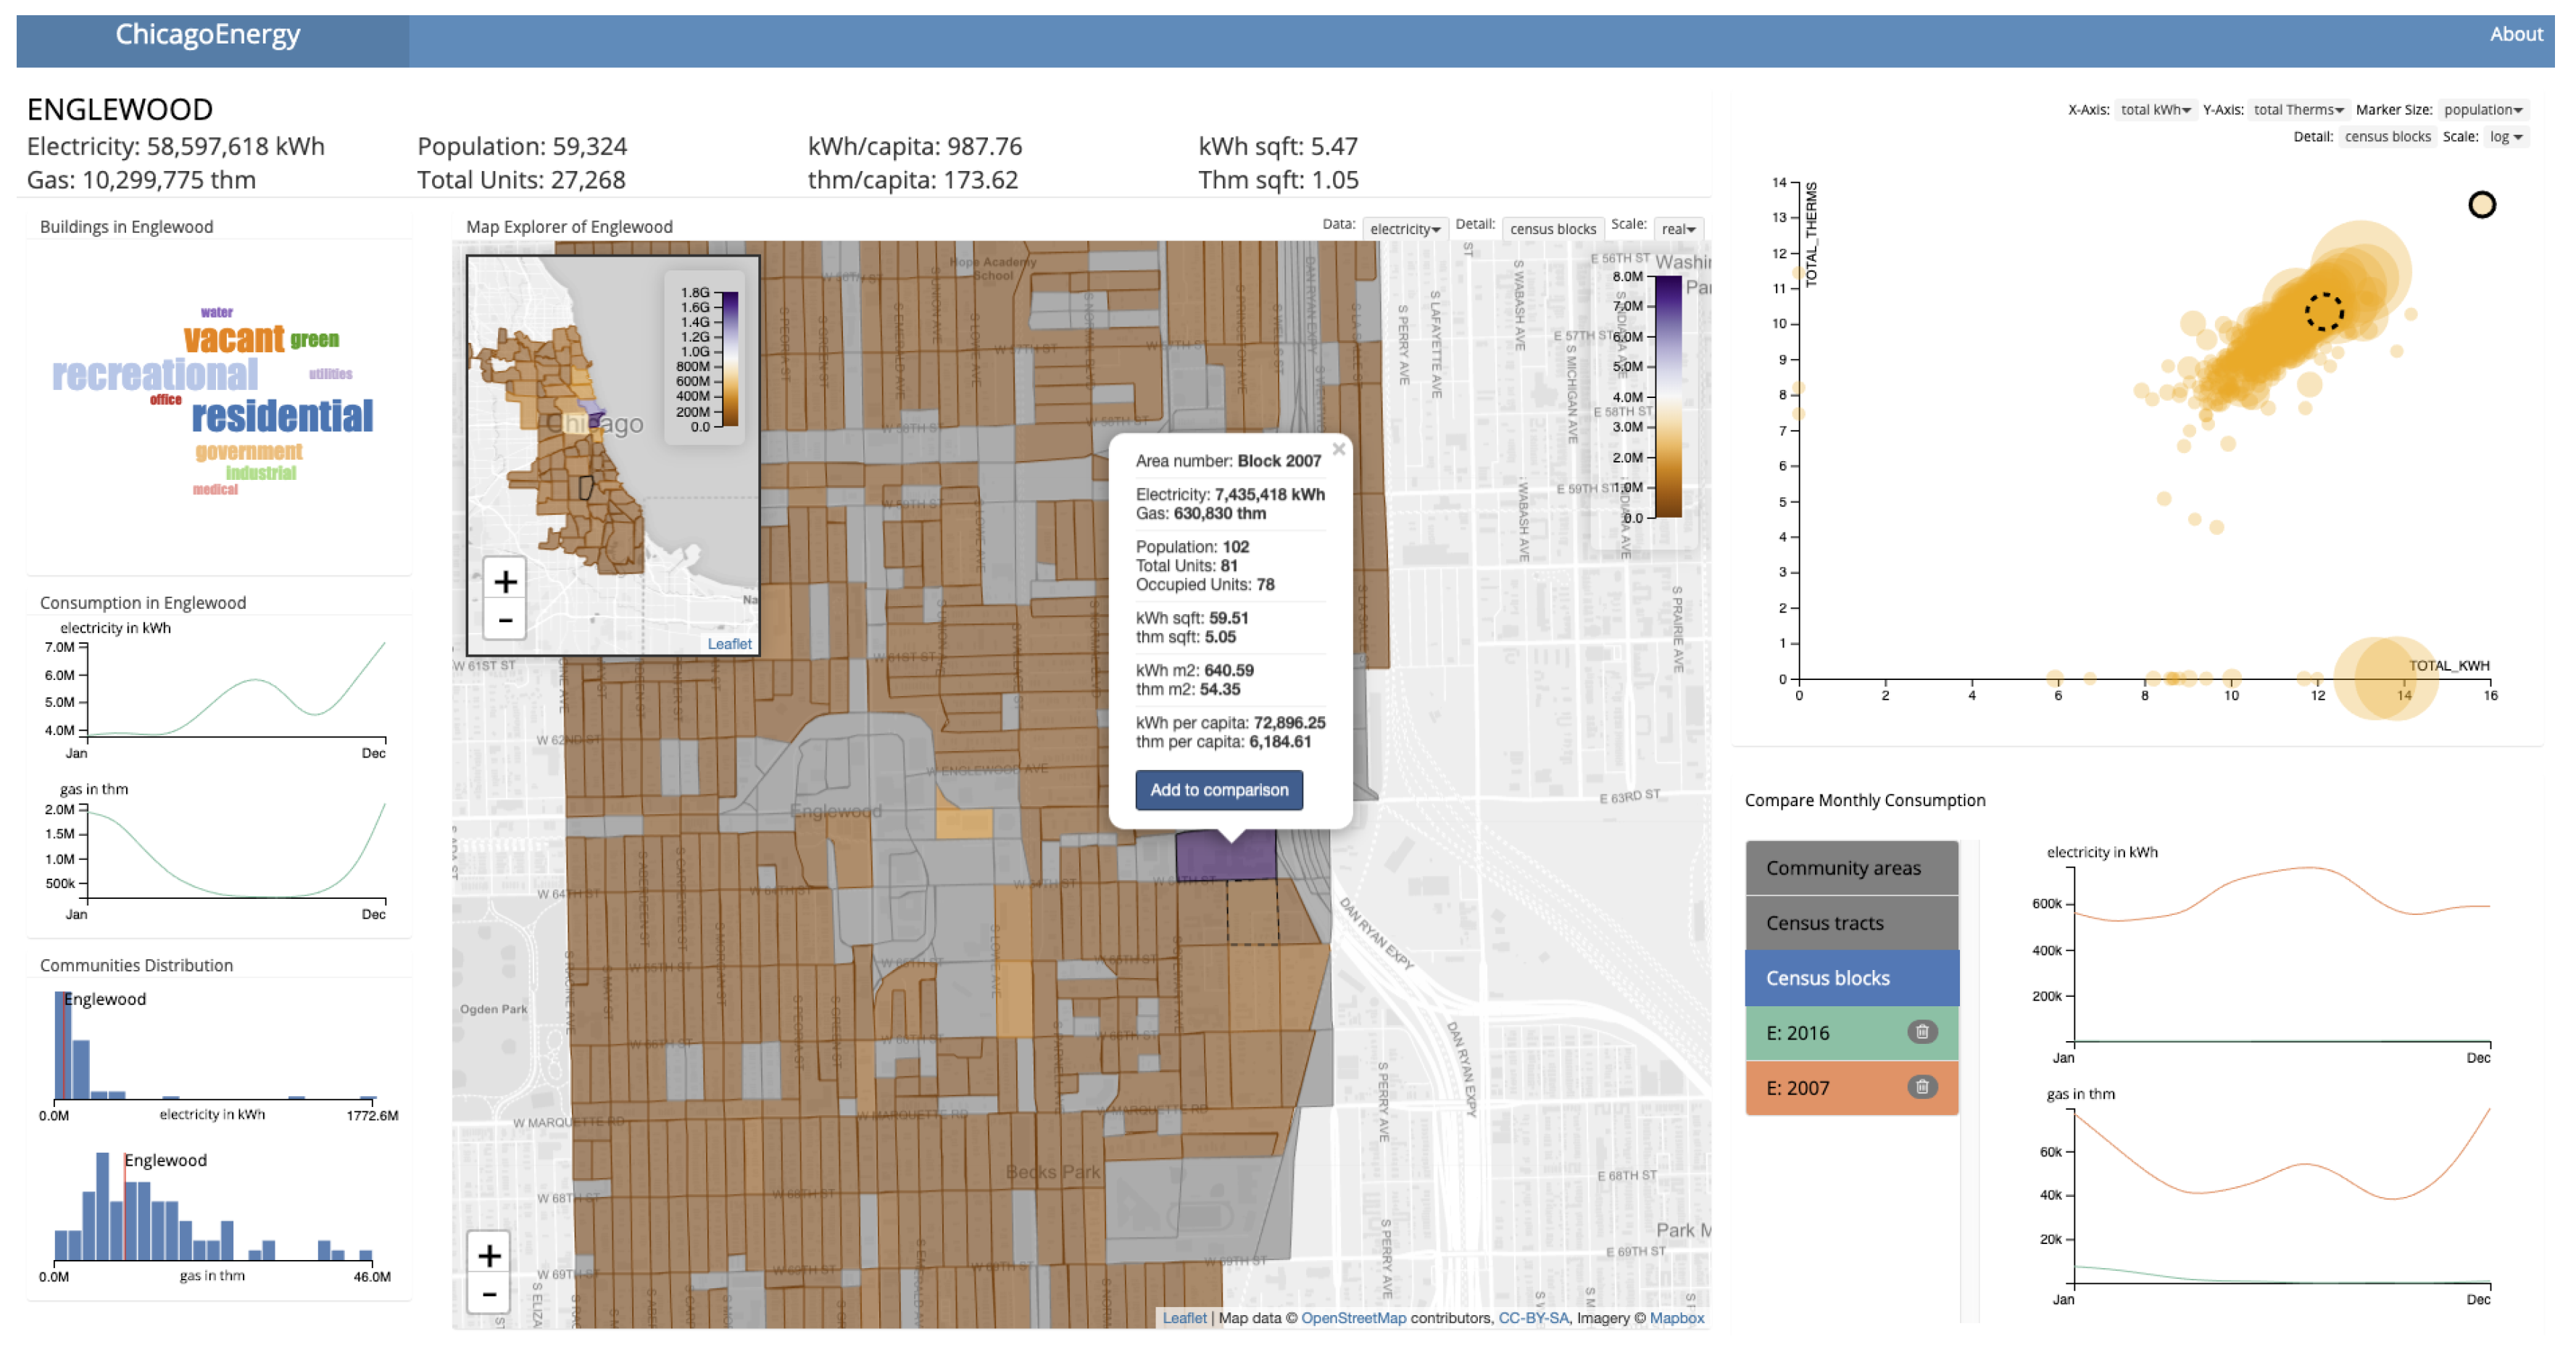
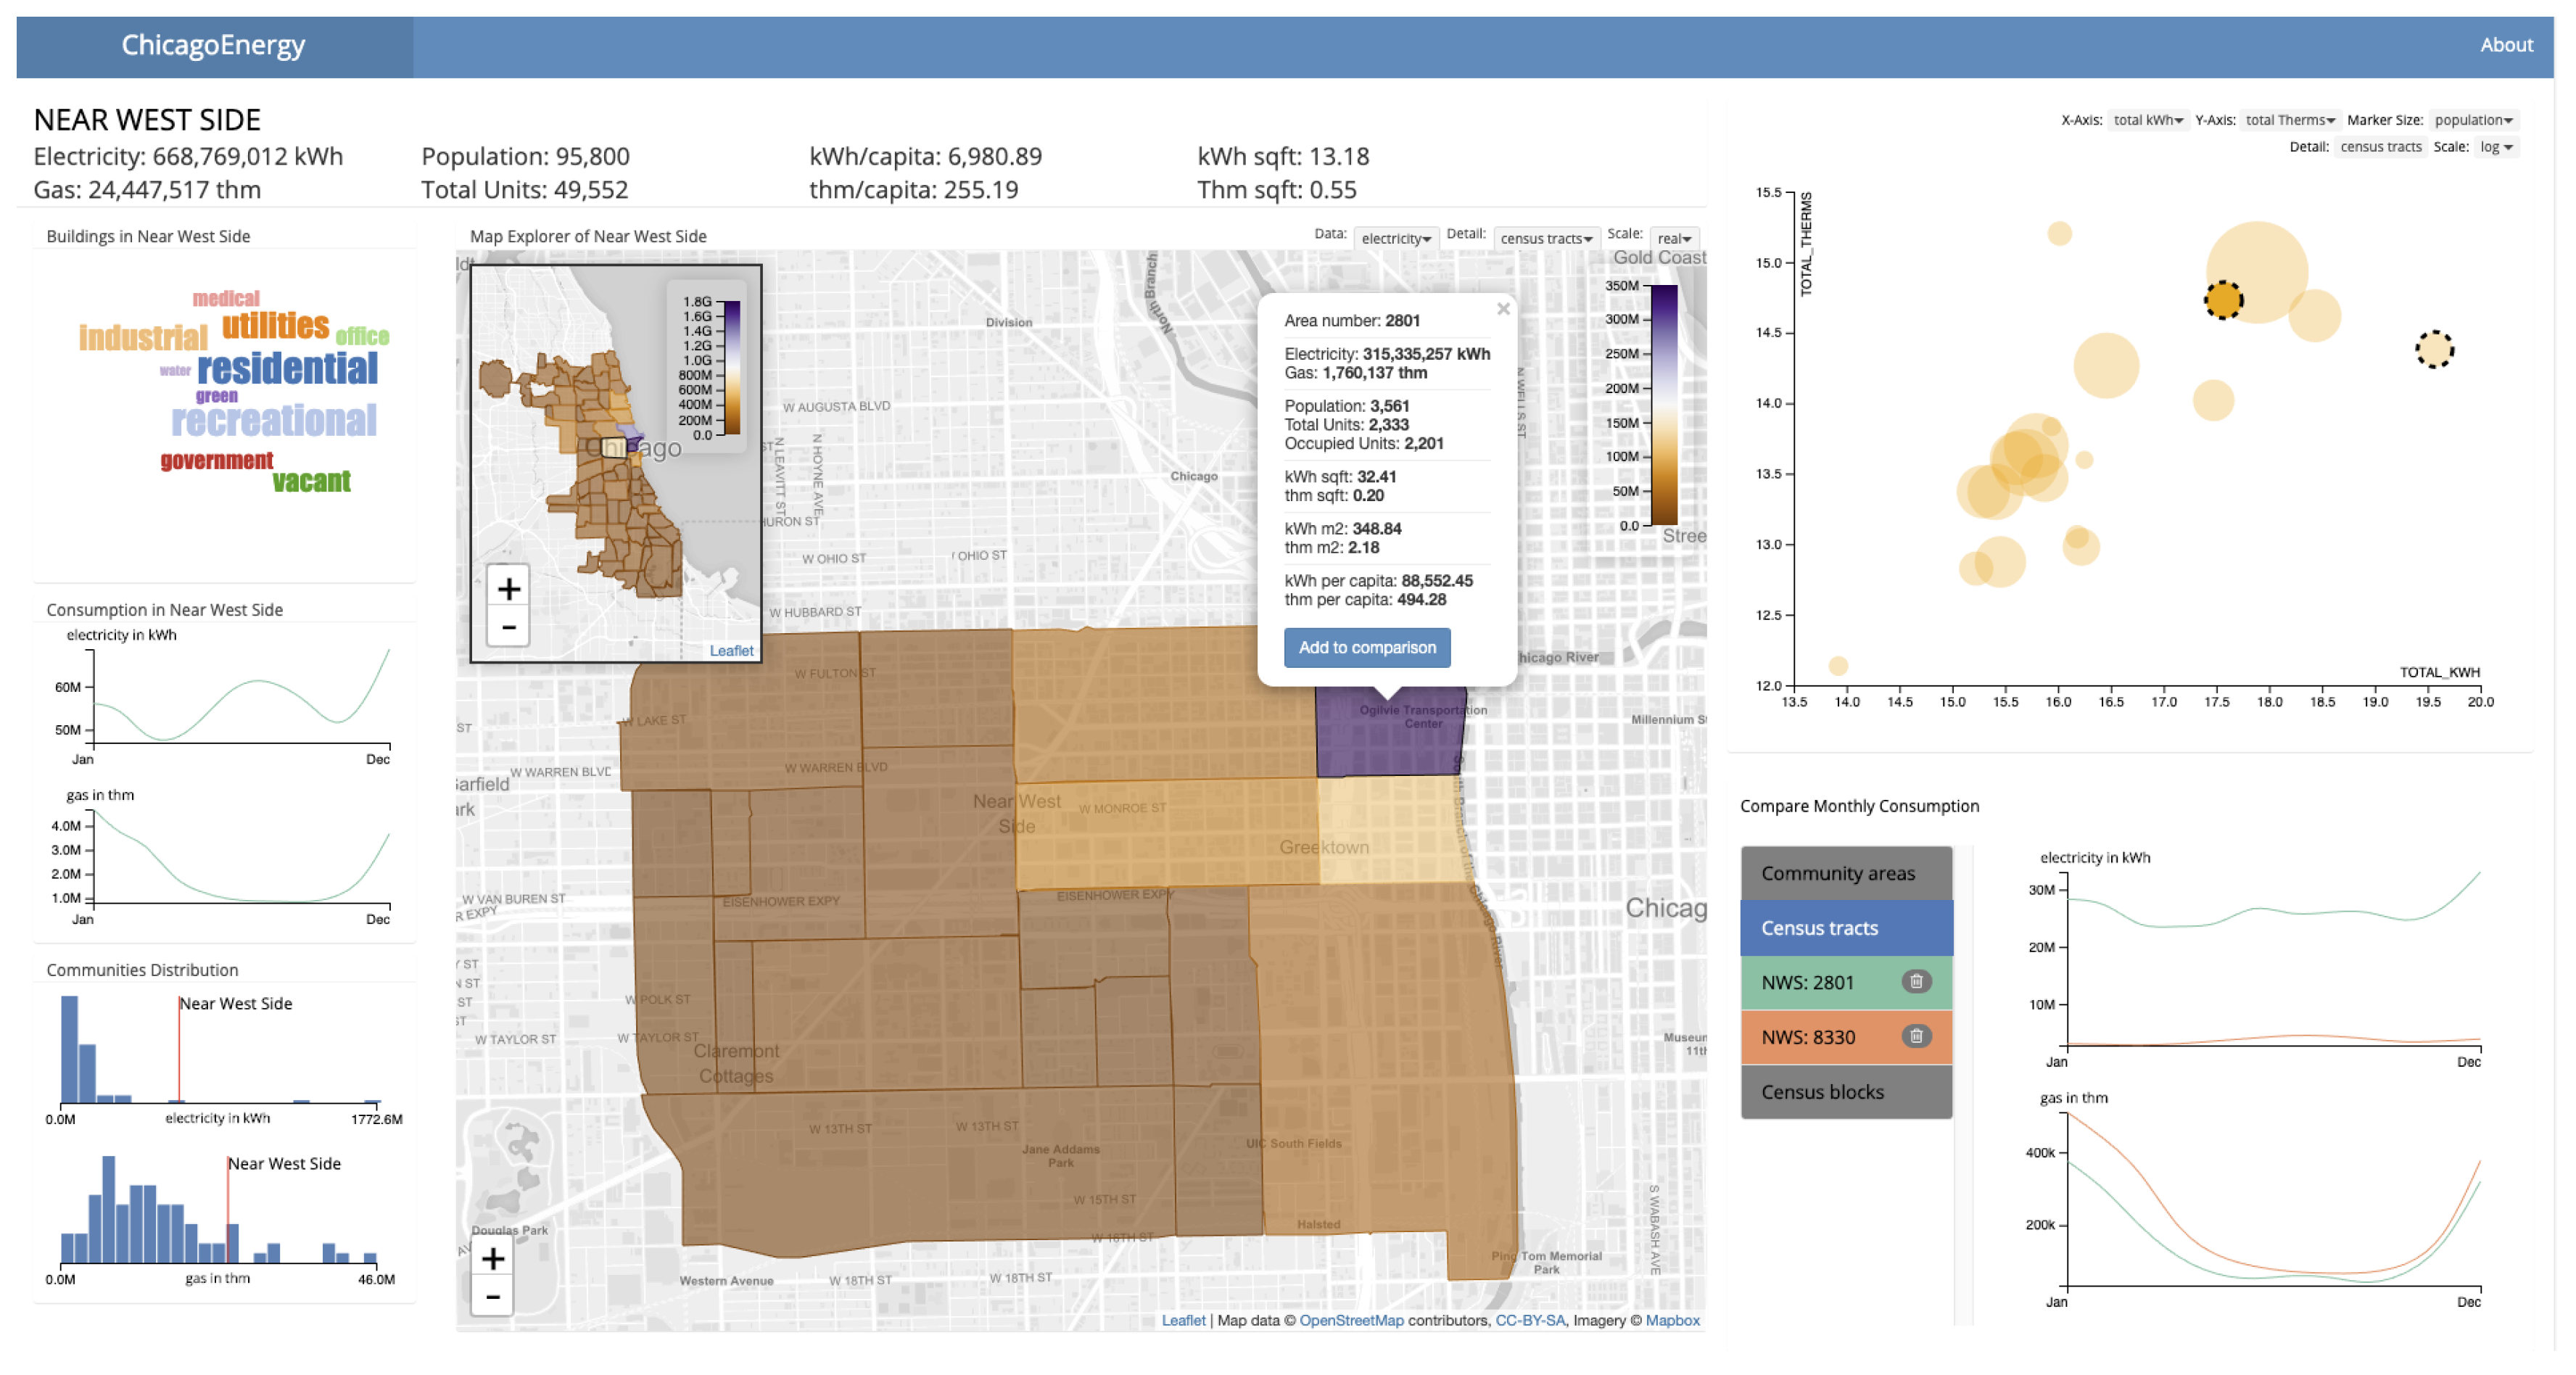
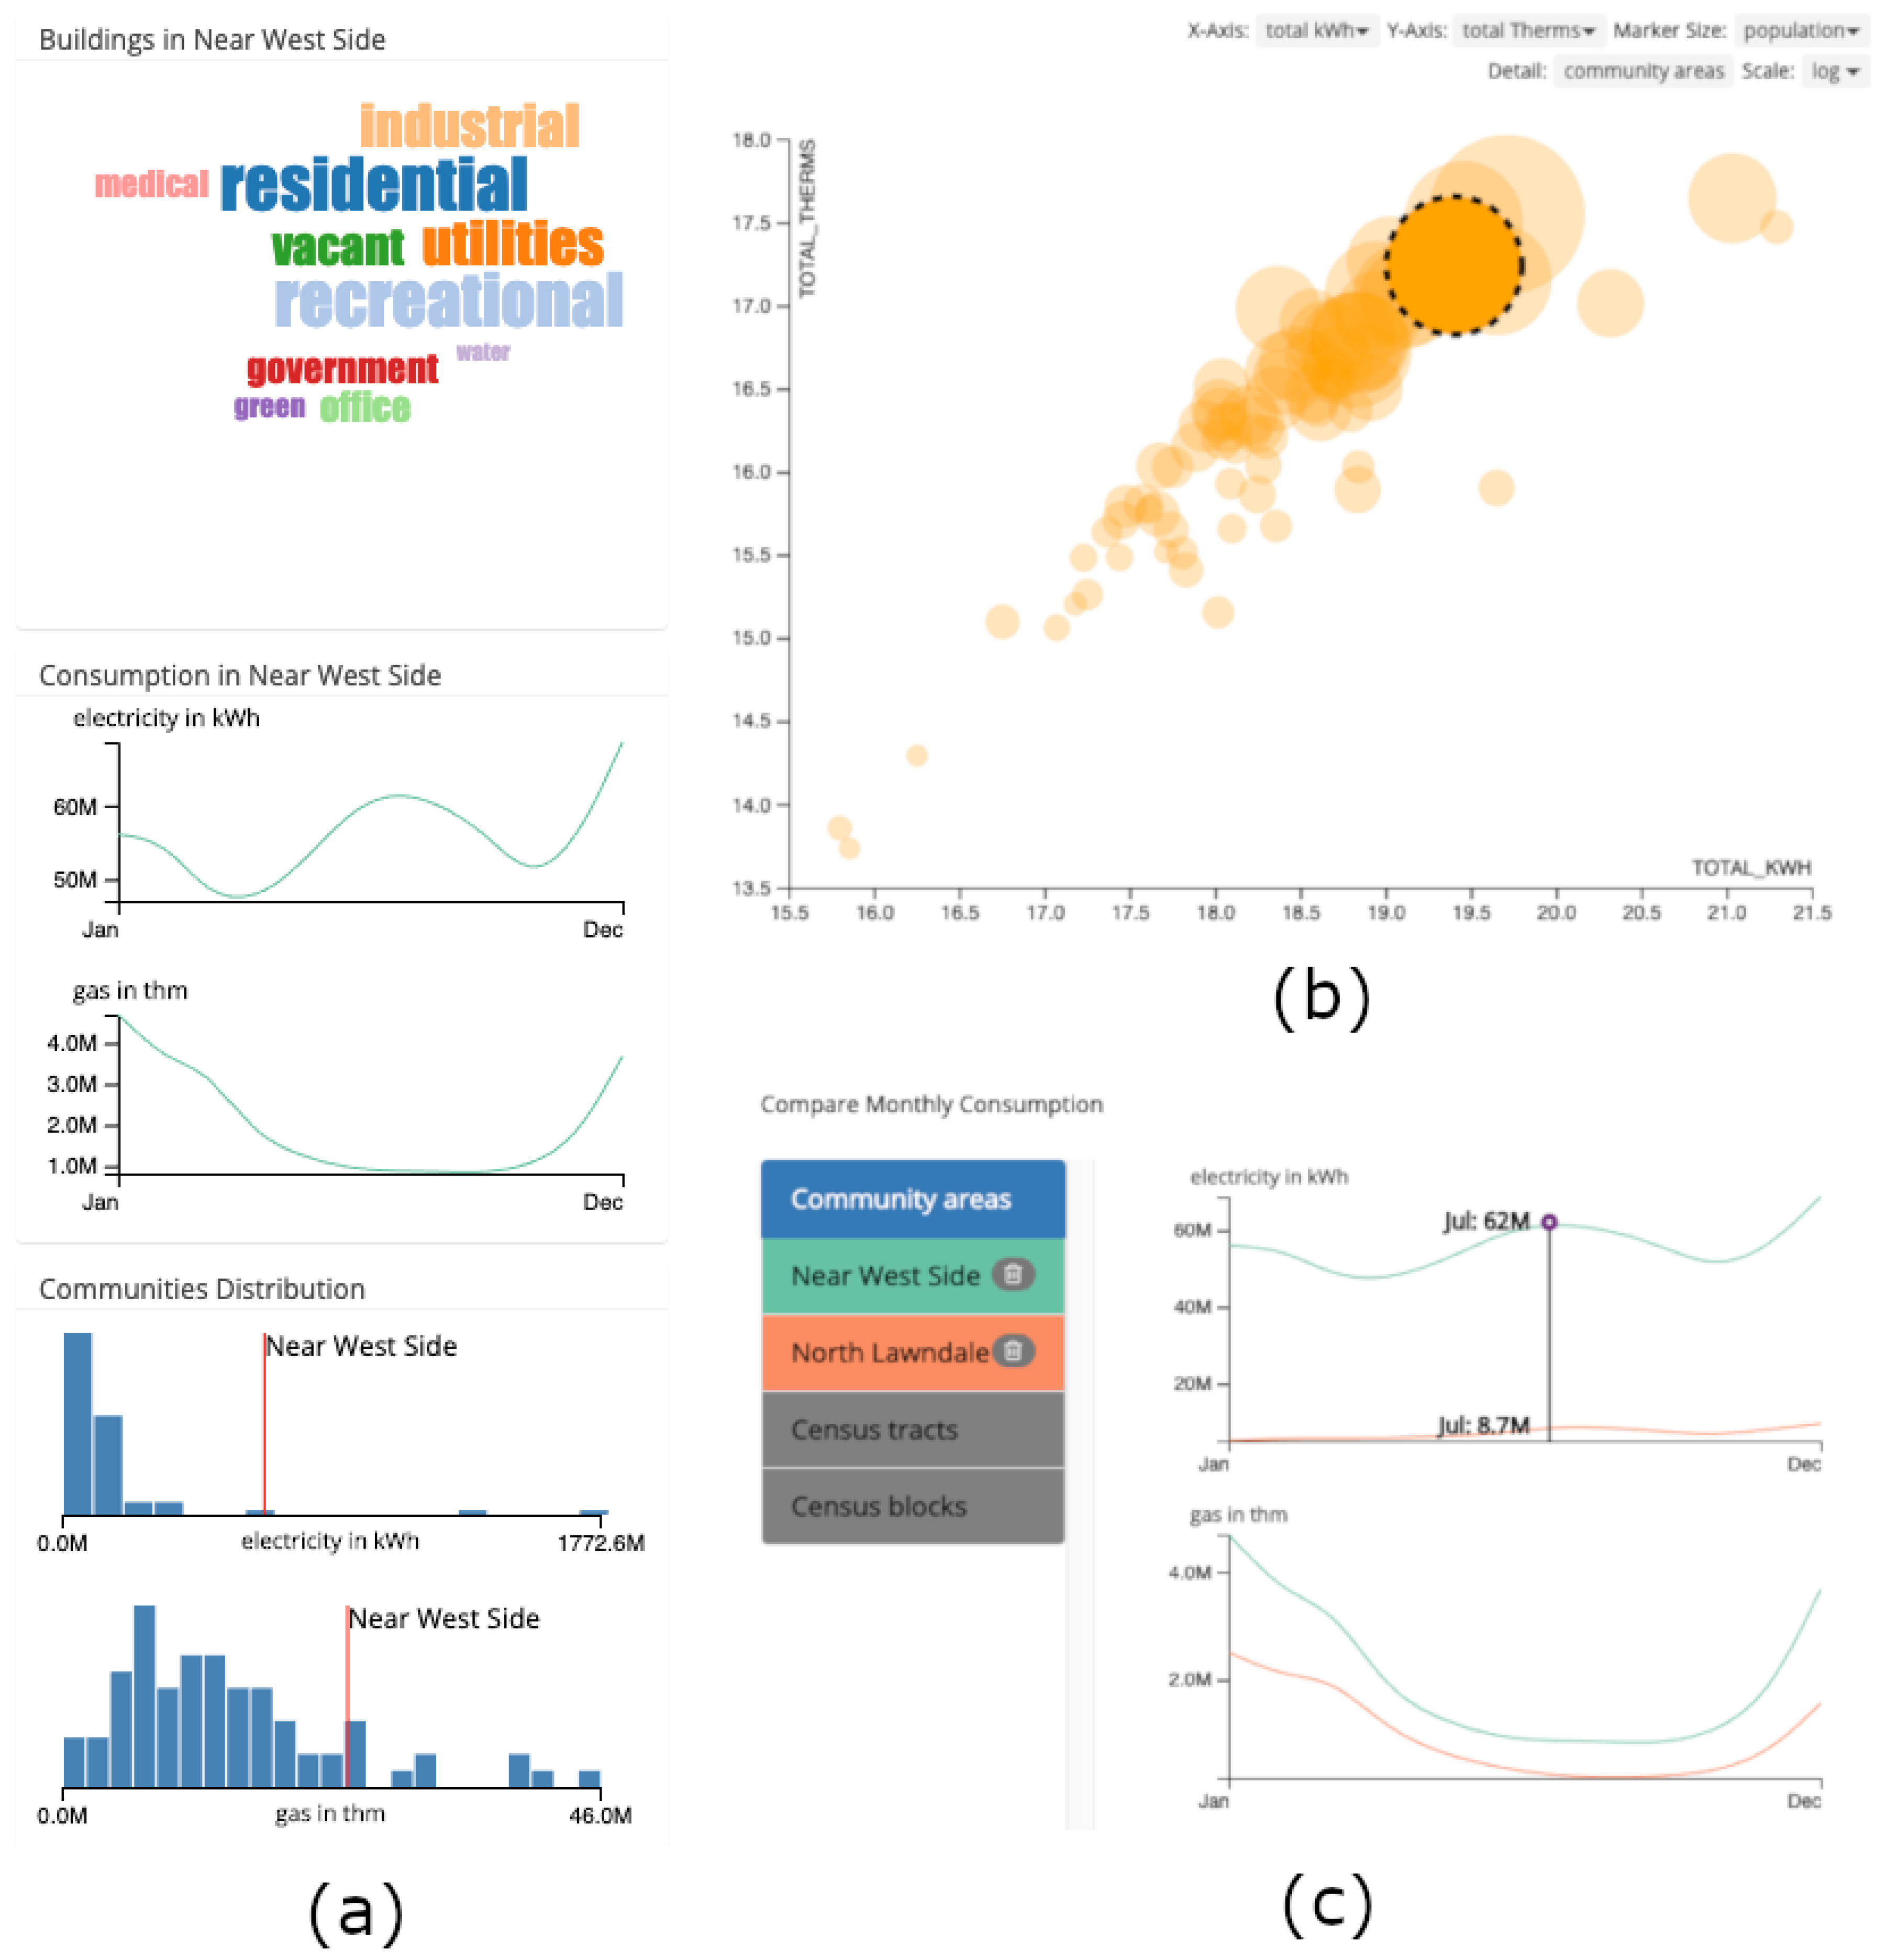
2.3.1. Map and Community Explorer
2.3.2. Scatterplot and Comparison Chart
3. Results
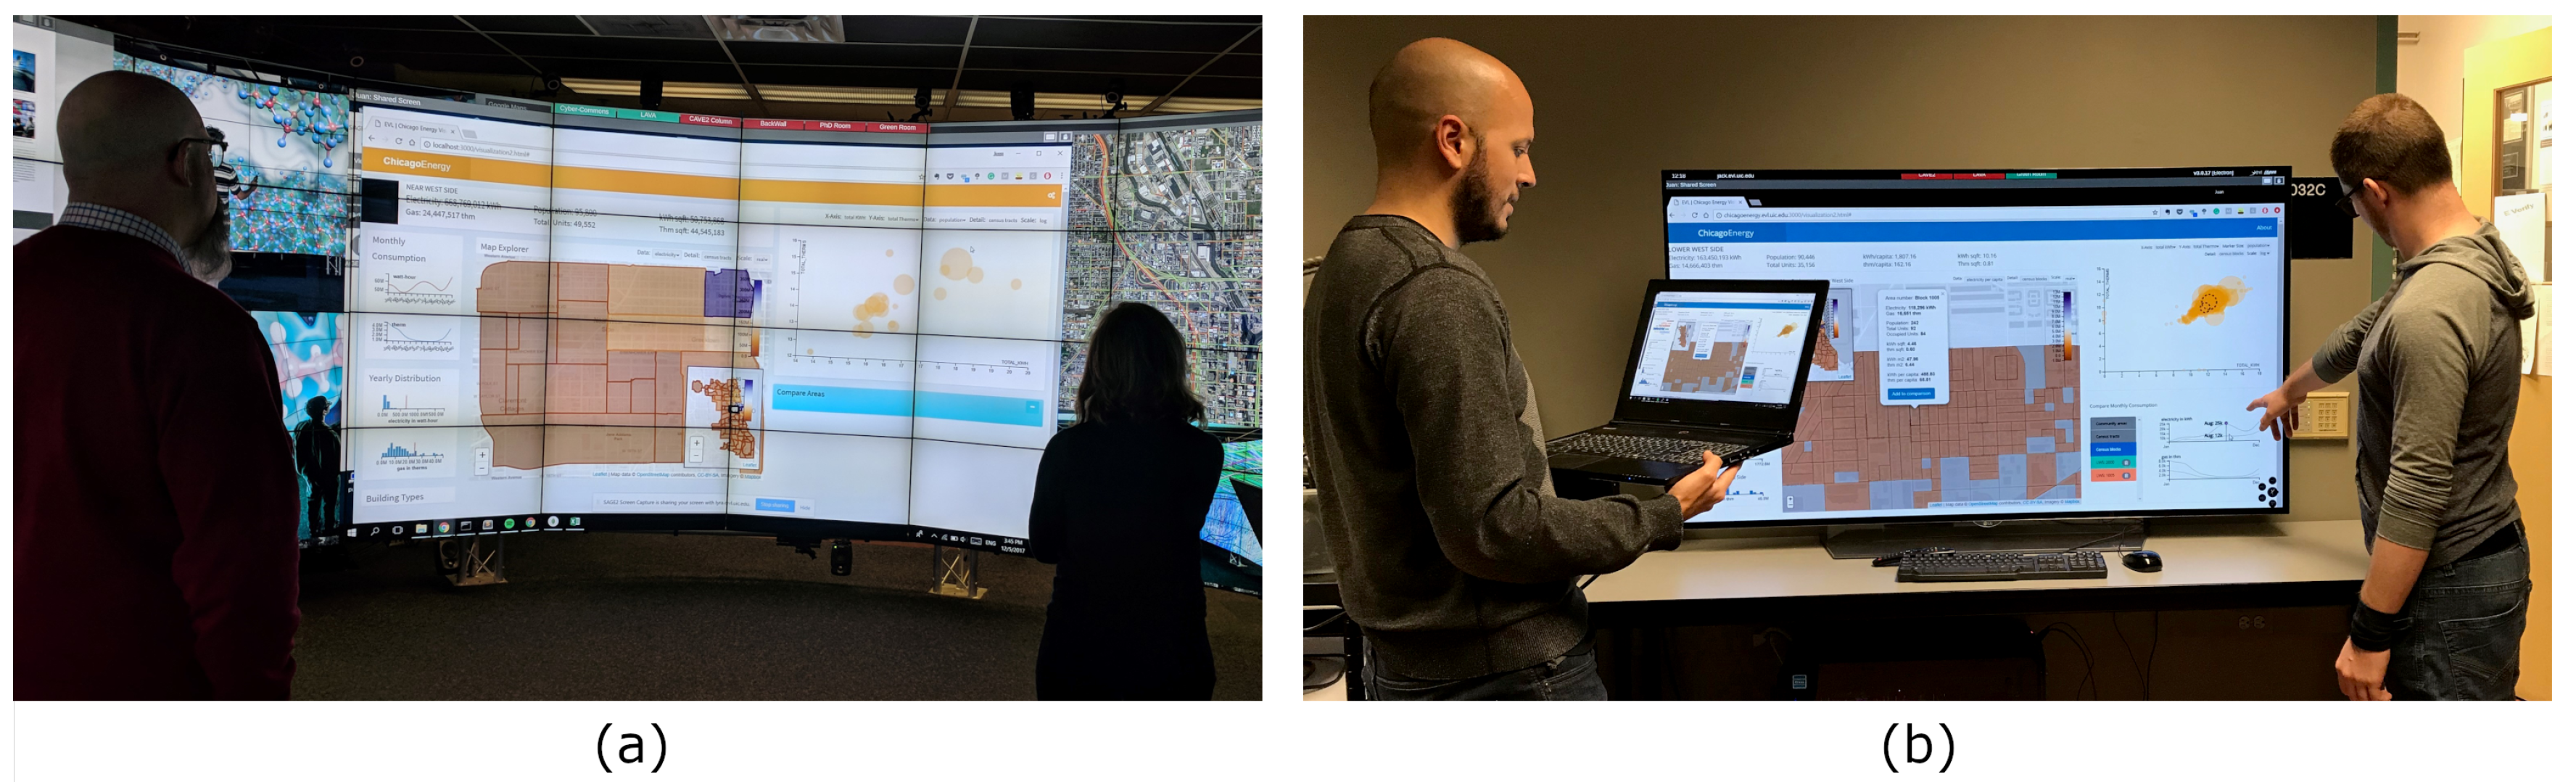
Case Study
4. Discussion and Conclusions
Author Contributions
Funding
Acknowledgments
Conflicts of Interest
References
- Thibodeaux, T. Smart Cities Are Going to Be a Security Nightmare. 2017. Available online: https://hbr.org/2017/04/smart-cities-are-going-to-be-a-security-nightmare (accessed on 10 November 2018).
- Cherone, H. Huge Drop In Bag Use Due To Bag Tax Could Cost City Millions, Study Finds. 2017. Available online: http://www.webcitation.org/779I5BBBM (accessed on 25 March 2019).
- Lee, D.; Derrible, S.; Pereira, F.C. Comparison of four types of artificial neural network and a multinomial logit model for travel mode choice modeling. Transp. Res. Rec. 2018. [Google Scholar] [CrossRef]
- U.S. Energy Information Administration. Total Energy. Available online: http://www.webcitation.org/77r6Gaklk (accessed on 23 April 2019).
- Kontokosta, C.; Tull, C.; Marulli, D.; Pingerra, R.; Yaqub, M. Web-Based Visualization and Prediction of Urban Energy Use from Building Benchmarking Data. In Proceedings of the Bloomberg Data for Good Exchange, New York, NY, USA, 28 September 2015. [Google Scholar]
- Howard, B.; Parshall, L.; Thompson, J.; Hammer, S.; Dickinson, J.; Modi, V. Spatial distribution of urban building energy consumption by end use. Energy Build. 2012, 45, 141–151. [Google Scholar] [CrossRef]
- Pincetl, S.; Graham, R.; Murphy, S.; Sivaraman, D. Analysis of High-Resolution Utility Data for Understanding Energy Use in Urban Systems: The Case of Los Angeles, California. J. Ind. Ecol. 2016, 20, 166–178. [Google Scholar] [CrossRef]
- City of Chicago. Chicago Energy City Map. Available online: http://www.webcitation.org/77A8Wn3jZ (accessed on 26 March 2019).
- Kelder, K. Visualizing Energy Consumption in Philadelphia. 2014. Available online: http://www.webcitation.org/77A9pCPWW (accessed on 26 March 2019).
- City of Philadelphia, Office of Sustainability. 2018 Building Energy Benchmarking. 2018. Available online: http://www.webcitation.org/77AA1eaNi (accessed on 26 March 2019).
- Tomorrow. Electricity Map. Available online: http://www.webcitation.org/77AA8rYfi (accessed on 26 March 2019).
- Australian Energy Market Operator. AEMO Map. Available online: http://www.webcitation.org/77AAH9TZF (accessed on 26 March 2019).
- Andrienko, N.; Andrienko, G.; Gatalsky, P. Exploratory spatio-temporal visualization: An analytical review. J. Vis. Lang. Comput. 2003, 14, 503–541. [Google Scholar]
- Zheng, Y.; Wu, W.; Chen, Y.; Qu, H.; Ni, L.M. Visual analytics in urban computing: An overview. IEEE Trans. Big Data 2016, 2, 276–296. [Google Scholar] [CrossRef]
- Goodwin, S.; Dykes, J.; Jones, S.; Dillingham, I.; Dove, G.; Duffy, A.; Kachkaev, A.; Slingsby, A.; Wood, J. Creative user-centered visualization design for energy analysts and modelers. IEEE Trans. Vis. Comput. Graph. 2013, 19, 2516–2525. [Google Scholar] [CrossRef] [PubMed]
- Marai, G.E. Activity-centered domain characterization for problem-driven scientific visualization. IEEE Trans. Vis. Comput. Graph. 2018, 24, 913–922. [Google Scholar] [CrossRef] [PubMed]
- Chicago Data Portal. Energy Usage 2010. 2013. Available online: http://www.webcitation.org/77A8CqMga (accessed on 26 March 2019).
- Dow, S.P.; Glassco, A.; Kass, J.; Schwarz, M.; Schwartz, D.L.; Klemmer, S.R. Parallel prototyping leads to better design results, more divergence, and increased self-efficacy. ACM Trans. Comput. Hum. Interact. (TOCHI) 2010, 17, 18. [Google Scholar] [CrossRef]
- Marrinan, T.; Aurisano, J.; Nishimoto, A.; Bharadwaj, K.; Mateevitsi, V.; Renambot, L.; Long, L.; Johnson, A.; Leigh, J. SAGE2: A new approach for data intensive collaboration using Scalable Resolution Shared Displays. In Proceedings of the 10th IEEE International Conference on Collaborative Computing: Networking, Applications and Worksharing, Miami, FL, USA, 22–25 October 2014; pp. 177–186. [Google Scholar]
- Miles, M.B.; Huberman, A.M.; Huberman, M.A.; Huberman, M. Qualitative Data Analysis: An Expanded Sourcebook; Sage: Thousand Oaks, CA, USA, 1994. [Google Scholar]
- Patton, M. Qualitative Research & Evaluation Methods, 3rd ed.; Sage Publications: Thousand Oaks, CA, USA, 2002. [Google Scholar]


© 2019 by the authors. Licensee MDPI, Basel, Switzerland. This article is an open access article distributed under the terms and conditions of the Creative Commons Attribution (CC BY) license (http://creativecommons.org/licenses/by/4.0/).
Share and Cite
Trelles Trabucco, J.; Lee, D.; Derrible, S.; Marai, G.E. Visual Analysis of a Smart City’s Energy Consumption. Multimodal Technol. Interact. 2019, 3, 30. https://doi.org/10.3390/mti3020030
Trelles Trabucco J, Lee D, Derrible S, Marai GE. Visual Analysis of a Smart City’s Energy Consumption. Multimodal Technologies and Interaction. 2019; 3(2):30. https://doi.org/10.3390/mti3020030
Chicago/Turabian StyleTrelles Trabucco, Juan, Dongwoo Lee, Sybil Derrible, and G. Elisabeta Marai. 2019. "Visual Analysis of a Smart City’s Energy Consumption" Multimodal Technologies and Interaction 3, no. 2: 30. https://doi.org/10.3390/mti3020030
APA StyleTrelles Trabucco, J., Lee, D., Derrible, S., & Marai, G. E. (2019). Visual Analysis of a Smart City’s Energy Consumption. Multimodal Technologies and Interaction, 3(2), 30. https://doi.org/10.3390/mti3020030