1. Introduction
Expressway networks in rapidly urbanizing regions have developed from relatively simple corridors into interconnected systems comprising ring expressways, radial routes, urban arterials, and national or provincial highways. Within these networks, interchanges are not only geometric connection points but also time-constrained information-processing environments. Drivers must identify relevant destinations or control points, interpret directional relationships, select an appropriate lane, and complete the required maneuver within a limited decision distance. Poorly structured or excessive guidance information may delay route recognition and contribute to hesitation, inappropriate speed adjustment, late lane changes, and incorrect route choices. Based on naturalistic driving data, the Federal Highway Administration suggested that right-exit guide signs should contain no more than nine words when at least one lane change is required and no more than ten words when exiting traffic is already in the correct lane [
1]. Complementary evidence from roadway guidance treatments also demonstrates the practical importance of clear visual information: colored lane markings were associated with an average 26.7% reduction in crash rates at statistically significant sites in Seoul [
2], while lane direction pavement markings enabled drivers to identify the appropriate lane and initiate lane changes earlier in a simulator study [
3]. The spatial ordering of destination information is also important, as conventional top-to-bottom ordering improves recognition when destination names are divided across multiple pavement marking lines [
4].
Guide signs are therefore a critical component of the road-information environment. The Manual on Uniform Traffic Control Devices and the Chinese national standard GB 5768.2 specify fundamental requirements for sign content, layout, legibility, and placement [
5,
6]. However, compliance with graphic and geometric specifications does not necessarily ensure that drivers can efficiently extract the information needed for route decisions. At complex interchanges, drivers must process destination names, route numbers, directional arrows, road relationships, and surrounding traffic conditions while continuing to monitor the roadway. The current editions of the MUTCD and GB 5768.2 provide the relevant regulatory context for traffic-sign design in the United States and China, respectively.
Previous research has consistently shown that sign information quantity affects recognition performance. Increasing information volume can extend visual search time and reduce recognition accuracy, particularly when drivers are unfamiliar with the sign content or road environment [
7]. Excessive information density also increases visual working-memory demand and is associated with slower responses and more recognition errors [
8]. Recent eye-tracking research on multi-information guide signs similarly found that increasing the number of place names reduced recognition efficiency and increased visual search difficulty [
9]. On-road eye movement studies further demonstrate that drivers do not inspect signs uniformly; fixation probability and recall are influenced by sign position, visibility, and the time available for observation [
10]. Physiological measures such as heart rate and skin conductance can provide complementary evidence of changes in cognitive demand that may not be fully reflected in vehicle operation measures alone [
11].
Sign comprehension is also influenced by the relationship between the displayed information and the driver’s expectations. Context and driver age can alter both comprehension accuracy and response time [
12], while semantically and visually congruent information can facilitate route interpretation and more rapid driving responses [
13]. Information language and format also affect processing demand. A simulator study of Chinese highway signs found that the effectiveness of bilingual signs declined as the number of place names increased and recommended limiting bilingual guide signs to five destination names under the tested conditions [
14]. These findings indicate that adding secondary text does not necessarily improve guidance; information should instead be selected and organized according to its immediate value for route decisions.
Guide signs should additionally be evaluated as sequential elements of a network-level guidance system rather than as isolated panels. Research on closely spaced exits showed that the number and placement of advance guide signs affected successful exit identification, lane-changing frequency, and deceleration behavior [
15]. Network-level coordination has consequently been described in terms of information continuity between adjacent nodes, consistency of sign format and layout, and stability of driver cognitive workload [
16]. A sign that is legible in isolation may still create uncertainty when a previously displayed destination or control point disappears before a required maneuver. In parallel, existing studies have shown that character height and installation position influence viewing distance and visual accessibility [
17,
18,
19]. Roadside signs may also be vulnerable to obstruction by large vehicles, making median-side or dual-side placement potentially advantageous under some traffic conditions [
20].
Complementary studies have examined differences in guide-sign information cognition among drivers with different characteristics [
21], content design for interchange guide signs under complex road-network conditions [
22], the effectiveness of expressway guide signs using driving-simulation experiments [
23], quantitative evaluation of traffic-sign information in road-network transition segments [
24], and the optimization of guide signs for ring expressways [
25]. Related research has also addressed ergonomics-based evaluation of traffic-sign effectiveness [
26], indicators and analytical methods for characterizing driving behavior [
27], and variations in physiological parameters during highway driving [
28].
Despite these advances, three research gaps remain. First, much of the existing literature has emphasized the total amount of information or the legibility of individual signs, while giving less attention to the internal hierarchy between destinations, control points, and directional information. Second, relatively few studies have examined how the disappearance or substitution of route information across consecutive interchanges affects visual search, physiological response, and speed behavior. Third, evidence regarding information organization, character height, and installation position has generally been obtained from separate field, laboratory, or simulation studies, limiting its direct translation into a coordinated guide-sign design process.
To address these gaps, the present study integrates an on-road field experiment with a driving simulation experiment. The field experiment examines drivers’ visual search, physiological responses, speed behavior, and use of destination and control-point information in the Fuzhou expressway network. The simulation experiment evaluates character heights of 55, 65, and 75 cm and roadside, median-side, and dual-side installation under three ordinal traffic background conditions representing different levels of surrounding vehicle interference and potential sign occlusion. Evidence from the two experiments is interpreted jointly to formulate recommendations concerning information hierarchy, continuity, panel layout, character height, and installation position. These principles are subsequently applied to Xiuzhai Interchange, and the comprehensibility of the optimized scheme is examined through a dynamic screen-based route-choice test.
2. Materials and Methods
2.1. Study Design and Analytical Framework
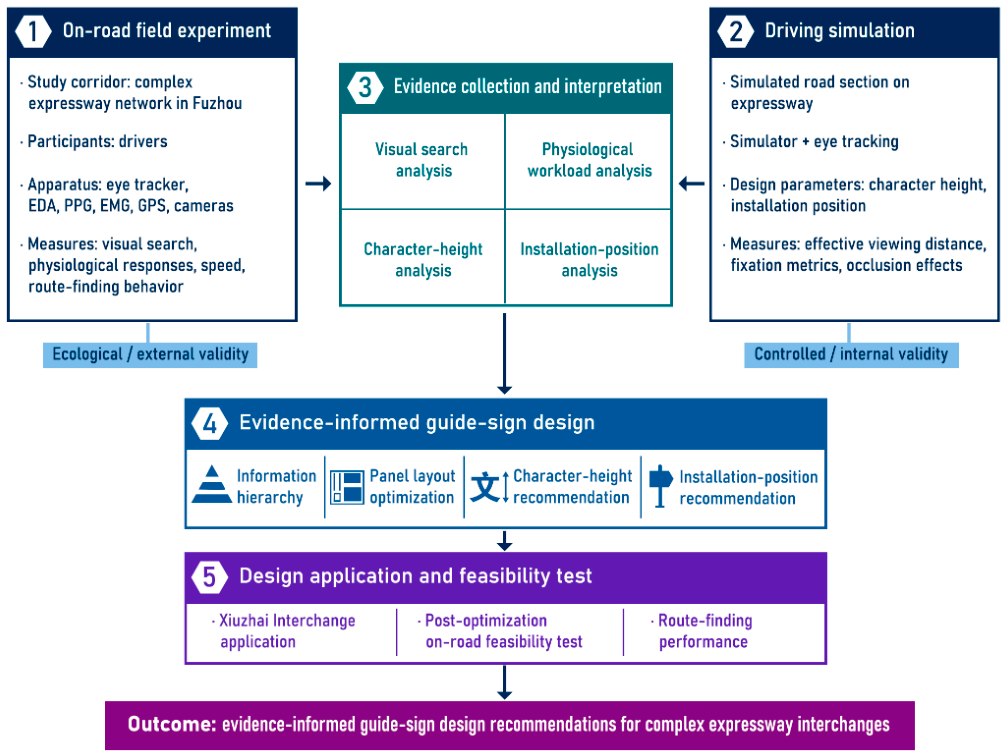
This study integrated two separately designed experimental components: an on-road field experiment and a controlled driving simulation experiment. The two experiments were not intended as direct replications or as sequential stages in which one experiment determined the design of the other. Instead, they addressed complementary aspects of expressway guide-sign performance. The field experiment examined drivers’ visual search, physiological workload, speed response, and route-finding behavior under natural conditions in the Fuzhou expressway network. Particular attention was given to the availability of destination information, the substitutive role of control-point information, and the continuity of guidance across successive interchanges. The simulation experiment examined the effects of modifiable sign-design parameters, primarily character height and installation position, under three ordinal traffic background conditions representing different levels of surrounding vehicle interference and potential sign occlusion.
Participants were recruited separately for the field experiment, the simulation experiment, and the subsequent on-road feasibility test. Because participation in more than one component was not prohibited, four individuals took part in more than one study component. However, each component was conducted and analyzed separately, and no participant-level data were pooled across experiments for inferential comparison.
The analytical framework comprised three linked functions: natural road problem identification, controlled evaluation of modifiable design parameters, and evidence-informed design translation. The field experiment was used to characterize information search difficulties, physiological responses, and speed behavior in a real complex road network, thereby providing ecological evidence with regard to how drivers used destination and control-point information. The simulation experiment complemented the field experiment by examining character height, installation position, visual attention allocation, and susceptibility to surrounding-vehicle occlusion under more controlled conditions.
The findings from the two experiments were interpreted jointly rather than pooled statistically, because the experiments involved separately recruited samples and addressed different research questions. The resulting design recommendations were applied to Xiuzhai Interchange and subsequently examined using a dynamic screen-based route choice comprehension test. Because this test included neither the existing sign design as a concurrent control nor a before–after comparison, it was used only to assess the comprehensibility and preliminary applicability of the proposed scheme under the tested presentation conditions, rather than to establish causal improvement.
The overall research framework is shown in
Figure 1.
2.2. Field Experiment
2.2.1. Study Corridor and Route-Finding Tasks
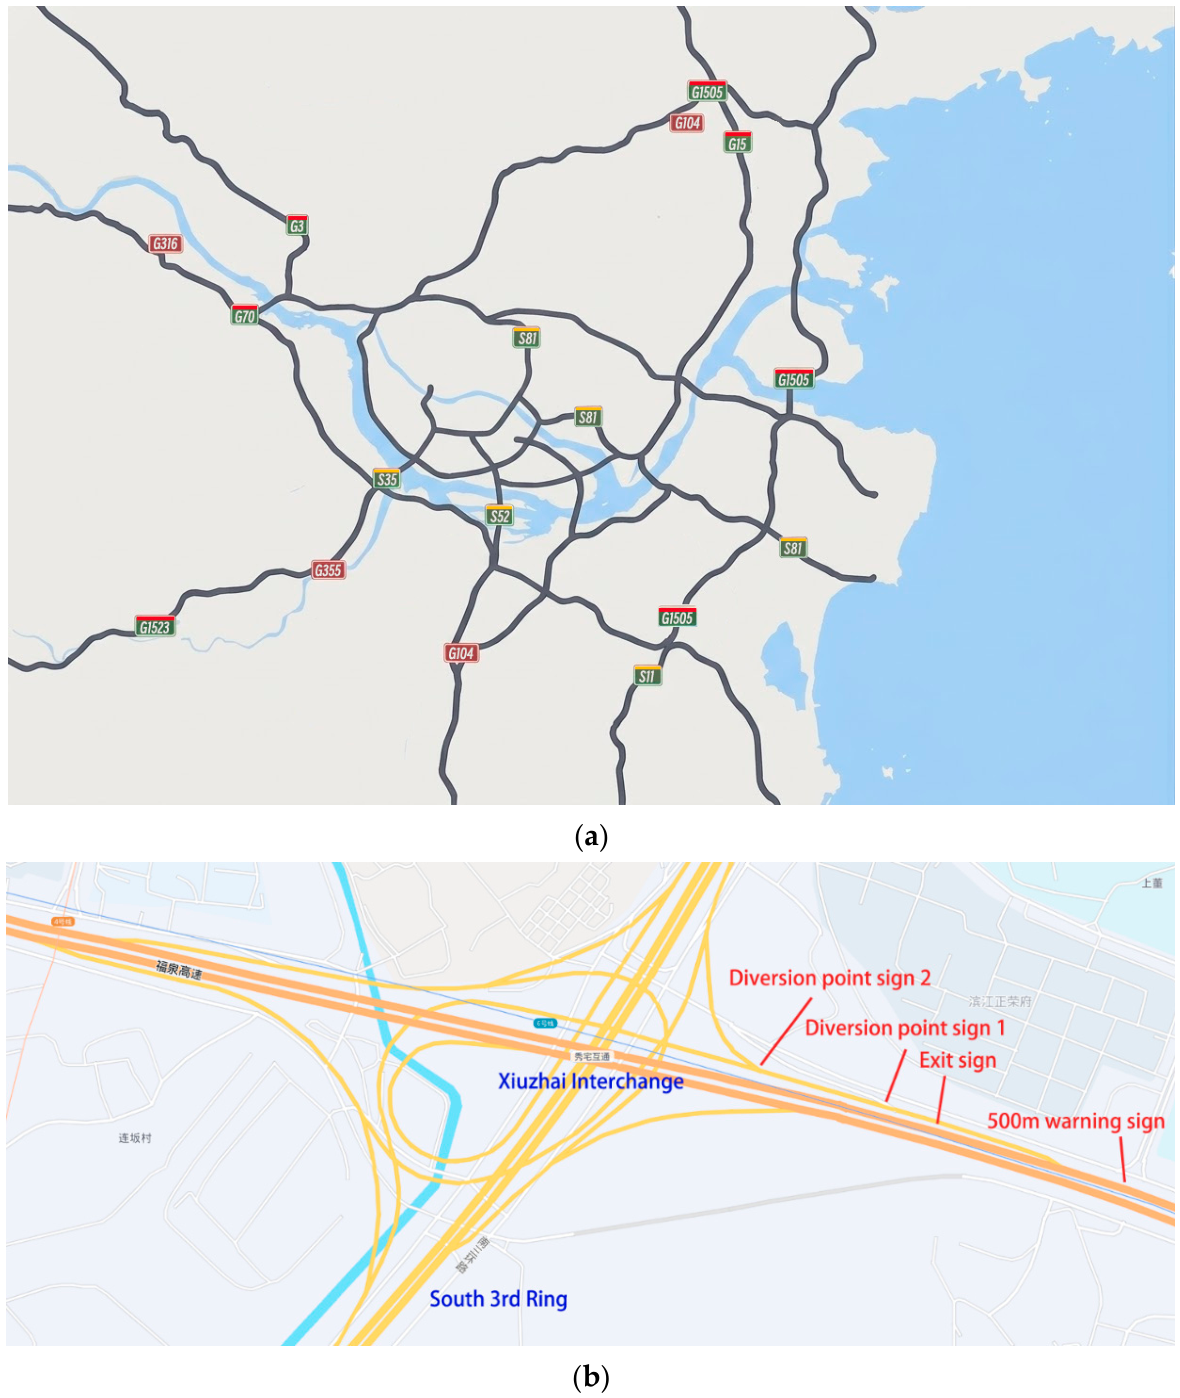
The field experiment was conducted within the Fuzhou expressway network, which comprises the G3 Beijing–Taipei Expressway, the G15 Shenyang–Haikou Expressway, the G70 Fuzhou–Yinchuan Expressway, and the Fuzhou Ring Expressway. The network contains multiple ring-road, radial-road, and interchange connections and was therefore considered suitable for examining drivers’ use of guide-sign information under complex road network conditions.
The field experiment consisted of two route-finding tasks addressing guide-sign use at different spatial scales. The same ten participants completed both tasks, and no participant withdrew before completing the field experiment. The two tasks were not required to follow a fixed order. Their implementation order was determined according to participant availability and prevailing experimental conditions. To reduce fatigue associated with continuous driving and minimize potential carryover effects between tasks, the two tasks were conducted on separate days.
The first task focused on visual information acquisition within a concentrated interchange approach. At the southeast entrance of Xiuzhai Interchange, participants were instructed to identify route information associated with University Town in Shangjie Town, Minhou County, and to select the corresponding driving direction. The task involved a sequence of advance, exit, and diversion point guide signs and was used to examine how drivers unfamiliar with the experimental road network searched for destination information, control-point information, and directional arrows under limited viewing time.
The second task focused on the continuity and usability of guide information over an extended route. Participants drove approximately 35 km from Minhou (Zhuqi) Interchange to Yingqian (Changle) Interchange, passing several major interchanges and junctions. Before the formal route-finding task, each participant completed a familiarization drive to adapt to the instrumented vehicle and the experimental environment. At the starting point, the participant was informed of the target destination and was given approximately 5 min to inspect a paper map, plan the route, and identify potentially relevant intermediate control points.
Once the formal drive began, participants were not permitted to consult the paper map, smartphone navigation, in-vehicle navigation, or any other auxiliary route-guidance source. The paper map was either collected by the researchers or placed outside the participant’s field of view. This restriction was an experimental control rather than an assumption that drivers do not use digital navigation in ordinary driving. Its purpose was to isolate the contribution of roadside guide signs and to determine whether destination and control-point information alone remained sufficiently continuous across successive interchanges to support route confirmation and timely driving decisions. The field experiment therefore evaluated sign-based route finding under the controlled absence of auxiliary navigation.
The field tasks were primarily scheduled during off-peak periods on working days or during daytime hours on public holidays. Whenever practicable, testing was conducted under relatively stable traffic conditions, good visibility, and no evident adverse weather. Actual traffic conditions and unexpected external disturbances were recorded concurrently by the research personnel and were subsequently considered during data screening.
No dedicated safety officer was seated in the experimental vehicle. A researcher seated in the rear operated the acquisition equipment, supervised the experimental procedure, and recorded abnormal events. All participants held valid driving licenses and had regular on-road driving experience. Before each task, participants were instructed to reduce speed and stop at a safe location if they experienced physical discomfort, equipment malfunction, or any other condition that could compromise safety. The corresponding trial would then be terminated. Roadside assistance or emergency medical services were to be contacted when necessary.
The two tasks were not designed as replications of the same route-choice situation. The first examined sign-reading behavior within a concentrated interchange sign sequence, whereas the second examined network-level guidance continuity during an extended route-finding process.
The study corridor and the guide-sign sequence at Xiuzhai Interchange are shown in
Figure 2.
2.2.2. Participants, Vehicle, and Instrumentation
Ten male drivers aged 20–35 years participated in the on-road field experiment. All participants held valid driving licenses and had regular on-road driving experience. They had normal or corrected-to-normal visual acuity of at least 1.0, reported no color-vision deficiency, and had no previous driving experience on the experimental expressway network. These criteria were intended to ensure reliable perception of guide-sign information while limiting the influence of prior familiarity with the study route. The same ten participants completed both route-finding tasks, and no participant withdrew or was excluded during the field experiment.
The archived study records did not contain an a priori statistical power calculation for the field experiment. The sample size was constrained by the practical requirements of simultaneously collecting eye-movement, physiological, video, positioning, and vehicle operation data under real-road conditions. The field component was therefore designed and interpreted as an exploratory repeated-measures human-factors experiment rather than as a population-representative survey. The ten participants contributed multiple sign-reading episodes.
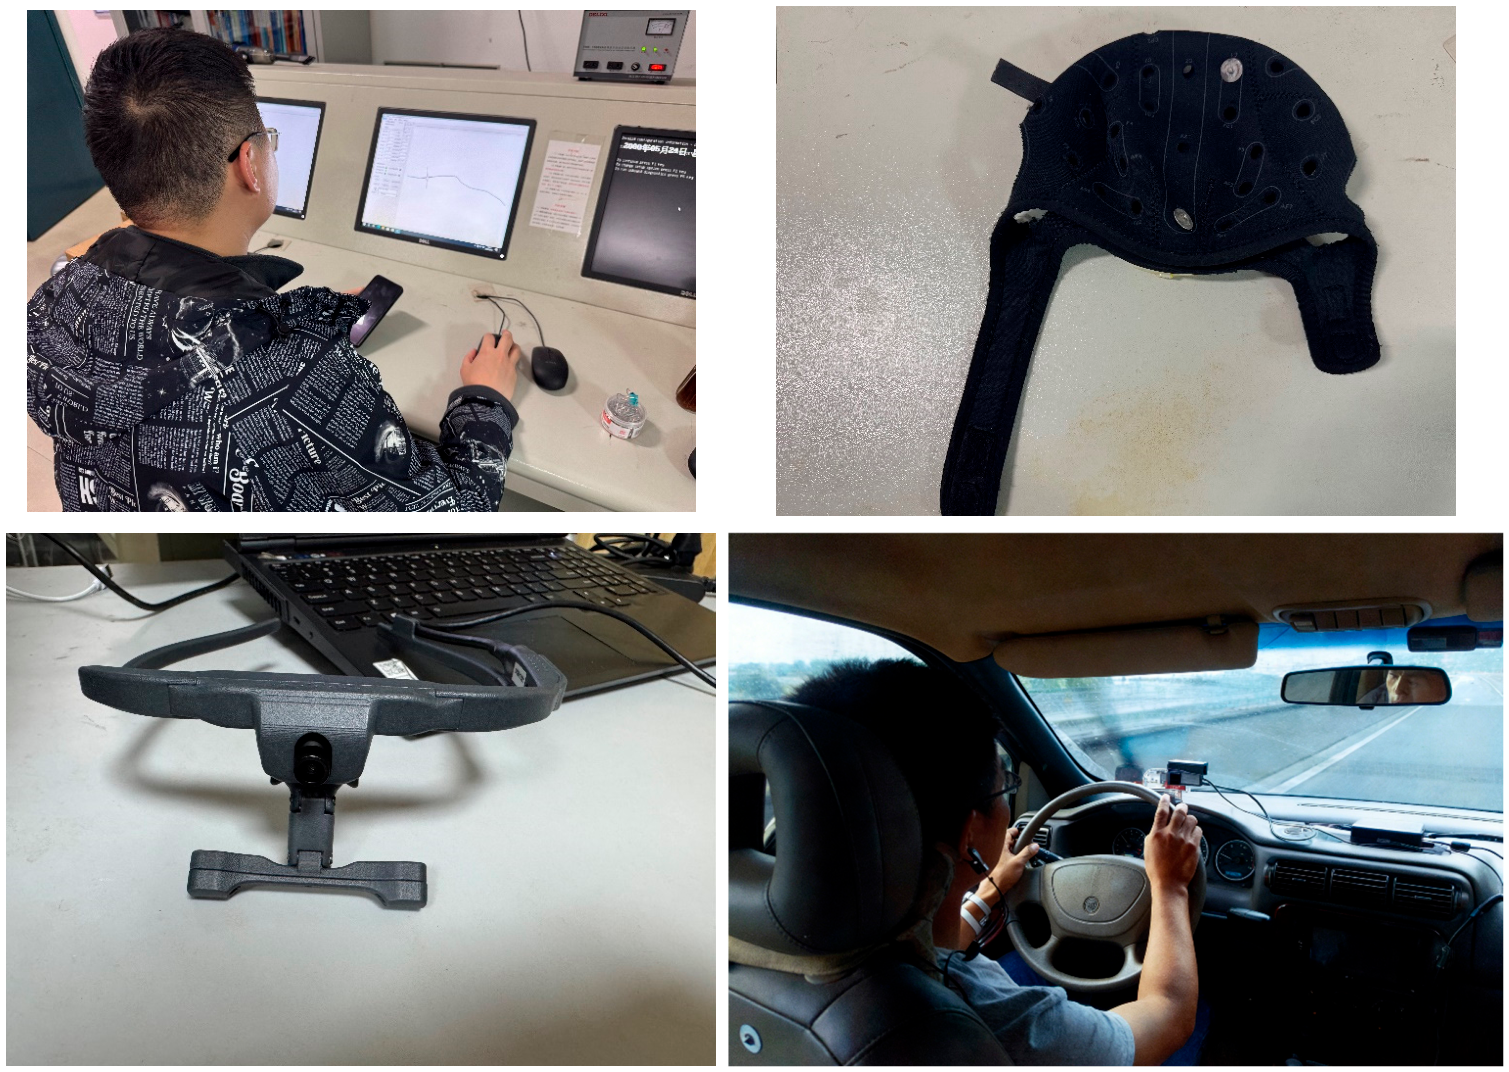
A seven-seat Buick GL8 vehicle with an automatic transmission was used as the instrumented experimental vehicle. The vehicle was selected to accommodate the participant, four research personnel, and the data-acquisition equipment. The ErgoLAB human–machine–environment platform served as the central system for acquiring and organizing the eye-movement, physiological, and behavioral data.
Drivers’ eye movements were recorded using a Tobii X2-60 eye tracker (Tobii Technology AB, Danderyd, Sweden) with a nominal sampling rate of 60 Hz. Before data collection, the participant adjusted the seat and driving posture, after which the eye tracker was fixed in position. A five-point calibration was then performed using four points located at the corners of a rectangular calibration area and one point at its center. The vehicle was positioned perpendicular to a wall carrying the calibration area, and the operating status of the eye tracker was checked after calibration. The archived experimental records did not specify a numerical calibration error threshold, an acceptance criterion, or a formal recalibration rule; therefore, no unverified calibration accuracy value is reported.
Electrodermal activity was recorded from the tip of the left index finger. This location was selected instead of the thenar or hypothenar region to reduce interference with steering wheel operation. Photoplethysmography was recorded from the participant’s earlobe, and electromyographic activity was recorded from the right tibialis anterior muscle to characterize lower-limb muscular activity during accelerator and brake operation. The EDA, PPG, and EMG sensors transmitted data wirelessly to the ErgoLAB (version 3.13.4) platform. Because the original channel headers and acquisition logs were not retained in the available records, the original acquisition frequencies of these physiological signals are not reported.
Vehicle position and speed were obtained using GPS. A forward-facing scene camera mounted near the eye-tracking system recorded the roadway and guide signs ahead of the vehicle. A behavior camera fixed to the left side of the front-passenger-seat headrest recorded the participant’s hand and leg movements and the vehicle speedometer. The available records did not retain the GPS sampling frequency or the frame rates of the two cameras.
Data streams acquired within the ErgoLAB platform were temporally aligned using the platform time information. GPS data and scene-video events were subsequently matched to the ErgoLAB timeline using recorded time parameters and identifiable time points in the video recordings. The available records do not indicate that a common hardware clock, synchronization pulse, or lab streaming layer protocol was used, and no numerical estimate of synchronization error or temporal drift was available. The experimental vehicle and principal acquisition devices are shown in
Figure 3.
2.2.3. Experimental Procedure, Data Extraction, and Information Classification
Before the formal field experiment, participants completed a familiarization drive to become accustomed to the instrumented vehicle, experimental procedure, and data-acquisition environment. During the formal route-finding tasks, participants were instructed to drive normally and determine the assigned route using roadside guide signs. The researchers did not provide route guidance or interfere with participants’ decisions unless intervention was required for safety.
Eye-movement data, physiological signals, GPS records, vehicle speed data, forward-facing scene video, and in-vehicle behavior video were recorded continuously. These data streams were temporally aligned to identify guide-sign exposure events and the corresponding visual, physiological, and operational responses. Areas of interest were defined for the guide-sign panel and roadway environment. For each event, the analysis window began with the participant’s first fixation on the relevant guide-sign panel and ended when the corresponding route-decision episode was completed, as determined from the synchronized scene video, behavior video, GPS trajectory, and vehicle operation records.
The primary observational unit was a sign-reading episode, defined as one occasion on which one participant encountered and processed a guide-sign panel relevant to the assigned route-finding task. Because each participant contributed multiple episodes, the observations constituted repeated measurements nested within participants and were not treated as statistically independent participant samples.
A total of 126 sign-reading episodes were initially identified. Seven episodes were excluded because incomplete observation conditions or abnormal external interference prevented reliable extraction of the required response indicators. The remaining 119 episodes were retained for classification and analysis. Participant-level contributions and excluded observations are reported in the
Section 3 to make the clustered data structure transparent.
Each valid episode was classified according to a written coding protocol:
Class I: Destination information available. The guide sign explicitly displayed the destination associated with the assigned route.
Class II: Destination information unavailable but usable control-point information available. The target destination was not displayed directly, but the sign provided an intermediate control point or other route-related information from which the required direction could reasonably be inferred.
Class III: Neither destination nor usable control-point information available. The sign displayed neither the target destination nor control-point information that could support inference of the required route.
Two researchers independently classified all 119 valid episodes using the written protocol and without access to the physiological response results. They initially agreed on 108 episodes, corresponding to a raw agreement rate of 90.8%. The expected agreement by chance was 33.6%, yielding a Cohen’s kappa coefficient of 0.86. The remaining 11 disagreements were resolved through joint review and consensus, and the consensus classifications were used in the subsequent analyses.
2.3. Driving Simulation Experiment
2.3.1. Simulator, Road Scenario, and Guide-Sign Configurations
The driving simulation experiment was conducted using a virtual reconstruction of the K290+300–K303+200 section of the Beijing–Hong Kong–Macao Expressway between Shijiazhuang and Cixian. The simulated section was approximately 13 km long and included basic expressway segments, Nanzhuang Junction, Wenhe Bridge, Huangshi Interchange, and Huangshi Toll Station. The road environment was selected to provide a continuous expressway-driving context containing basic segments and interchange-related decision points.
The simulation was conducted using a DSR-1000TS driving simulator (Kunming University of Science and Technology Science and Technology Industrial Management Co., Ltd., Kunming, China) incorporating a Xiali passenger-car cockpit. Three-dimensional road and roadside environments were constructed using MultiGen Creator and Terra Vista (Presagis Canada Inc., Montreal, QC, Canada) and rendered and operated using VSDesign (Kunming University of Science and Technology, Kunming, China). Drivers’ eye movements were recorded using a Tobii X2-30 eye tracker (Tobii Technology AB, Danderyd, Sweden). Two guide-sign design dimensions were examined: character height and installation position. The character height conditions were 55, 65, and 75 cm. The installation position conditions were roadside placement, median-side placement, and dual-side placement. In the dual-side condition, guide signs were provided on both sides of the carriageway to examine visual-attention allocation and the potential influence of surrounding-vehicle occlusion. To reduce direct familiarity with the original route information and limit route-learning effects, the destination names displayed in the simulated scenes were replaced with Fuzhou, Quanzhou, and Zhangzhou.
The available experimental records did not retain sufficient information to verify the simulator motion configuration, display-system specifications, field of view, screen resolution, detailed road cross-section, sign-panel dimensions, sign visibility distance, or eye-tracker calibration procedure. These parameters are therefore not reported or inferred in the present manuscript.
2.3.2. Participants and Experimental Allocation
Sixty licensed drivers participated in the driving simulation experiment, including 43 males and 17 females. Participants were 22–52 years old, had 2–10 years of driving experience, and held valid C1 driving licenses. The simulation sample was recruited separately from the field-experiment and post-optimization feasibility test samples. Participation in more than one study component was not prohibited, and four individuals participated in more than one component. Nevertheless, each experimental component was conducted and analyzed separately, and participant-level data were not pooled across components.
The archived study records did not contain an a priori power calculation for the simulation experiment. Sixty licensed drivers were included, with 20 participants assigned to each of three ordinal traffic background conditions: low, medium, and high. These conditions represented increasing levels of surrounding vehicle presence and potential sign occlusion rather than independently verified traffic-flow rates. The retained records did not document whether assignment to the traffic background conditions was randomized or whether the three groups were balanced with respect to sex, age, or driving experience.
The archived documentation confirmed that the simulation included character heights of 55, 65, and 75 cm and roadside, median-side, and dual-side installation arrangements. However, the participant-by-scenario records were insufficient to establish whether every participant experienced all combinations of character height and installation position, whether these factors were manipulated within or between participants, or whether scenario order was randomized or counterbalanced. The simulation experiment was therefore not treated as a fully verified factorial or repeated-measures design. Statistical interpretation was restricted to descriptive comparisons and contrasts that could be supported by the retained condition-level records and no unverified interaction effects were inferred. Before the formal experiment, participants completed equipment calibration and a 3–5 min familiarization drive to adapt to the simulator and the virtual road environment. They then completed the assigned formal driving scenarios while eye-movement and driving performance data were recorded. A questionnaire was administered after the formal driving session.
2.3.3. Traffic Background Conditions and Experimental Procedure
The simulated road environment incorporated surrounding vehicles to represent different levels of traffic interference and potential guide-sign occlusion. Three ordinal traffic background conditions—low, medium, and high—were configured in the archived simulation scenarios. Each condition included passenger cars, large buses, and heavy trucks, with the archived vehicle-count settings summarized in
Table 1. These conditions were used as contextual scenarios for comparing guide-sign performance under different levels of surrounding vehicle presence rather than as independently calibrated traffic-flow rates.
Before formal data collection, participants completed equipment preparation and eye-tracker calibration, followed by a 3–5 min familiarization drive to adapt to the simulator controls and virtual road environment. They subsequently completed the formal driving scenarios assigned under the corresponding traffic background condition. Eye-movement and vehicle-operation data were recorded continuously throughout the formal driving session. Participants were instructed to drive normally and respond to the guide signs and surrounding traffic in a manner consistent with ordinary expressway driving.
The surrounding vehicles were included to create visual interference and potential occlusion of guide signs. Large buses and heavy trucks were particularly relevant to the visibility of roadside signs because of their larger vehicle profiles. The installation position analysis therefore considered guide-sign detection, the side receiving the first fixation under dual-side placement, and missed observations of roadside signs under the different traffic background conditions.
After completing the formal driving scenarios, participants completed a post-test questionnaire. The archived records did not preserve sufficient information to verify the vehicle-generation algorithm, vehicle-speed distributions, lane-changing rules, random seeds, scenario-loading order, or whether identical traffic trajectories were presented to all participants. Accordingly, the three traffic settings are interpreted as ordered simulation background conditions rather than precisely standardized traffic-flow treatments. Statistical comparisons involving these conditions were therefore limited to contrasts supported by the reconstructed participant and scenario records.
2.4. Statistical Analysis
Eye-movement and physiological indicators were summarized at the sign-reading-episode level. Because multiple episodes were contributed by the same drivers and the retained data did not permit reconstruction of a participant-clustered model, no independent-sample inferential conclusions were drawn from the original episode-level one-way ANOVA. The class-related physiological and speed-response patterns were therefore reported descriptively and interpreted as exploratory.
Because the retained simulation records did not permit complete reconstruction of participant-by-condition allocation, no complete factorial, repeated-measures, or interaction analysis was performed. Effective viewing distances and installation-position indicators were summarized descriptively across the verified character height, installation position, and traffic background conditions.
2.5. Ethics Approval and Informed Consent
This study involved non-invasive field-driving and driving simulation experiments and did not include any medical intervention. Before participation, all drivers were informed of the study objectives, experimental procedures, data to be collected, confidentiality measures, and their right to withdraw at any time. Written informed consent was obtained from all participants. All eye-movement, physiological, and driving behavior data were anonymized before analysis.
According to the institutional procedures applicable when the experiments were conducted, formal ethics committee approval was not required for this type of non-invasive transportation human-factors research.
3. Results
3.1. Visual Search Patterns and Information Hierarchy
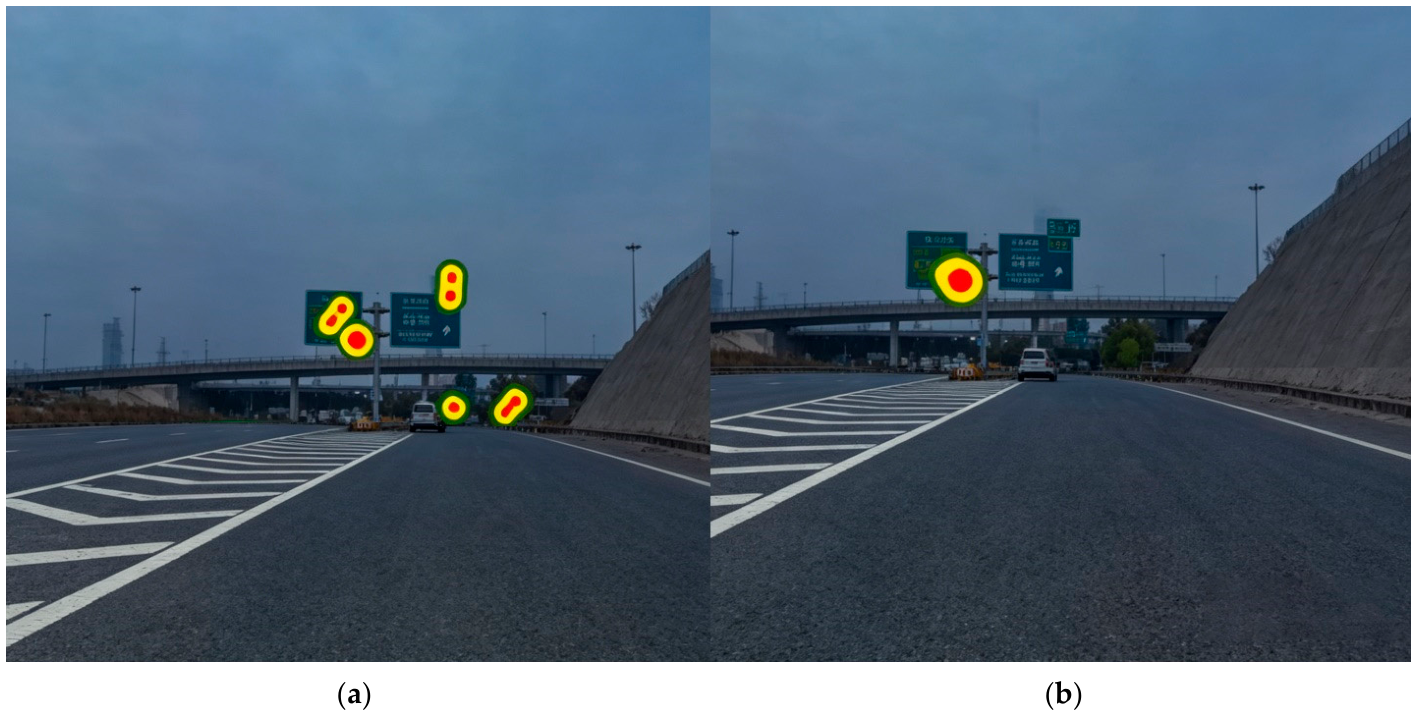
Descriptive analysis of fixation data from the five consecutive guide signs at Xiuzhai Interchange showed a predominantly target-driven visual search pattern. When the expected destination information was available, fixations were concentrated on the relevant place name and its corresponding directional arrow. When the expected information was absent, drivers repeatedly searched across different information items, resulting in a more dispersed fixation distribution.
The five signs formed a successive guidance sequence comprising the 1 km and 500 m advance signs, the exit sign, and two diversion-point signs. The observed fixation patterns therefore reflected both panel-level information search and repeated route confirmation across consecutive signs.
At Bailong Junction, where 16 place-name items were displayed, the sign area received an average of 15 fixations, compared with 10 fixations on the roadway area. At Nanyu Junction, where the expected route information was easier to locate, fixation allocation shifted from the sign area toward the roadway. These descriptive results suggest that clearly identifiable route information may reduce repeated sign searching and allow drivers to return their visual attention to the roadway more quickly.
Scanpath analysis showed four recurring tendencies. First fixations generally occurred in the upper-left region of the sign panel, after which the search proceeded from top to bottom and from left to right. Chinese place names attracted more attention than route numbers, letters, or numerals. Visual search generally ended after the expected destination or corresponding directional arrow had been identified. The regional reading-order indices and priority-viewing probabilities are presented in
Table 2, and an example of the fixation distribution is shown in
Figure 4.
3.2. Descriptive Driver-Response Patterns Across Sign Information Classes
The 119 valid sign-reading episodes were classified according to the availability of destination and control-point information. Class I signs explicitly displayed the target destination, Class II signs did not display the destination but provided usable control-point information, and Class III signs provided neither the destination nor an inferable control point. The corresponding numbers of episodes were 24, 69, and 26, respectively.
Each participant contributed between 11 and 12 valid episodes. Participant-level contributions were relatively balanced: six participants contributed 12 valid episodes with a distribution of two Class I, seven Class II, and three Class III episodes; three participants contributed 12 valid episodes with a distribution of three Class I, seven Class II, and two Class III episodes; and one participant contributed 11 valid episodes. The participant-level distribution is reported in
Table 3.
Of the 126 initially identified episodes, seven were excluded because of incomplete observation conditions or abnormal external interference. These exclusions involved one Class I episode, four Class II episodes, and two Class III episodes, leaving 119 episodes for analysis.
Speed profiles showed a similar descriptive pattern. Under Class I and Class II signs, drivers generally decelerated slightly during the initial sign-viewing period and subsequently recovered speed. Under Class III signs, drivers tended to continue decelerating because the expected route information could not be identified.
Together, the descriptive speed profiles suggest that usable control-point information may assist route inference when the exact destination is absent. When neither destination nor inferable control-point information was available, drivers tended to show more sustained deceleration. Because participant-linked physiological outcome values were unavailable for a cluster-aware reanalysis, no inferential conclusion is drawn regarding physiological differences among the three sign information classes.
3.3. Destination Information Continuity and Driver Responses
Destination information continuity was examined across five consecutive interchanges between Bailong and Huangshi, using Changle as the target destination. When the expected destination information remained available on consecutive signs, pupil diameter was generally stable or decreased. When the information disappeared after previously being displayed, pupil diameter increased, indicating greater processing demand during route confirmation. The observed transition patterns are summarized in
Table 4.
Fixation allocation showed a similar descriptive pattern. At the Nanyu and Xiangqian interchanges, where the expected destination information was available, the proportions of fixations directed to the sign area were 32.0% and 36.0%, respectively. At the Qingkou and Huangshi interchanges, where the expected information disappeared or became less specific, these proportions increased to 63.0% and 71.4%, respectively. This shift suggests that discontinuous destination information required drivers to devote more visual attention to sign searching and less attention to the roadway environment.
The corresponding fixation distributions across consecutive interchanges are presented in
Table 5.
3.4. Character Height and Effective Viewing Distance
Effective viewing distance increased with character height under all three traffic background conditions. The mean viewing distance increased from 72.25 m at a character height of 55 cm to 100.97 m at 65 cm and 148.82 m at 75 cm (
Table 6).
Effective viewing distance increased across the three tested character-height conditions under each traffic background scenario. The overall mean viewing distance was 72.25 m for the 55 cm condition, 100.97 m for the 65 cm condition, and 148.82 m for the 75 cm condition (
Table 7).
At a design speed of 120 km/h and an assumed recognition time of 2.6 s, the corresponding viewing distance requirement was approximately 86.7 m. The mean viewing distance in the 55 cm condition was below this value, whereas the mean distances in the 65 and 75 cm conditions exceeded it. Accordingly, 65 cm was the lowest of the three tested character heights that satisfied the assumed viewing distance requirement. This comparison applies only to the tested character heights and simulation scenarios and should not be interpreted as an interpolated or universal minimum.
3.5. Installation Position and Occlusion
Under dual-side placement, the median-side sign was more frequently fixated before the roadside sign. This tendency became more pronounced from the low- to the high-traffic background condition. The median-side sign also received an earlier first fixation than the roadside sign, with the mean time differences increasing from 1.23 s under the low-traffic background to 2.31 s under the high-traffic background. No occlusion of the median-side sign was recorded in the simulated scenarios, whereas roadside signs were occasionally missed under the high-traffic background condition.
The fixation indicators for the three installation arrangements are summarized in
Table 8. Under single-side placement, the median-side sign received slightly more fixations than the roadside sign, while their fixation durations were similar. Under dual-side placement, visual attention was distributed between the two signs, with the median-side sign receiving more fixations and a longer fixation duration than the roadside sign.
These results indicate that median-side placement may reduce interference from surrounding vehicles, whereas dual-side placement provides additional visual redundancy. However, repeating identical information on both sides may also distribute attention between two sign panels. Installation position should therefore be selected together with the surrounding vehicle environment and the need for information redundancy.
3.6. Screen-Based Route-Choice Comprehension Test of the Proposed Guide-Sign Scheme
To preliminarily examine the comprehensibility of the optimized guide-sign information, 25 licensed drivers with no previous driving experience at Xiuzhai Interchange were recruited. The participants were equally divided into five groups of five and assigned one of five destinations: the Cangshan Campus of Fujian Normal University, Yuanyang Road, Fuzhou East (Kuai’an), Qi’an Road, or Pushang Bridge.
Before the test, each participant was given 3 min to inspect a paper map and understand the road relationship between the assigned destination and Xiuzhai Interchange. The optimized guide-sign panels were then projected onto a screen using Flash-based presentation software. The signs were presented dynamically to simulate the visual process of gradually approaching a guide sign. Based solely on the displayed information, participants independently selected the control point or road information that they considered appropriate for reaching the assigned destination. Their responses were recorded and evaluated against the predefined route criteria.
All participants assigned to the Cangshan Campus of Fujian Normal University and Yuanyang Road selected the Second Ring Road. Participants assigned to Fuzhou East (Kuai’an) selected the Shenyang–Haikou Expressway, Airport Expressway, or Mawei. All participants assigned to Pushang Bridge selected the Third Ring Expressway (Wanbian). Among the five participants assigned to Qi’an Road, four selected the Third Ring Expressway (Wanbian), whereas one selected the Second Ring Expressway and was classified as incorrect. Overall, 24 of the 25 participants made an acceptable route-information choice, corresponding to an accuracy rate of 96% (24 of 25 participants).
Because the test evaluated only the optimized sign design and did not include the original design as a concurrent control or a pre–post comparison, the result indicates the comprehensibility and preliminary applicability of the proposed information scheme under the screen-based test conditions. It should not be interpreted as causal evidence that the optimized design improved route-choice performance relative to the original signs.
4. Discussion
4.1. Human-Factors Interpretation of Information Hierarchy and Continuity
The field results indicate that drivers treated guide signs as a sequential information source rather than as isolated panels. Visual search was primarily target driven: drivers first examined high-priority panel regions, particularly the upper-left area, and focused mainly on place names and directional arrows. When the expected information was absent, fixations became more dispersed and remained concentrated on the sign area, leaving less visual attention available for roadway monitoring.
Control-point information appeared to support route inference when the exact destination was not displayed. Drivers showed similar speed-response patterns under signs containing destination information and signs containing usable control-point information, whereas signs containing neither type of information were associated with stronger physiological responses and continued deceleration. Although these comparisons are exploratory because the original analysis did not model repeated observations within participants, the pattern suggests that route-relevant control points can partially substitute for destination names in complex road networks.
Information continuity should therefore be considered at the sequence level. A guide sign may be clearly visible and understandable when examined independently, yet still create uncertainty if previously established destination or control-point information disappears before a required maneuver. The observed increases in sign-area fixation and pupil diameter following such interruptions indicate that guide-sign performance depends not only on the readability of individual panels but also on the stability of route information across successive interchanges.
4.2. Implications for Character Height and Installation Position
The simulation results showed that effective viewing distance increased with character height across the three traffic background conditions. Within the tested range of 55–75 cm, the 55 cm characters did not consistently provide the estimated minimum viewing distance required at a design speed of 120 km/h, whereas the 65 and 75 cm conditions exceeded this requirement. Accordingly, 65 cm may be regarded as a practical minimum under conditions similar to those tested, while 75 cm provides a larger visibility margin. This recommendation should not be extrapolated beyond the tested character-height range or directly treated as a universal design standard.
Installation position also affected visual accessibility. Median-side signs were generally fixated earlier and were less susceptible to occlusion by large vehicles than roadside signs. Dual-side placement provided visual redundancy, but identical information displayed on both sides divided attention between the two panels. Therefore, median-side or dual-side placement may be considered where surrounding-vehicle interference is substantial, whereas roadside placement may remain suitable under less obstructed conditions.
These findings suggest that character height and installation position should be selected jointly rather than independently. Increasing character height can extend the available viewing distance, while median-side or dual-side placement can reduce the risk of vehicle occlusion. However, because the low-, medium-, and high-traffic backgrounds were ordinal simulation scenarios rather than verified traffic-flow thresholds, the findings support qualitative design guidance rather than precise traffic-volume-based criteria.
4.3. Design Application at Xiuzhai Interchange
Xiuzhai Interchange connects the Fuzhou link of the Fuquan Expressway with the Third Ring Expressway, Linpu Road, and the Second Ring Expressway, forming a transition between expressway and urban road systems. The diagnosis of the existing southeast-entrance signs showed that the local control-point structure was not adequately represented, with a control-point information coverage of only 57.14%. In addition, some less relevant long-distance information, pinyin, and secondary items occupied limited panel space and weakened the hierarchy of route-decision information.
The optimization scheme therefore reorganized the guide information according to route relevance and visual priority. The Third Ring Expressway, Second Ring Expressway, Gushan Bridge, and Shenyang–Haikou Expressway were treated as principal control points, while Wanbian, Cangshan, the Eastern Office District, and airport-related destinations were assigned secondary roles. The 1 km, 500 m, and exit signs were redesigned, an additional 2 km advance sign was proposed, and important information was placed in visually preferred panel regions. Overhead installation and the removal of distracting roadside billboards were also proposed to improve visibility and reduce environmental interference.
The screen-based route-choice comprehension test showed that 24 of the 25 participants selected acceptable route information for their assigned destinations. This result indicates that the reorganized control-point hierarchy was generally understandable under the dynamic presentation conditions. The single incorrect response, in which the Second Ring Expressway was interpreted as the final destination rather than an intermediate control point, also shows that the distinction between control points and final destinations should be made more explicit. Because the test included only the optimized design and no original-design control condition, the 96% accuracy rate supports the comprehensibility and preliminary applicability of the scheme but does not establish a causal improvement over the existing signs.
4.4. Limitations and Future Research
Several limitations should be considered when interpreting the findings. First, the on-road field experiment included only ten male drivers aged 20–35 years. In addition, the 119 sign-reading episodes contained repeated observations from the same participants, while the original statistical analysis did not explicitly account for within-participant correlation. The corresponding physiological comparisons should therefore be regarded as exploratory.
Second, the retained simulation records did not permit complete reconstruction of participant–scenario allocation, condition order, or randomization procedures. The low-, medium-, and high-traffic backgrounds were consequently treated as ordinal simulation scenarios rather than verified traffic-flow levels. The character-height relationship and installation-position findings should be interpreted within the tested scenarios and should not be directly converted into universal design thresholds.
Third, the Xiuzhai Interchange test used dynamic screen presentation of only the optimized sign scheme. Because no original-design control condition or pre–post comparison was included, the observed 96% accuracy rate reflects the comprehensibility of the proposed information scheme under the test conditions rather than a causal improvement over the existing signs.
Future studies should recruit larger and more diverse driver samples, adopt clearly documented repeated-measures or factorial designs, and use statistical models that account for participant-level clustering. Field evaluations comparing existing and optimized sign schemes under matched conditions are also needed to examine whether the proposed measures improve route-choice performance, reduce workload, and support safer driving in different interchange environments.
5. Conclusions
This study developed a human-centered approach for improving expressway interchange guide signs in complex road networks by integrating on-road observation, driving simulation, eye-movement measures, physiological responses, and driving behavior. The results indicate that drivers’ visual search is strongly guided by route-relevant place names and directional arrows, with initial attention frequently directed toward the upper-left region of the sign panel. When neither the destination nor usable control-point information was available, drivers showed more dispersed visual search and more sustained deceleration. Interruptions in destination information continuity also increased sign-search activity and reduced attention to the roadway. These findings support treating successive guide signs as a coordinated information system rather than as isolated panels.
Within the tested simulation conditions, effective viewing distance increased with character height. At a design speed of 120 km/h, 65 cm was the lowest tested character height that exceeded the estimated minimum viewing-distance requirement, while 75 cm provided a larger visibility margin. Median-side signs were generally detected earlier and were less susceptible to large-vehicle occlusion than roadside signs. Dual-side placement provided additional visual redundancy but could also divide attention between two panels. Character height and installation position should therefore be selected jointly according to visibility, occlusion risk, information load, and interchange complexity.
The design principles were applied to the information organization and panel layout of Xiuzhai Interchange. In the subsequent dynamic screen-based route-choice test, 24 of 25 participants selected route information consistent with the predefined criteria, corresponding to an accuracy rate of 96%. This result supports the comprehensibility and preliminary applicability of the proposed scheme under the tested conditions. Because the test did not include the original sign design as a control, it should not be interpreted as causal evidence of improvement. Overall, guide-sign optimization in complex road networks should jointly consider control-point hierarchy, information continuity, panel layout, character height, and installation position to support timely route decisions and reduce unnecessary driver workload.