Article

Micro Breakage-Induced Contact Network Evolution and Performance Degradation of Graded Aggregates Under Cyclic Loading

1
Department of Civil Engineering, Shijiazhuang Tiedao University, Shijiazhuang 050043, China
2
School of Safety Engineering and Emergency Management, Shijiazhuang Tiedao University, Shijiazhuang 050043, China
3
Institute of Intelligent Manufacturing and Smart Transportation, Suzhou City University, Suzhou 215104, China
*
Author to whom correspondence should be addressed.
Infrastructures 2026, 11(8), 264; https://doi.org/10.3390/infrastructures11080264
Submission received: 16 June 2026 / Revised: 16 July 2026 / Accepted: 24 July 2026 / Published: 30 July 2026
(This article belongs to the Section Infrastructures Materials and Constructions)

Abstract

Graded aggregates used in high-speed railway subgrades often undergo micro breakage (i.e., corner and edge spalling) under cyclic loading, whereas the mechanism linking local particle spalling to contact-network evolution and permanent deformation remains unclear. To address the lack of a physically based micro breakage criterion and a continuous local shape-updating scheme in existing DEM approaches, this study proposes an energy-driven micro breakage method. The method uses the relationship between contact elastic energy and fracture energy for newly created free surfaces as the breakage criterion. It also employs a radial function representation to simulate local particle shape evolution. The proposed method is subsequently validated through multilevel tests and shows reasonable agreement with the experimental results for particle micro breakage and the associated mechanical responses. Furthermore, dynamic triaxial simulation results show that micro breakage exhibits a distinct cumulative characteristic and increases with loading frequency and amplitude. Meanwhile, micro breakage drives particle rearrangement and new contact formation, leading to skeleton densification and weakening of the strong force-chain network, which in turn accelerates plastic deformation accumulation. These coupled processes constitute an important mechanism governing the progressive degradation of graded aggregates under cyclic loading. This study clarifies the associated particle-scale mechanism and provides a reference for performance optimization.

1. Introduction

Graded aggregates are widely used in load-bearing structures subjected to cyclic loading, such as high-speed railway subgrades and road bases [1,2,3]. The long-term service condition of these materials is directly related to the stability and durability of engineering structures. However, under long-term cyclic loading, graded aggregates often undergo micro breakage, mainly in the form of corner and edge spalling [4,5,6,7]. In contrast to overall breakage, micro breakage is difficult to detect and develops cumulatively, with its effects becoming progressively apparent during service. Existing research has shown that micro breakage can induce particle rounding and weaken interparticle interlocking, thereby altering the aggregate skeleton and affecting material behavior [8,9,10]. Hence, it is necessary to systematically reveal the evolution of micro breakage in graded aggregates under cyclic loading and the underlying mechanisms, so as to provide a basis for evaluating long-term service behavior of high-speed railway subgrades.
Particle breakage significantly affects the performance of granular materials and remains a central topic in this field. It is generally classified into overall breakage and micro breakage [11,12,13]. In overall breakage, particle size and assembly gradation are significantly affected, and the resulting changes can usually be directly identified by sieve analysis [14,15,16]. In contrast, micro breakage mainly involves local shape change and fine generation, and therefore often requires more refined observation techniques [17,18]. For example, Wang et al. [19], Xiao et al. [20], and Xie et al. [21] quantified particle shape at different loading or abrasion stages using X-ray CT scanning and three-dimensional reconstruction. The results show that particle roundness gradually increases with loading time, whereas the aspect ratio and particle size change insignificantly. Nevertheless, particle shape can usually only be obtained at discrete stages through costly methods in such research. It is difficult to simultaneously obtain other mesoscopic indicators during the micro breakage. By comparison, the discrete element method (DEM) shows significant advantages in characterizing contact states, force chain structures, and anisotropic evolution, and is therefore widely used to investigate mesoscopic mechanisms in granular materials [22,23,24]. Aela et al. [25] systematically reviewed DEM applications to railway ballast, including contact mechanics, particle-shape representation, particle breakage and abrasion, and coupled numerical approaches. Ngo et al. [26] combined impact tests with a coupled discrete–continuum model to investigate ballast deformation and breakage, contact-force distributions, coordination number, and energy evolution under impact loading. These studies demonstrate the capability of DEM to reveal particle-scale mechanisms underlying ballast performance. Nevertheless, there are still clear limitations in existing numerical methods for micro breakage. As a result, previous studies have relied on comparative simulations using particle shapes obtained from experiments, and the effect of micro breakage on material response is only analyzed indirectly [27,28,29]. This poses a challenge for investigating the continuous micro breakage of graded aggregates and the induced mesoscopic evolution. Hence, it is necessary to propose a numerical method that can accurately characterize micro breakage.
It is critical for particle breakage simulation to establish an appropriate breakage criterion and the corresponding breakage-path representation [30,31]. Existing particle-breakage simulation methods mainly include the particle bonding method (PBM) [32,33], the fragment replacement method (FRM) [34,35], and empirical methods [36,37]. Among them, PBM and FRM are widely used in overall breakage simulations, with breakage criteria supported by a relatively clear physical basis. Nevertheless, there are still limitations in local-shape resolution of PBM and FRM for micro breakage simulation. By contrast, empirical methods are computationally efficient in representing micro breakage, whereas the corresponding breakage criteria lack a clear physical basis. It is necessary to develop a DEM-based method for simulating micro breakage, with emphasis on a physically meaningful breakage criterion and efficient shape representation of the breakage path. In terms of the breakage criterion, the energy criterion can establish a link between energy evolution and cumulative characteristics under cyclic loading [38,39]. In terms of shape representation, the method based on Ball elements combined with rolling-resistant contact is computationally efficient, while the ability to represent local shape details remains limited [40,41,42,43]. Moreover, the spherical harmonic DEM method provides a new way for high-accuracy representation of irregular particle geometry [44,45,46]. Hence, the combination of the energy criterion, Ball elements, contact correction, and spherical harmonic representation provides a feasible method for continuous simulation of micro breakage in graded aggregates.
To address the above issues, an energy-driven micro breakage method is proposed. In this method, the relationship between contact elastic energy and the fracture energy associated with newly created free surfaces is used as the breakage criterion. Meanwhile, Ball elements with contact correction capability are introduced into the spherical harmonic DEM framework. The Ball elements are used to carry particle kinematics, while a surface radial function is adopted to represent particle shape. The accuracy of the proposed method is validated at multiple levels through single-particle tests, Los Angeles abrasion tests, and cyclic loading tests. Furthermore, dynamic triaxial simulations are further conducted to investigate the mesoscopic evolution and performance degradation induced by micro breakage in graded aggregates. This study contributes to establishing a physically based and computationally efficient framework for micro breakage simulation and provides a reference for understanding and mitigating the progressive degradation of graded aggregates under cyclic loading.

2. Energy-Driven Micro Breakage Method

2.1. Energy-Based Criterion

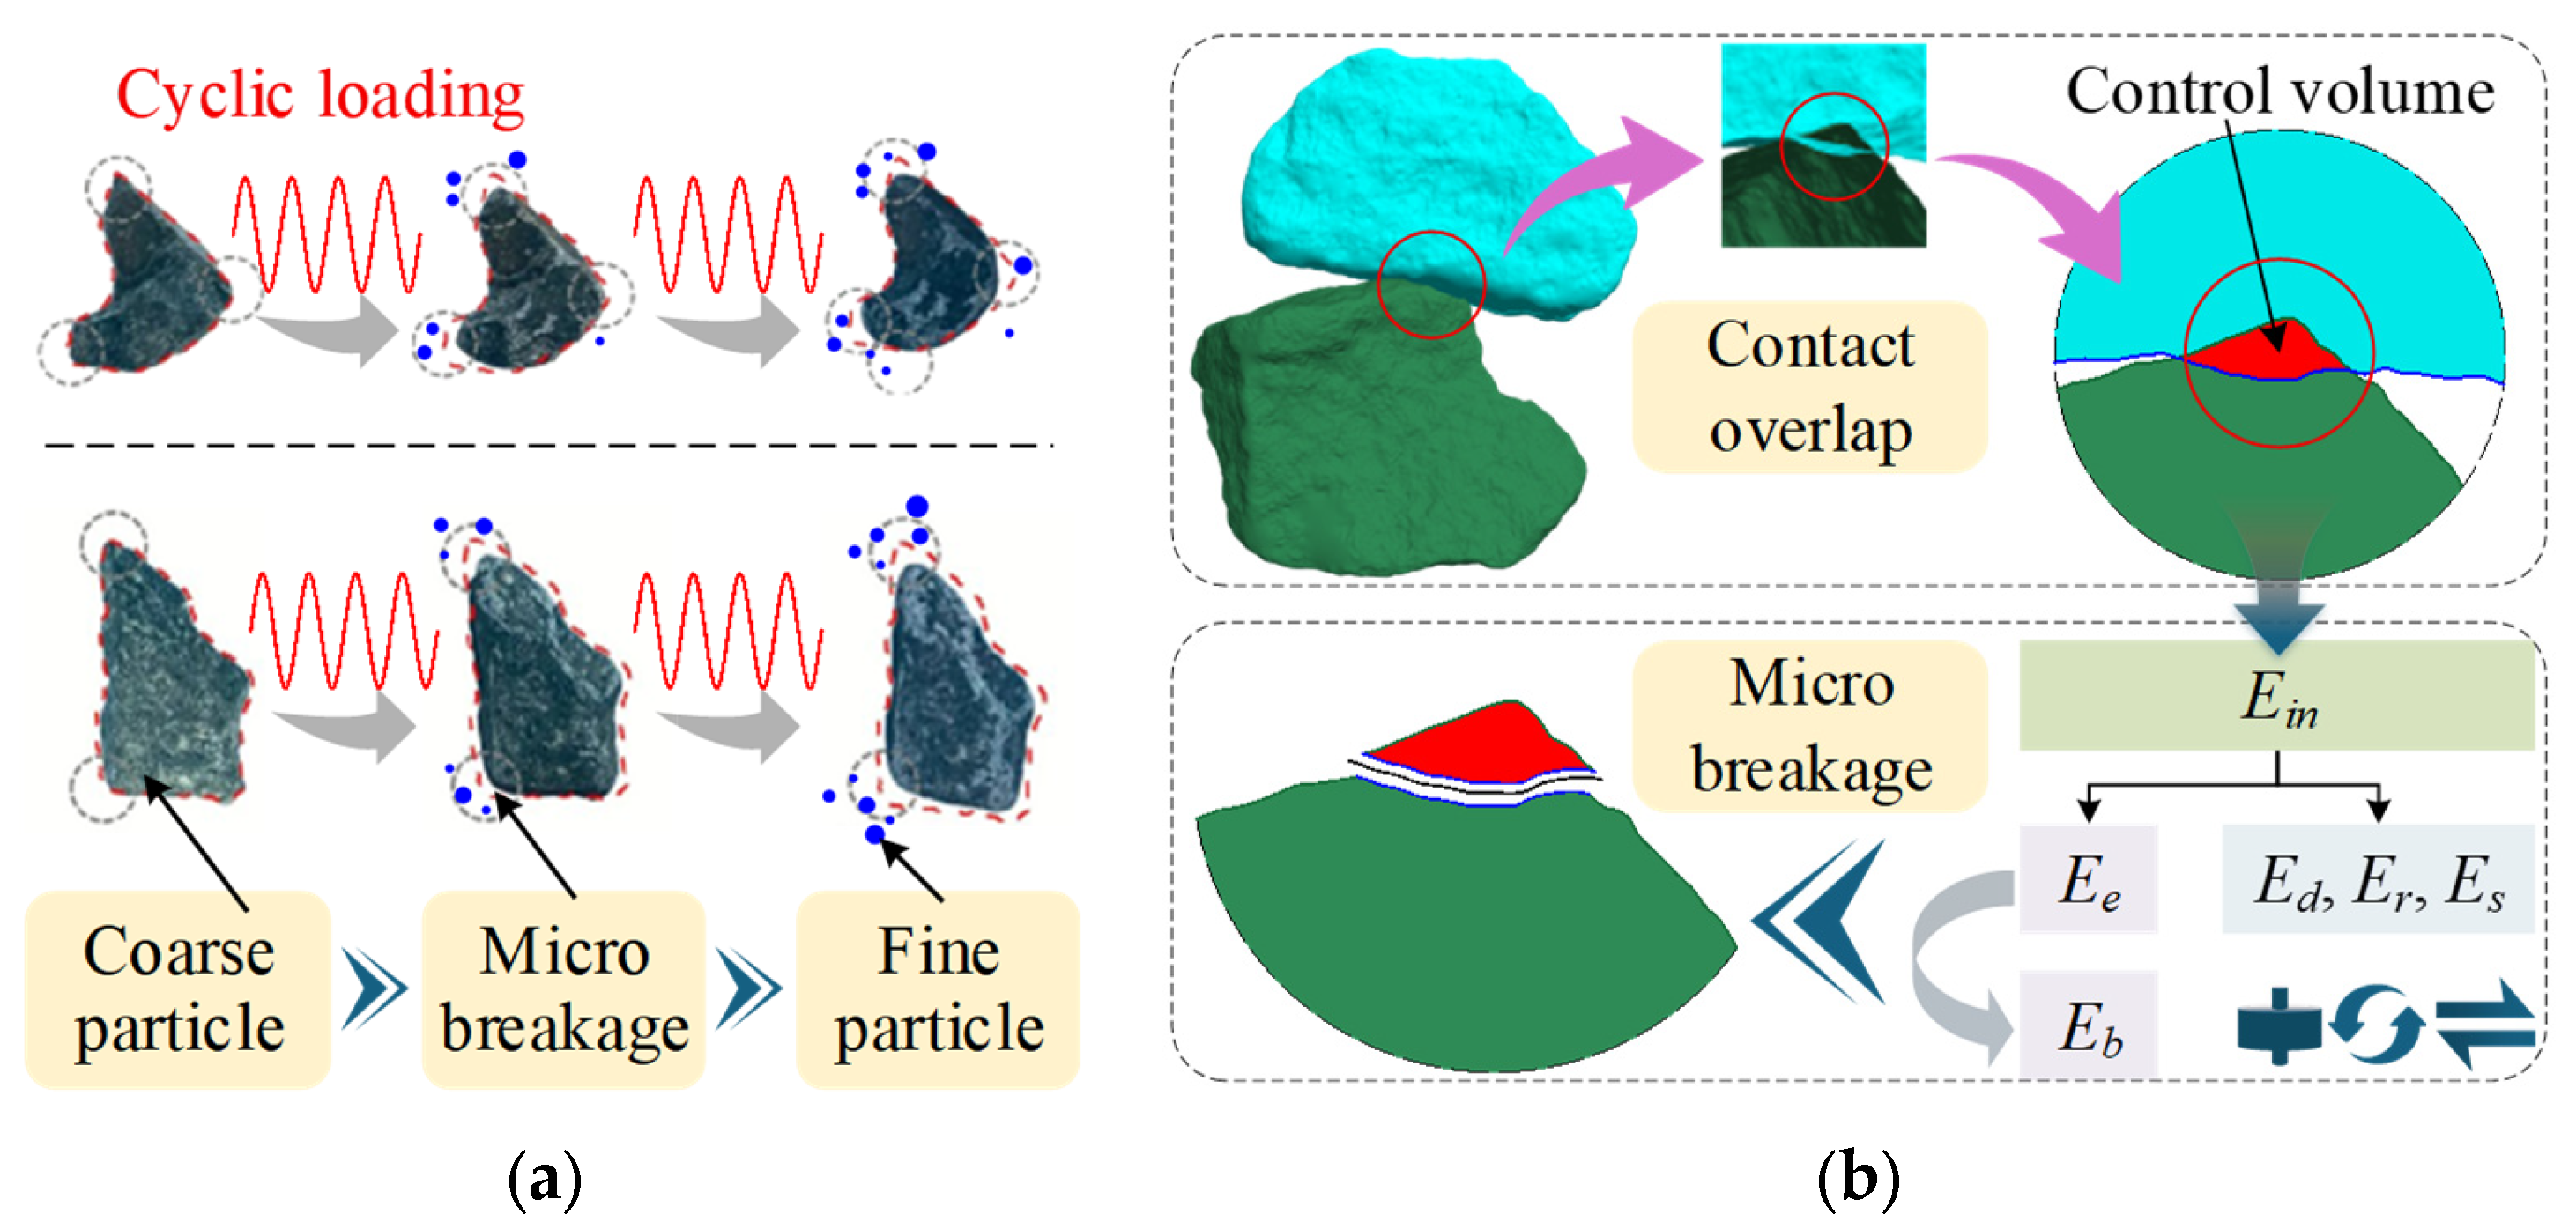
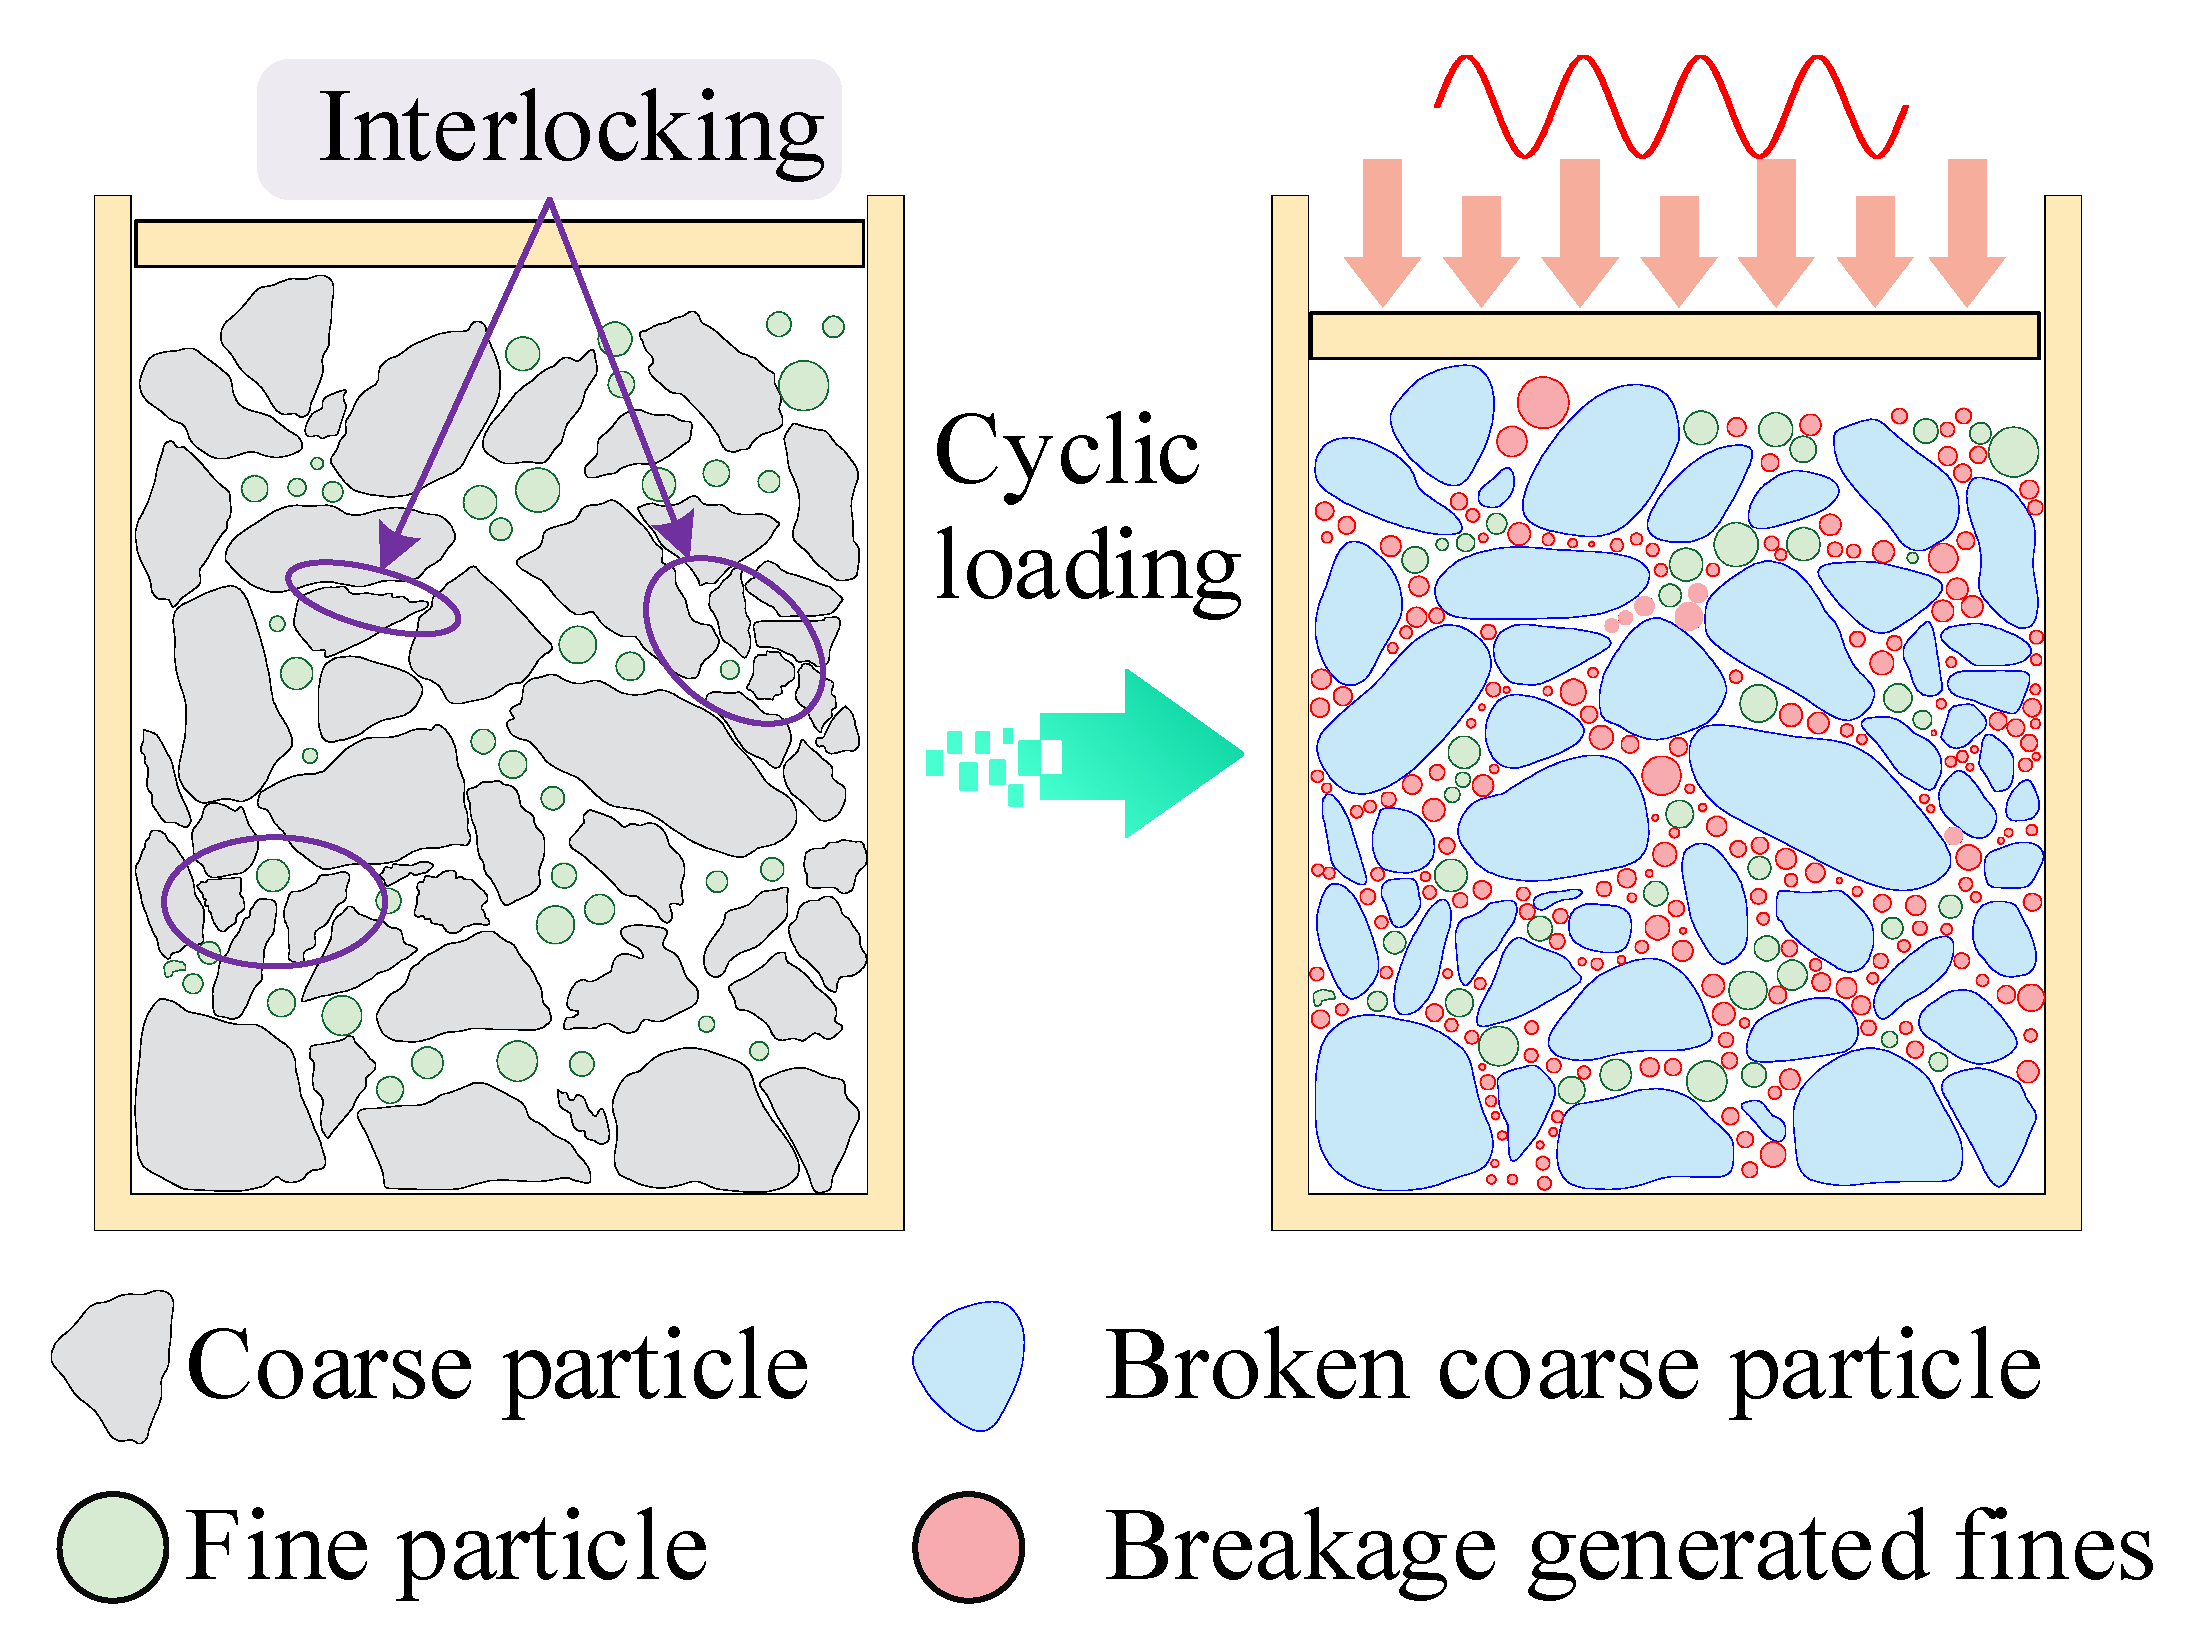
As shown in Figure 1a, graded aggregates are susceptible to micro breakage under long-term cyclic loading at low stress. This process is mainly characterized by local spalling at high-curvature regions (i.e., corners and edges), together with the generation of fine particles [4,8,9,10]. It should be noted that the performance of graded aggregates is progressively degraded by continuous micro breakage. Nevertheless, there is still a lack of a physically meaningful criterion for micro breakage in the existing discrete element method (DEM). It is difficult to investigate the mesoscopic evolution and performance degradation of graded aggregates induced by micro breakage under cyclic loading.
To address this issue, an energy criterion for micro breakage is established based on the first law of continuum mechanics [47]. Firstly, under the assumptions of small deformation and negligible heat exchange, the energy balance of an arbitrary control volume V ⸦ Ω (boundary ∂V, outward unit normal n) can be expressed by Equation (1).
E ext = E int + E kin + E d
where Eext is the work done by external forces, Eint is the change in internal energy, Ekin is the change in kinetic energy, and Ed is the irreversible energy dissipation (e.g., sliding, rolling, damping, and breakage).
Secondly, the basic units in DEM are assumed to be non-deformable rigid bodies, and particle deformation is equivalently represented by contact overlaps. As shown in Figure 1b, the overlap volume corresponding to the contact overlap region is defined as the control volume Vi. It should be noted that this control volume is an equivalent representation of the local high-energy region near the contact, rather than the actual fragment volume generated by particle micro breakage. This assumption is consistent with laboratory observations showing that micro breakage of graded aggregates under repeated loading mainly occurs as local spalling and abrasion at particle corners and edges [20,48]. Then, Vi is treated as a continuum, where ∂Vi is the intersection boundary of the contacting particles and n is the contact direction. Based on this, the energy balance of Vi in conventional DEM is expressed by Equation (2), in which Eext is mainly converted into Ee and Ed, and Ed includes sliding Es, rolling Er, and damping dissipation Edamp. It should be noted that an explicit breakage energy term is absent in conventional DEM. Meanwhile, Es, Er, and Ed are mainly dissipated continuously, whereas Ee continues to accumulate with increasing contact overlap. Hence, the energy available for micro breakage is mainly stored in the contact region as Ee.
E ext = E e + E d , Conventional DEM E ext = E e + E d + E b , This study
where Ee is the elastic energy, uniquely determined by the elastic state variables at the contact, Ed is the irreversible dissipated energy, and Eb is the micro breakage energy.
Thirdly, it is crucial for the characterization of micro breakage to separate Eb from Ee in a physically meaningful manner. The Griffith energy criterion in linear elastic fracture mechanics states that crack propagation and the formation of newly created free surfaces require the corresponding fracture energy [49]. In DEM, micro breakage is equivalently represented as local spalling associated with the contact overlap region. Accordingly, the newly created free surface Ai is approximated by the geometric boundary of the overlap region. Based on this, Eb is expressed by Equation (3).
E b = G c A i
where Gc is the breakage energy per unit area (critical energy release rate).
Finally, the micro breakage criterion is defined by comparing the relative magnitudes of Ee and Eb. It should be noted that the comparison between Ee and Eb at a given instant is essentially an instantaneous criterion. Micro breakage occurs only when the elastic energy associated with a single contact event exceeds the corresponding breakage energy. Nevertheless, micro breakage in graded aggregates under long-term cyclic loading exhibits a cumulative character. When the instantaneous breakage conditions remain unmet, local damage can accumulate progressively during repeated loading-unloading cycles and eventually lead to breakage. Furthermore, a cumulative breakage factor is introduced to characterize the cumulative evolution of micro breakage under long-term cyclic loading, as expressed in Equation (4). Accordingly, two breakage modes are considered, namely the cumulative mode (model I) and the instantaneous mode (model II). The micro breakage is described using Equation (5). After each micro breakage event, is updated according to the corresponding breakage mode, thereby ensuring the continuity and progressive nature of micro breakage [Equation (6)].
l Δ t + 1 = l Δ t + max 0 , E e , Δ t + 1 E e , Δ t G c A i
Breaking = True , l n + 1 > 1 model I True , E e > E b model II False , otherwise
l = l 1 , model I 0 , model II l   , otherwise
where Δt + 1 and Δt are the current and previous time steps, respectively.

2.2. Shape Representation and Update Strategy

It is critical to accurately calculate Ee and Ai in the contact region for characterizing micro breakage within the proposed energy criterion. Nevertheless, geometric approximations such as bonded sub-particle representations or discretized boundaries are mostly adopted in existing approaches for simulating irregular particles [50,51,52]. As a result, it is difficult to accurately represent high-curvature regions such as corners and edges, which poses a challenge to the accurate determination of Ai. Hence, a high-resolution representation method for irregular particles is proposed to ensure compatibility with the energy criterion.
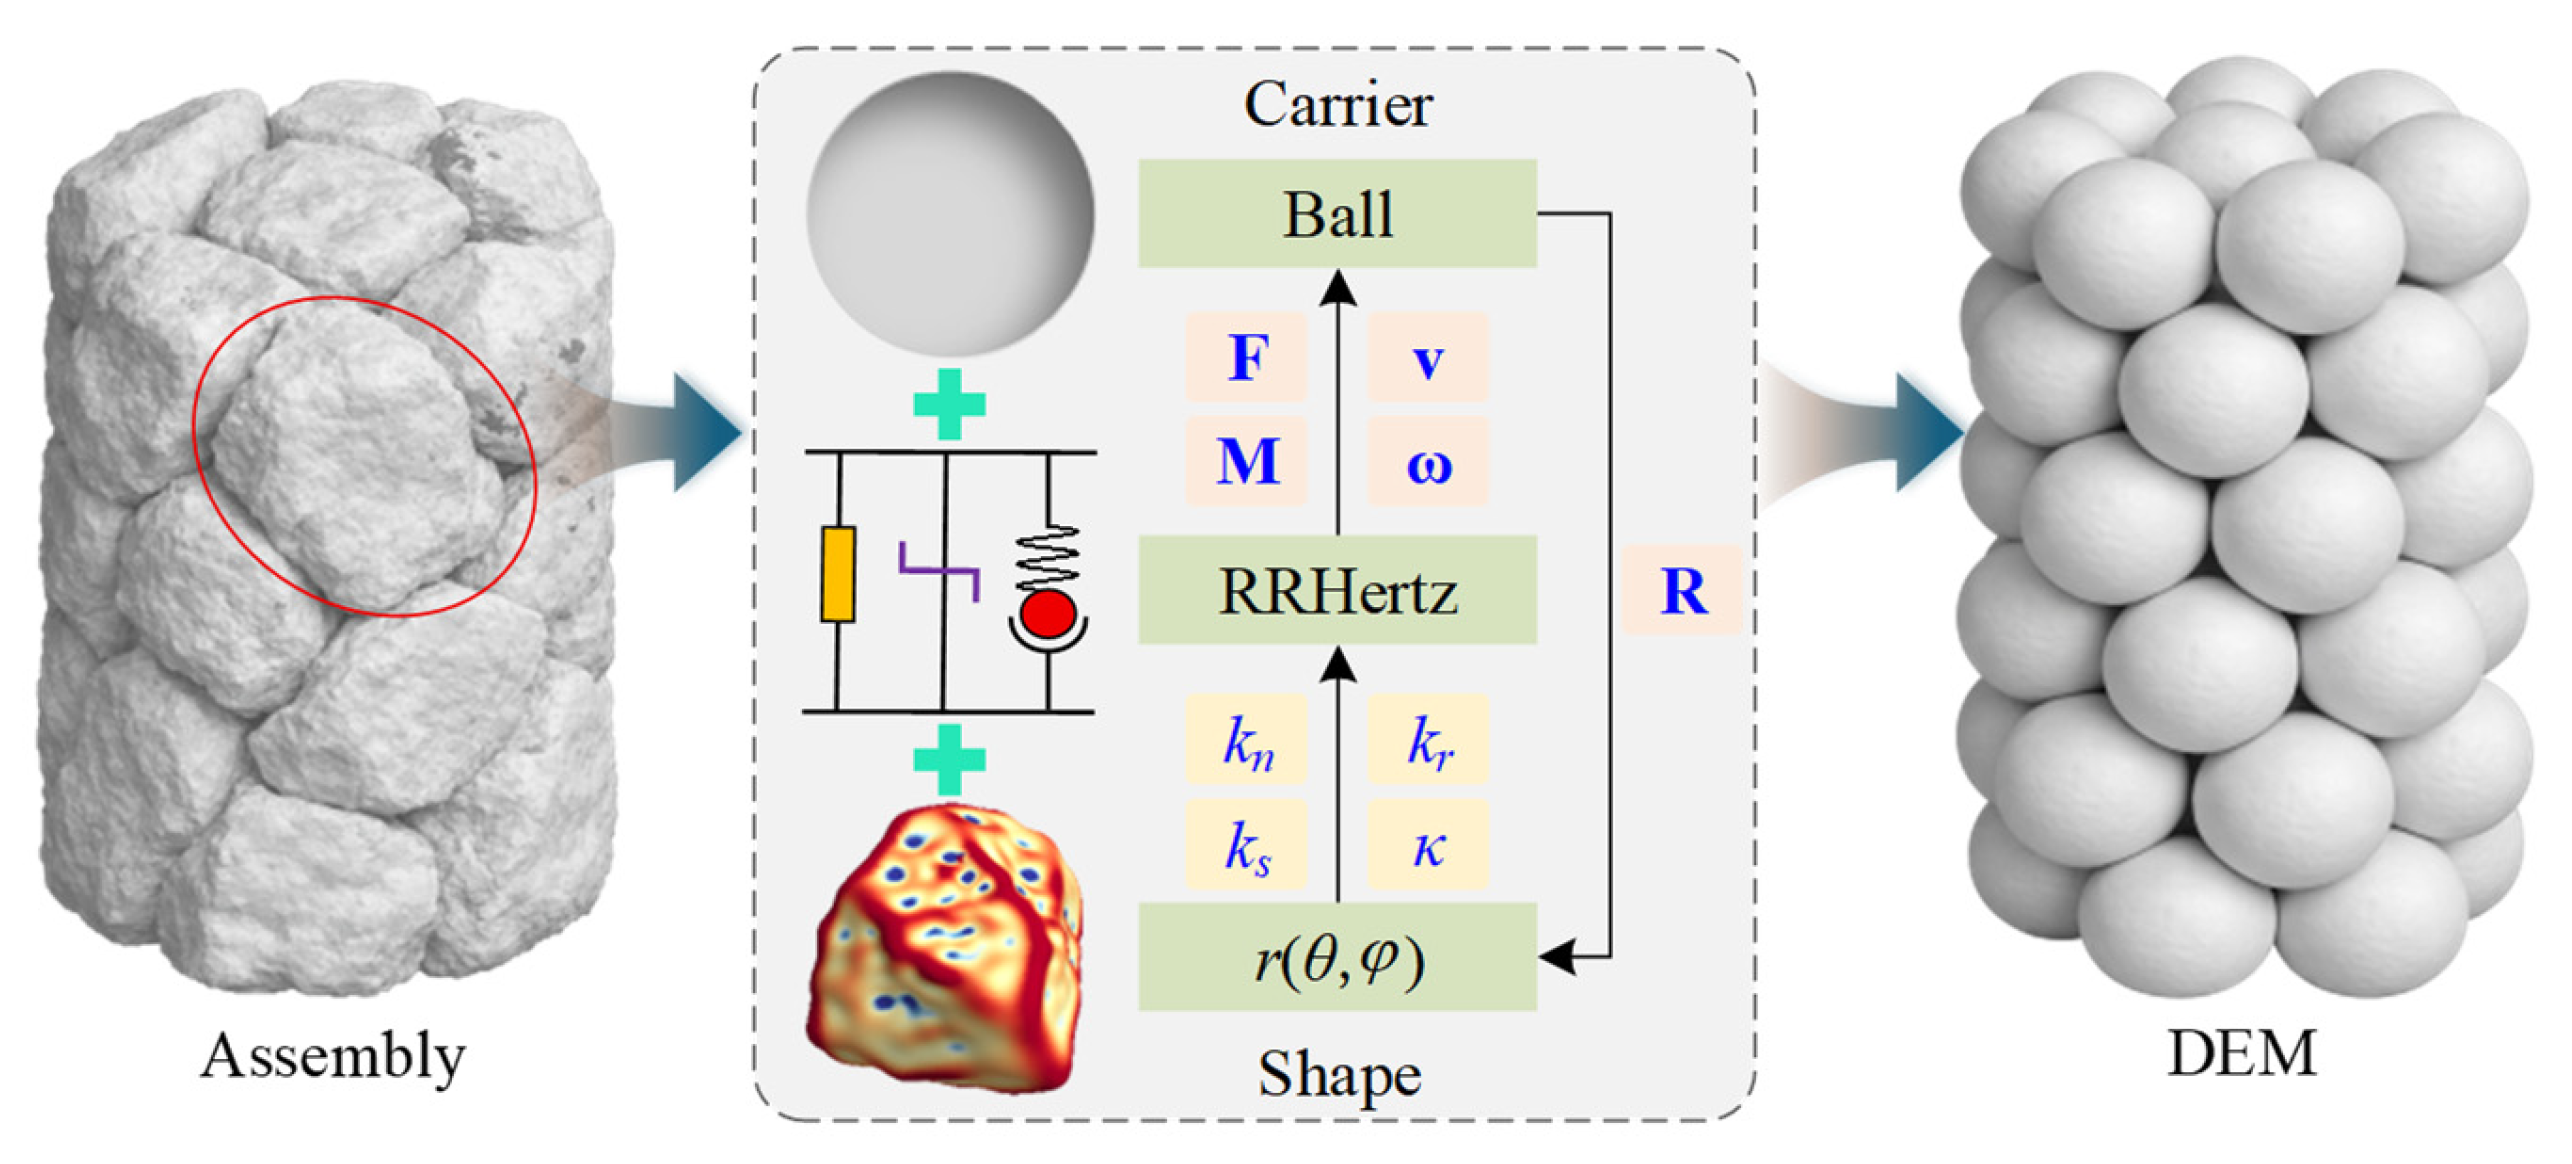
As shown in Figure 2, irregular particles in the assembly are represented by the Ball kinematic carrier, the shape radial function r(θ, φ) [Equation (7)], and the rolling-resistant Hertz (RRHertz) contact model. Notably, the motion of the Ball is updated according to the Newton-Euler equations. The RRHertz contact model is developed from the Hertz contact model by incorporating a rolling-resistance component, and the detailed formulation is given in Refs. [41,53,54,55]. When particles come into contact, the contact curvature κ is obtained from r(θ, φ) and then used to correct the stiffness coefficient k in the RRHertz model [Equations (8)–(10)]. This further affects the contact force F and moment M between particles, and consequently the translational velocity v and angular velocity ω of each particle. Meanwhile, the contact-point direction in r(θ, φ) is determined by the Ball orientation through the rotation matrix R.
r θ , φ = n = 0 N s m = n n a n m Y n m θ , φ , θ 0 , π and φ 0 , 2 π
k n = 2 π α E κ m + κ n K 3 G δ 0.5
k s = π b 2 η 1 K 2 η 2 K E e 2 1 + π b 2 η 1 K + 2 η 2 1 e 2 K E e 2 1 2
k r = k s 1 r A + 1 r B 2
where a n m is the spherical harmonic coefficient, Ns is the truncation order. Y n m (θ, φ) is the spherical harmonic basis function, the detailed formulation can be found in Ref. [46]. G is the equivalent shear modulus, α is the aspect ratio of the contact ellipse, δ is the normal overlap, κm and κn are the relative curvatures at the contact, K and E are the complete elliptic integrals of the first and second kinds, respectively, as functions of the contact ellipse eccentricity e. η1 and η2 are the combined compliance coefficients associated with the shear moduli and Poisson’s ratios of the two contacting particles, corresponding to the isotropic and directional terms in Mindlin’s full-stick solution, respectively. rA and rB are the radii of the two particles at the contact ends, respectively.
Additionally, the identification of corner and edge regions on particles is a prerequisite for the applicability of the energy-driven micro breakage criterion. It can be observed that corners and edges generally correspond to relatively large local curvature. Hence, the curvature is used to determine whether the contact point is in a corner or edge region. Specifically, a quadratic surface is fitted to the local surface in the neighborhood of the contact point [Equation (11)], and the maximum κmax and minimum κmin principal curvatures are calculated from the second derivatives of the fitted surface [56,57], as shown in Equations (12) and (13).
z = f x , y a + b x x 0 + c y y 0 + d x x 0 y y 0 + e x x 0 2 + h y y 0 2
H x 0 , y 0 = f x x x 0 , y 0 f x y x 0 , y 0 f y x x 0 , y 0 f y y x 0 , y 0
κ max , κ min = eig H
where a, b, c, d, e and h are the coefficients obtained by least-squares fitting, eig(·) is the operator that computes the eigenvalues of a matrix.
Existing research shows that κmax exhibits higher sensitivity than κmin to geometric discontinuities such as corners and edges [58]. The curvature function g(κ) is further defined in Equation (14). When g(κ) = 1, the contact point is identified as being in a corner or edge region.
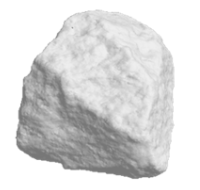
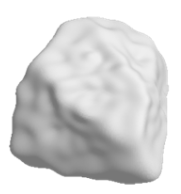
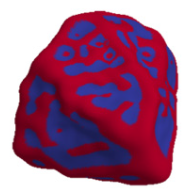
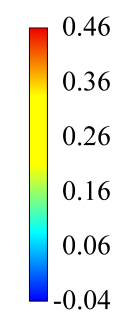
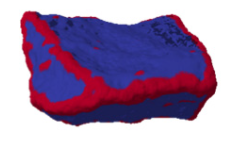
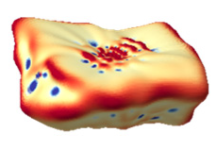
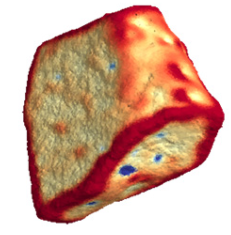
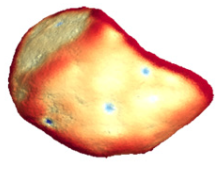
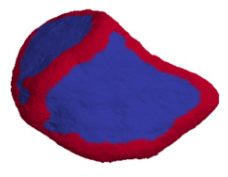
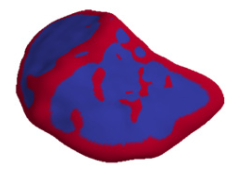
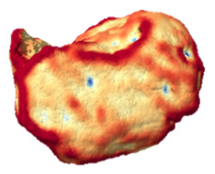
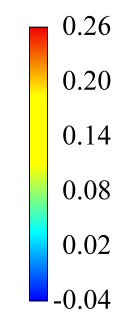
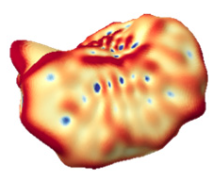
Table 1 presents the κmax distribution and the identified corner and edge regions on both the real shape and r(θ, φ). A close agreement is observed between the two results, indicating that the adopted method accurately captures the corner and edge features of the particle.
g κ = 1 , κ max 1 < r ins 0 , κ max 1 r ins
where rins is the maximum inscribed sphere radius of the particle.
Accurate updating of local shape changes induced by micro breakage is essential for continuous simulation. The r(θ, φ) effectively captures the micro shape evolution induced by micro breakage through updates of the spherical harmonic coefficients. The specific updating procedure is described as follows.
  • Calculation of overlap-region parameters
According to the basic assumptions of Hertzian contact theory, the contact plane of irregular particles is equivalently treated as an ellipse, and Ai is calculated from the curvature at the contact point, as given in Equation (15). The overlap volume Vi of particle contact is then obtained, which corresponds to the control volume in micro breakage, as given in Equation (16).
A i = 2 π δ 1 κ max κ min
V i = 1 2 A i δ = π δ 2 1 κ max κ min
  • Calculation of a 0 0 associated with the Ball radius
After micro breakage, the updated Ball radius ri* can be obtained from Vi, as given in Equation (17). Then, according to the relation between the constant term in r(θ, φ) and the equivalent radius, a 0 0 is obtained from ri*, as given in Equation (18).
r i = r i 3 3 V i 4 π 1 3
a 0 0 = r i 4 π
  • Calculation of a n m (n ≥ 1) associated with local shape
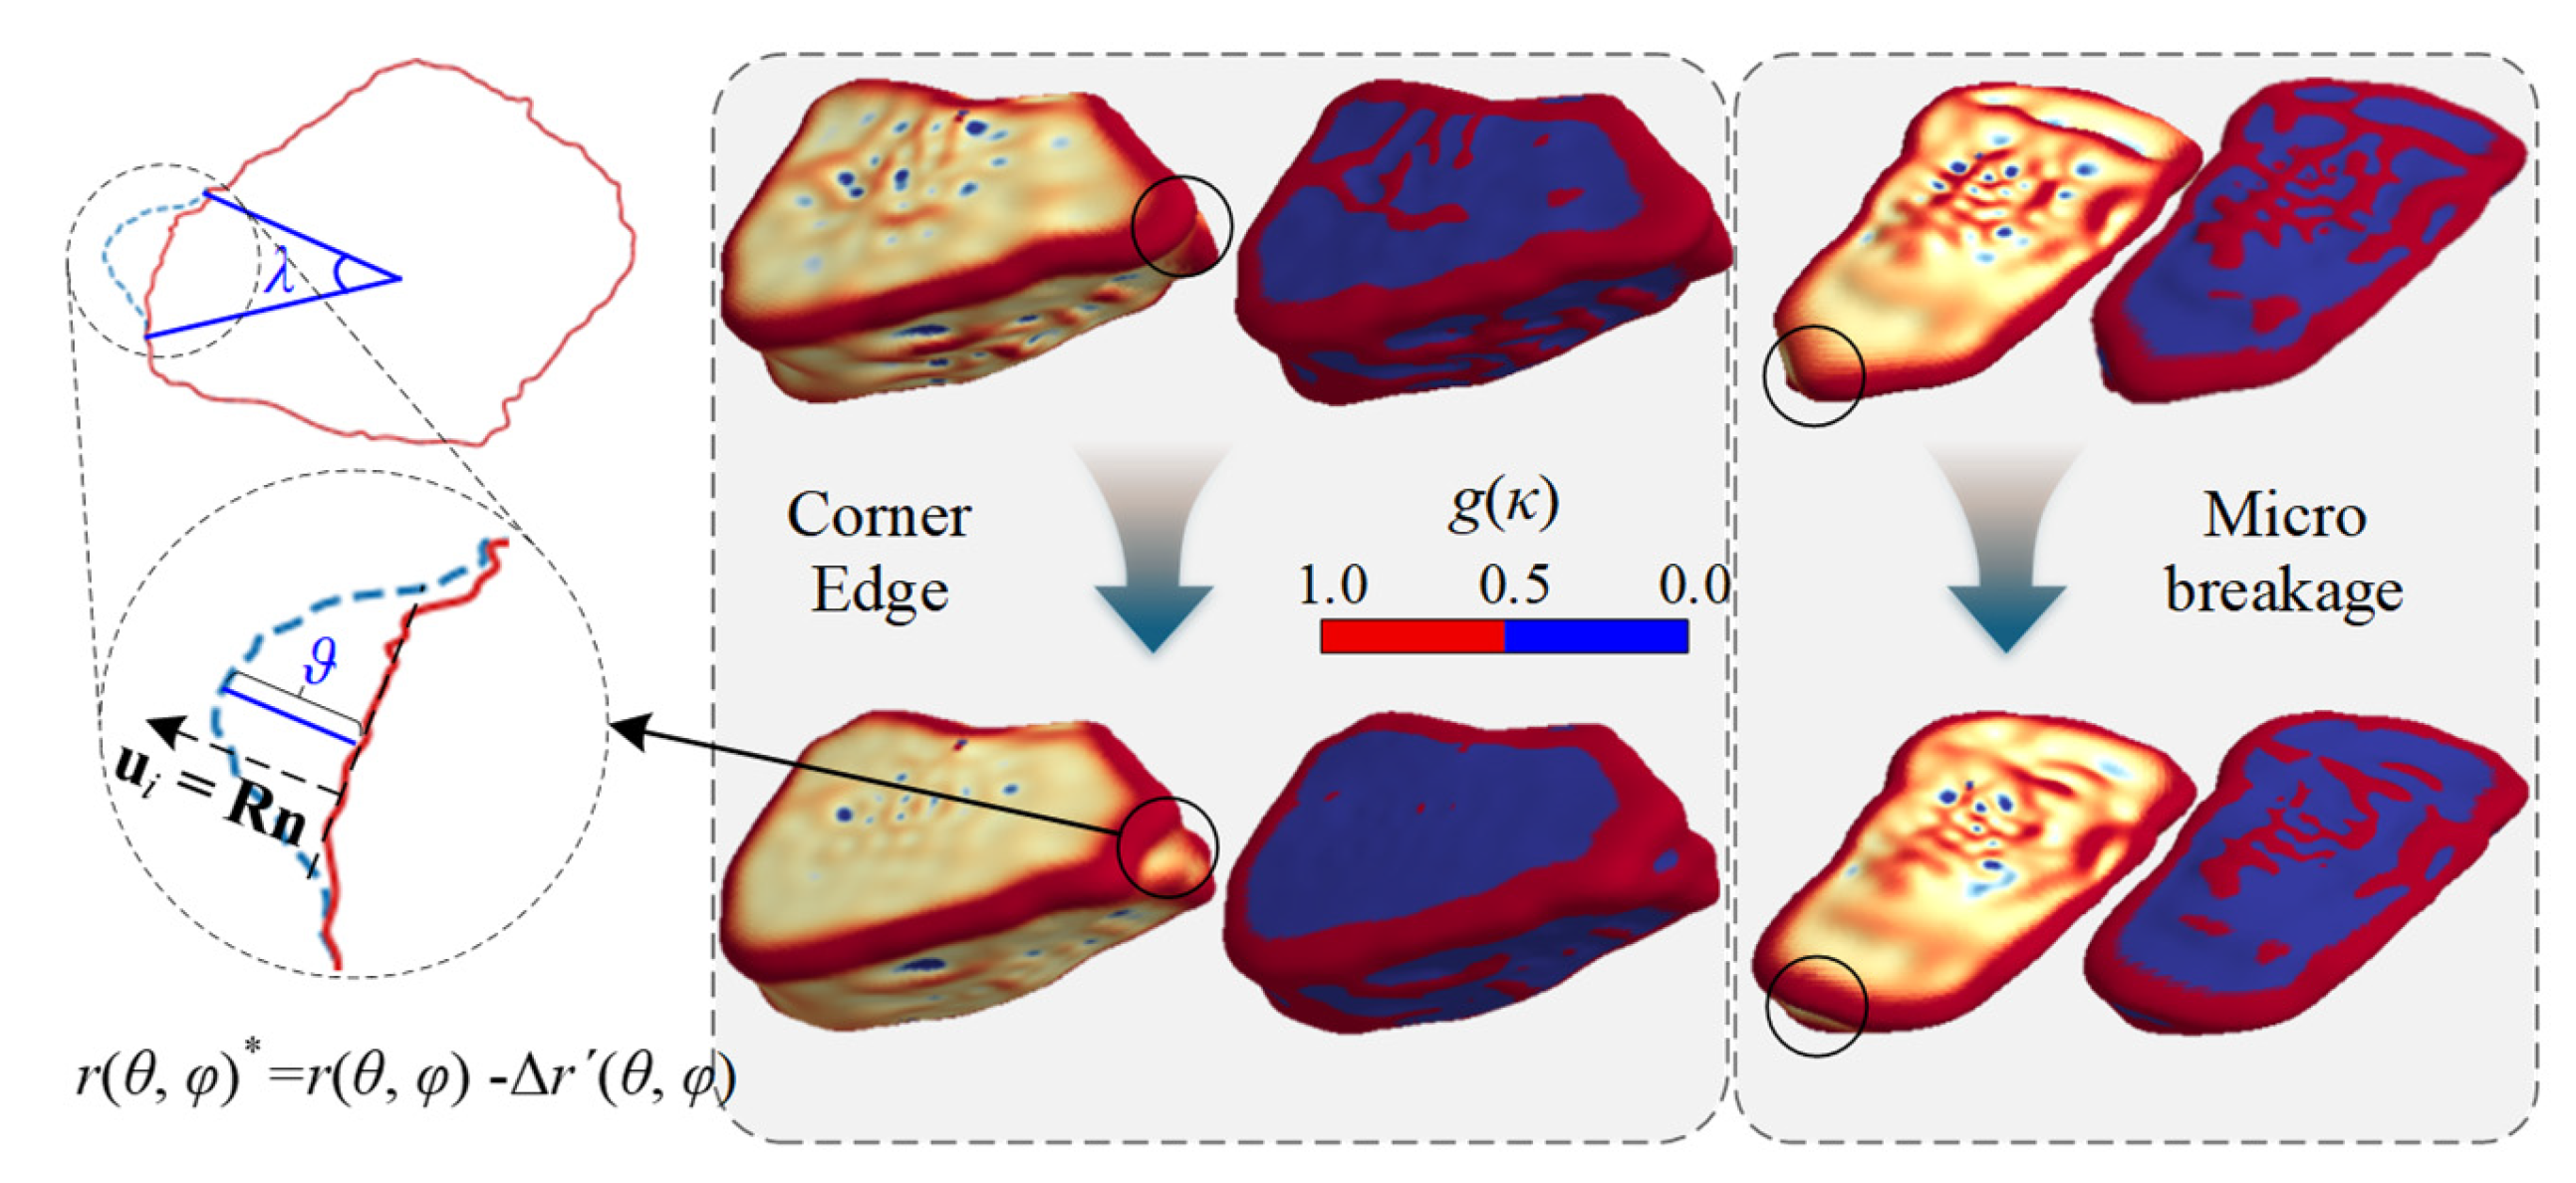
As shown in Figure 3, the contact normal n is first transformed into the particle coordinate system through the orientation matrix R. The resulting unit vector ui defines the action direction of micro breakage on the particle surface [Equation (19)].
u i = R T n
To localize the breakage effect on the spherical domain, an angular distance γ(θ, φ) is introduced between an arbitrary spherical direction and ui. This quantity is defined from the spherical unit vector s(θ, φ), as given in Equations (20) and (21).
s θ , φ = sin θ cos φ , sin θ sin φ , cos θ T
γ θ , φ = arccos u i s θ , φ
The spatial extent of breakage is then described by a Gaussian kernel K(γ) [Equation (22)]. With this kernel, the local radial loss Δr(θ, φ) is constructed in Equation (23), where λ controls the angular spread and ϑ represents the breakage depth. A smooth kernel is adopted to avoid discontinuous truncation of the surface update and to ensure numerical stability during shape evolution.
K γ θ , φ = exp γ θ , φ 2 2 λ 2
Δ r θ , φ = ϑ K γ θ , φ
where λ is the angular width parameter of K(γ), ϑ is the breakage depth.
To avoid the global scale bias caused by the nonzero spherical mean of Δr(θ, φ), a mean-removal operation is introduced. The spherical average ⟨Δr⟩ is calculated [Equation (24)], and the zero-mean correction Δr′(θ, φ) is then obtained by Equation (25).
Δ r = 1 4 π 0 2 π 0 π Δ r θ , φ sin θ d θ d φ
Δ r θ , φ = Δ r θ , φ Δ r
After that, Δr′(θ, φ) is expanded onto the spherical harmonic basis Y n m (θ, φ), yielding the coefficient increment Δ a n m (n ≥ 1) [Equation (26)]. The post-breakage coefficients a n m (n ≥ 1) are subsequently obtained through Equation (27). The projection in Equation (26) is evaluated numerically by discrete quadrature, and the corresponding implementation is provided in Appendix A.
Δ a n m = 0 2 π 0 π Δ r θ , φ Y n m θ , φ sin θ d θ d φ , n 1
a n m = a n m Δ a n m , n 1
With the updated coefficients, the post-breakage radial function r(θ, φ)* is finally reconstructed by Equation (28).
r θ , φ = r θ , φ Δ r θ , φ

3. Numerical Model

3.1. Dynamic Triaxial Setup

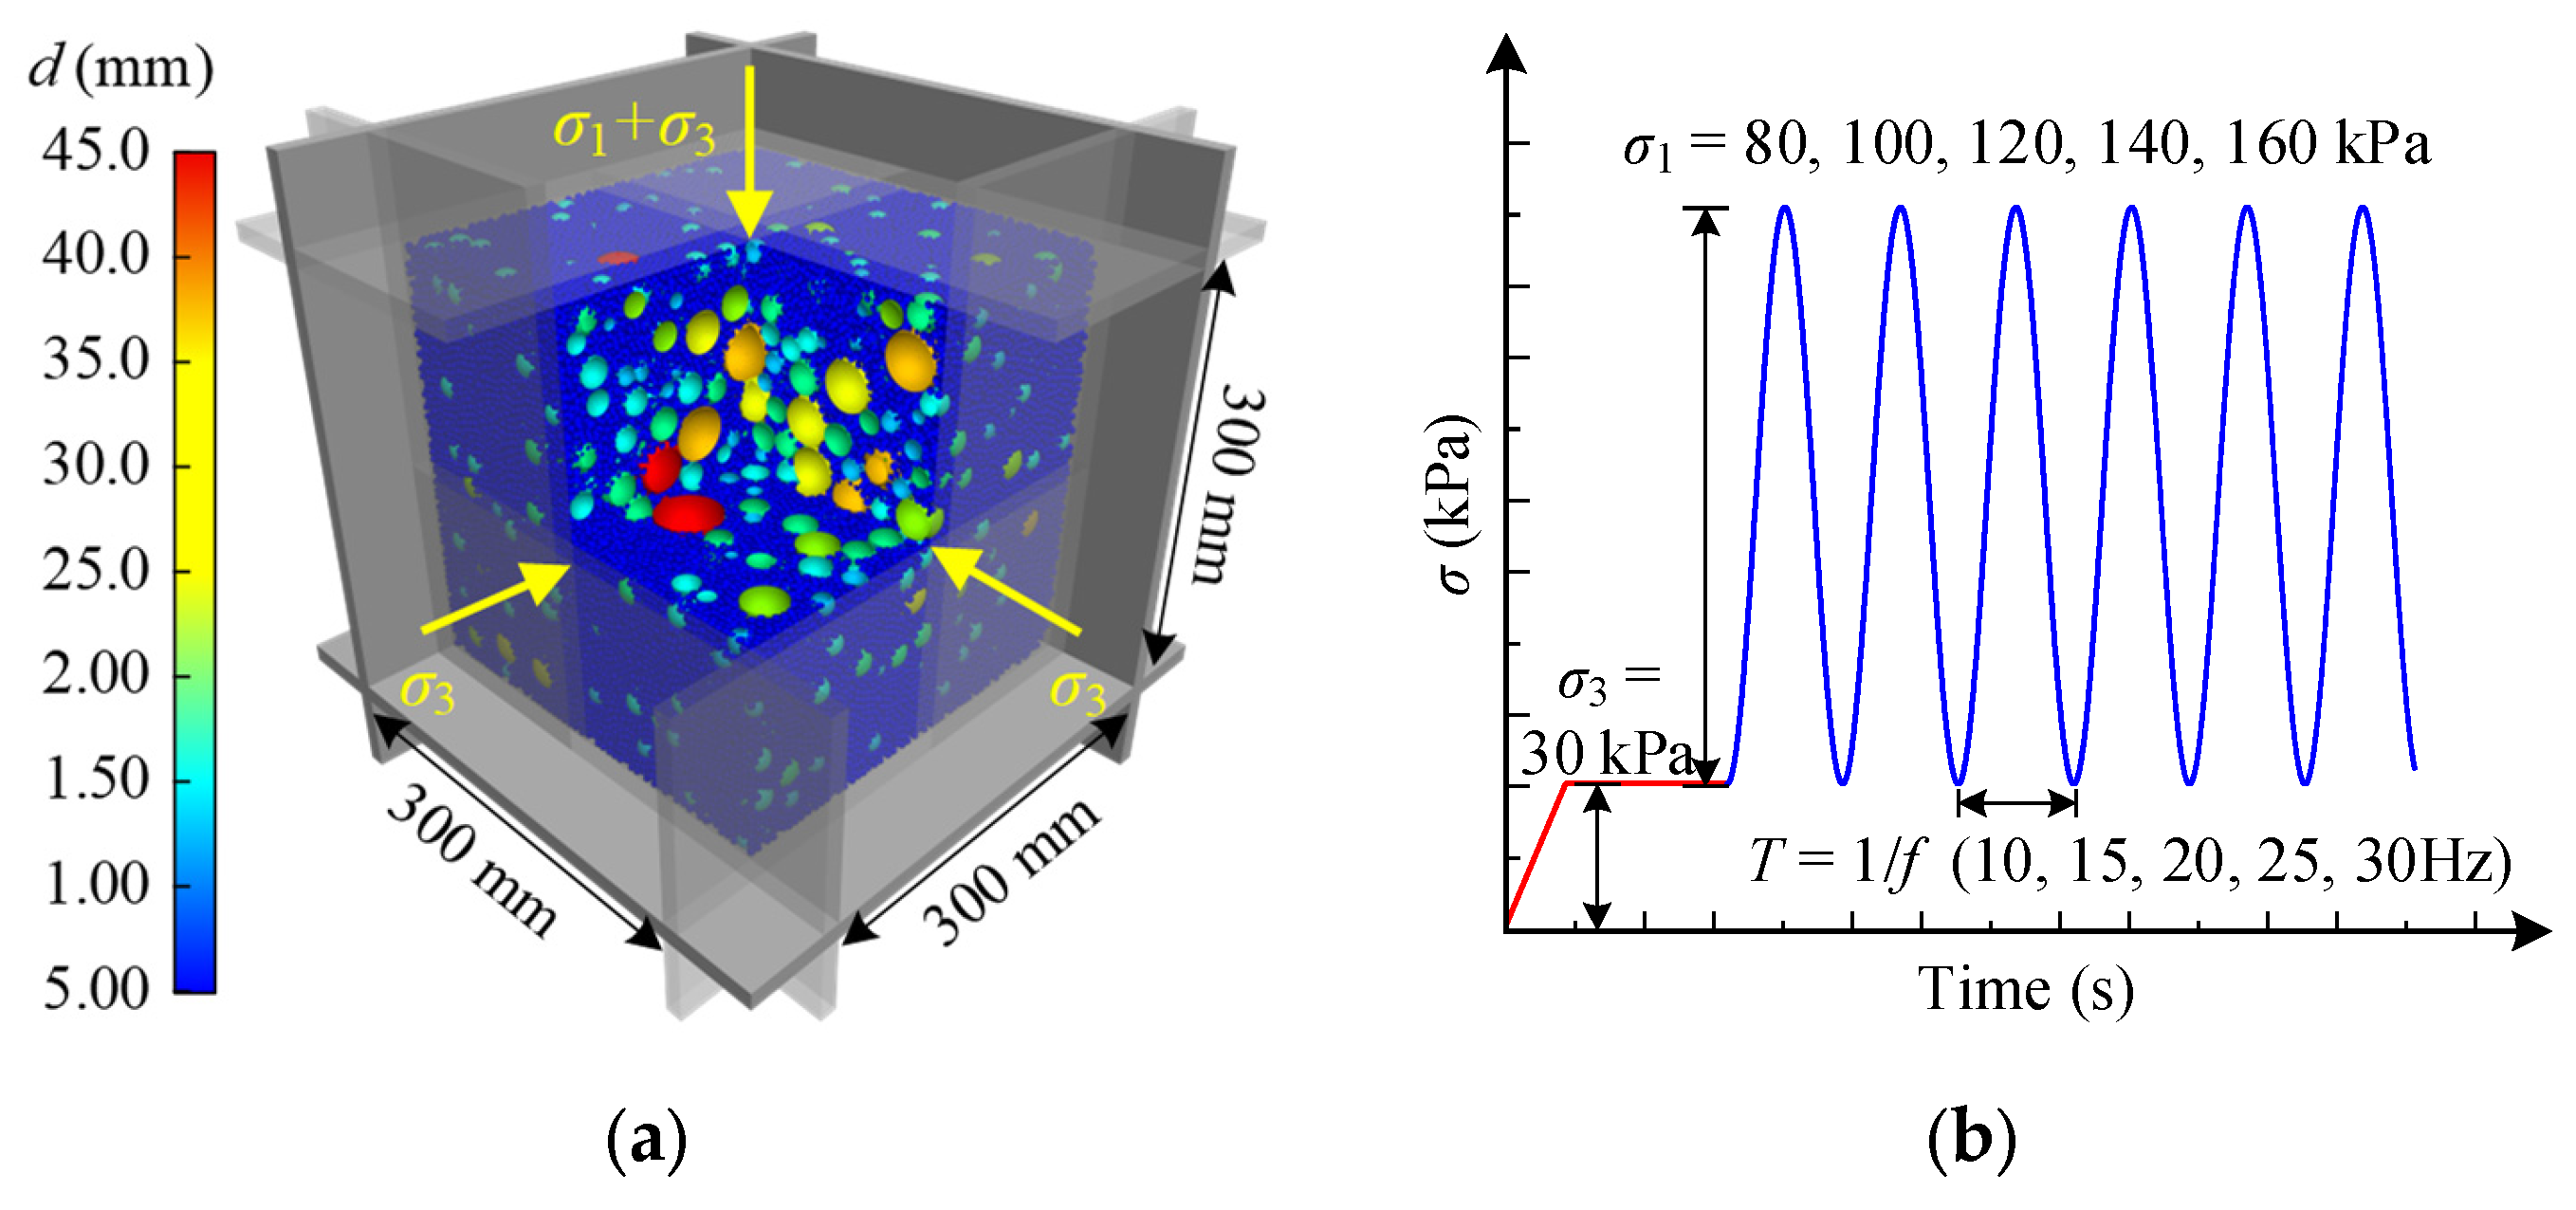
To investigate the micro breakage-induced mesoscopic evolution and mechanical degradation of graded aggregates under cyclic loading, a series of dynamic triaxial simulations is conducted. The main modeling procedure is summarized below, and additional implementation details are provided in Refs. [3,59,60]. As shown in Figure 4a, the established model has a size of 300 × 300 × 300 mm, and the particle size ranges from 5 to 45 mm. The minimum particle size of breakable particles is 7.1 mm. Moreover, the model boundary conditions are determined according to the loading characteristics of the surface layer of high-speed railway subgrade beds. Existing research shows that the confining pressure of railway subgrade fillers in triaxial tests is generally within 20–40 kPa [2,3,61], and therefore, the confining pressure σ3 is set to 30 kPa. As shown in Figure 4b, the loading frequencies are taken as 10, 15, 20, 25, and 30 Hz, which are generally consistent with the frequency characteristics of cyclic loading induced by high-speed trains. Furthermore, to analyze the evolution of micro breakage in graded aggregates under different loading levels, the dynamic stress amplitudes σ1 are set to 80, 100, 120, 140, and 160 kPa. Considering the high computational cost associated with repeated contact calculations, micro breakage detection, and particle-shape updating in DEM, the total number of loading cycles is set to 1000.
Additionally, interparticle interactions in DEM are governed by the contact parameters, and the macroscopic response of the specimen is strongly affected by these parameters. Hence, appropriate contact-model selection and parameter calibration are essential for ensuring the reliability of the numerical simulations. As described in Section 2.2, particle-particle interactions are represented by the RRHertz contact model, whereas particle-wall interactions are represented by the Linear contact model. A hierarchical calibration strategy is adopted in this study. The shear modulus and Poisson’s ratio in the RRHertz contact model, together with the normal and tangential stiffnesses in the Linear contact model, are constrained by single-particle tests and static triaxial tests. The interparticle friction coefficient and rolling resistance coefficient are calibrated using the angle of repose test, while the particle-wall friction coefficient is calibrated using the inclined plane test. The damping coefficients for particle-particle and particle-wall contacts are determined from drop tests. Detailed calibration procedures, target responses, and data analyses have been reported in previous studies [10,21,62]. The final parameter set adopted for the dynamic triaxial simulation of graded aggregates is listed in Table 2.

3.2. Verification of the Breakage Method

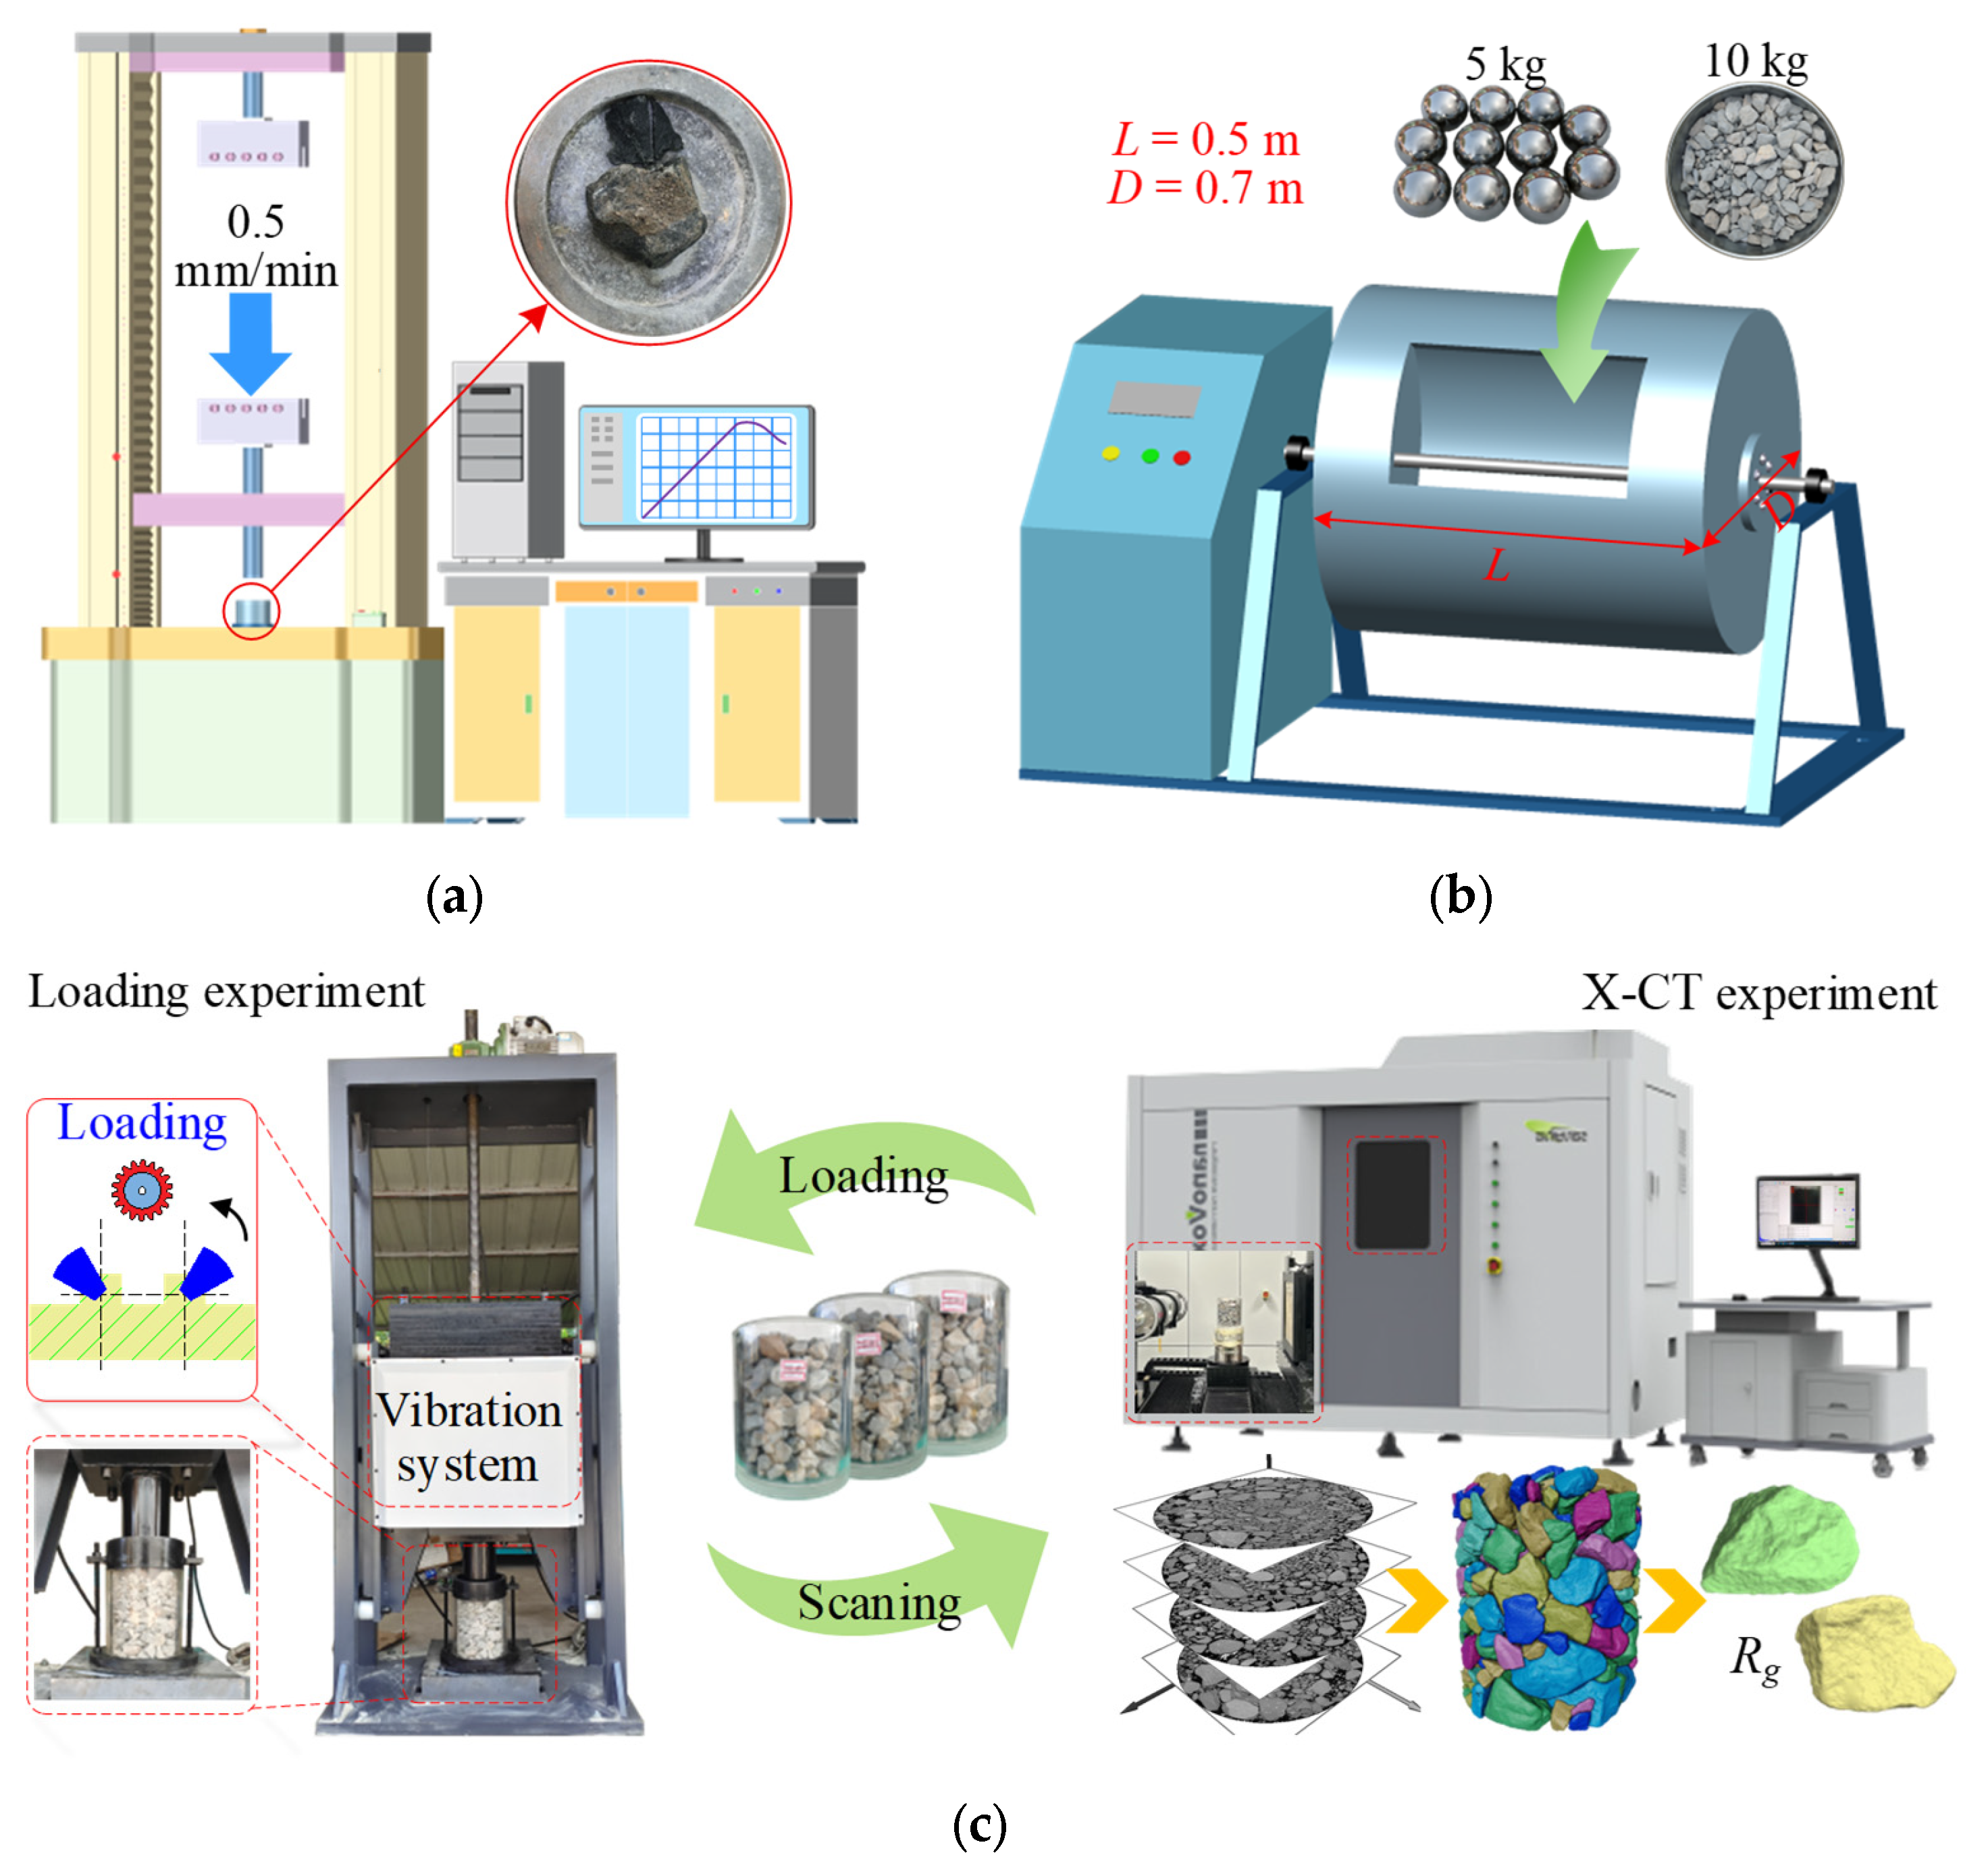
To evaluate the performance of the proposed energy-driven micro breakage method, three independent validation tests, namely single-particle compression, Los Angeles abrasion, and cyclic loading, are conducted using separately prepared specimens, covering responses from the particle scale to the assembly scale [10,20,48]. The test material is graded aggregate used as the surface layer filler of the high-speed railway subgrade bed, with limestone as the parent rock. As shown in Figure 5a, a multifunctional testing system with a maximum loading capacity of 100 kN and a force resolution of 1 N is used to conduct loading tests on a single graded aggregate particle. The loading rate is set to 0.5 mm/min, and the force and deformation responses of the particle are recorded in real time during the loading. It is worth noting that Gc is first calibrated based on the single-particle compression tests, and the calibrated value Gc = 1.0 × 10⁴ J/m2 is adopted as the model input parameter in the subsequent simulations.
As shown in Figure 5b, a Los Angeles abrasion test is conducted on graded aggregates with particle sizes ranging from 20 to 45 mm. The mass of the graded aggregate is 10 kg, together with 12 steel balls with a total mass of 5 kg. The inner length and inner diameter of the test drum are 0.5 m and 0.7 m, respectively. The abrasion ratio LAA of the graded aggregates is recorded after 200, 500, 1000, 1500, and 2000 revolutions, and LAA is calculated using Equation (29).
LAA = m 0 m 1 m 0 × 100 %
where m0 and m1 are the initial aggregate mass and the post-test mass, respectively.
Furthermore, as shown in Figure 5c, a cyclic loading test is conducted on a cylindrical specimen composed of limestone graded aggregates with particle sizes ranging from 10 to 45 mm. The mass fractions of the particle-size groups of 10–15, 15–20, 20–25, 25–30, 30–40, and 40–45 mm are 20%, 20%, 20%, 20%, 10%, and 10%, respectively. The specimen has a diameter of 150 mm and an initial height of 150 mm. The aggregates are thoroughly mixed according to the prescribed gradation and placed into the cylindrical container in layers. The specimen is prepared in four layers to an initial dry density of 1760 kg/m3, corresponding to an initial porosity of 0.36. The aggregates are tested under dry conditions. After sample preparation, the specimen surface is levelled, and the loading plate is installed on the top of the specimen. The excitation force is generated by the rotation of an eccentric block. The vibration frequency is set to 32 Hz, the static load is 600 kg, the eccentric mass is 2.4 kg, and the eccentricity is 3.32 mm. The specimen is continuously loaded for 350 s, and the loading-plate displacement is recorded throughout the test. Further details of the apparatus and data-processing procedure are provided in Ref. [10].
The total loading duration is 350 s. To capture the local shape evolution induced by micro breakage during loading, X-CT scans are conducted on the sample after 50 s and 350 s of loading, respectively. After the first loading stage (i.e., 50 s), the specimen is unloaded and transferred to the X-ray CT system for scanning and is then reinstalled in the loading apparatus for continued loading. During unloading, transfer, and scanning, the specimen remains inside the original rigid cylindrical container. The specimen orientation and loading position are maintained during reinstallation. Based on the scanning results, STL models of single particle shapes are obtained through three-dimensional reconstruction, and the particle roughness Rg is further calculated. Rg is determined from κmax, as given in Equation (30). Further details of the X-CT test parameters and slice image processing procedure can be found in Ref. [20].
R g = g κ κ max 1 N r ins
where N is the total number of identified corners and edges.
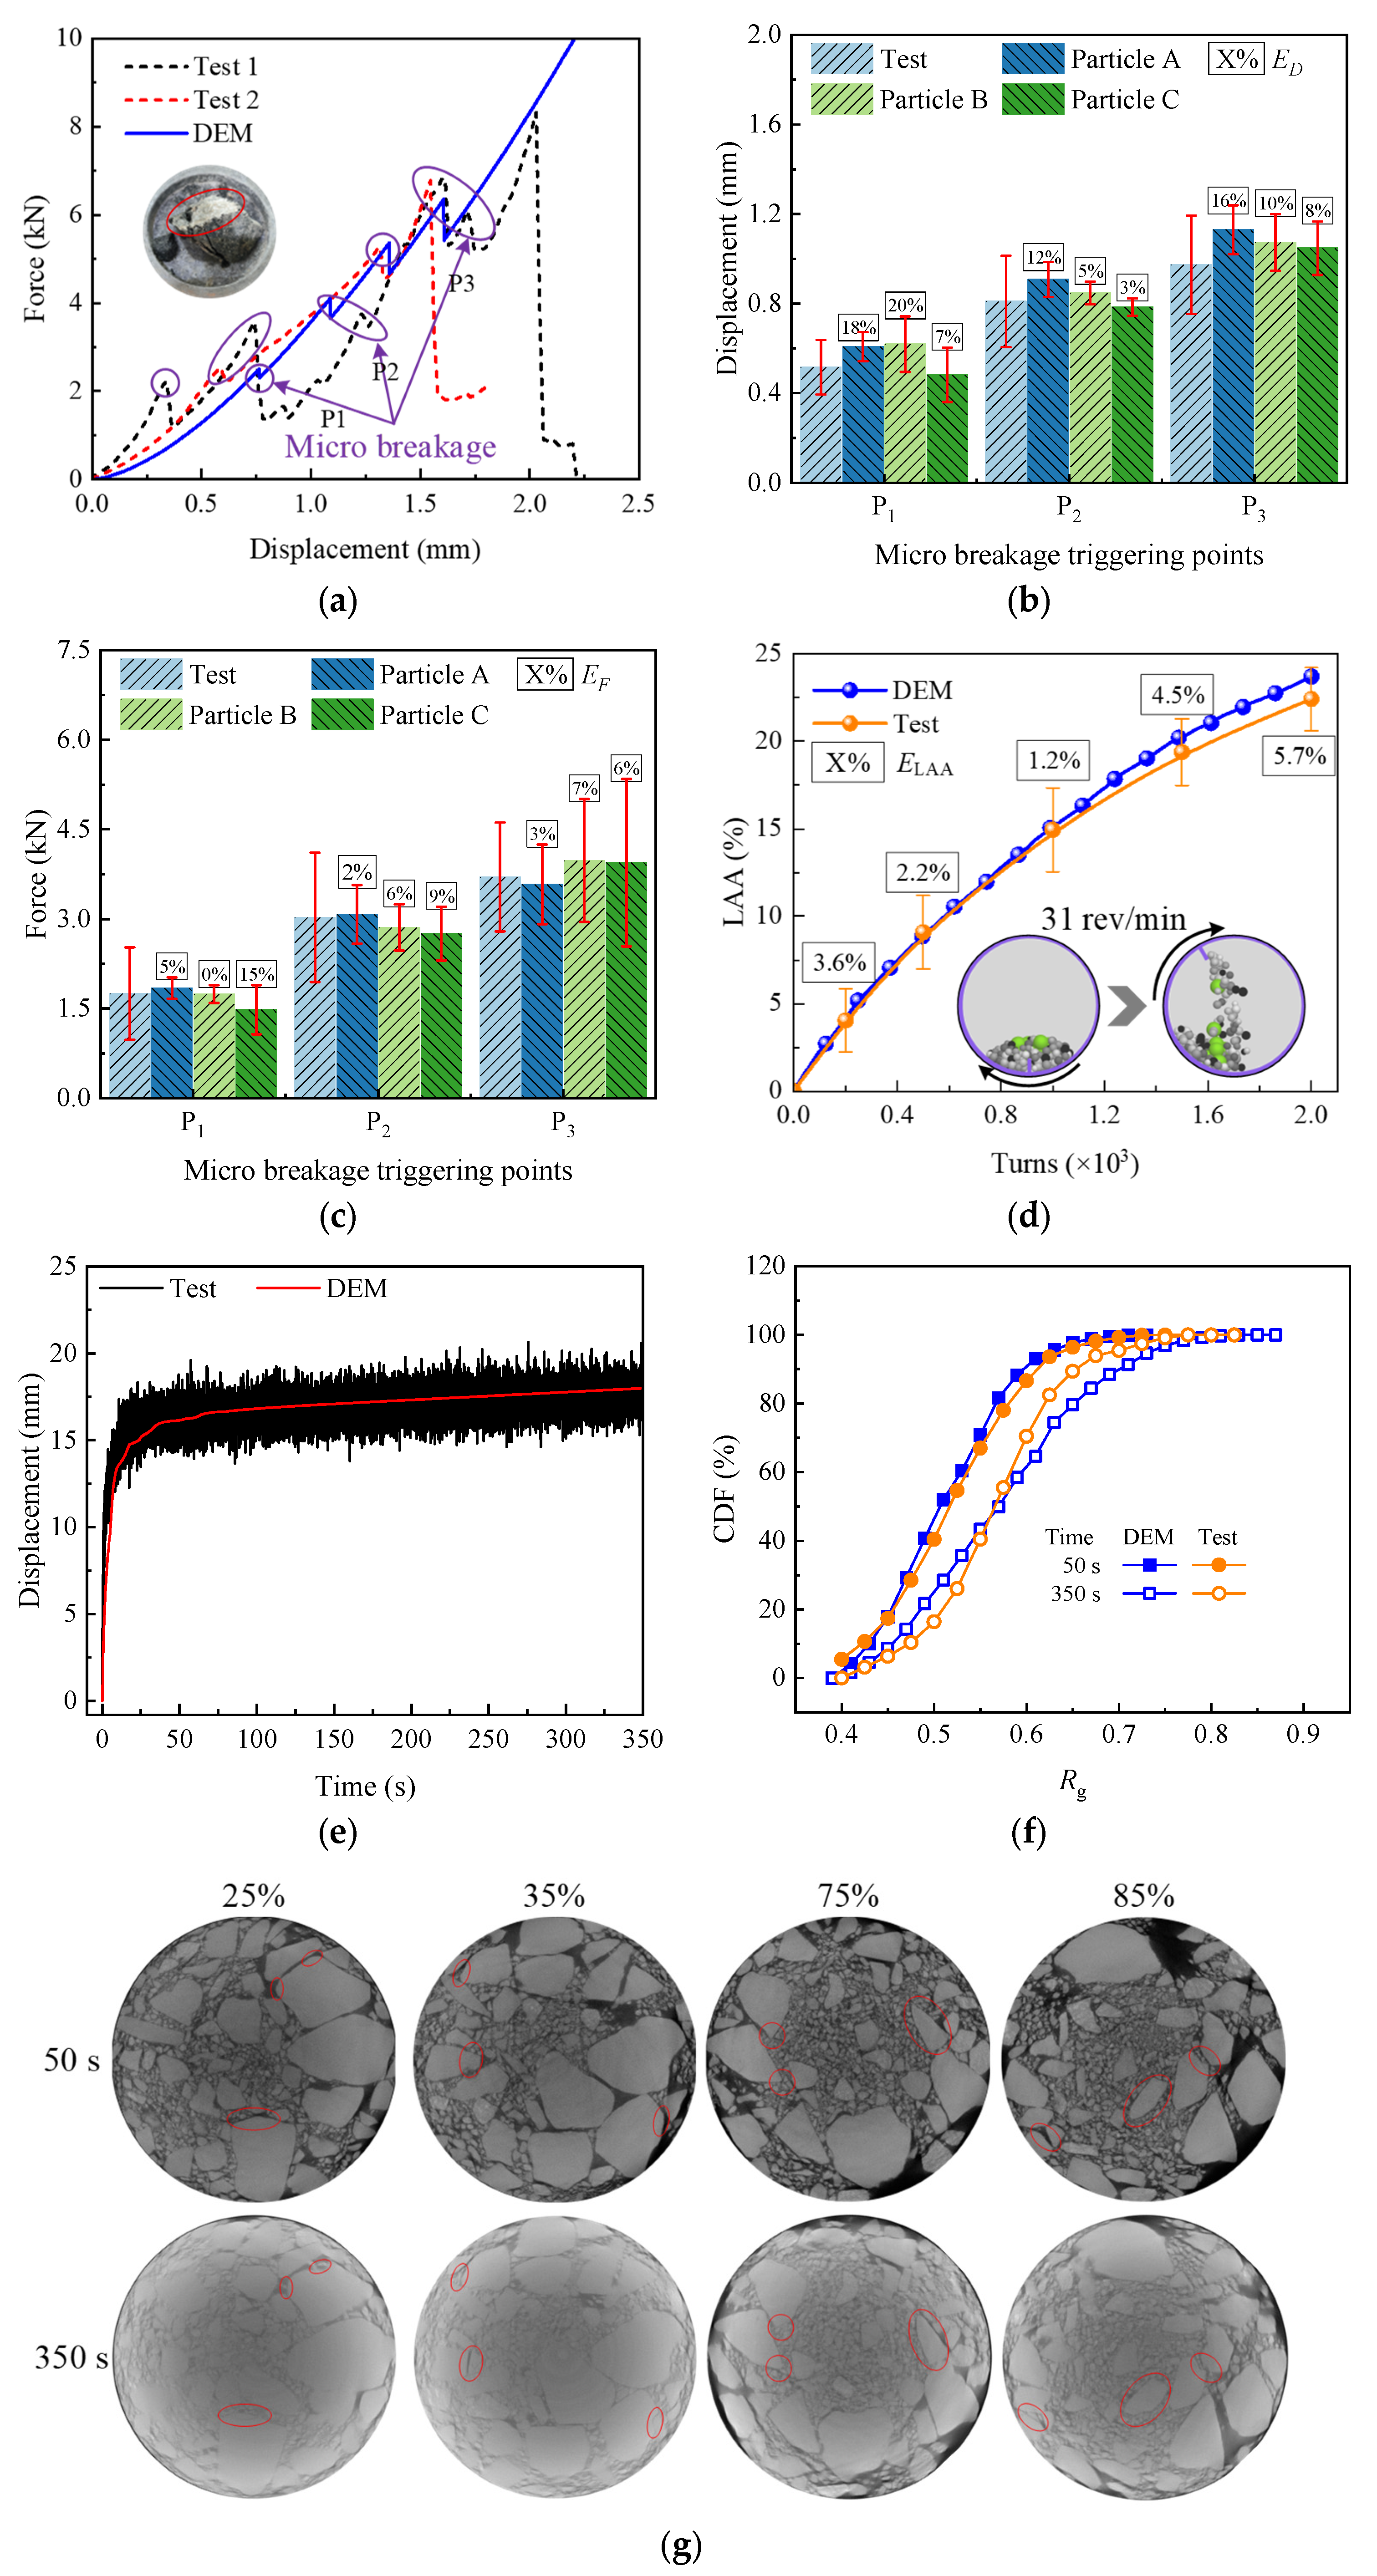
As shown in Figure 6a, the proposed method reasonably reproduces the nonlinear force-displacement response, multiple local force drops, and progressive micro breakage behavior observed in the single-particle compression tests. The representative micro breakage triggering points P1, P2, and P3 are identified from the experimental and DEM curves. Figure 6b,c further compare the displacement and force at these triggering points. The relative errors in displacement range from 3% to 20%, while those in force range from 0% to 15%. These results indicate that the proposed method can quantitatively capture the staged variation in particle load-bearing capacity associated with local micro breakage.
As shown in Figure 6d, the LAA values obtained from both the experiment and DEM increase continuously with the number of drum turns. The relative errors at the five representative abrasion stages are 3.6%, 2.2%, 1.2%, 4.5%, and 5.7%, respectively, all of which are below 6%. The close agreement demonstrates that the proposed method can reasonably reproduce the cumulative mass loss caused by repeated impact and abrasion.
The macroscopic deformation and particle-shape evolution under cyclic loading are compared in Figure 6e–g. As shown in Figure 6e, the specimen displacement increases rapidly during the initial loading stage and then gradually approaches a relatively stable evolution stage. The DEM result follows the experimental displacement evolution reasonably well. Figure 6f shows that the cumulative distributions of Rg obtained from the DEM simulation and experiment are consistent at both 50 s and 350 s. With increasing loading time, the distributions shift toward larger Rg values, indicating the progressive weakening of particle angularity and particle rounding.
Figure 6g presents representative X-ray CT slices at different normalized specimen heights after 50 s and 350 s of cyclic loading. The red ellipses indicate representative regions exhibiting local particle-morphology changes. The comparison shows changes in particle contours, particle arrangement, and local packing structure during cyclic loading, providing direct visual support for the particle-scale morphology evolution reflected by the Rg distributions. Overall, the comparisons of force-displacement response, triggering-point errors, LAA evolution, specimen displacement, Rg distribution, and CT images demonstrate that the proposed method can reasonably characterize micro breakage-induced mass loss, macroscopic deformation, and particle-shape evolution from the particle scale to the assembly-response scale.
It should be noted that fragments smaller than 2 mm are not explicitly generated as independent particles in the present DEM model. Their formation is represented through equivalent local material loss; therefore, the independent mechanical contribution of these fine fragments is not quantified in the present simulations.
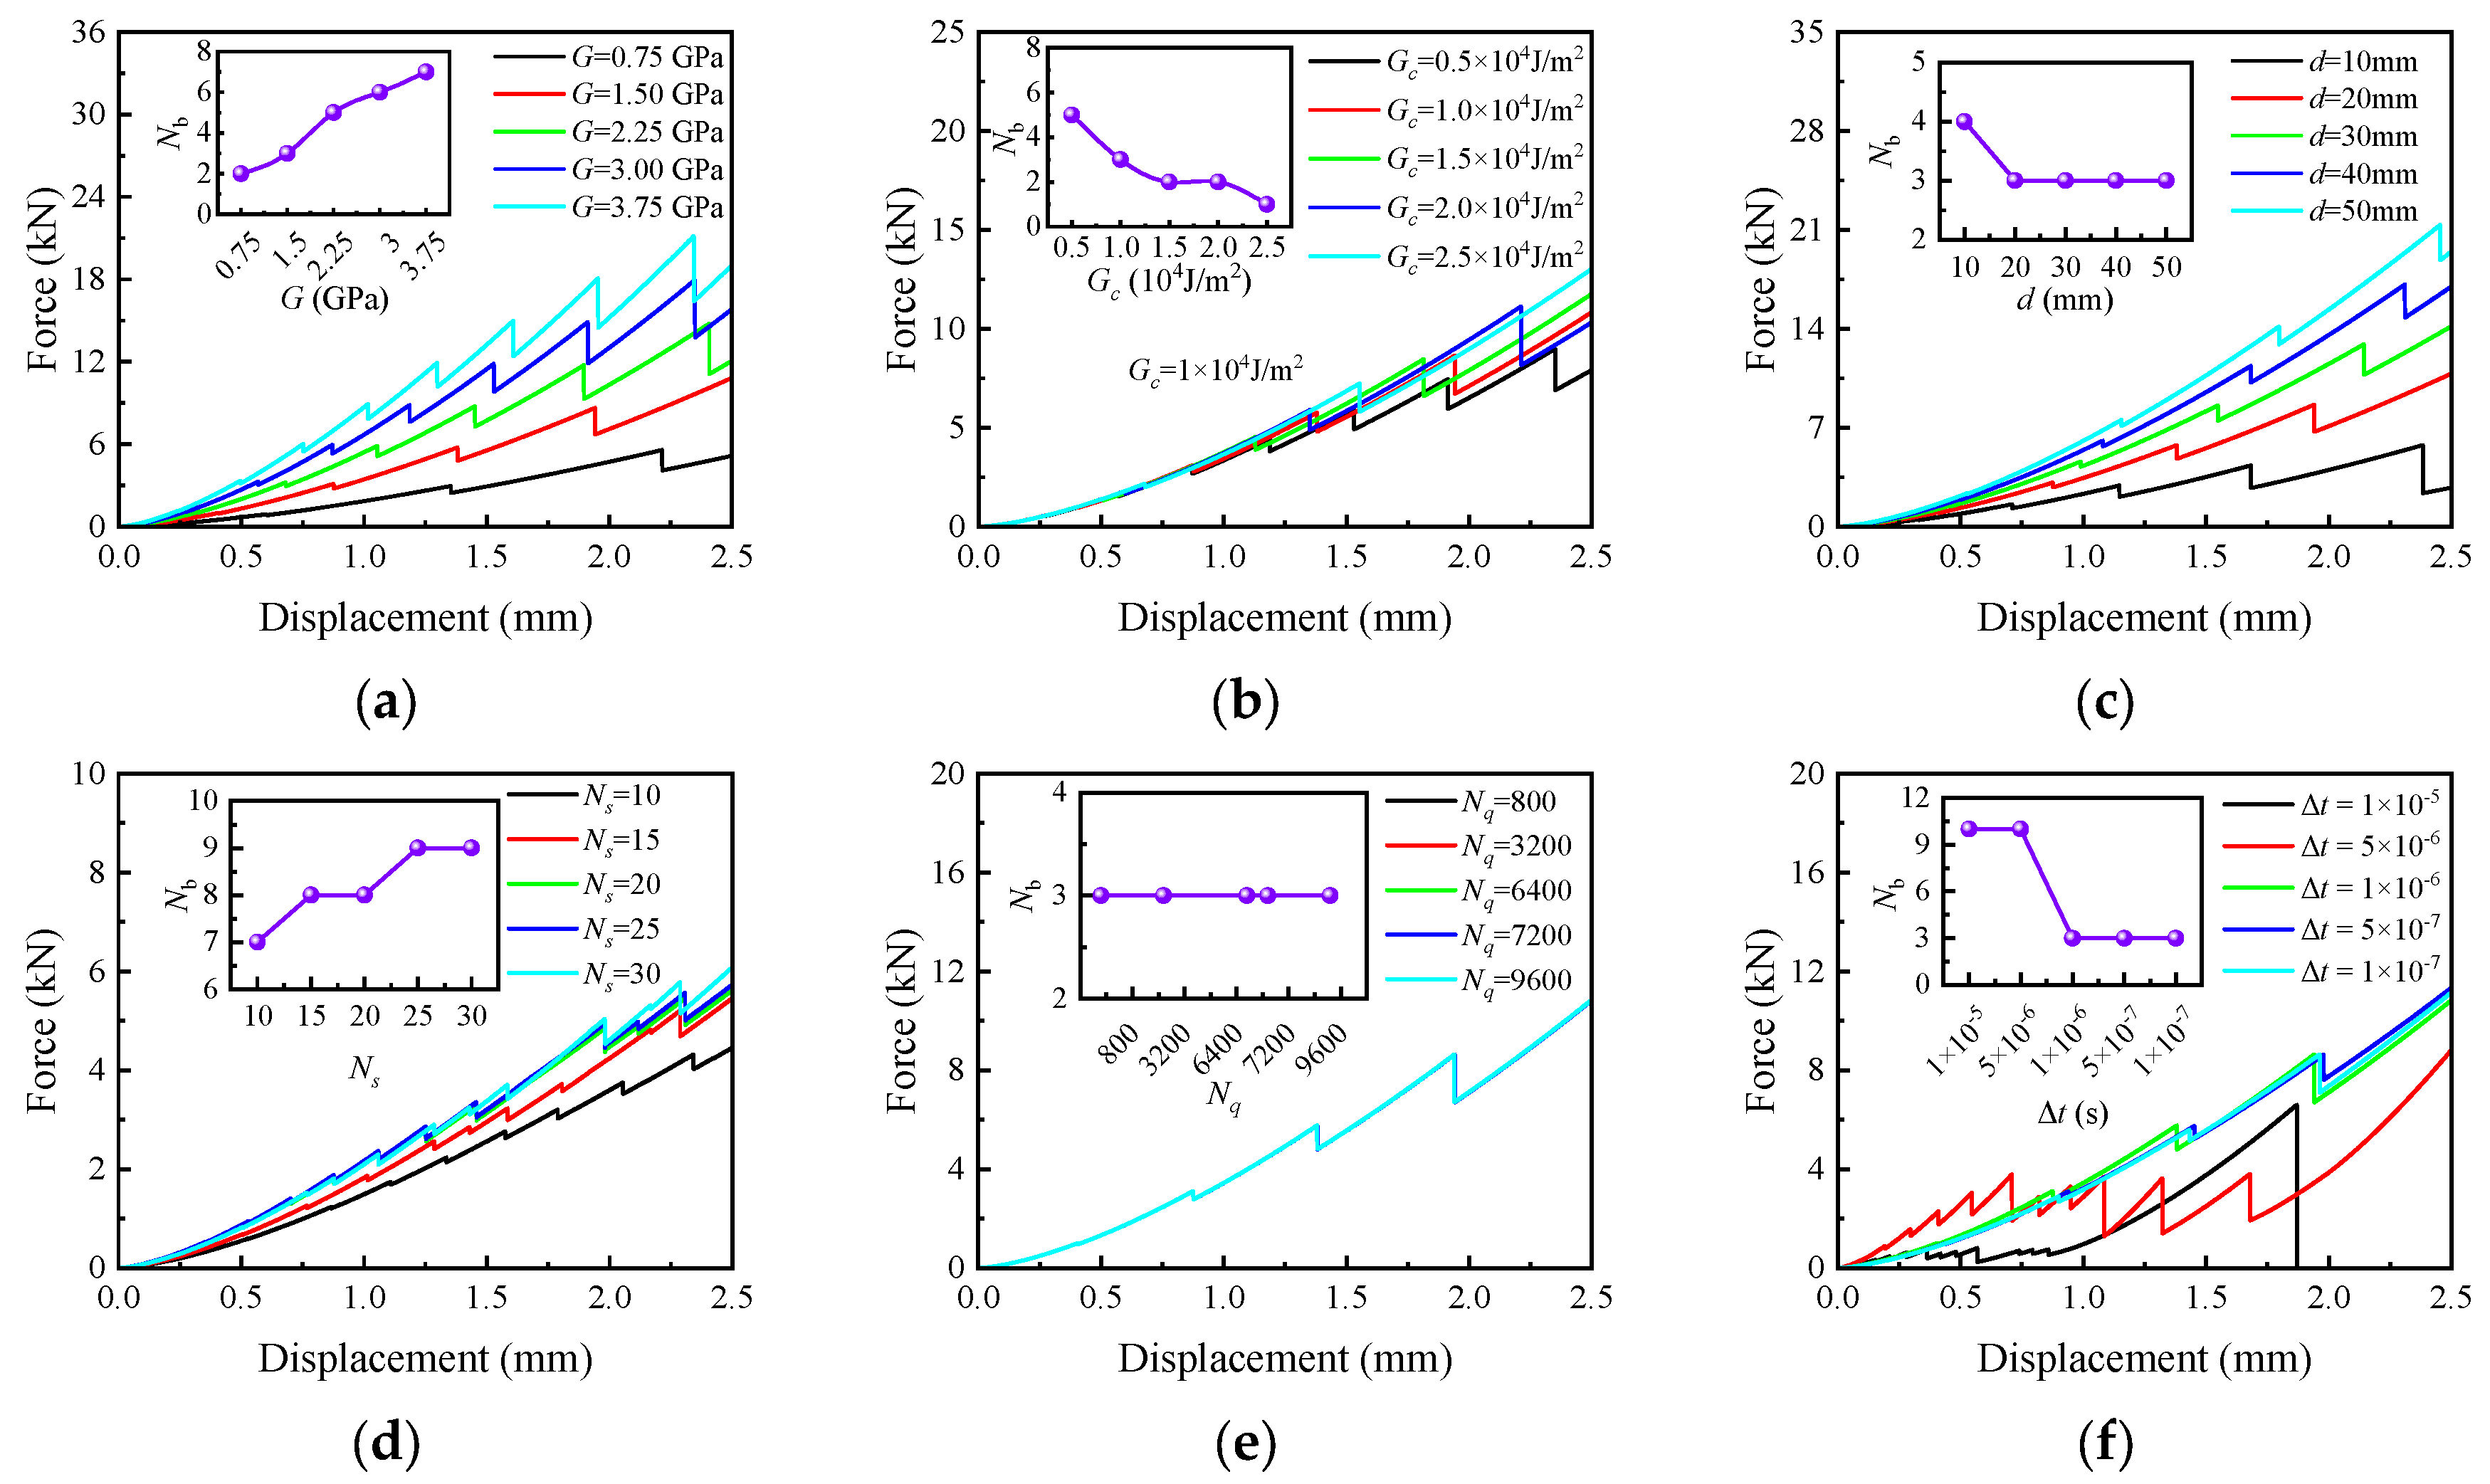
To evaluate the effect of key parameters on the model response, a parameter sensitivity analysis is conducted based on the single-particle test. The shear modulus G, Gc, particle size d, spherical-harmonic truncation order Ns, discrete quadrature point number Nq, and time step Δt are selected as the sensitivity parameters.
As shown in Figure 7a, with increasing G, the force-displacement curves shift upward as a whole, and both the curve slope and contact force level increase markedly. The number of micro breakage events Nb also increases gradually. This indicates that a larger G accelerates the accumulation of contact energy. As shown in Figure 7b, increasing Gc, raises the micro breakage threshold, reduces the number of force drops in the force-displacement curve, and generally decreases Nb. This indicates that Gc is a key parameter controlling the micro breakage frequency. In Figure 7c, with increasing d, the bearing capacity of the single particle increases significantly, whereas Nb tends to become stable for larger particle sizes. This suggests that particle size mainly affects the bearing capacity, while its influence on the number of micro breakage events is relatively limited.
For the shape and numerical parameters, in Figure 7d, as Ns increases, more local shape details are represented, and both the force-displacement response and Nb change to some extent. This indicates that the shape-representation resolution affects the local contact state and micro breakage triggering. In Figure 7e, the force-displacement curves and Nb are almost consistent under different Nq values, indicating that the number of spherical quadrature points has a limited effect on the calculation results and that the adopted quadrature resolution is sufficient. Figure 7f shows that a relatively large time step leads to noticeable deviations in both the force-displacement response and Nb. When Δt is reduced to 1 × 10⁻⁶ s or below, the force-displacement curves and Nb become nearly stable.
In summary, the validation results show reasonable agreement between the numerical and experimental responses under the considered single-particle, abrasion, and cyclic-loading conditions. The proposed method can therefore be used to investigate micro breakage-induced mesoscopic evolution within the validated range.

4. Results and Analysis

This section first quantifies the effects of cyclic loading frequency and amplitude on LAA, mechanical coordination number CN, average contact force fc, and axial plastic strain εp of graded aggregates. Based on these results, the mesoscopic evolution and performance degradation induced by micro breakage are further investigated.

4.1. Micro Breakage Characteristics

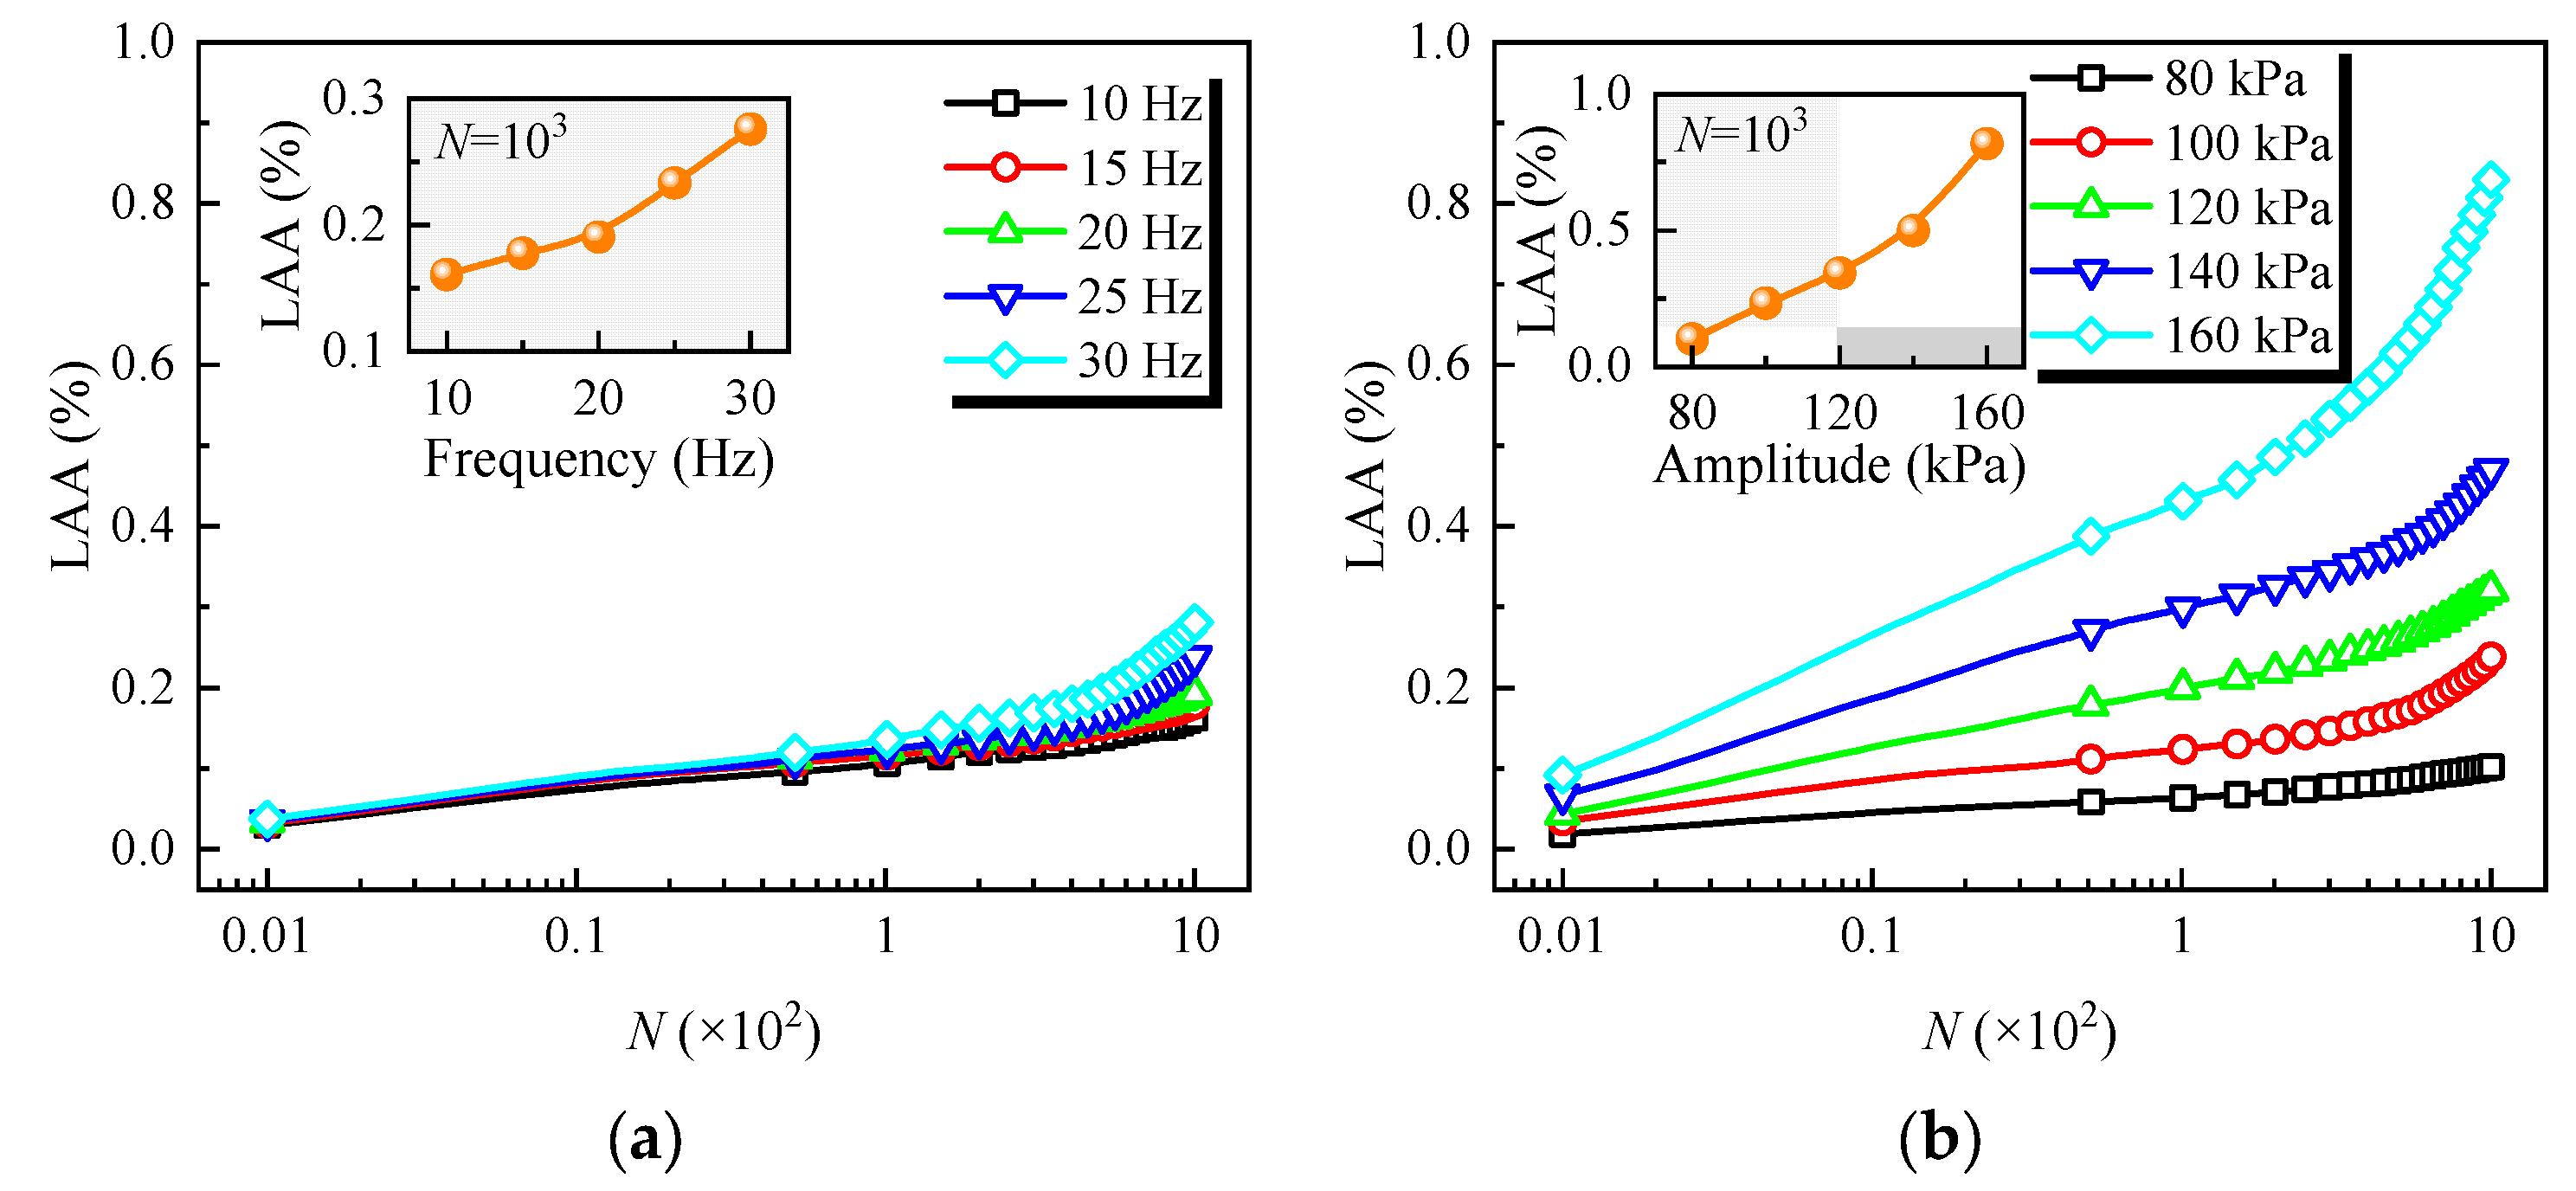
As shown in Figure 8, the LAA increases with the number of loading cycles N under different loading conditions, and its increase rate becomes higher as the frequency and amplitude increase. This indicates that micro breakage of graded aggregates under cyclic loading exhibits a clear cumulative characteristic. In Figure 8a, when N = 103, the LAA increases with frequency, with a more significant increase observed when the frequency exceeds 20 Hz. Notably, existing research indicates that granular materials such as railway ballast exhibit more significant dynamic effects when the frequency exceeds 20 Hz [63,64]. This suggests that the dynamic response of the particle system is significantly enhanced above 20 Hz, thereby promoting the accumulation of micro breakage.
Additionally, as shown in Figure 8b, the LAA increases with loading amplitude, and its sensitivity to amplitude is significantly greater than that to frequency. This indicates that stress level is the main factor controlling micro breakage at small N. As N increases, the cumulative characteristic associated with frequency gradually becomes more significant, and its effect on micro breakage correspondingly increases. This is attributed to the fact that a larger amplitude directly increases the elastic energy stored at contacts, making high-curvature regions more likely to reach breakage conditions. In contrast, a higher frequency mainly enhances the cumulative effect (i.e., cumulative breakage factor ) during cyclic loading and has a relatively limited influence on the contact energy level in a single cycle. The increase in LAA also implies more corner and edge spalling, progressive particle rounding, and fine generation. These changes facilitate particle rearrangement, thereby promoting volumetric contraction of the sample.
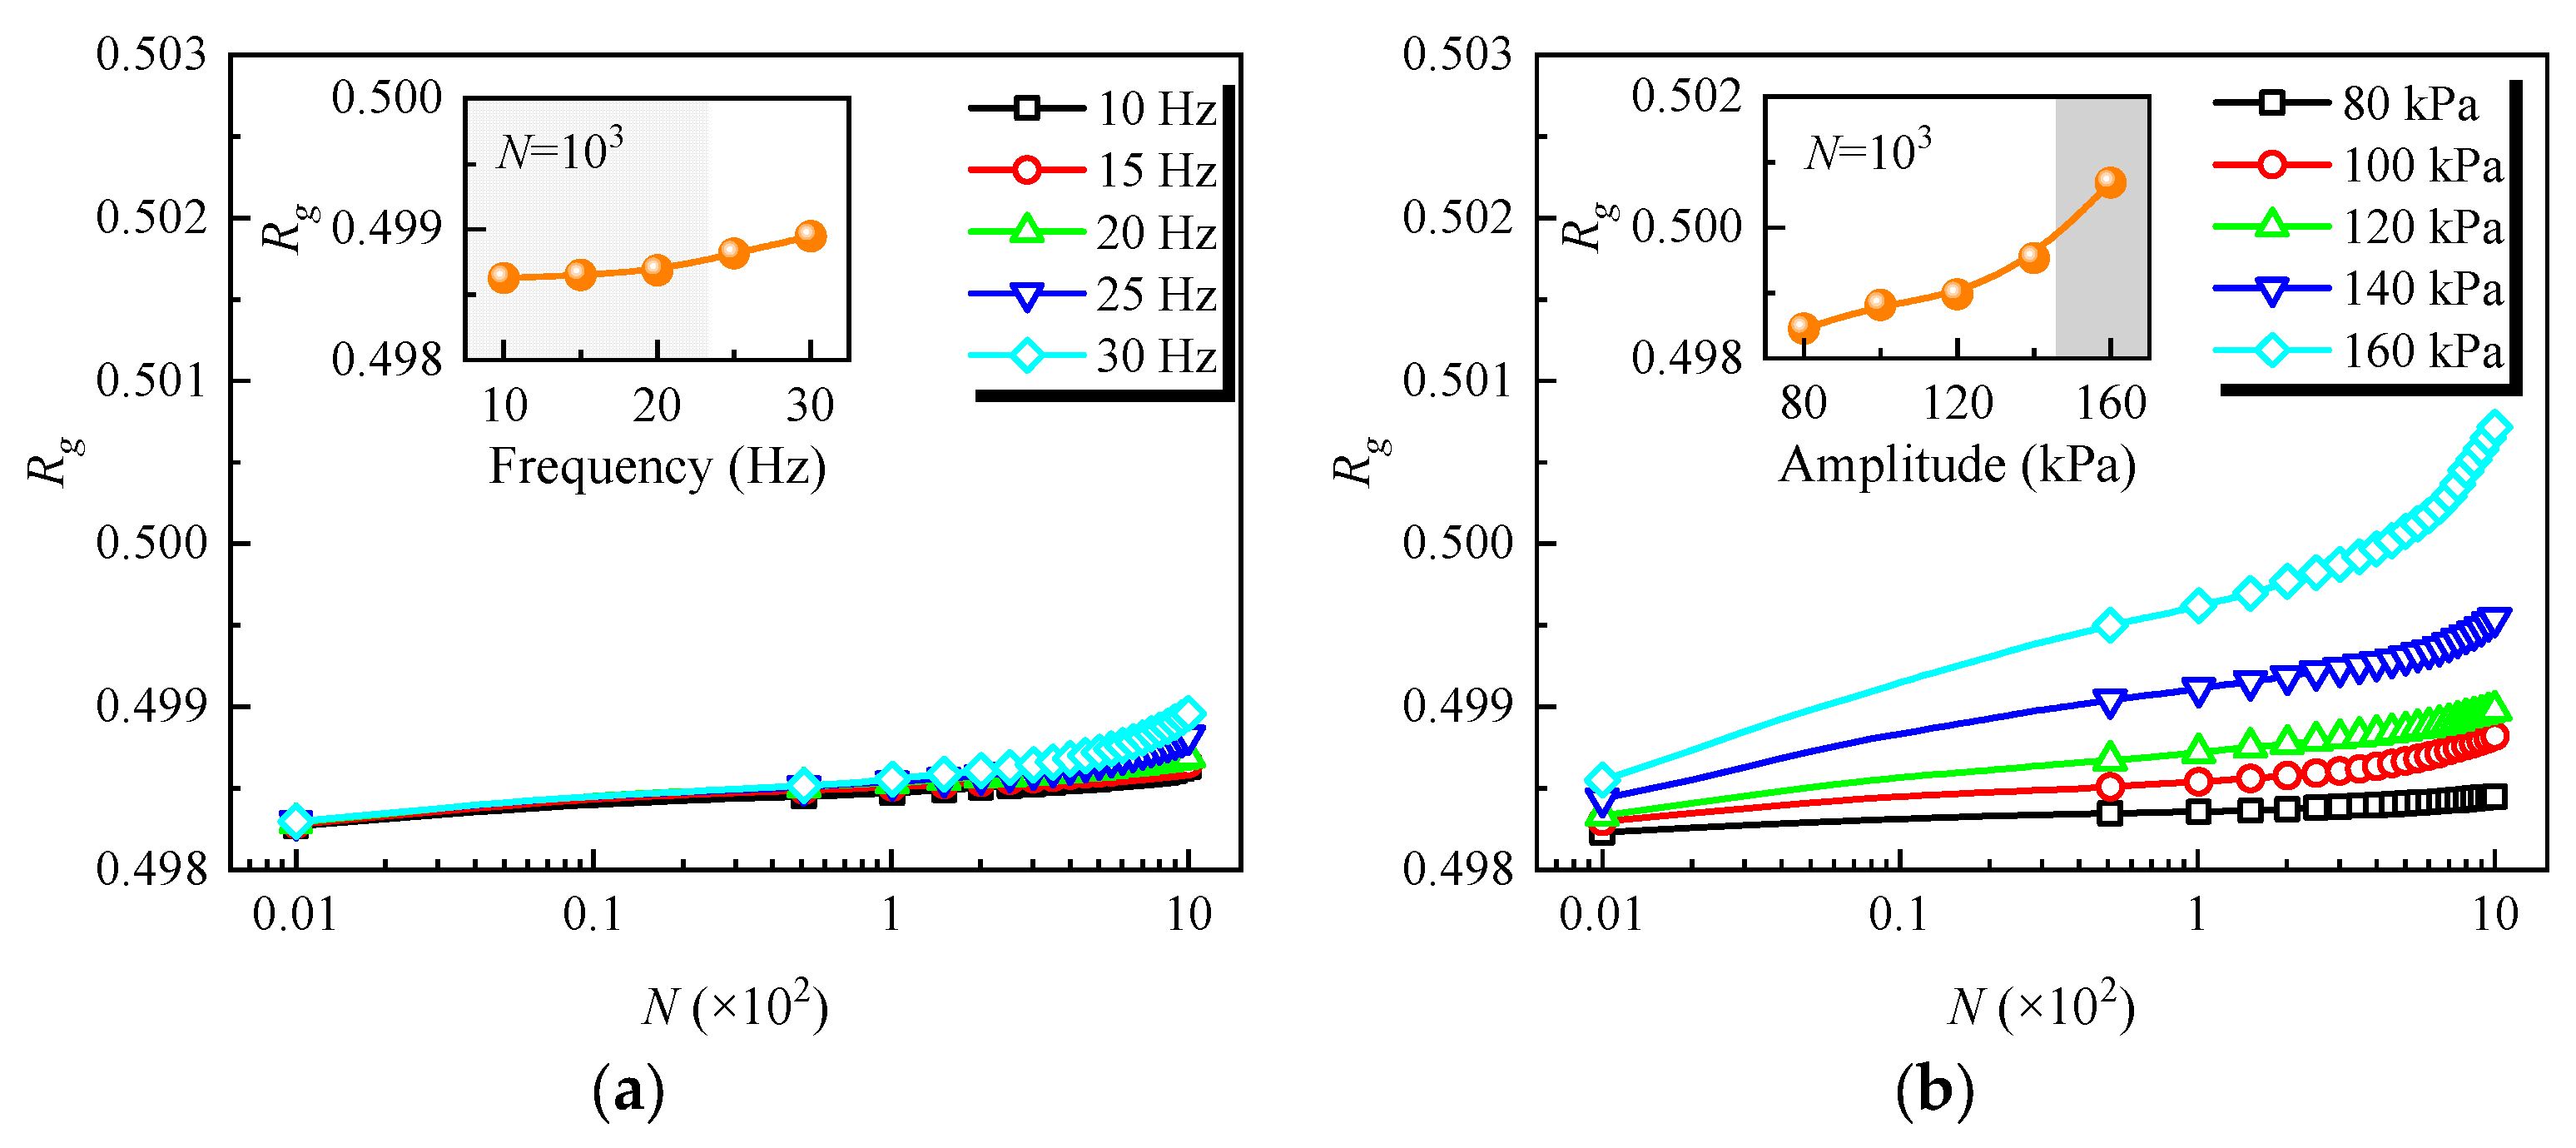
Furthermore, as shown in Figure 9, the curvature-sensitive particle roughness Rg under different loading conditions is quantified. Rg gradually increases with N, and the increase is more significant at higher frequency and amplitude, which is generally consistent with the variation of LAA in Figure 8. This indicates that micro breakage under cyclic loading gradually weakens the corner and edge features of particles, leading to a more rounded overall shape. Moreover, as N increases from 0 to 1000, the variation in Rg remains relatively small, and particle shape evolution mainly involves local adjustments, reflecting the cumulative characteristic of micro breakage.
In summary, the increase in micro breakage with N is more significant under high frequency and large amplitude, reflecting a significant cumulative characteristic. Hence, it is necessary to further investigate the mesoscopic evolution and performance degradation of graded aggregates induced by micro breakage. This is important for revealing the stage-dependent degradation mechanism within the simulated cyclic-loading range and for supporting service performance evaluation.

4.2. Mechanical Coordination Number

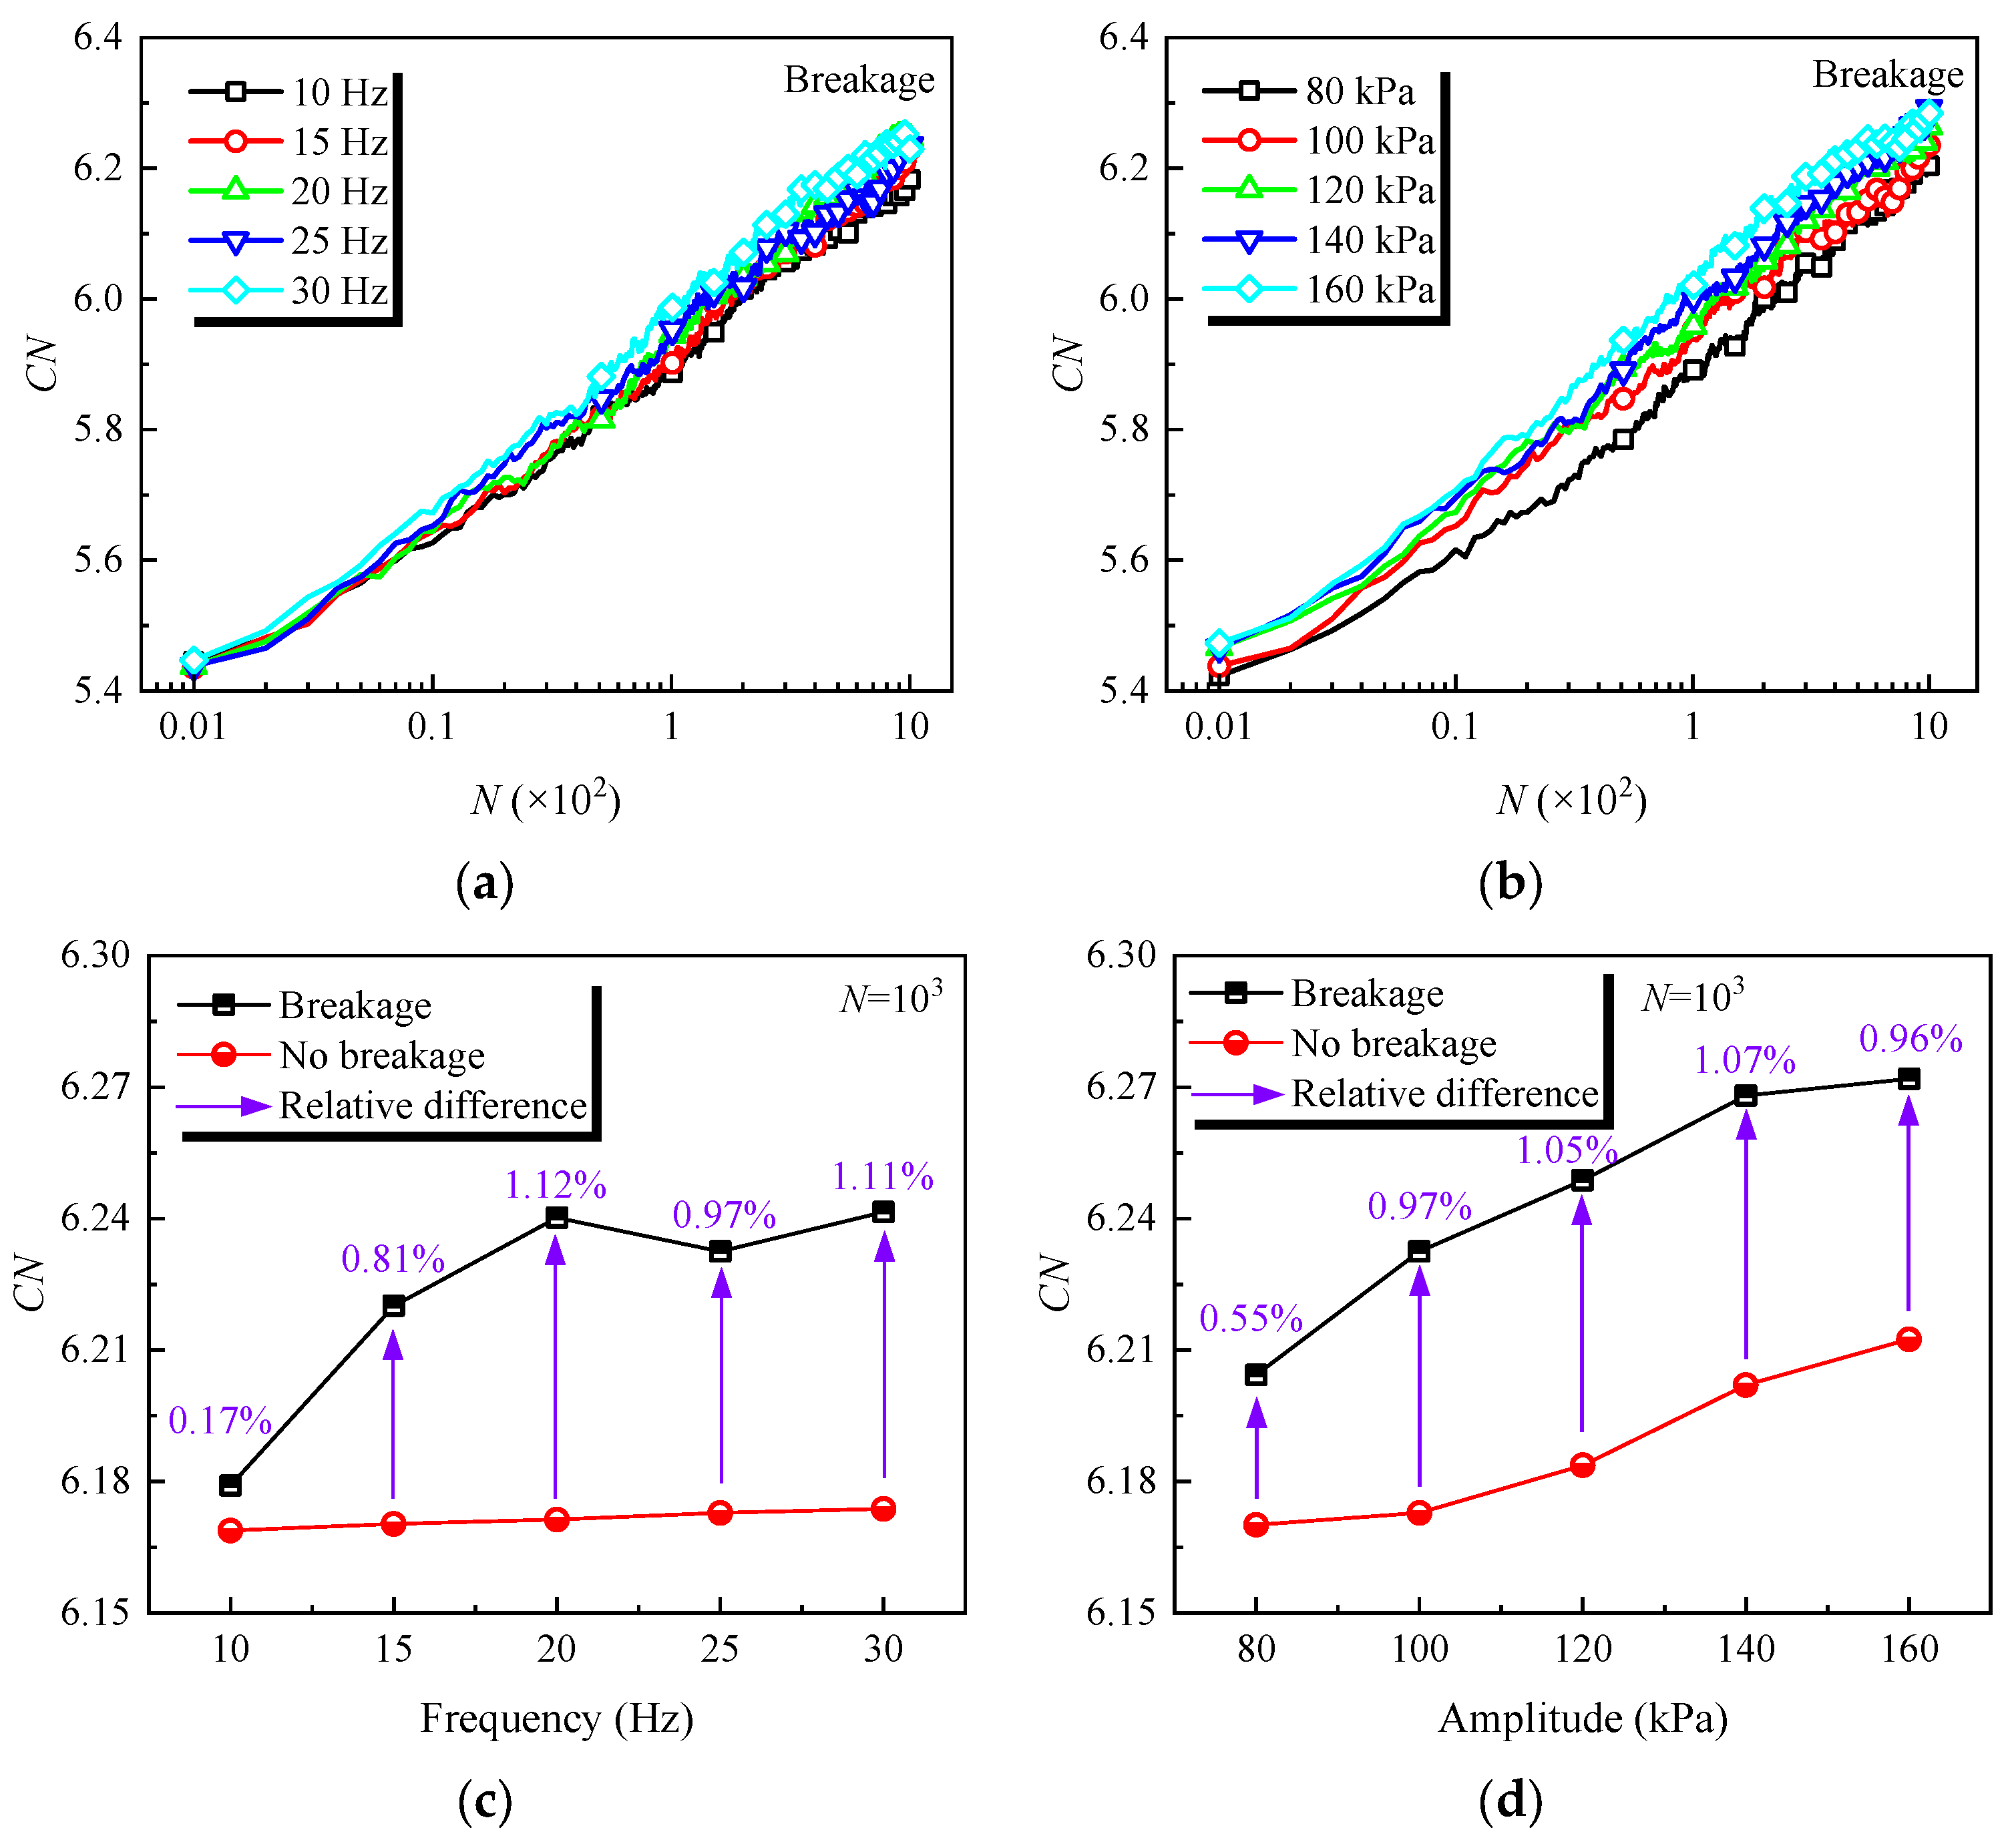
The coordination number CN is an important mesoscopic parameter characterizing the compactness of the particle system and is calculated by Equation (31). As shown in Figure 10a,b, the mechanical coordination number CN increases with N under different loading conditions, and its sensitivity to amplitude is significantly greater than that to frequency. This indicates that the particle contact network is continuously rearranged under cyclic loading. As a result, the graded aggregate skeleton gradually approaches a denser state, with amplitude showing a more significant influence. Furthermore, to investigate the effect of micro breakage on the contact structure, CN is compared between the breakage and non-breakage conditions.
C N = 2 C N 1 N a N 1 N 0
where C is the number of inter-particle contacts, N1 is the number of particles with only one contact, N0 is the number of particles without contact, and Na is the total number of particles.
As shown in Figure 10c, CN increases with frequency under both breakage and non-breakage conditions, with a more significant increase under breakage conditions, indicating that micro breakage enhances the compactness of graded aggregates. When the frequency exceeds 20 Hz, CN under breakage conditions remains nearly stable. Relative to the non-breakage case, CN under breakage conditions increases by 0.17% at 10 Hz and by 1.12% at 20 Hz, after which the difference remains approximately 1% between 25 and 30 Hz. This indicates that 20 Hz is a threshold value, which is consistent with the variation of LAA in Figure 8. When the frequency exceeds 20 Hz, micro breakage continues to accumulate, whereas its contribution to CN growth becomes limited.
Similarly, as shown in Figure 10d, CN increases with amplitude under both breakage and non-breakage conditions, with a more significant increase under breakage conditions. Compared with the non-breakage case, the corresponding relative difference under breakage conditions increases from 0.55% at 80 kPa to 1.07% at 140 kPa, and then decreases to 0.96% at 160 kPa. This indicates that a larger loading amplitude significantly promotes the particle rearrangement induced by micro breakage. In summary, micro breakage promotes particle rearrangement and drives the graded aggregate skeleton toward a denser state. As the skeleton gradually becomes stable and dense, the promoting effect of micro breakage on CN growth gradually weakens.

4.3. Contact Force

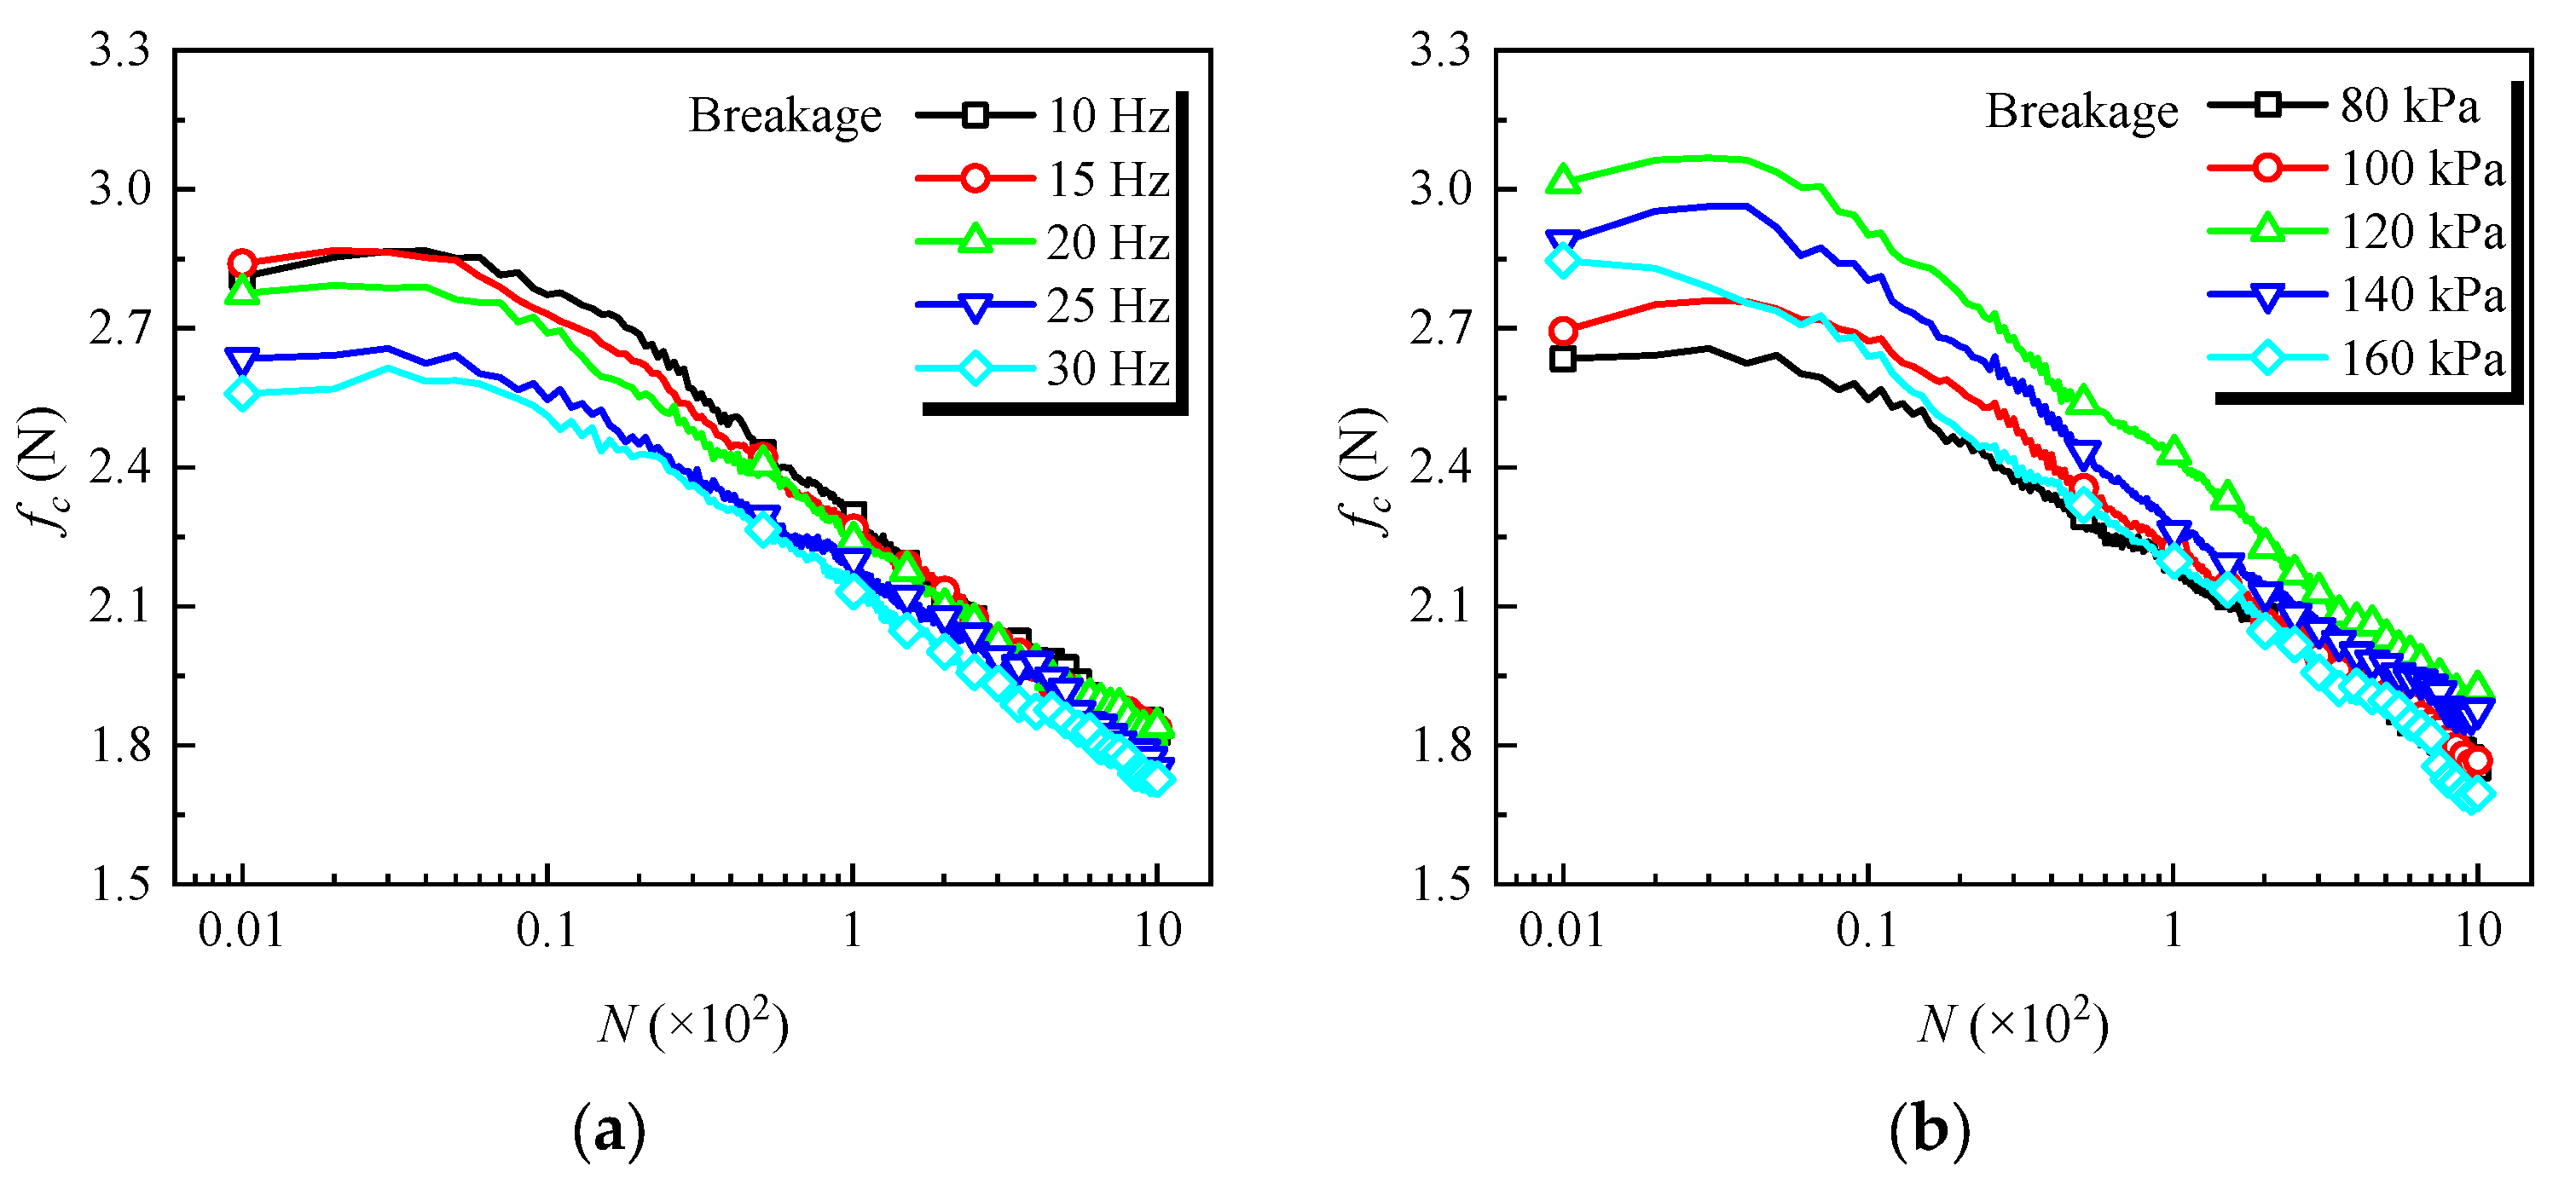
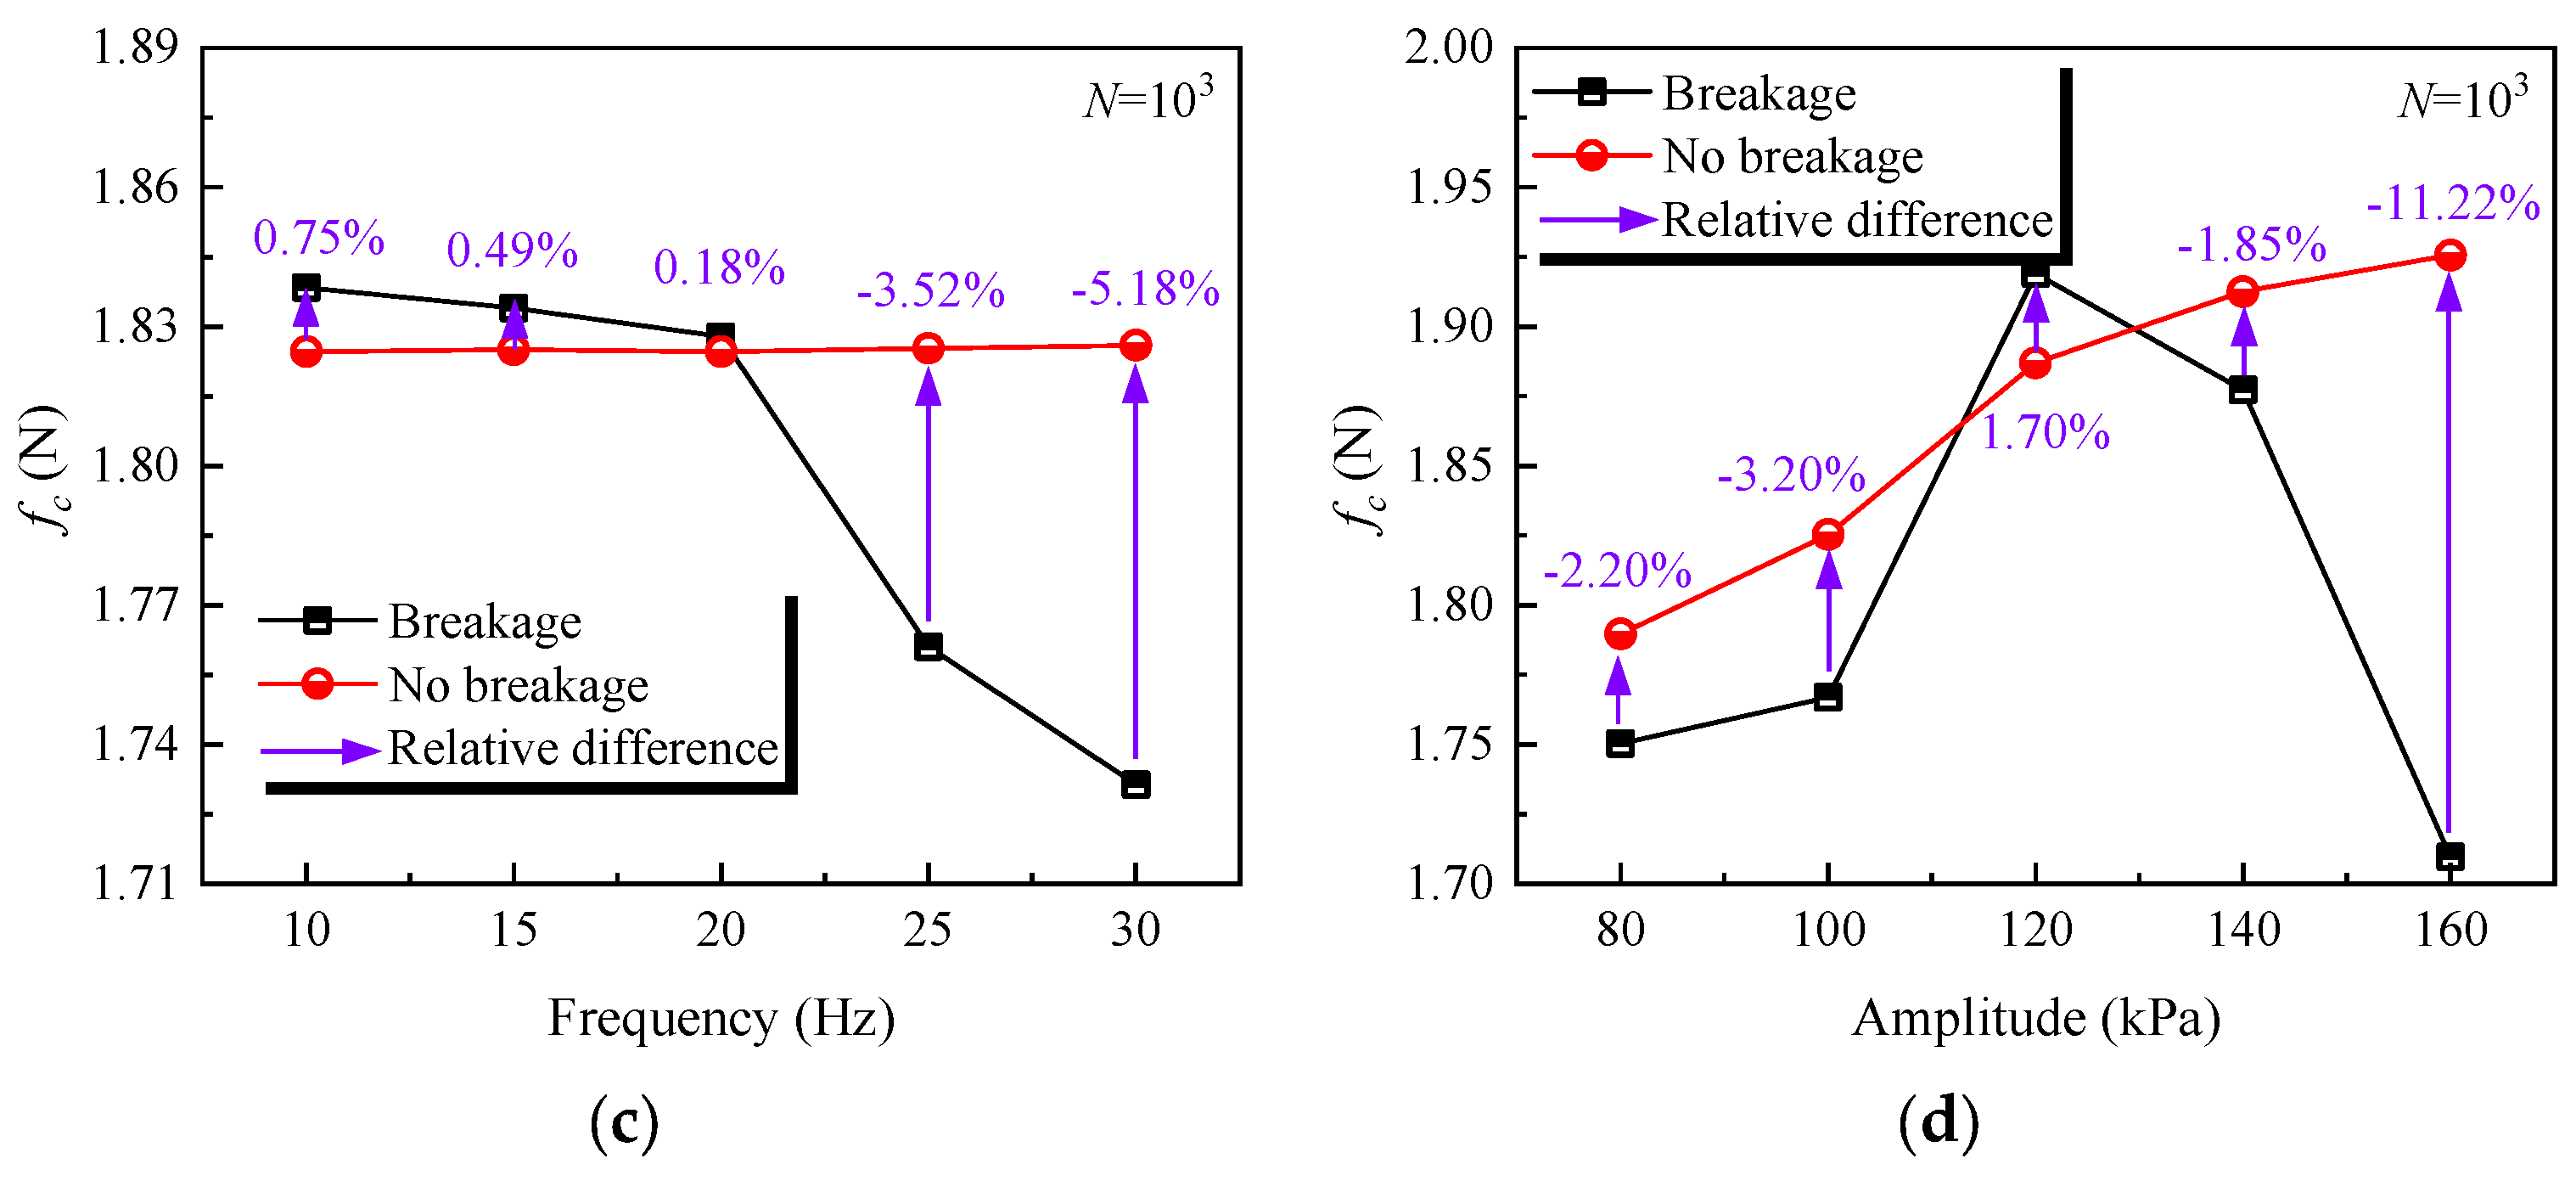
The average contact force fc characterizes the stress level within the force-chain network of the particle assembly and is calculated using Equation (32). As shown in Figure 11a,b, fc gradually decreases with increasing N under different loading conditions. The time-history evolution of CN indicates that the number of contacts within the sample continuously increases as N increases, with the external load being distributed among more contacts. As a result, the contact force concentrated in strong force chains is progressively dispersed, leading to a gradual decrease in fc.
f c = i C F i C
where Fi is the magnitude of contact i.
As shown in Figure 11c, under non-breakage conditions, the effect of frequency on fc is insignificant. In contrast, under breakage conditions, fc decreases progressively with increasing frequency, and the reduction becomes more significant when the frequency exceeds 20 Hz. When the frequency exceeds 20 Hz, micro breakage increases significantly and promotes the formation of more contacts within the sample. Moreover, compared with the non-breakage case, the relative difference of fc under breakage conditions is about 0.5% at 10–20 Hz, whereas it becomes −3.52% and −5.18% at 25 Hz and 30 Hz, respectively. This indicates that micro breakage has a more significant effect on fc than loading frequency alone.
Additionally, as shown in Figure 11d, fc gradually increases with amplitude under non-breakage conditions, indicating that increasing amplitude enhances the stress level within the sample. It is worth noting that a higher amplitude promotes micro breakage, whereas an increase in micro breakage leads to a reduction in fc. In other words, micro breakage and increasing amplitude affect fc in opposite ways. This leads to a trend in which fc initially increases and then decreases with increasing amplitude under breakage conditions. When the amplitude exceeds 120 kPa, corresponding to an LAA greater than 0.35%, the evolution of fc gradually shifts from being amplitude-dominated to micro breakage-dominated. In summary, micro breakage promotes densification-induced skeleton rearrangement and weakens the existing strong force-chain network. With the continuous accumulation of micro breakage during cyclic loading, this evolution from rearrangement with increased contacts to strong force-chain weakening further reduces the strength of the skeleton structure.

4.4. Macroscopic Response

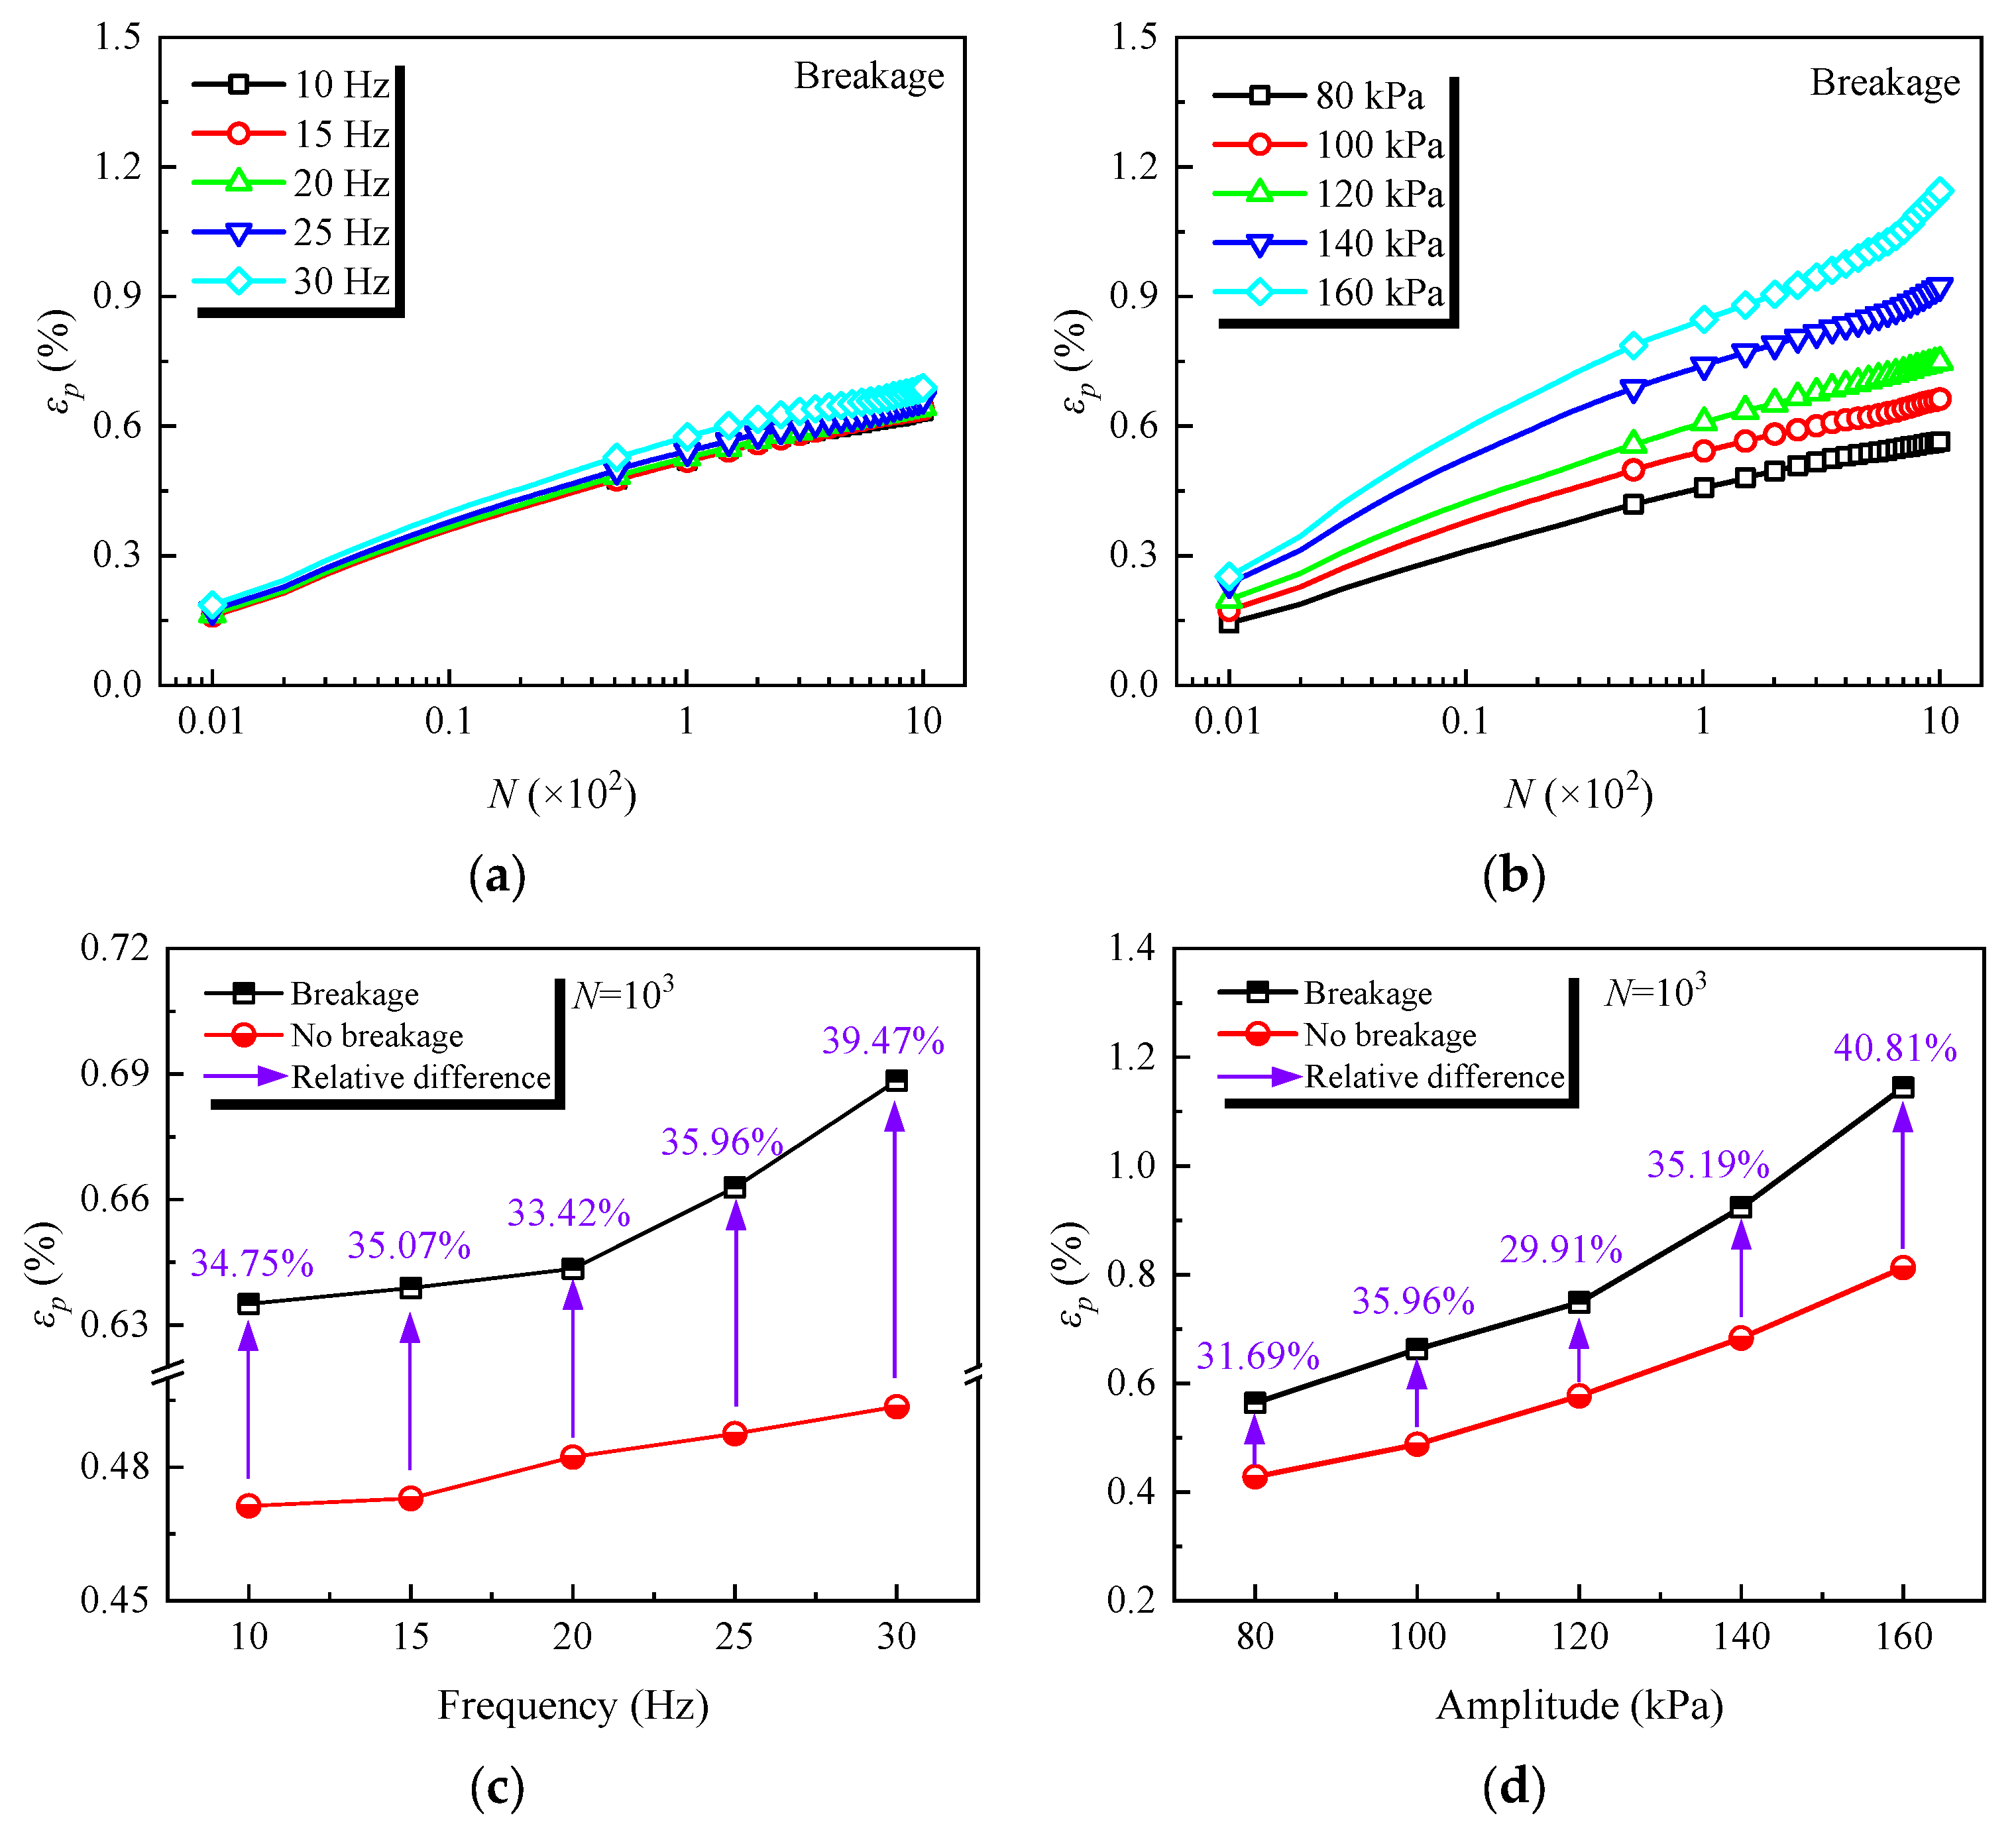
The plastic strain εp represents the accumulated irrecoverable deformation of the sample under cyclic loading and can be used to evaluate the performance of graded aggregates. As shown in Figure 12a,b, εp increases with N under different loading conditions, indicating the continuous accumulation of plastic deformation in the sample under cyclic loading. Compared with frequency, the effect of amplitude on εp is more significant, which is consistent with the mesoscopic evolution characteristics. Similarly, mesoscopic evolution indicates that micro breakage promotes particle rearrangement and new contact formation, while weakening the strong force-chain network. As a result, the skeleton structure progressively degrades during the simulated cyclic-loading stage and is reflected in the increase in εp.
As shown in Figure 12c,d, εp under both breakage and non-breakage conditions gradually increases with increasing frequency and amplitude. Compared with the non-breakage cases, εp is approximately 30–40% higher under breakage conditions. The relative difference increases with further increases in frequency and amplitude. This indicates that higher frequency and amplitude further enhance the promoting effect of micro breakage on skeleton rearrangement and the irrecoverable deformation accumulation. Moreover, the increase in εp indicates that the accumulated plastic deformation of graded aggregates continuously increases and the structural stability gradually decreases. This indicates that micro breakage accelerates the performance degradation of the graded aggregate skeleton, and this degradation becomes more significant at higher frequency and amplitude.

5. Discussion

To further clarify the intrinsic relationships between the micromechanical indicators and macroscopic deformation discussed in Section 4, Figure 13 illustrates the mechanism by which micro breakage induces the performance degradation of graded aggregates.
In the initial state, irregular coarse particles form a stable load-bearing skeleton through angular interlocking. Under cyclic loading, contact energy tends to concentrate at high-curvature corners and edges, gradually triggering local micro breakage. Micro breakage causes local particle-volume reduction, corner blunting, and particle rounding, thereby weakening the geometric constraints between particles and promoting particle sliding, rotation, and rearrangement. As the skeleton continues to adjust, the specimen becomes denser and develops more effective contacts, resulting in an increase in CN, while the distribution of the external load among a larger number of contacts reduces fc and promotes the weakening and redistribution of the original strong force chains. The resulting contact-network reconstruction and skeleton densification are irreversible, and their continued accumulation ultimately leads to an increase in plastic strain. Therefore, micro breakage first alters the local particle volume and morphology, then weakens particle interlocking and induces skeleton rearrangement, and finally promotes cyclic deformation accumulation and material degradation.
It should be noted that the energy-driven micro breakage method can describe particle corner spalling, particle rounding, and the resulting evolution of the contact network under cyclic loading. The current formulation still involves several assumptions and limitations that should be considered when interpreting the results. First, the contact overlap region is treated as an equivalent control volume representing the local high-energy zone, and its geometric scale does not correspond exactly to the actual spalled volume. Therefore, the method cannot reproduce actual crack propagation paths or irregular fracture surfaces. Second, the particle-shape updating scheme is mainly applicable to corner abrasion and local micro breakage, and its ability to represent severe fragmentation modes, such as through-going cracking, particle splitting, and large-fragment detachment, remains limited. In addition, breakage-generated fines are represented by equivalent local material loss, without explicitly considering their contacts, migration, or void-filling effects. Seepage, drainage, and pore-pressure evolution are also not included. Future work should incorporate explicit fragment generation, crack propagation, and fine-particle migration to extend the applicability of the method to severe fragmentation and hydro-mechanical coupling conditions.

6. Conclusions

This study develops an energy-driven DEM-based micro breakage method to investigate micro breakage of graded aggregates under cyclic loading and the resulting mesoscopic evolution and performance degradation. The proposed method enables continuous simulation of micro breakage and local particle shape evolution. Then, a series of dynamic triaxial simulations is conducted to investigate the micro breakage-induced mesoscopic evolution and macroscopic deformation of graded aggregates under different loading conditions. Based on the results obtained in this study, the main conclusions are summarized as follows.
(1)
An energy-driven micro breakage method applicable to irregular particles is proposed based on the energy balance and radial function r(θ, φ). The results of the single-particle test, Los Angeles abrasion test, and cyclic loading test indicate that the proposed method can reasonably reproduce the force–displacement response, representative micro breakage triggering behavior, LAA evolution, Rg evolution, and sample deformation.
(2)
The dynamic triaxial results indicate that micro breakage in graded aggregates exhibits a cumulative characteristic, with both LAA and Rg increasing with loading cycles N. Both higher loading frequency and amplitude promote micro breakage, while amplitude exerts a stronger effect. A larger amplitude mainly increases the instantaneous elastic energy in the contact, whereas a higher frequency mainly accelerates the accumulation of the cumulative breakage factor .
(3)
Micro breakage promotes particle rearrangement and new contact formation, while inducing skeleton densification and force-chain weakening in graded aggregates. This is reflected by the increase in coordination number CN and the decrease in average contact force fc. This mesoscopic evolution further increases plastic deformation accumulation and reduces the structural stability of graded aggregates during the simulated cyclic-loading stage.
(4)
Under the conditions considered in this study, 20 Hz is a critical frequency at which micro breakage in graded aggregates becomes significantly enhanced. When the frequency exceeds 20 Hz, the dynamic response of the sample increases significantly, resulting in greater plastic deformation. Accordingly, as train operating speeds increase, micro breakage may exert a greater influence on the cyclic degradation of graded aggregates.

Author Contributions

Conceptualization, X.X. and K.W.; methodology, X.X. and K.X.; software, X.X.; validation, X.X., Q.Z. and K.X.; formal analysis, X.X. and Q.Z.; investigation, X.X., Q.Z., K.X., S.Z. (Shengjun Zhang), T.D. and S.Z. (Shiqiang Zhang); resources, K.W. and K.X.; data curation, X.X. and Q.Z.; writing-original draft preparation, X.X.; writing-review and editing, K.W., Q.Z. and K.X.; visualization, X.X.; supervision, K.W.; project administration, K.W.; funding acquisition, K.W. All authors have read and agreed to the published version of the manuscript.

Funding

This research is supported by the National Natural Science Foundation of China (Grant Nos. 52508512, 52578482), the Hebei Natural Science Foundation (Grant Nos. E2025210083, E2024210103), the Basic Science (Natural Science) Research Project of Jiangsu Province Higher Education Institutions (Grant No. 25KJB082001), and the Foundation of Sichuan Provincial Engineering Research Center of Rail Transit Lines Smart Operation and Maintenance, Chengdu Vocational & Technical College of Industry (2025GD-C01).

Data Availability Statement

Data are contained within the article.

Conflicts of Interest

The authors declare no conflicts of interest.

Appendix A. Numerical Implementation of Coefficient Update (Discrete Quadrature and Projection)

A fixed quadrature point set O is selected on the unit sphere, as given in Equation (A1).
O = θ k , φ k , w k k = 1 N q
where (θk, φk) are the spherical coordinates of the kth quadrature point, Nq is the number of discrete quadrature points, wk is the corresponding surface-integration weight, satisfying Equation (A2).
k = 1 N q w k 4 π
Hence, ⟨Δr⟩ for an arbitrary spherical function can be approximated by discrete quadrature, as shown in Equation (A3).
Δ r 1 k = 1 N q w k k = 1 N q w k Δ r θ k , φ k
Then, for the coefficient increment Δ a n m of a n m (n ≥ 1), the continuous projection can be discretized using the approximation in Equation (A4).
Δ a n m k = 1 N q w k Δ r θ k , φ k Y n m θ k , φ k , n 1
To evaluate Equation (A4) efficiently as a single matrix-vector product, all coefficients with n ≥ 1 are first re-indexed by j (j = 1, 2, …, N>0), where N>0 = (Ns + 1)2 − 1. The spherical harmonic value matrix Y>0 and the diagonal weight matrix W are then established as shown in Equations (A5) and (A6).
Y > 0 N q N s , Y > 0 k , j = Y j θ k , φ k
W = diag w 1 , w 2 , , w N q
Accordingly, the coefficient increments vector Δa>0 and the radial correction vector Δr(θ, φ) are defined by Equations (A7) and (A8), respectively.
Δ a > 0 = Δ a 1 , Δ a 2 , , Δ a N > 0 T
Δ r θ , φ = Δ r θ 1 , φ 1 , Δ r θ 2 , φ 2 , , Δ r θ N q , φ N q T
As a result, Equation (A4) can then be written as Equation (A9).
Δ a > 0 = Y > 0 T W Δ r θ , φ
It is worth noting that Y>0 and W remain fixed throughout the simulation, and the matrix B can be computed before the calculation starts, as given in Equation (A10).
B = Y > 0 T W N > 0 N q
The Δa>0 for each micro breakage event requires only a single matrix-vector multiplication, as given in Equation (A11).
Δ a > 0 = B Δ r θ , φ
Finally, the updated coefficient vector a*>0 is obtained by Equation (A12).
a > 0 = a > 0 Δ a

References

  1. Rondón-Quintana, H.A.; Bastidas-Martínez, J.G.; Reyes-Lizcano, F.A. Permanent deformation of unbound granular materials: A review. J. Traffic Transp. Eng. Engl. Ed. 2025, 12, 1228–1253. [Google Scholar] [CrossRef] [Scilit]
  2. Ye, Y.; Cai, D.; Yao, J.; Wei, S.; Yan, H.; Chen, F. Review on dynamic modulus of coarse-grained soil filling for high-speed railway subgrade. Transp. Geotech. 2021, 27, 100421. [Google Scholar] [CrossRef] [Scilit]
  3. Zhang, F.; Wang, T.; Bu, J.; Yin, Z. Dynamic behaviors of coarse granular aggregates in high-speed railway subgrades. Soil Dyn. Earthq. Eng. 2022, 152, 107046. [Google Scholar] [CrossRef] [Scilit]
  4. Shi, C.; Fan, Z.; Connolly, D.P.; Jing, G.; Markine, V.; Guo, Y. Railway ballast performance: Recent advances in the understanding of geometry, distribution and degradation. Transp. Geotech. 2023, 41, 101042. [Google Scholar] [CrossRef] [Scilit]
  5. Indraratna, B.; Lackenby, J.; Christie, D. Effect of confining pressure on the degradation of ballast under cyclic loading. Géotechnique 2005, 55, 325–328. [Google Scholar] [CrossRef]
  6. Chen, J.; Vinod, J.S.; Indraratna, B.; Ngo, N.T.; Gao, R.; Liu, Y. A discrete element study on the deformation and degradation of coal-fouled ballast. Acta Geotech. 2022, 17, 3977–3993. [Google Scholar] [CrossRef] [Scilit]
  7. Cui, G.Y.; Zou, D.G.; Ning, F.W.; Liu, J.M.; Li, D.; Tian, S.L.; Han, M.S. Coupled effect of particle shape and particle breakage on strength-dilatancy and critical state behaviors of coarse-grained soils. Acta Geotech. 2025, 21, 2099–2114. [Google Scholar] [CrossRef] [Scilit]
  8. Krengel, D.; Jiang, H.R.; Chen, J.; Matsushima, T. The combined effect of particle angularity and inter-particle friction on micro- and macroscopic properties of granular assemblies. Comput. Geotech. 2025, 177, 106850. [Google Scholar] [CrossRef] [Scilit]
  9. Chen, J.; Indraratna, B.; Vinod, J.S.; Ngo, T.; Liu, Y. Discrete element modelling of the effects of particle angularity on the deformation and degradation behaviour of railway ballast. Transp. Geotech. 2023, 43, 101154. [Google Scholar] [CrossRef] [Scilit]
  10. Xiao, X.P.; Xie, K.; Li, X.Z.; Hao, Z.R.; Li, T.F.; Deng, Z.X. Macro- and micro-deterioration mechanism of high-speed railway graded gravel filler during vibratory compaction. Constr. Build. Mater. 2023, 409, 134043. [Google Scholar] [CrossRef] [Scilit]
  11. Ding, H.; Han, Z.; Li, Y.; Xie, W.; Fu, B.; Li, C.; Zhao, L. Particle breakage and its mechanical response in granular soils: A review and prospect. Constr. Build. Mater. 2023, 409, 133948. [Google Scholar] [CrossRef] [Scilit]
  12. Altuhafi, F.N.; Coop, M.R. Changes to particle characteristics associated with the compression of sands. Géotechnique 2011, 61, 459–471. [Google Scholar] [CrossRef] [Scilit]
  13. Sadrekarimi, A.; Olson, S.M. Particle damage observed in ring shear tests on sands. Can. Geotech. J. 2010, 47, 497–515. [Google Scholar] [CrossRef] [Scilit]
  14. Qian, Y.; Boler, H.; Moaveni, M.; Tutumluer, E.; Hashash, Y.M.A.; Ghaboussi, J. Degradation-related changes in ballast gradation and aggregate particle morphology. J. Geotech. Geoenviron. Eng. 2017, 143, 04017032. [Google Scholar] [CrossRef] [Scilit]
  15. Sun, Y.; Zheng, C. Breakage and shape analysis of ballast aggregates with different size distributions. Particuology 2017, 35, 84–92. [Google Scholar] [CrossRef] [Scilit]
  16. Indraratna, B.; Ngo, T.; Rujikiatkamjorn, C. Performance of ballast influenced by deformation and degradation: Laboratory testing and numerical modeling. Int. J. Geomech. 2020, 20, 04019138. [Google Scholar] [CrossRef] [Scilit]
  17. Deiros Quintanilla, I.; Combe, G.; Emeriault, F.; Voivret, C.; Ferellec, J.F. X-ray CT analysis of the evolution of ballast grain morphology along a Micro-Deval test: Key role of the asperity scale. Granul. Matter 2019, 21, 30. [Google Scholar] [CrossRef] [Scilit]
  18. Bian, X.; Shi, K.; Li, W.; Luo, X.; Tutumluer, E.; Chen, Y. Quantification of railway ballast degradation by abrasion testing and computer-aided morphology analysis. J. Mater. Civ. Eng. 2021, 33, 04020411. [Google Scholar] [CrossRef] [Scilit]
  19. Wang, J.Q.; Zhang, T.Y.; Dong, C.F.; Tang, Y. Quantifying railway ballast degradation through repeated large-scale direct shear tests and three-dimensional morphological analysis. Int. J. Geomech. 2025, 25, 04025017. [Google Scholar] [CrossRef] [Scilit]
  20. Xiao, X.P.; Xie, K.; Li, X.Z.; Li, T.F.; Deng, Z.X.; Hao, Z.R.; Huang, Y.S. Deterioration micro-mechanism of graded aggregates with different gradations under vibratory compaction using X-CT testing. Measurement 2024, 235, 114938. [Google Scholar] [CrossRef] [Scilit]
  21. Xie, K.; Li, T.F.; Zhao, Y.M.; Chen, X.B.; Zhang, Q.L. Microstructure evolution of coarse-grained soil fillers during subgrade compaction-operation period based on CT technology. Transp. Geotech. 2024, 47, 101279. [Google Scholar] [CrossRef] [Scilit]
  22. Qu, T.; Wang, M.; Feng, Y. Applicability of discrete element method with spherical and clumped particles for constitutive study of granular materials. J. Rock Mech. Geotech. Eng. 2022, 14, 240–251. [Google Scholar] [CrossRef] [Scilit]
  23. Guo, N.; Zhao, J. The signature of shear-induced anisotropy in granular media. Comput. Geotech. 2013, 47, 1–15. [Google Scholar] [CrossRef] [Scilit]
  24. Kruyt, N.P. On weak and strong contact force networks in granular materials. Int. J. Solids Struct. 2016, 92–93, 135–140. [Google Scholar] [CrossRef] [Scilit]
  25. Aela, P.; Powrie, W.; Harkness, J.; Jing, G. Discrete element modelling of railway ballast problems: An overview. Arch. Comput. Methods Eng. 2025, 32, 2149–2185. [Google Scholar] [CrossRef] [Scilit]
  26. Ngo, T.; Indraratna, B.; Coop, M.; Qi, Y. Behaviour of ballast stabilised with recycled rubber mat under impact loading. Géotechnique 2025, 75, 192–212. [Google Scholar] [CrossRef] [Scilit]
  27. Chen, J.; Indraratna, B.; Coop, M.R.; Ngo, T.; Kelly, R. Impact of particle degradation on repose angle of railway ballast: Insights from experimental and DEM analysis. Géotechnique 2025, 76, 273–289. [Google Scholar] [CrossRef] [Scilit]
  28. Guo, Y.L.; Markine, V.; Song, J.N.; Jing, G.Q. Ballast degradation: Effect of particle size and shape using Los Angeles Abrasion test and image analysis. Constr. Build. Mater. 2018, 169, 414–424. [Google Scholar] [CrossRef] [Scilit]
  29. Zhang, Z.T.; Gao, W.H.; Wang, X.; Zhang, J.Q.; Tang, X.Y. Degradation-induced evolution of particle roundness and its effect on the shear behaviour of railway ballast. Transp. Geotech. 2020, 24, 100388. [Google Scholar] [CrossRef] [Scilit]
  30. de Bono, J.; McDowell, G. Particle breakage criteria in discrete-element modelling. Géotechnique 2016, 66, 1014–1027. [Google Scholar] [CrossRef] [Scilit]
  31. Harmon, J.M.; Arthur, D.; Andrade, J.E. Level set splitting in DEM for modeling breakage mechanics. Comput. Methods Appl. Mech. Eng. 2020, 365, 112961. [Google Scholar] [CrossRef] [Scilit]
  32. Cheng, Y.P.; Nakata, Y.; Bolton, M.D. Discrete element simulation of crushable soil. Géotechnique 2003, 53, 633–641. [Google Scholar] [CrossRef]
  33. Liu, Y.; Liu, H.; Mao, H. DEM investigation of the effect of intermediate principle stress on particle breakage of granular materials. Comput. Geotech. 2017, 84, 58–67. [Google Scholar] [CrossRef] [Scilit]
  34. Zhou, W.; Wang, D.; Ma, G.; Cao, X.; Hu, C.; Wu, W. Discrete element modeling of particle breakage considering different fragment replacement modes. Powder Technol. 2020, 360, 312–323. [Google Scholar] [CrossRef] [Scilit]
  35. Tavares, L.M.; das Chagas, A.S. A stochastic particle replacement strategy for simulating breakage in DEM. Powder Technol. 2021, 377, 222–232. [Google Scholar] [CrossRef] [Scilit]
  36. Kalman, H.; Rodnianski, V.; Haim, M. A new method to implement comminution functions into DEM simulation of a size reduction system due to particle-wall collisions. Granul. Matter 2009, 11, 253–266. [Google Scholar] [CrossRef] [Scilit]
  37. de Bono, J.; Li, H.; McDowell, G. A new abrasive wear model for railway ballast. Soils Found. 2020, 60, 714–721. [Google Scholar] [CrossRef] [Scilit]
  38. Xiao, Y.; Tan, P.; Wang, M.; Hua, W.; Wang, X.; Peng, Y. A novel energy-based particle breakage criterion considering coordination number effect in discrete element modeling. Comput. Geotech. 2024, 173, 106488. [Google Scholar] [CrossRef] [Scilit]
  39. Wu, Y.; Yamamoto, H.; Cui, J.; Cheng, H. Influence of load mode on particle crushing characteristics of silica sand at high stresses. Int. J. Geomech. 2020, 20, 04019194. [Google Scholar] [CrossRef] [Scilit]
  40. Xie, C.H.; Ma, H.Q.; Zhao, Y.Z. Investigation of modeling non-spherical particles by using spherical discrete element model with rolling friction. Eng. Anal. Bound. Elem. 2019, 105, 207–220. [Google Scholar] [CrossRef] [Scilit]
  41. Wensrich, C.M.; Katterfeld, A. Rolling friction as a technique for modelling particle shape in DEM. Powder Technol. 2012, 217, 409–417. [Google Scholar] [CrossRef] [Scilit]
  42. Soltanbeigi, B.; Podlozhnyuk, A.; Kloss, C.; Pirker, S.; Ooi, J.Y.; Papanicolopulos, S.A. Influence of various DEM shape representation methods on packing and shearing of granular assemblies. Granul. Matter 2021, 23, 26. [Google Scholar] [CrossRef] [Scilit]
  43. Ali, U.; Kikumoto, M. Rolling resistance as a surrogate for angularity in DEM: Macromechanical potentials and micromechanical limitations. Comput. Geotech. 2026, 192, 107919. [Google Scholar] [CrossRef] [Scilit]
  44. Wang, X.; Yin, Z.Y.; Xiong, H.; Su, D.; Feng, Y.T. A spherical-harmonic-based approach to discrete element modeling of 3D irregular particles. Int. J. Numer. Methods Eng. 2021, 122, 5626–5655. [Google Scholar] [CrossRef] [Scilit]
  45. Capozza, R.; Hanley, K.J. A hierarchical, spherical harmonic-based approach to simulate abradable, irregularly shaped particles in DEM. Powder Technol. 2021, 378, 528–537. [Google Scholar] [CrossRef] [Scilit]
  46. Gao, J.B.; Ling, D.S.; Tu, F.B. Simulation of brittle particle breakage using a spherical harmonic-based discrete element method. Comput. Geotech. 2026, 193, 107972. [Google Scholar] [CrossRef] [Scilit]
  47. Gurtin, M.E.; Fried, E.; Anand, L. The Mechanics and Thermodynamics of Continua; Cambridge University Press: Cambridge, UK, 2010. [Google Scholar] [CrossRef] [Scilit]
  48. Xiao, X.P.; Zhang, H.C.; Xie, K.; Cheng, Z.B.; Zhang, Q.; Li, T.F.; Zheng, J.Y. Investigation of morphology-dependent breakage behavior in graded aggregates under traffic loading via DEM. Comput. Geotech. 2026, 191, 107843. [Google Scholar] [CrossRef] [Scilit]
  49. Griffith, A.A. The phenomena of rupture and flow in solids. Philos. Trans. R. Soc. Lond. Ser. A 1921, 221, 163–198. [Google Scholar] [CrossRef] [Scilit]
  50. Lu, G.; Third, J.R.; Müller, C.R. Discrete element models for non-spherical particle systems: From theoretical developments to applications. Chem. Eng. Sci. 2015, 127, 425–465. [Google Scholar] [CrossRef] [Scilit]
  51. Ferellec, J.F.; McDowell, G.R. A method to model realistic particle shape and inertia in DEM. Granul. Matter 2010, 12, 459–467. [Google Scholar] [CrossRef] [Scilit]
  52. Zhan, L.; Peng, C.; Zhang, B.; Wu, W. A surface mesh represented discrete element method (SMR-DEM) for particles of arbitrary shape. Powder Technol. 2021, 377, 760–779. [Google Scholar] [CrossRef] [Scilit]
  53. Cundall, P.A.; Strack, O.D.L. A discrete numerical model for granular assemblies. Géotechnique 1979, 29, 47–65. [Google Scholar] [CrossRef] [Scilit]
  54. Johnson, K.L. Contact Mechanics; Cambridge University Press: Cambridge, UK, 1985. [Google Scholar] [CrossRef] [Scilit]
  55. Ai, J.; Chen, J.F.; Rotter, J.M.; Ooi, J.Y. Assessment of rolling resistance models in discrete element simulations. Powder Technol. 2011, 206, 269–282. [Google Scholar] [CrossRef] [Scilit]
  56. Colombo, A.; Cusano, C.; Schettini, R. 3D face detection using curvature analysis. Pattern Recognit. 2006, 39, 444–455. [Google Scholar] [CrossRef] [Scilit]
  57. Banchoff, T.F.; Lovett, S.T. Differential Geometry of Curves and Surfaces, 2nd ed.; Chapman and Hall/CRC: Boca Raton, FL, USA, 2016. [Google Scholar] [CrossRef] [Scilit]
  58. Zhou, B.; Wang, J.; Wang, H. Three-dimensional sphericity, roundness and fractal dimension of sand particles. Géotechnique 2018, 68, 18–30. [Google Scholar] [CrossRef] [Scilit]
  59. Chen, Y.; Zhang, L.; Xu, L.; Zhou, S.; Zhang, P.; Chen, Z. Investigation on crushing behavior and cumulative deformation prediction of slag under cyclic loading. Transp. Geotech. 2023, 41, 100994. [Google Scholar] [CrossRef] [Scilit]
  60. Wang, T.; Wautier, A.; Tang, C.S.; Nicot, F. 3D DEM simulations of cyclic loading-induced densification and critical state convergence in granular soils. Comput. Geotech. 2024, 173, 106559. [Google Scholar] [CrossRef] [Scilit]
  61. Chen, W.B.; Yin, J.H.; Feng, W.Q.; Borana, L.; Chen, R.P. Accumulated permanent axial strain of a subgrade fill under cyclic high-speed railway loading. Int. J. Geomech. 2018, 18, 04018018. [Google Scholar] [CrossRef] [Scilit]
  62. Li, X.Z.; Xiao, X.P.; Xie, K.; Yang, H.F.; Xu, L.; Li, T.F. A generalizable parameter calibration framework for discrete element method and application in the compaction of red-bed soft rocks. Constr. Build. Mater. 2024, 444, 137734. [Google Scholar] [CrossRef] [Scilit]
  63. Indraratna, B.; Thakur, P.K.; Vinod, J.S. Experimental and numerical study of railway ballast behavior under cyclic loading. Int. J. Geomech. 2010, 10, 136–144. [Google Scholar] [CrossRef] [Scilit]
  64. Sun, Q.D.; Indraratna, B.; Nimbalkar, S. Effect of cyclic loading frequency on the permanent deformation and degradation of railway ballast. Géotechnique 2014, 64, 746–751. [Google Scholar] [CrossRef] [Scilit]
Figure 1. Schematic illustration of the energy-based criterion for micro breakage in DEM: (a) Micro breakage definition and (b) Energy transformation in contact.
Infrastructures 11 00264 g001
Figure 2. Schematic illustration of the equivalent calculation scheme based on a ball carrier and radial-function-based contact stiffness correction.
Infrastructures 11 00264 g002
Figure 3. Geometric representation of micro breakage through radial function updating.
Infrastructures 11 00264 g003
Figure 4. Numerical model: (a) Model setup and (b) Loading.
Infrastructures 11 00264 g004
Figure 5. Verification tests: (a) Single-particle test, (b) Los Angeles abrasion test, and (c) Cyclic loading test.
Infrastructures 11 00264 g005
Figure 6. Quantitative validation results: (a) Force-displacement responses in single-particle compression tests, (b) Displacement errors at representative micro breakage triggering points, (c) Force errors at representative micro breakage triggering points, (d) LAA evolution in the Los Angeles abrasion test, (e) Displacement evolution during cyclic loading, (f) CDFs of Rg during cyclic loading; and (g) Representative X-ray CT slices at different normalized specimen heights after 50 s and 350 s of cyclic loading.
Infrastructures 11 00264 g006
Figure 7. Sensitivity analysis of key parameters in the single-particle test: (a) G, (b) Gc, (c) d, (d) Ns, (e) Nq, and (f) Δt.
Infrastructures 11 00264 g007
Figure 8. Effects of loading parameters on LAA: (a) Frequency and (b) Amplitude.
Infrastructures 11 00264 g008
Figure 9. Effects of loading parameters on Rg: (a) Frequency and (b) Amplitude.
Infrastructures 11 00264 g009
Figure 10. Effects of loading parameters on CN: (a) Frequency under breakage conditions, (b) Amplitude under breakage conditions, (c) Relationship between frequency and CN, and (d) Relationship between amplitude and CN.
Infrastructures 11 00264 g010
Figure 11. Effects of loading parameters on fc: (a) Frequency under breakage conditions, (b) Amplitude under breakage conditions, (c) Relationship between frequency and fc, and (d) Relationship between amplitude and fc.
Infrastructures 11 00264 g011aInfrastructures 11 00264 g011b
Figure 12. Effects of loading parameters on εp: (a) Frequency under breakage conditions, (b) Amplitude under breakage conditions, (c) Relationship between frequency and εp, and (d) Relationship between amplitude and εp.
Infrastructures 11 00264 g012
Figure 13. Schematic illustration of the micro breakage-induced degradation mechanism of graded aggregates under cyclic loading.
Infrastructures 11 00264 g013
Table 1. Comparison of κmax distribution and identified corner-edge regions between the real particle shape and r(θ, φ).
No.Indicators
Shapeκmaxg(κ)
1RealInfrastructures 11 00264 i001Infrastructures 11 00264 i002Infrastructures 11 00264 i003Infrastructures 11 00264 i004
r(θ, φ)Infrastructures 11 00264 i005Infrastructures 11 00264 i006Infrastructures 11 00264 i007
2RealInfrastructures 11 00264 i008Infrastructures 11 00264 i009Infrastructures 11 00264 i010Infrastructures 11 00264 i011
r(θ, φ)Infrastructures 11 00264 i012Infrastructures 11 00264 i013Infrastructures 11 00264 i014
3RealInfrastructures 11 00264 i015Infrastructures 11 00264 i016Infrastructures 11 00264 i017Infrastructures 11 00264 i018
r(θ, φ)Infrastructures 11 00264 i019Infrastructures 11 00264 i020Infrastructures 11 00264 i021
4RealInfrastructures 11 00264 i022Infrastructures 11 00264 i023Infrastructures 11 00264 i024Infrastructures 11 00264 i025
r(θ, φ)Infrastructures 11 00264 i026Infrastructures 11 00264 i027Infrastructures 11 00264 i028
5RealInfrastructures 11 00264 i029Infrastructures 11 00264 i030Infrastructures 11 00264 i031Infrastructures 11 00264 i032
r(θ, φ)Infrastructures 11 00264 i033Infrastructures 11 00264 i034Infrastructures 11 00264 i035
Table 2. Contact parameters used in the dynamic triaxial simulation of graded aggregates.
TypeParameterSymbolValueUnitSource
GlobalParticle Densityρ2750kg/m3Material test
DampDa0.5Numerical calibration
Numerical settingTime stepΔt1 × 10−6sStability analysis
ContactParticle to particle
(RRHertz)
Shear modulusG5 × 108PaSingle-particle and triaxial tests
Poisson’s ratioν0.25Material property
Friction coefficientf0.5Repose angle tests
Rolling resistance coefficientfr0.2
Normal damping ratiodp,n0.27Ball drop test
Shear damping ratiodp,s0.27
Particle to boundary
(Linear)
Normal stiffnesskn1 × 108PaBoundary material property
Tangential stiffnessks0.85 × 108Pa
Friction coefficientfw0.21Inclined plane test
Normal damping ratioβnw0.62Ball drop test
Tangential damping ratioβsw0.62
Micro breakageSH truncation orderNs20Reconstruction accuracy
Discrete quadrature pointsNq3200Convergence analysis
SH coefficients a n m Reconstructed geometries
Critical breakage energy per unit areaGc1.0 × 104J/m2Single-particle test
Minimum breakable radiusrb,min2mm
Initial cumulative breakage factor00Initial condition
Disclaimer/Publisher’s Note: The statements, opinions and data contained in all publications are solely those of the individual author(s) and contributor(s) and not of MDPI and/or the editor(s). MDPI and/or the editor(s) disclaim responsibility for any injury to people or property resulting from any ideas, methods, instructions or products referred to in the content.