1. Introduction
Road transport serves as a fundamental component of modern mobility, facilitating economic growth and social connectivity. However, the increasing reliance on private vehicles has escalated concerns regarding road safety. According to the World Health Organization (WHO), road traffic crashes represent a leading global cause of mortality, accounting for approximately 1.19 million fatalities annually [
1]. Beyond human casualties, the economic implications of road accidents are significant, encompassing medical expenses, productivity losses, and infrastructure damage. These challenges underscore the urgency for effective and data-driven interventions in road safety.
Empirical evidence consistently attributes the majority of road traffic crashes to human error, with estimates suggesting that 90–95% of collisions result from driver-related factors [
2,
3]. Risky driving behavior, including excessive speeding, abrupt lane changes, traffic violations, distracted driving, fatigue, and impaired driving, substantially elevates crash risks. Addressing these behavioral risks necessitates robust predictive frameworks capable of accurately detecting hazardous driving patterns and enabling timely interventions.
The advent of artificial intelligence (AI) and machine learning (ML) technologies has introduced novel approaches for road safety assessment. In particular, deep learning techniques have demonstrated remarkable efficacy in classifying driver behavior and predicting crash risks by leveraging large-scale naturalistic driving datasets. However, despite their predictive capabilities, deep learning models often function as “black boxes,” limiting their interpretability and impeding their widespread adoption in safety-critical applications. Ensuring model transparency and explainability is essential for fostering trust among policymakers, automotive manufacturers, and end-users.
Furthermore, driver behavior is influenced by a complex interplay of cognitive, environmental, and infrastructural factors. Psychological aspects such as reaction time, attention allocation, and risk perception directly affect driving decisions, while external stressors, including traffic congestion, road conditions, and weather patterns, modulate overall driving behavior. Consequently, predictive models must integrate both behavioral and contextual variables to enhance their practical applicability.
This study aims to address existing research gaps by developing and evaluating hybrid machine learning models designed to classify risky driving behaviors with enhanced accuracy and interpretability. Utilizing naturalistic driving data from Belgium and the United Kingdom, this research applies three hybrid modeling techniques: Deep Neural Network-Random Forest (DNN-RF), Convolutional Neural Network-Long Short-Term Memory (CNN-LSTM), and Recurrent Neural Network-AdaBoost (RNN-AdaBoost). The integration of Local Interpretable Model-agnostic Explanations (LIME) further enhances model transparency, offering insights into the relative importance of key driving features, such as speed variability, acceleration patterns, and trip duration.
The structure of this paper is as follows:
Section 2 presents a critical review of existing literature on driving behavior classification, machine learning applications, and interpretability techniques.
Section 3 outlines the research methodology, detailing the data collection process, feature engineering, and model development.
Section 4 provides a comprehensive analysis of the experimental results, highlighting model performance metrics and key findings.
Section 5 discusses the broader implications of this research, including applications in driver assistance systems and road safety policymaking, as well as limitations and directions for future work. Finally,
Section 6 concludes with recommendations for advancing hybrid ML approaches in driving behavior classification.
By bridging the gap between predictive accuracy and model interpretability, this research contributes to the growing body of knowledge on AI-driven road safety interventions. The findings offer valuable insights for developing targeted risk mitigation strategies and enhancing the integration of intelligent transportation systems in real-world driving environments.
2. Literature Review
Understanding and predicting risky driving behavior has been a key focus in transportation safety research, with various methodologies employed to assess driver risk. Traditional approaches include survey-based analyses, accident data modeling, driving simulator experiments, and naturalistic driving studies (NDS). Among these, NDS data provide real-world insights into driver behavior by capturing continuous, high-resolution information on driving patterns. This makes them particularly valuable for developing machine learning models capable of identifying dangerous driving behaviors and supporting real-time safety interventions.
One of the fundamental challenges in driving risk assessment is defining and quantifying risk indicators. Studies have widely used Time-to-Collision (TTC) and other safety metrics to evaluate the likelihood of crashes [
4]. However, machine learning and deep learning techniques have increasingly been applied to improve the predictive accuracy of driver behaviour classification models. For instance, Wang et al. (2010) [
5] proposed a semi-supervised learning algorithm that integrated labeled and unlabeled data to generate risk-level classifications. Their approach reduced training time while improving prediction accuracy; however, its reliance on binary classification (safe vs. unsafe) may not fully capture the nuanced spectrum of driving risk.
Naji et al. (2022) [
6] explore near-crash risk classification using machine and deep learning models applied to naturalistic driving data. The study employs hierarchical clustering to categorize near-crash events based on key driving risk factors, such as acceleration, braking pressure, and time headway. Adaptive lasso regression is used for feature selection, refining the dataset to significant predictors of driving risk. The results indicate that deep learning models, particularly Long Short-Term Memory (LSTM), outperform traditional machine learning approaches, achieving 96% accuracy. These findings emphasize the effectiveness of deep learning in real-time driver behaviour monitoring and support its integration into intelligent transportation systems for proactive crash prevention.
The study by Lee & Chang (2025) [
7] employs deep learning models for driving risk classification, focusing on time-series neural networks. The key models used include Long Short-Term Memory (LSTM), which is designed to handle sequential data and long-term dependencies; Bidirectional LSTM (Bi-LSTM), which processes input sequences in both forward and backward directions to capture more contextual information; and Gated Recurrent Unit (GRU), a simplified variant of LSTM that reduces computational complexity while maintaining performance. To benchmark these models, the study also compares them with traditional machine learning models, including Logistic Regression, Random Forest, and XGBoost. The findings indicate that Bi-LSTM with static journey features (SJF) achieves the highest performance, with a weighted F1-score of 0.932, significantly outperforming the baseline models.
Recent research has leveraged deep learning techniques and hybrid models to refine risk classification. Ping et al. 2019 [
8] examined the relationship between driving behavior and fuel consumption, proposing a two-stage machine learning framework utilizing unsupervised clustering and LSTM networks to categorize drivers based on fuel efficiency. Similarly, Shi et al. (2019) [
9] introduced a feature selection framework using unsupervised learning to classify drivers into different risk levels, highlighting the importance of identifying key predictive variables to enhance model accuracy.
Beyond driving behavior, research has also explored demographic and psychological influences on risk. Song et al. (2021) [
10] used Structural Equation Modeling (SEM) to investigate relationships between age, gender, risk perception, and driving behavior, subsequently developing a Random Forest-based classification model to distinguish between low-, medium-, and high-risk drivers. These insights suggest that a combination of behavioral, environmental, and psychological factors should be considered in predictive modeling for improved risk assessment.
Incorporating real-time risk prediction, Shangguan et al. (2021) [
11] developed a four-level risk classification framework using speed variation, headway distance, and acceleration patterns as key features. Their study demonstrated the potential of machine learning-driven risk assessment for real-time driver monitoring and intervention strategies. Through the i-DREAMS project, Yang et al. (2022) [
12] further explored safety classification using simulator-based driving data and clustering algorithms to define distinct safety levels, comparing various machine learning classifiers for effectiveness.
With the rise of autonomous driving technologies, deep learning models have gained traction in aggressive driving classification. Kwon et al. (2021) [
13] developed a hybrid CNN-LSTM model to classify driving behavior into defensive, normal, and aggressive categories, integrating their approach into a V2X-based driver behavior sharing system. Similarly, Yang et al. (2022) [
12] validated a real-time driver safety classification framework through driving simulator experiments, utilizing Support Vector Machines (SVM), decision trees, and Naïve Bayes classifiers for risk prediction. Despite these advancements, one of the most significant challenges remains the black-box nature of deep learning models. While techniques such as CNNs, RNNs, and LSTMs have demonstrated high accuracy, their lack of interpretability limits their practical application in safety-critical domains. Addressing this, researchers have explored interpretable AI techniques such as Local Interpretable Model-Agnostic Explanations (LIME) to enhance transparency in machine learning decision-making processes.
Malik et al. (2022) [
14] investigate driver behavior classification using neural network algorithms, analyzing key parameters such as acceleration, braking, and steering angles. Their model, achieving 90% accuracy with logistic regression, demonstrates the effectiveness of machine learning in identifying risky driving patterns. By integrating real-world data, the study surpasses traditional heuristic-based approaches, offering a more robust framework for behavioral analysis. The findings underscore the potential of AI-driven monitoring systems in enhancing road safety and developing targeted interventions for accident prevention.
Building upon existing research, the present study integrates hybrid deep learning models with interpretability techniques to enhance risky driving behavior classification. By leveraging naturalistic driving data from Belgium and the UK, and developing DNN-RF, CNN-LSTM, and RNN-AdaBoost models, this research aims to improve both predictive performance and transparency in risk classification. Through the integration of LIME-based explanations, the study seeks to bridge the gap between model accuracy and interpretability, ensuring practical application in real-world road safety initiatives.
While significant progress has been made in predictive modeling for driving risk assessment, challenges related to interpretability and real-time applicability remain. The proposed research addresses these gaps by integrating hybrid deep learning models with explainability frameworks. In the following section, we outline the methodological approach, detailing the data sources, feature selection process, and machine learning techniques used to develop an interpretable and high-performing risk classification model.
This literature review has highlighted the evolution of driving behaviour classification methodologies, from traditional approaches to cutting-edge machine learning techniques. While significant progress has been made in predictive modeling, challenges related to interpretability and real-time applicability remain. The proposed research aims to address these gaps by integrating hybrid deep learning models with explainability frameworks, contributing to the development of more reliable and interpretable risk classification models in transportation safety.
3. Materials and Methods
3.1. Data Collection
The dataset analyzed in this study was collected within the European Horizon 2020 i-DREAMS Project, which aimed to define, develop, test, and validate a context-aware driving safety envelope, the Safety Tolerance Zone (STZ), supported by a smart Driver–Vehicle–Environment assessment and monitoring system. The STZ concept describes driving as a dynamic three-state safety envelope (Normal, Danger, Avoidable Accident) and is used as a trigger for both real-time and post-trip interventions. Within the i-DREAMS framework, monitoring relies on continuous measurements related to the context, operator, and vehicle, which are processed to infer task demand and coping capacity and to determine the current STZ state over time [
15].
As part of the i-DREAMS research project, a naturalistic driving experiment was conducted with participants from Belgium (coordinated by UHasselt/IMOB) and the UK (coordinated by Loughborough University), in the period between April 2021–November 2021. For the Belgian cohort, the study included 54 drivers, resulting in a large dataset consisting of 3100 trips and 48,688 min of driving data. In the UK, 26 drivers were involved, resulting in 2200 trips and 37,600 min of recorded driving time. Not every interval could be assigned an STZ label. Labelling requires a valid time headway measurement, which the Mobileye system records only when a preceding vehicle is detected within range; intervals during which no lead vehicle was present therefore yield no reading and cannot be labelled. On this basis, 6952 Belgian and 3934 UK intervals were excluded, leaving 90,424 and 71,267 labelled intervals respectively. Their distribution across the three STZ levels is 68,472 Normal (75.72%), 17,165 Dangerous (18.98%) and 4787 Avoidable Accident (5.29%) for Belgium, and 53,942 Normal (75.69%), 13,960 Dangerous (19.59%) and 3365 Avoidable Accident (4.72%) for the United Kingdom. The 80/20 hold-out split accordingly yields test sets of 18,084 and 14,253 intervals. The experiment was designed to collect comprehensive data on driving behavior and road environments, facilitating an in-depth analysis of dangerous driving behaviors. Participant recruitment and selection followed the i-DREAMS on-road field-trial protocol. For the passenger-car trials, the protocol targeted a spread across four age groups (18–25, 26–45, 46–64, 65+), with a recommended minimum of 40% representation per gender. In order to ensure sufficient exposure for naturalistic data collection, a minimum annual mileage of approximately 10,000 km was recommended for the principal driver, with a mixed driving pattern across urban, rural, and motorway environments (at least 20% of annual mileage in each road type, where feasible). Participants were selected within an approximately one-hour travel radius from the field-trial base to facilitate installation/de-installation and technical support. Additional participation constraints included no planned vehicle change during the trial period and availability of a smartphone to access the i-DREAMS coaching application. Recruitment was conducted locally by each trial site using multiple channels (e.g., partner databases, motorist clubs, media/social media, and fleet contacts), with targeted recruitment used when needed to meet the desired subgroups; eligibility was checked through a recruitment questionnaire and standardized entry/exit questionnaires [
16].
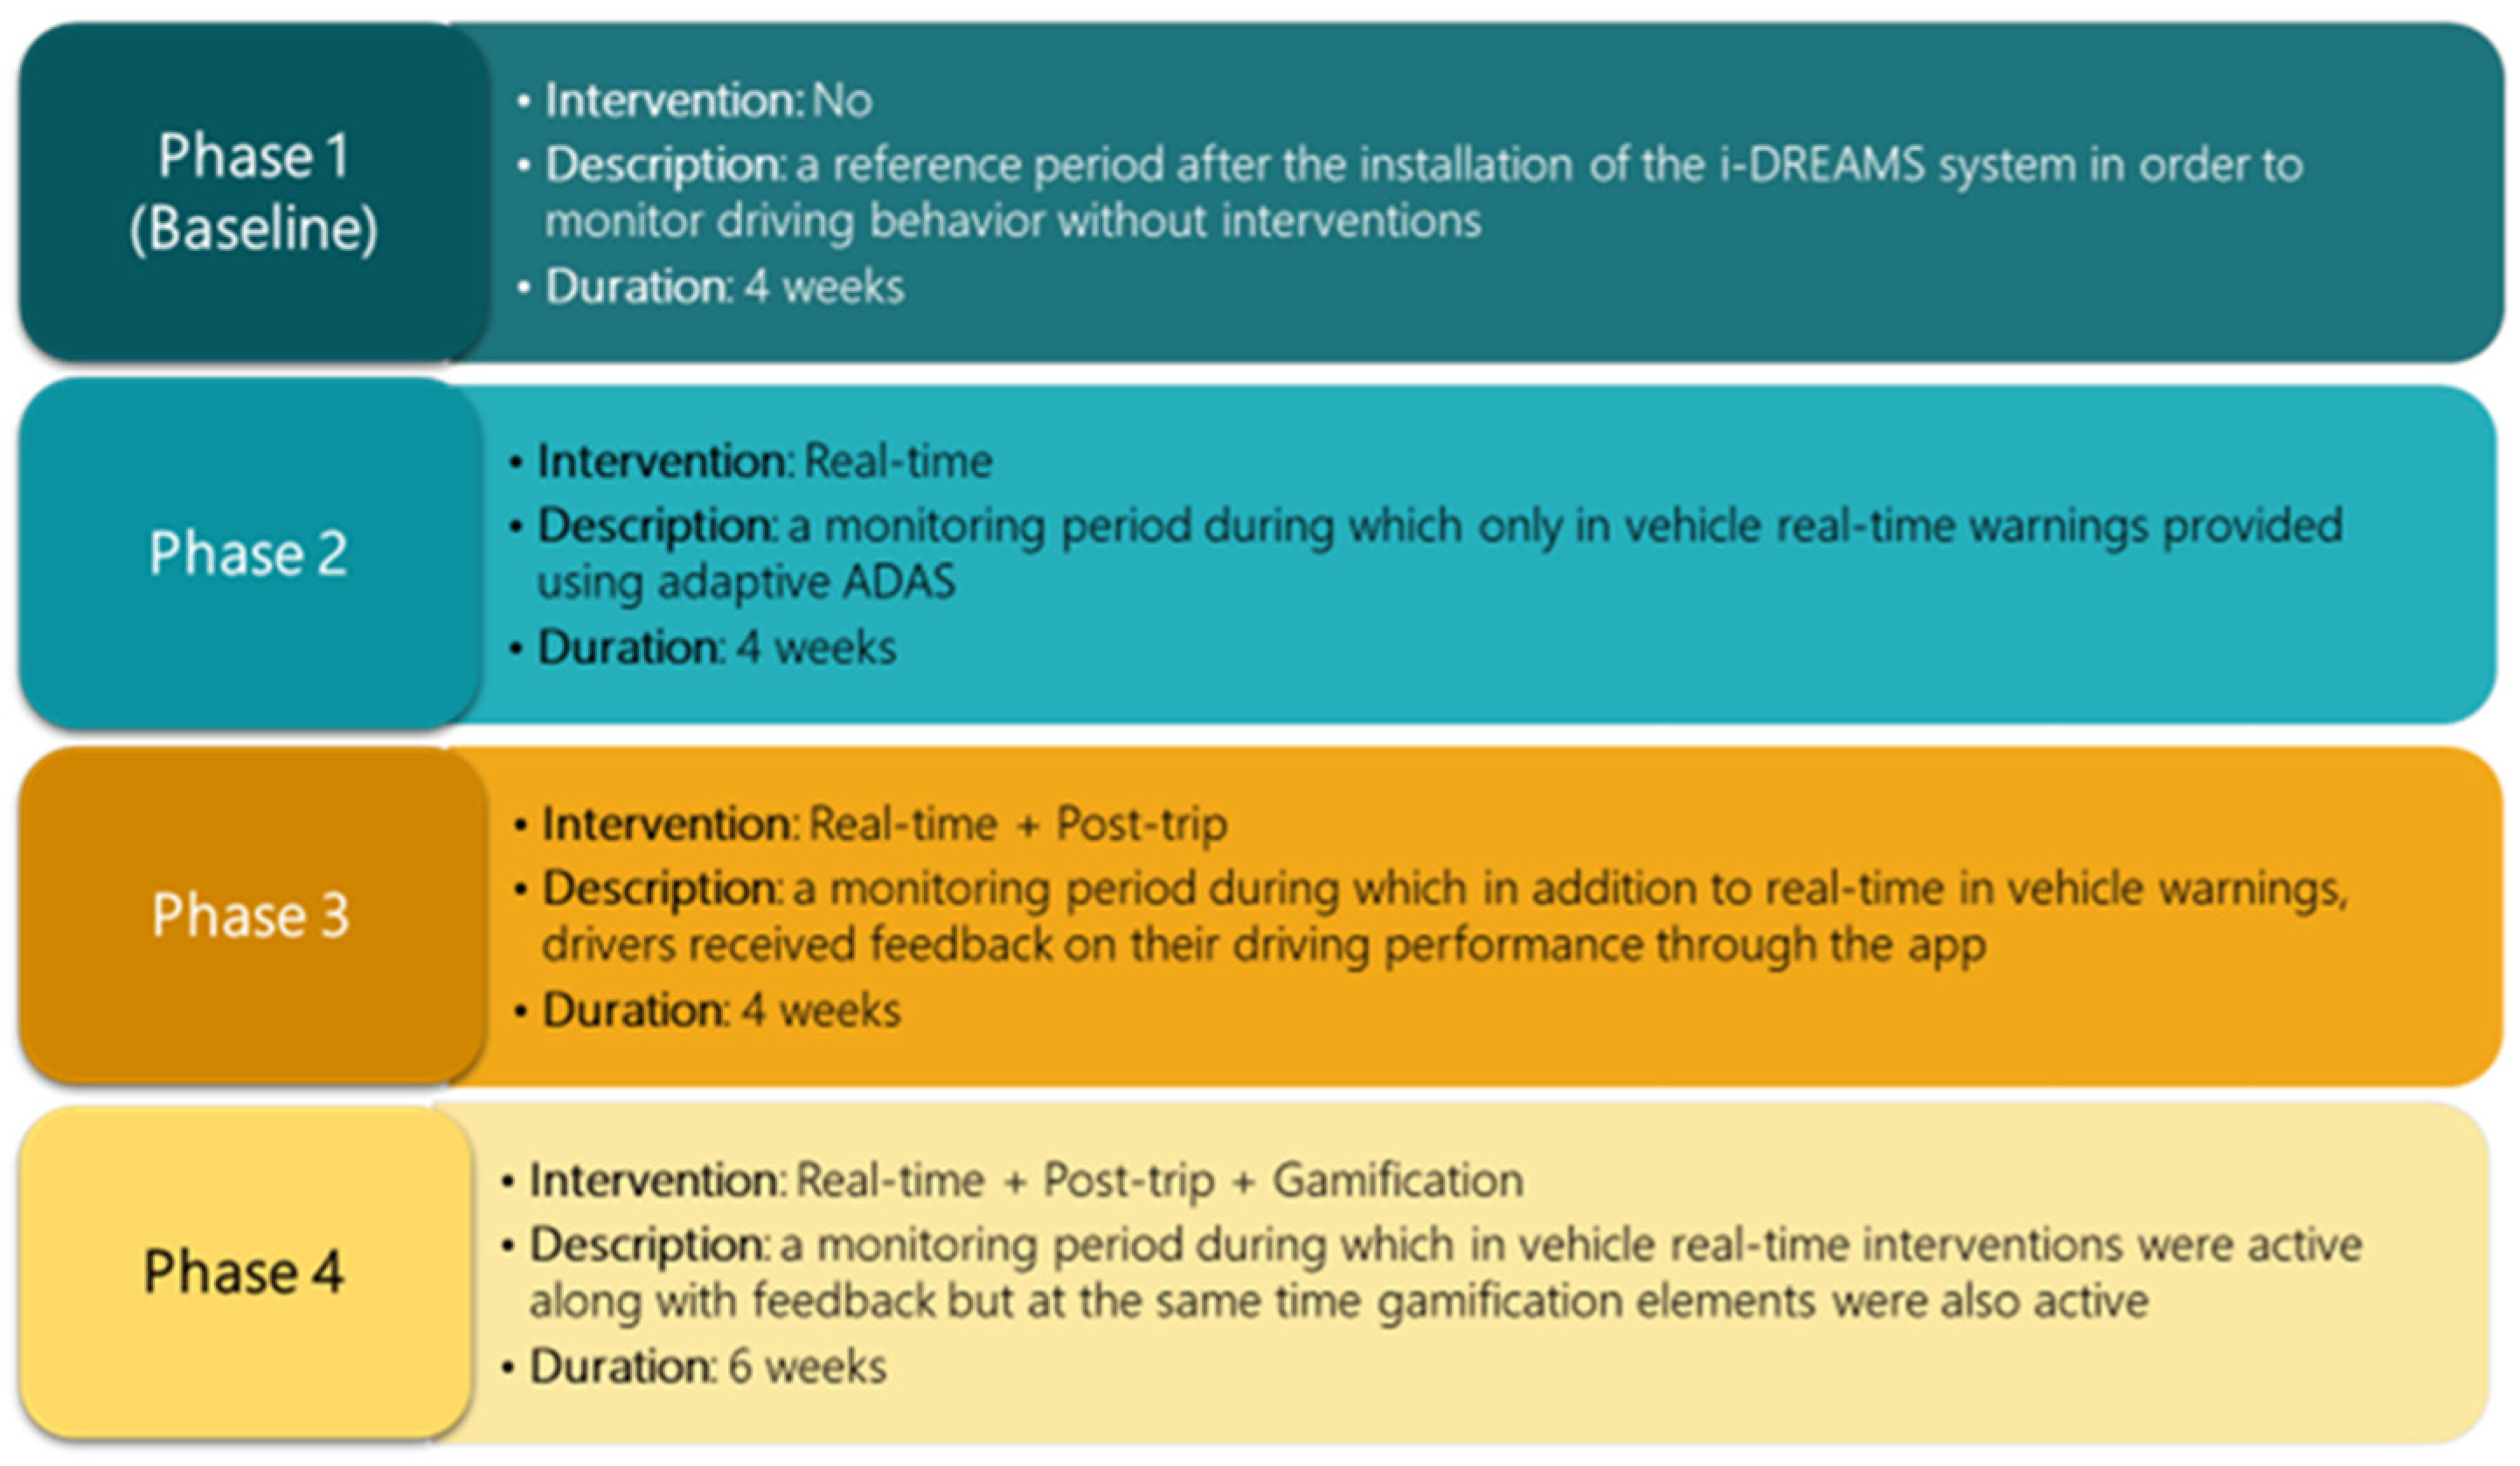
The experiment was conducted over a four-month period, divided into four distinct phases. Phase 1, lasting four weeks, served as a baseline with no interventions. In Phase 2, in-vehicle real-time warnings were introduced through adaptive Advanced Driver Assistance Systems (ADAS), also for a four-week period. During Phase 3, drivers received performance feedback via a mobile phone app, while Phase 4 extended this approach by introducing gamification elements to encourage safer driving behavior. Throughout all phases, the focus was on monitoring real-time driving behavior and evaluating the effectiveness of both real-time interventions (ADAS warnings) and post-driving feedback mechanisms.
Figure 1 provides an overview of the different phases of the experimental design of the i-DREAMS on-road study.
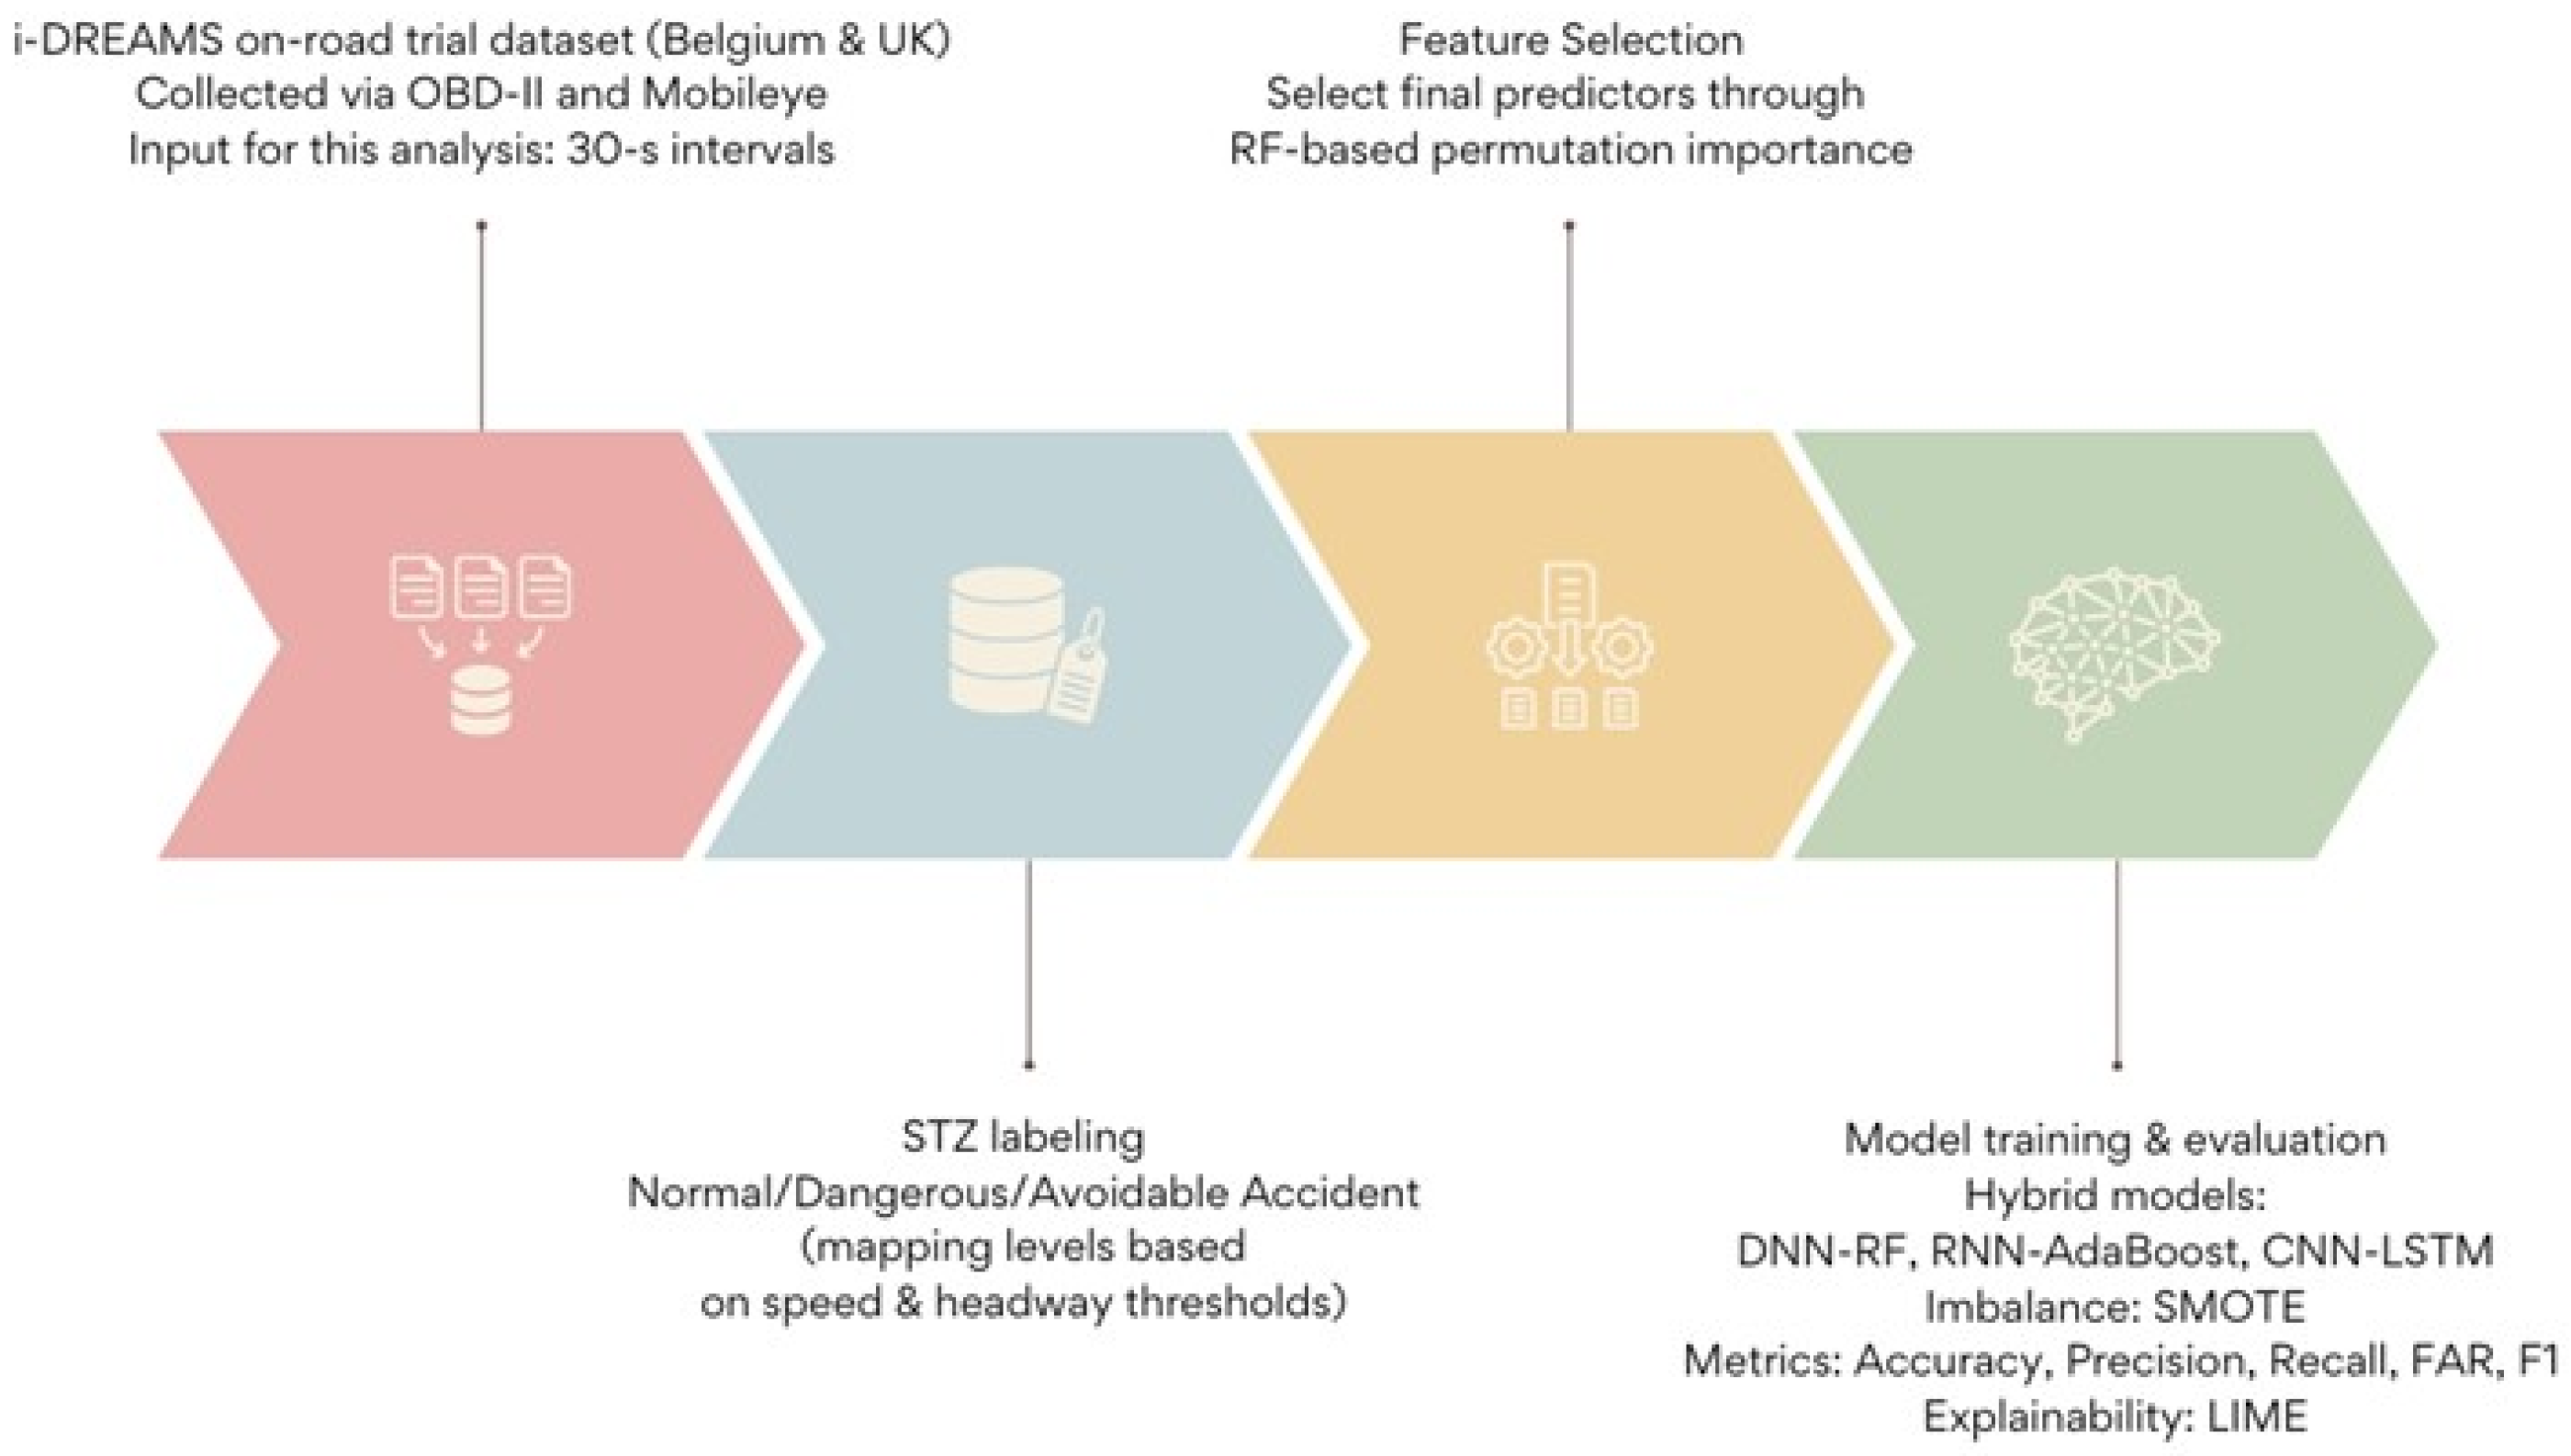
A Data collection employed several cutting-edge technologies, including an OBD-II device installed in each vehicle to capture hundreds of driving parameters. The Mobileye system, integrated with mobile networks, further facilitated data gathering without user interaction. To categorize driving behavior, each 30 s consecutive interval of the trip was assigned to one of three safety levels: Normal, Dangerous, or Avoidable Accident. These levels were determined based on intervention thresholds from the literature and the classification of variables such as speed and headway distances.
Figure 2 provides an overview of the modelling pipeline adopted in this study, from the project-provided i-DREAMS on-road dataset to the final classification outputs. The driving records were represented in consecutive 30 s intervals and subsequently labelled into one of the three Safety Tolerance Zone (STZ) states (Normal, Dangerous, Avoidable Accident) using the threshold-based mapping described in
Section 3.2 (primarily based on speed- and headway-related intervention levels). A feature selection procedure was then applied to identify the most informative predictors for the multi-class classification task (
Section 3.4), based on RF-based permutation importance. The selected predictors were used to train and evaluate the examined hybrid classification models (DNN–RF, RNN–AdaBoost, and CNN–LSTM), while model behaviour was further interpreted using LIME to support explainability.
3.2. Definition of “Safety Tolerance Zone”
Before the development of classification algorithms, it was necessary to categorize the driving data into one of three levels of the “Safety Tolerance Zone”. These categories were critical in structuring the dataset for the machine learning models. The Safety Tolerance Zone levels—Normal, Dangerous, and Avoidable Accident—were established based on real-time intervention thresholds derived from the international literature and validated within the i-DREAMS project. This categorization process was essential for understanding how driving behavior relates to road safety risks, with each intervention level reflecting different levels of driving risk.
Within the i-DREAMS framework, the three STZ levels are applied separately to each monitored risk indicator, so that a driver may simultaneously occupy, for instance, level 2 with respect to speeding and level 1 with respect to time headway. Both a speed-based and a headway-based mapping were therefore available. Of the two, time headway (the time gap between the driver’s vehicle and the preceding vehicle) was selected as the basis for the STZ labelling adopted in this study. This choice follows the approach established in earlier work within the same project [
17], in which speed, time-to-collision and time headway were each examined as candidate labelling indicators; of these, only the headway-based categorization produced a class structure consistent with the relevant literature, in which dangerous driving constitutes a comparatively rare phenomenon relative to safe driving. This mapping process was consistent for both the Belgian and UK datasets. It was expected that normal driving behaviors would form the majority class, while dangerous behaviors and avoidable accidents would naturally be minority classes, given the focus on safety-critical driving events.
The selection of time headway is supported by the underlying safety literature. Time headway is a decisive parameter in the analysis of rear-end collision risk, since it directly determines the time available to the following driver to react to a deceleration of the lead vehicle [
18]. Empirical work indicates that headways in the region of 1.1–1.7 s represent a manageable following margin [
19], while driver training practice and contemporary collision warning systems converge on a boundary of approximately two seconds, commonly known as the “two-second rule” [
20]. Accordingly, the i-DREAMS intervention thresholds were anchored on a safe-following boundary of 2.0 s, with a more critical boundary of 1.4 s marking the transition to the highest-risk state. The complete mapping between headway conditions, intervention levels and STZ states is presented in
Table 1.
The data collected from the experiment included variables such as iDreams_Headway_Map_level_i, where i represents the intervention level ranging from −1 to 3. These variables capture the intervention levels in relation to time headway (the time gap between vehicles) and are critical in categorizing driving behavior into the Safety Tolerance Zone. Each intervention level was assigned a value of 0 or 1:
To determine the overall Safety Tolerance Zone level for each 30 s timeframe of driving data, the intervention variables were evaluated to identify the most unfavorable safety level. This ensured that the categorization of driving behavior reflected the highest risk level encountered during that interval. The levels were defined as follows:
Normal: When the intervention level was −1, 0, or 1
Dangerous: When the intervention level was 2
Avoidable Accident: When the intervention level was 3
By classifying the data at 30 s intervals, this process captured the dynamic nature of driving behaviors and ensured that the most hazardous conditions were correctly identified, facilitating the subsequent development of classification algorithms.
It should be emphasized that no speed-derived quantity enters the labelling function: the STZ label is a deterministic function of the recorded time headway intervention level alone. This is a deliberate methodological choice. Retaining headway as the labelling variable and excluding every headway-derived statistic from the predictor set (
Section 3.4), ensures that the classification task remains a genuine prediction problem rather than a reconstruction of the labelling rule. It is acknowledged that time headway and speed are empirically related, in that insufficient following distances frequently arise at higher travel speeds [
17]. This association, however, is precisely the behavioral relationship that the models are intended to uncover; it does not constitute circularity, since speed plays no role whatsoever in the derivation of the labels. The resulting distribution of the 30 s intervals across the three STZ levels is reported in
Table 2. As anticipated, the Normal level constitutes the majority class in both countries, while the Dangerous and Avoidable Accident levels form the minority classes, a distribution addressed in
Section 3.4 through the application of SMOTE to the training data.
3.3. Hybrid Model Architecture
The core objective of this study was to predict driving risk levels based on real-world driving data. The classification problem was structured into three risk levels: Normal, Dangerous, and Avoidable Accident. To address this, three advanced machine learning and deep learning hybrid models were developed, which represent a relatively novel approach in road safety estimation, where hybrid models are still not widely used. These model, integrating different strengths from deep learning, machine learning, and ensemble learning, allow for more accurate and robust predictions of driving behavior compared to single-model approaches. The use of hybrid deep learning models has proven effective in various classification tasks, particularly in domains requiring both deep neural network processing and decision tree-based techniques for classification performance enhancement [
21]. The proposed hybrid models were selected to achieve a balance between predictive accuracy, interpretability, and robustness in the classification of risky driving behaviors. While deep learning models, such as DNNs and RNNs, are highly effective at capturing complex patterns, they often lack interpretability and are prone to overfitting. In contrast, machine learning ensemble techniques, such as RF and AdaBoost, provide enhanced stability, generalizability, and feature importance insights. By integrating these methodologies, the proposed hybrid models outperform conventional single-method approaches, delivering high classification accuracy while maintaining a level of transparency necessary for practical implementation in road safety applications [
22,
23]. The models developed include:
Deep Neural Network (DNN)—Random Forest (RF)
Recurrent Neural Network (RNN)—AdaBoost
Convolutional Neural Network (CNN)—Long Short-Term Memory (LSTM)
The selection of hybrid models was guided by the need to address the limitations of conventional machine learning and deep learning models in classifying risky driving behaviors. Traditional single-model approaches often struggle with balancing predictive accuracy, robustness, and interpretability, particularly when dealing with complex, high-dimensional naturalistic driving data. The hybrid models proposed in this study aim to leverage the complementary strengths of deep learning architectures and ensemble machine learning techniques to enhance both predictive performance and model transparency. This study contributes to the growing body of research on machine learning applications in transportation safety by demonstrating that hybrid modeling techniques can yield superior predictive performance compared to traditional methods. The findings suggest that leveraging deep learning for feature extraction, combined with ensemble learning for classification refinement, provides a promising approach for real-time detection and mitigation of risky driving behaviors. To enhance model transparency, the Local Interpretable Model-agnostic Explanations (LIME) algorithm was employed, providing insights into how the models arrived at their predictions—a significant improvement in addressing the black-box nature of many machine learning algorithms.
The suggested models, were implemented using Python 3.11, utilizing TensorFlow 2.15 (with the Keras API), and Scikit-learn 1.4 for model development and evaluation. Hyperparameters were selected through a combination of grid search and cross-validation to optimize model performance while preventing overfitting. The final configurations were determined based on classification accuracy, precision, recall, and F1-score. All models were trained and evaluated on a high-performance computing system equipped with an NVIDIA RTX 3090 GPU, 64 GB RAM, and an AMD Ryzen 9 processor, ensuring efficient processing of high-dimensional driving behavior data. This computational setup facilitated the effective training of deep learning architectures while maintaining model interpretability and scalability.
All three models were developed using the same four selected predictors. For an individual observation, the original input is represented as:
where the four elements correspond to total distance travelled, mean speed, mean harsh-acceleration level, and mean harsh-braking level. The final output of each architecture is a three-class prediction corresponding to the Normal, Dangerous, and Avoidable Accident STZ levels.
The DNN-RF architecture was implemented as a sequential feature-extraction and classification pipeline. The DNN receives each observation as a four-dimensional input vector with shape (4,). It consists of fully connected layers containing 128, 64, and 32 neurons, with ReLU activation and a dropout rate of 0.20 after each layer. After neural-network training, the activations of the final 32-neuron hidden layer are extracted. For (
N) observations, this produces a latent feature matrix
This matrix, rather than the original four predictors or the DNN class probabilities, is supplied to the Random Forest classifier. The Random Forest, comprising 500 trees with a maximum depth of 20, maps the learned 32-dimensional representations to the three STZ classes. Thus, the DNN serves as a nonlinear feature extractor and the Random Forest performs the final classification.
For the RNN-AdaBoost architecture, each four-element observation is reshaped to (4, 1), resulting in a complete input tensor with shape (N, 4, 1). The RNN contains recurrent layers with 64 and 32 units, with dropout applied to reduce overfitting.
The final hidden state of the 32-unit recurrent layer is extracted for every observation, producing
This learned representation is then supplied to the AdaBoost classifier, which consists of 100 depth-three decision-tree estimators and uses a learning rate of 0.1. AdaBoost produces the final three-class STZ prediction. The four input positions represent the selected behavioural descriptors rather than four consecutive measurement times. Therefore, in the present implementation, the RNN does not model temporal dependencies across successive 30 s intervals. Its role is to learn a nonlinear representation of the ordered four-feature input. Genuine interval-to-interval temporal modelling is reserved for future investigation.
The CNN-LSTM model receives the same reshaped input tensor, with shape (N, 4, 1). A one-dimensional convolutional layer first generates feature maps from the input representation. These feature maps are passed to the LSTM component, and the resulting representation is supplied to a dense output layer containing three softmax units. As with the RNN-AdaBoost architecture, the four input positions correspond to four aggregated behavioural descriptors and not to a sequence of consecutive observation intervals. The CNN-LSTM model should therefore be interpreted as an alternative neural architecture applied to the common four-feature input space, rather than as a model of long-term driving evolution.
3.3.1. Deep Neural Network (DNN)—Random Forest (RF)
The DNN-RF model integrates a deep neural network (DNN) with a Random Forest (RF) classifier, allowing for a combination of deep feature extraction and ensemble-based classification. This hybrid approach enhances both accuracy and interpretability, leveraging the strengths of both techniques for road safety estimation.
Deep Neural Networks (DNNs) Component: The DNN is responsible for extracting complex, high-dimensional patterns in driving data, capturing non-linear interactions between variables such as speed, acceleration, braking, and headway distance. The network consists of three fully connected layers with 128, 64, and 32 neurons, each using ReLU activation. To mitigate overfitting, a dropout rate of 20% is applied after each layer. The model is trained using the Adam optimizer (learning rate = 0.001), categorical cross-entropy loss, a batch size of 64, and 50 epochs.
Random Forest (RF) Component: The RF classifier improves generalizability by aggregating multiple decision trees, reducing variance, and ensuring robust predictions even in noisy or incomplete datasets. It also provides feature importance rankings, making the model more interpretable. The RF consists of 500 decision trees with a maximum depth of 20, using the Gini impurity criterion for node splitting.
Advantages Over Existing Approaches: While previous studies have explored either DNN or RF independently for driving behavior classification, the hybridization of these two approaches allows for deep feature learning while maintaining a level of interpretability crucial for real-world safety applications. The DNN component extracts complex patterns in driving data, while the RF classifier ensures robustness and generalizability.
3.3.2. Recurrent Neural Network (RNN)—AdaBoost
The RNN-AdaBoost hybrid model is designed to enhance classification performance, particularly for minority classes representing high-risk driving behaviors. By integrating sequential learning and boosting techniques, the model effectively captures temporal dependencies while addressing class imbalance, a common challenge in road safety estimation.
Recurrent Neural Networks (RNNs) Component: The RNN processes time-series data, making it well-suited for analyzing how driving behaviors evolve over time. It captures sequential dependencies, allowing the model to identify how a series of driving actions (e.g., repeated sharp braking or continuous speeding) may lead to increased risk levels. The architecture consists of two recurrent layers with 64 and 32 units, each with a dropout rate of 25% to prevent overfitting. The model is trained using the Adam optimizer (learning rate = 0.0007), categorical cross-entropy loss, a batch size of 32, and 75 epochs.
Adaptive Boosting (AdaBoost) Component: AdaBoost is an ensemble learning algorithm that improves classification performance by iteratively refining weak learners. It assigns higher weights to misclassified instances, ensuring that rare but critical behaviors (e.g., Avoidable Accidents) receive increased attention. The AdaBoost classifier consists of 100 decision trees with a maximum depth of 3 and a learning rate of 0.1.
Advantages Over Existing Approaches: The combination of RNN with AdaBoost addresses challenges related to both sequential learning and class imbalance. While RNN captures the temporal evolution of driving behaviors, AdaBoost ensures that the classification process remains sensitive to high-risk behaviors by correcting model biases toward majority classes. This hybridization ultimately leads to improved recall for hazardous driving behaviors, which is critical for applications in road safety intervention systems.
3.3.3. Convolutional Neural Network (CNN)—Long Short-Term Memory (LSTM)
The CNN-LSTM model was chosen to incorporate both spatial and temporal dependencies in driving behavior data, recognizing that risky driving patterns often emerge over time and exhibit structured relationships between variables.
Convolutional Neural Networks (CNNs) Component: CNNs, widely used for feature extraction, are employed here to identify interdependencies between driving variables (e.g., acceleration, braking, speed) over short intervals. This enables the model to detect critical local patterns that contribute to risk assessment. The CNN consists of two Conv1D layers with 64 and 128 filters, a kernel size of 3, and ReLU activation, followed by max-pooling layers.
Long Short-Term Memory (LSTM) Networks Component: LSTM networks are designed to model temporal dependencies and long-range patterns within sequential data. Given that driving behaviors evolve dynamically over time, the incorporation of LSTM enables the model to capture risk escalation patterns, such as sequences of aggressive maneuvers that may indicate increased crash likelihood. The LSTM component includes two layers with 64 and 32 units, each employing a dropout rate of 30% for improved generalization. The model is trained using the RMSprop optimizer (learning rate = 0.0005), categorical cross-entropy loss, a batch size of 32, and 100 training epochs.
Advantages Over Existing Approaches: Traditional classification models often lack the ability to capture both instantaneous and sequential dependencies in driving data. By integrating CNN for feature extraction and LSTM for sequence modeling, the CNN-LSTM hybrid model provides a more comprehensive framework for identifying and predicting risky driving behaviors. This approach is particularly valuable for applications requiring real-time behavioral monitoring and early warning systems.
3.4. Multi-Class Classification and Model Evaluation
The dataset was evaluated using a hold-out validation design, with an 80/20 split into training and test sets (test_size = 0.20, random_state = 42). During neural-network training, a further portion of the training set was reserved for internal validation (validation_split = 0.20) to monitor training and reduce overfitting. To address class imbalance, the Synthetic Minority Over-sampling Technique (SMOTE) was applied only to the training data. SMOTE generates synthetic samples for the minority classes (Dangerous and Avoidable Accident), ensuring that the models are trained to handle these critical events more effectively. In addition, all preprocessing steps (e.g., feature scaling/normalization) were fitted using the training set only and then applied to the test set, in order to avoid information leakage from the test data into the training process. It should be clarified that oversampling was applied only to the training data after the train/test split, while the test sets retained their original class distributions. This procedure was adopted to prevent information leakage and to ensure that model evaluation was performed on data representative of the original class imbalance.
Feature selection was conducted prior to model development in order to reduce the dimensionality of the input space, limit computational cost and improve predictive performance. The initial candidate pool comprised 23 predictors, derived from the OBD-II and Mobileye data streams after the exclusion of administrative, constant and sensor-diagnostic fields. Variable importance was quantified using Random Forest permutation importance, implemented in scikit-learn, whereby the reduction in classification performance is measured after randomly permuting each predictor in turn [
24,
25,
26]. Importance scores were normalized to the interval [0, 1] and computed separately for the Belgian and the UK datasets. The complete set of scores is reported in
Appendix A (
Table A1).
Three criteria governed the retention of predictors. First, the mean time headway indicator (ME_AWS_hw_measurement_mean) was deliberately excluded, despite exhibiting by far the highest permutation importance in both datasets (0.413 in Belgium and 0.380 in the UK). This variable constitutes the basis on which the Safety Tolerance Zone labels are derived; its inclusion as a predictor would therefore have introduced circularity between the labelling rule and the model input, and any resulting performance gain would have reflected the labelling procedure rather than genuine predictive capability. Consistent with this reasoning, no headway-derived descriptive statistic was admitted to the predictor set.
Second, ME_Car_speed_mean (0.107 in Belgium; 0.110 in the UK) and ME_TSR_tsr_1_speed_median (0.036; 0.049) were excluded on the grounds of strong collinearity with GPS_spd_mean, which was retained as the single speed-related predictor in order to avoid redundancy in the input space. Third, among the remaining candidates, predictors were retained on the basis of both their permutation importance and their substantive relevance as behavioral indicators. Physiological measurements (IBI_value_mean, Drowsiness_level_median) were excluded as they do not constitute indicators of driving behaviour per se and would not be routinely available in operational deployment settings. The same applies to the outputs generated by the Mobileye advanced warning system itself, namely the mean traffic sign recognition warning level (ME_AWS_tsr_level_mean), the median time indicator (ME_AWS_time_indicator_median), the pedestrian danger zone indicator (ME_AWS_pedestrian_dz_mean), the forward collision warning (ME_AWS_fcw_mean) and the pedestrian collision warning (ME_AWS_pcw_mean): these are system responses to driving behaviour rather than independent measurements of it, and their inclusion would have conflated the behaviour under study with the intervention system deployed to address it. Contextual status variables, namely windscreen wiper activation (ME_Car_wipers_median) and high-beam activation (ME_Car_high_beam_median), were likewise excluded, their importance scores being in any case negligible (below 0.008 in both datasets.
Harsh cornering events (DEM_evt_hc_lvl_L_mean, DEM_evt_hc_lvl_M_mean and DEM_evt_hc_lvl_H_mean) were likewise excluded, on substantive rather than purely numerical grounds. Cornering constitutes a lateral behavioral indicator, whereas the Safety Tolerance Zone labels are derived from time headway, which is an inherently longitudinal safety measure. The predictor set was therefore restricted to indicators operating in the same behavioral dimension as the target construct, namely speed, distance travelled, and longitudinal acceleration and deceleration events, in order to preserve conceptual consistency between the input space and the labelling rule. It is further acknowledged that road-environment variables (e.g., road type, geometry, weather conditions) were not included in the candidate pool, as the present analysis was restricted to indicators continuously recorded at trip level by the in-vehicle monitoring equipment; their integration constitutes a promising direction for future work and is discussed further in
Section 5.
As a result, the following four variables were selected for use in the classification models:
GPS_distances_sum—Total distance traveled by the vehicle.
GPS_spd_mean—Average speed of the vehicle during the trip.
DEM_evt_ha_lvl_L_mean—Mean level of harsh acceleration events recorded during the trip.
DEM_evt_hb_lvl_L_mean—Mean level of harsh braking events recorded during the trip.
Each model was evaluated using metrics such as accuracy, precision, recall, false alarm rate, and f1-score, providing a comprehensive assessment of performance, defined by Equations (1)–(5):
where True Positive (
TP) represents the instances which belong to class i and were correctly classified in it; True Negative (
TN) represents the instances which do not belong to class i and were not classified in it; False Positive (
FP) represents the instances which do not belong to class i but were incorrectly classified in it; False Negative (
FN) represents the instances which belong to class i but were not classified in it.
In addition to these metrics, LIME (Local Interpretable Model-agnostic Explanations) was incorporated in this study to improve the interpretability of complex machine learning models. Given that models like DNN-RF, RNN-AdaBoost, and CNN-LSTM are often seen as “black boxes,” where understanding how predictions are made can be challenging, LIME offers a way to explain the influence of individual features—such as speed, headway, and acceleration—on the classification of driving behaviors.
By creating local approximations, LIME makes it possible to understand the role of specific variables in the models’ decision-making processes. This interpretability is crucial for building trust in the predictions, especially in practical applications like road safety, where the reasoning behind classifications must be clear for policy-making and real-time interventions. LIME bridges the gap between advanced predictive models and the need for transparency, making the results more accessible and actionable for stakeholders.
4. Results
The results present the performance of three machine learning models developed to classify driving behavior into the risk categories: Normal, Dangerous, and Avoidable Accident. The models—Random Forest (RF) combined with Deep Neural Network (DNN), Convolutional Neural Network (CNN) combined with Long Short-Term Memory (LSTM), and Recurrent Neural Network (RNN) combined with AdaBoost—were applied to naturalistic driving data collected in Belgium and the UK. The evaluation of these models was based on key metrics, including accuracy, precision, recall, false positive rate (FPR), and F1-score. A comparative analysis of these metrics was conducted to assess the effectiveness of each model in predicting risky driving behaviors across both datasets.
4.1. Identification of the Safety Tolerance Zone Levels
The performance of the three machine learning models is summarized in
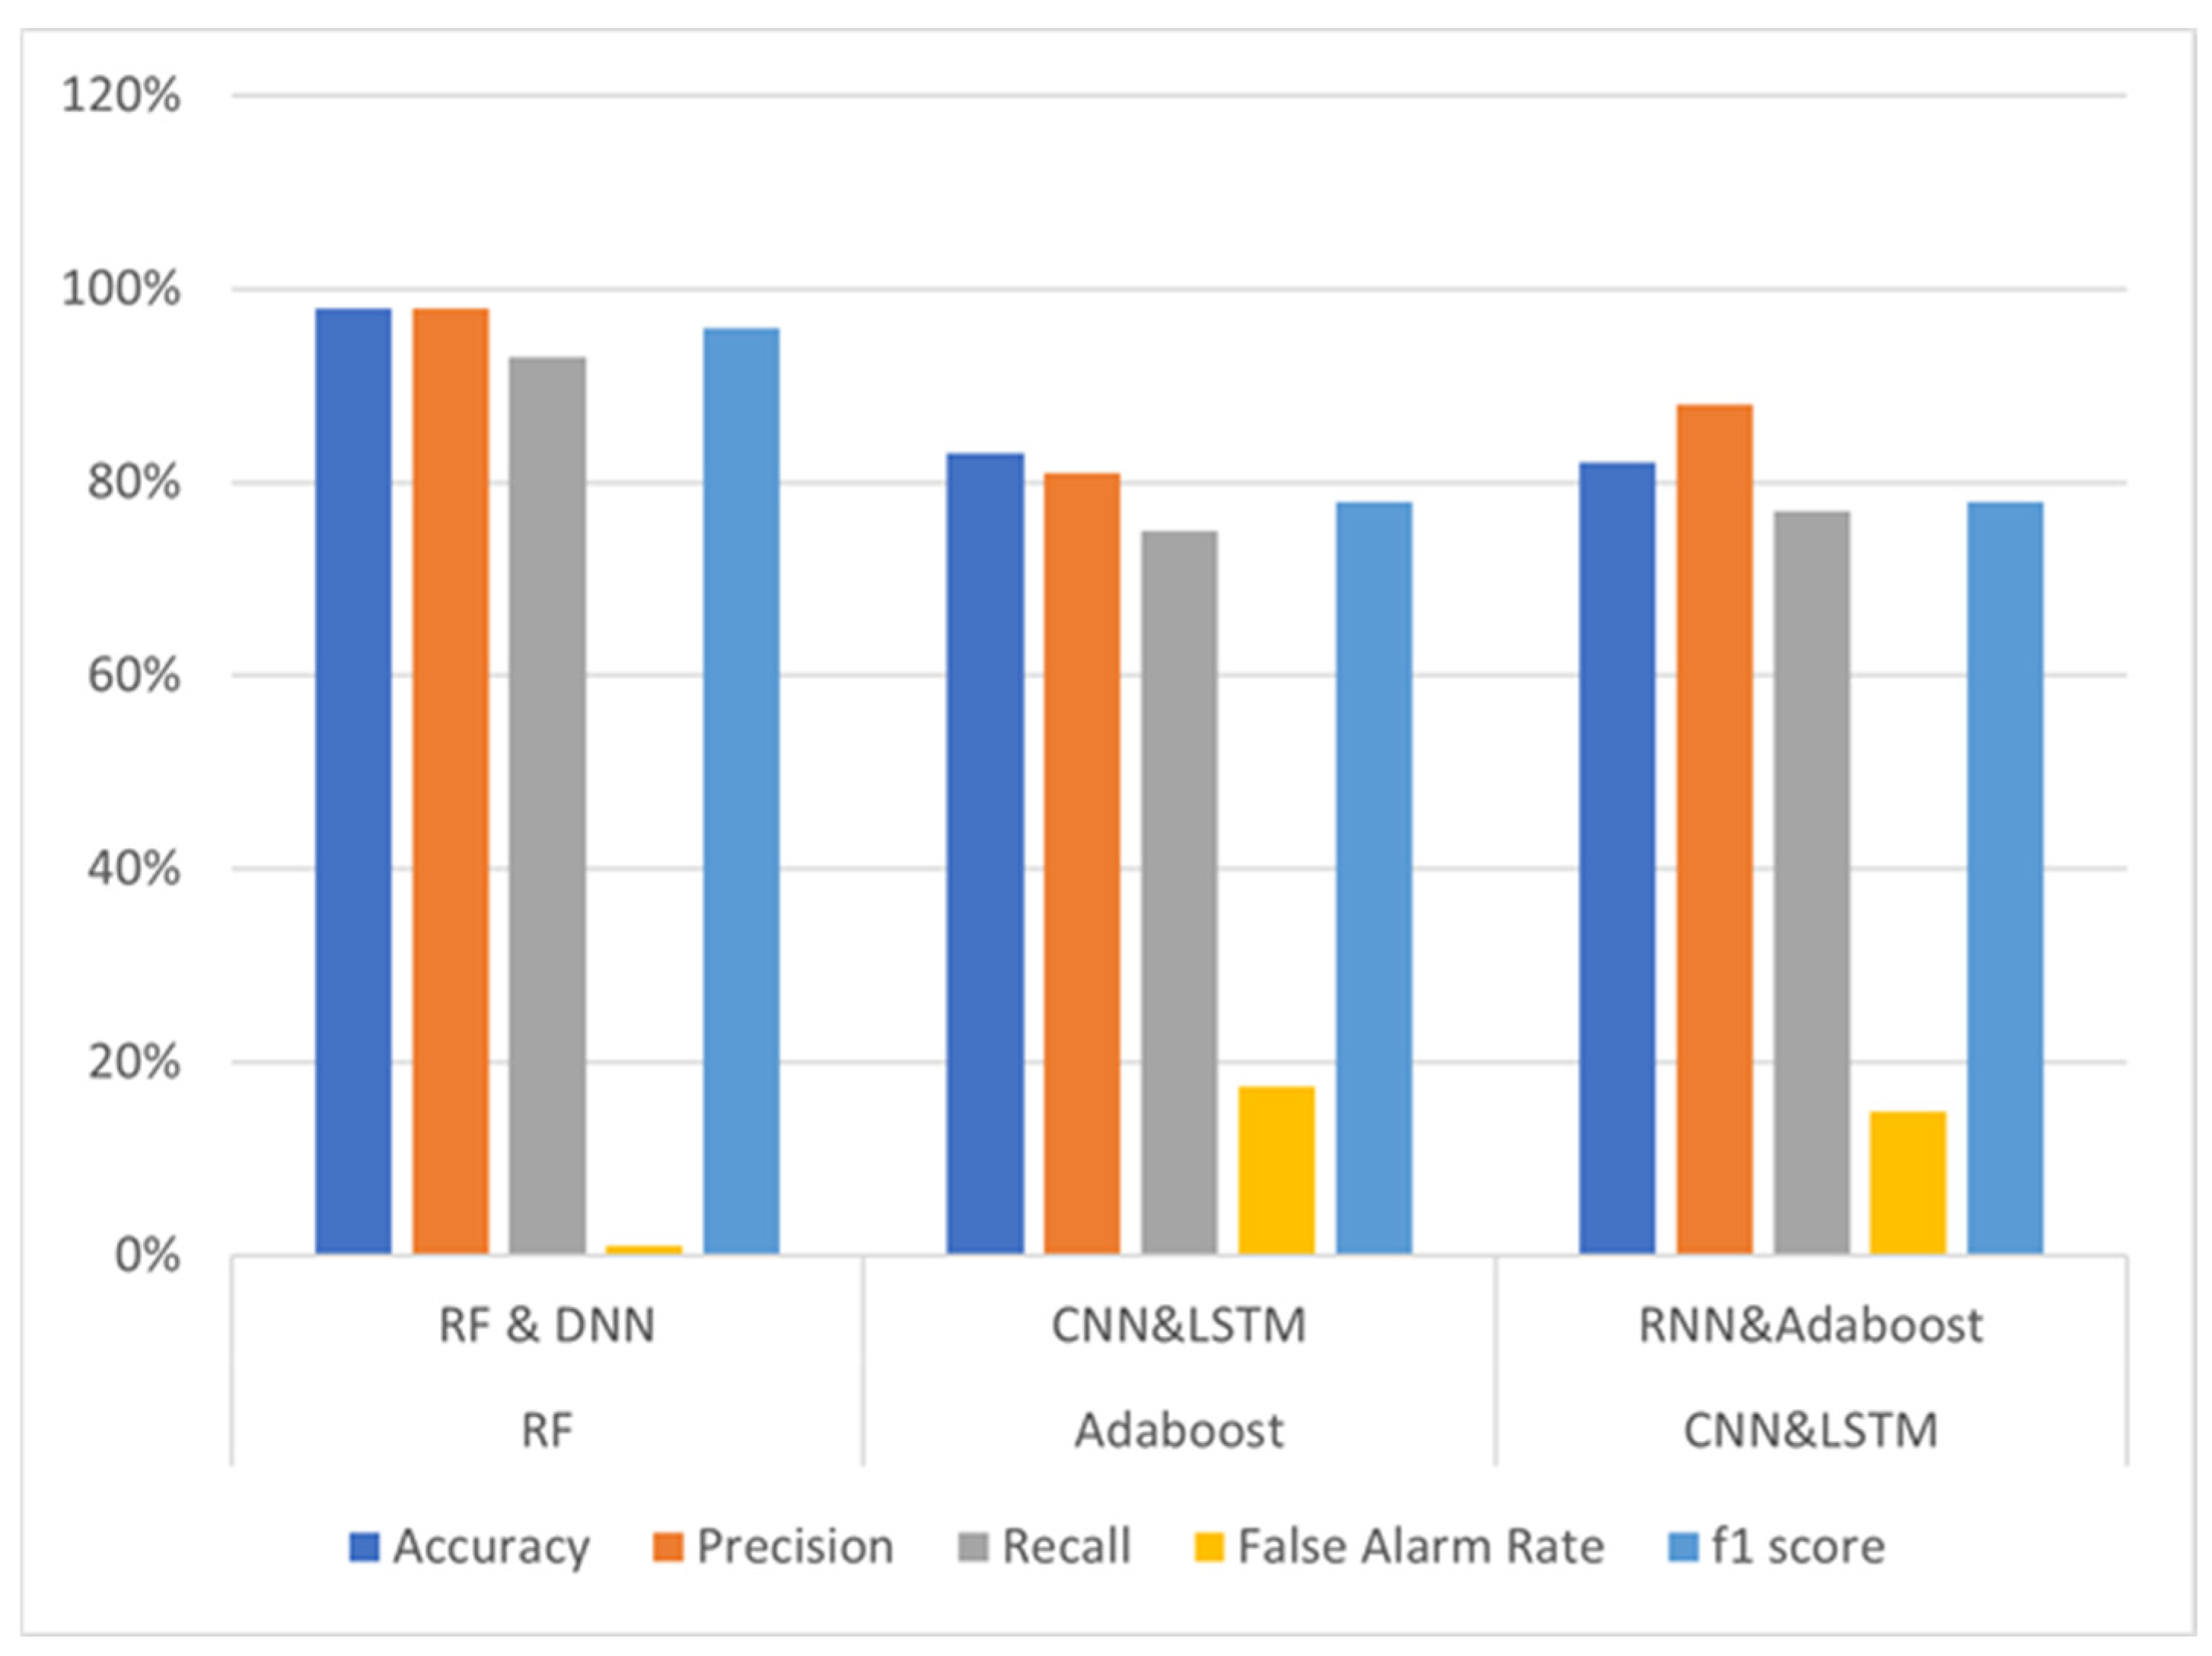
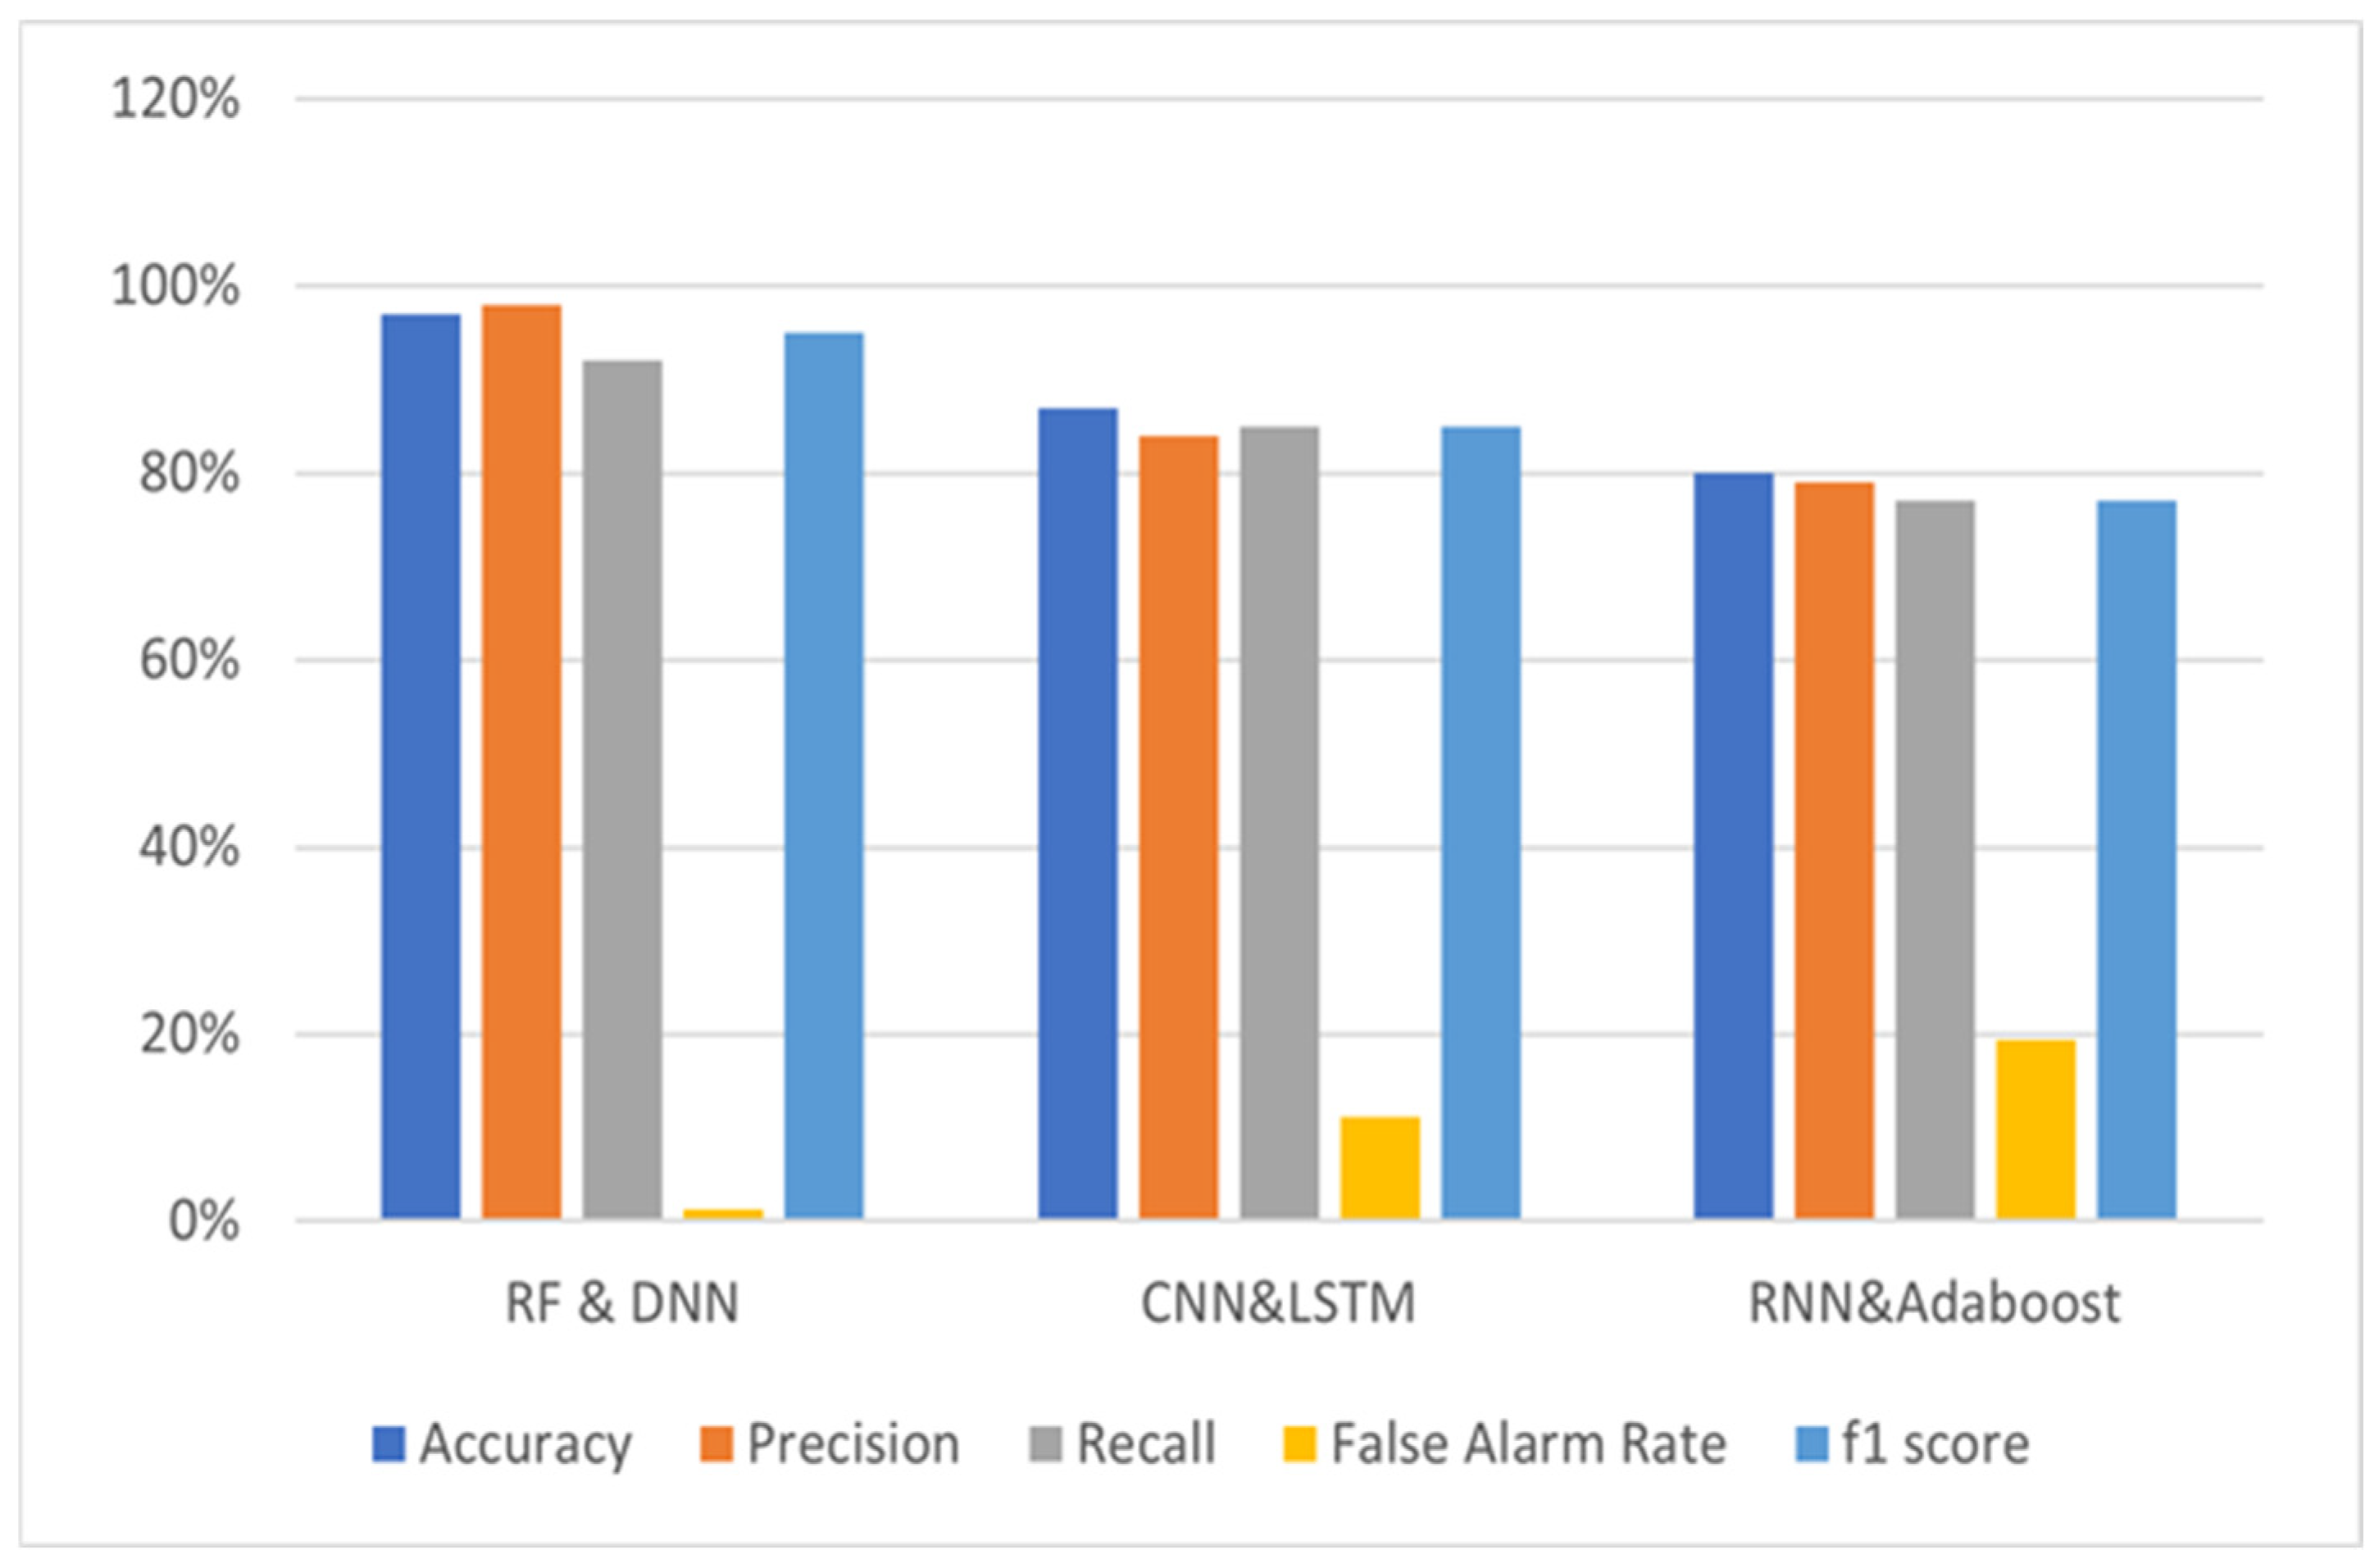
Table 3, which compares the accuracy, precision, recall, false positive rate (FPR), and F1-score across both datasets (Belgium and the UK). The Random Forest (RF) combined with Deep Neural Network (DNN) model consistently achieved the highest performance in both datasets. In Belgium, the RF-DNN model achieved an accuracy of 98%, with a precision of 98%, and a recall of 93%. Similarly, in the UK dataset, the RF-DNN model achieved an accuracy of 97%, precision of 98%, and recall of 92%. The low false positive rates (FPR) of 0.96% in Belgium and 1.36% in the UK demonstrate the model’s effectiveness in minimizing misclassifications of less hazardous behaviors as more dangerous.
In comparison, the CNN-LSTM model demonstrated lower performance, particularly in the Belgium dataset, where its accuracy was 83%, with a recall of 75% and a higher FPR of 17.5%. This suggests that while the CNN-LSTM model is able to capture risky behaviors to some extent, it tends to misclassify more events, leading to less reliable predictions compared to the RF-DNN model. In the UK, the CNN-LSTM model showed better performance with an accuracy of 87% and recall of 85%, but the FPR remained higher at 11.11%.
The RNN-AdaBoost model also showed a reasonable performance, particularly in terms of precision, which reached 88% in the Belgium dataset. However, its overall accuracy was lower than that of the RF-DNN model, with an accuracy of 82% in Belgium and 80% in the UK. The FPR for the RNN-AdaBoost model was 14.9% in Belgium and 19.4% in the UK, indicating that it also struggled with correctly classifying some risk categories.
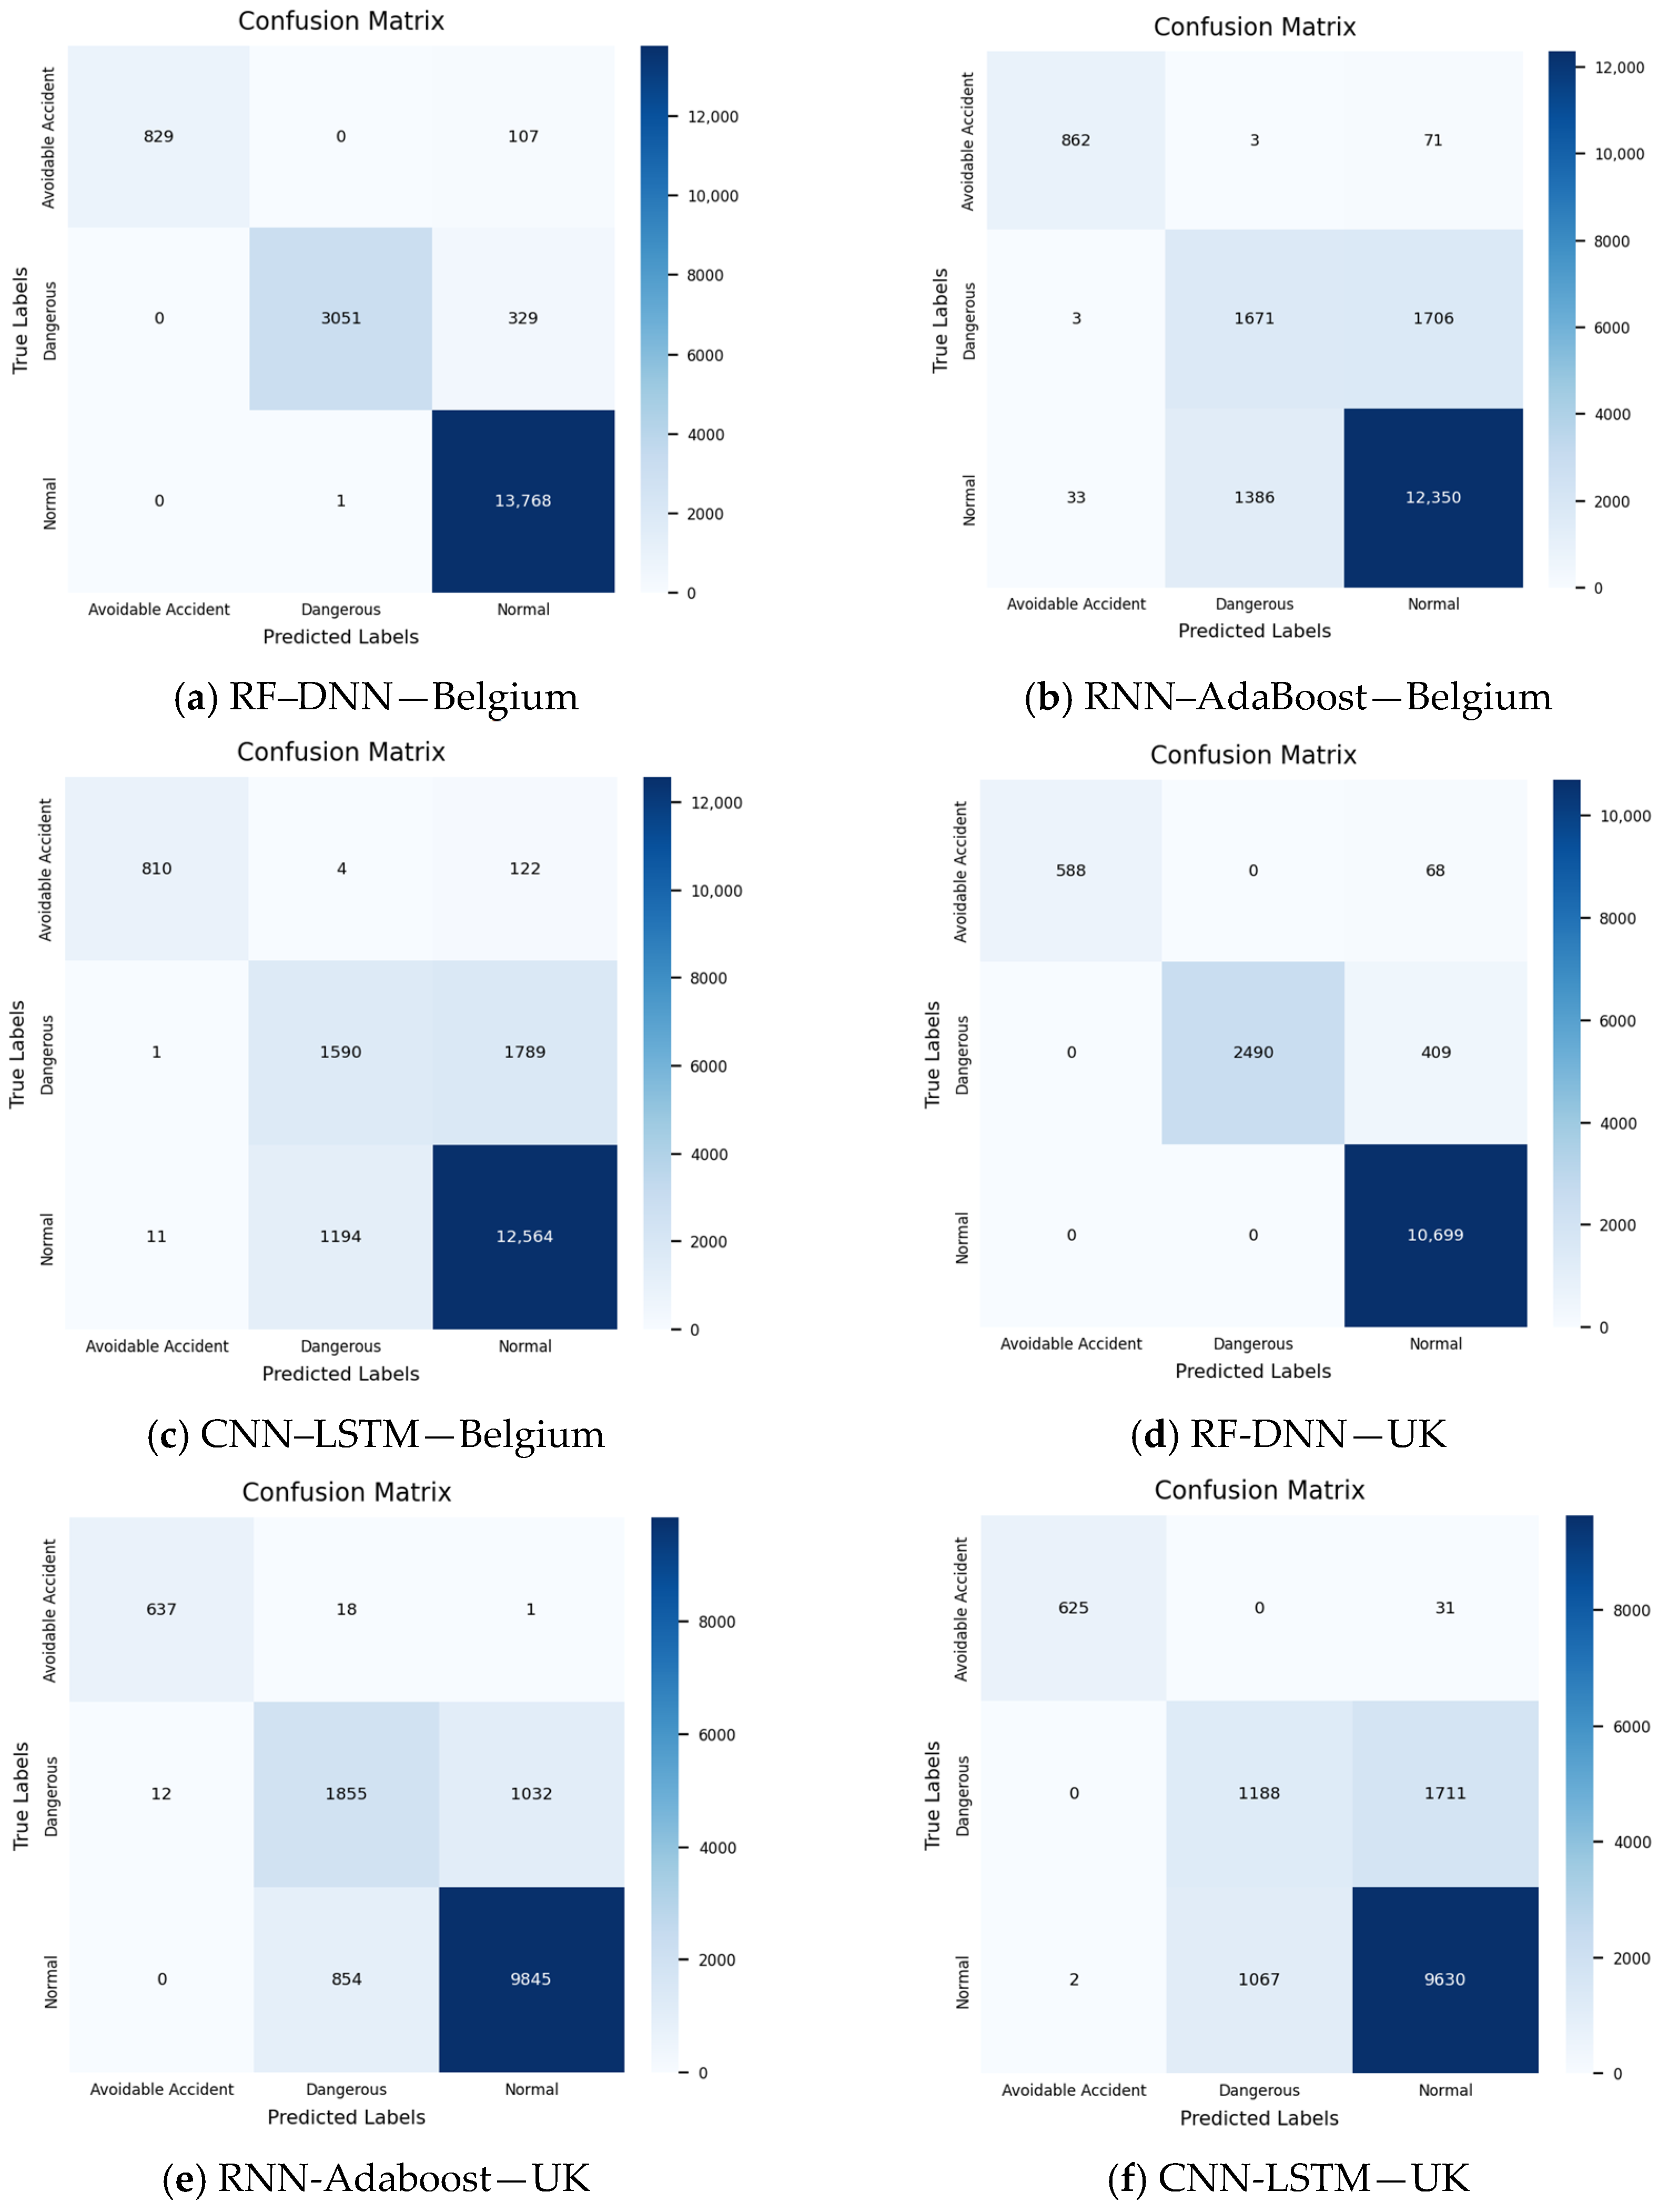
To further examine model performance at the class level, confusion matrices were generated for each examined model and each country (
Figure 3). These matrices provide a detailed view of correct and incorrect classifications across the three Safety Tolerance Zone (STZ) levels (Normal, Dangerous, Avoidable Accident), complementing the aggregate performance metrics reported in
Table 1.
According to
Figure 4 and
Figure 5, the algorithms yield high accuracy, recall, precision and f1-score which do not have a large deviation between them. A closer examination of recall underscores its importance in the context of road safety, as it reflects the model’s ability to correctly identify risky driving behaviors such as dangerous or avoidable accidents. Higher recall means the model is more capable of detecting these behaviors, which is critical for preventing crashes. For instance, the RF-DNN model’s recall of 93% in Belgium indicates that the vast majority of risky driving behaviors were accurately identified, ensuring its effectiveness in real-world applications where missing dangerous behavior could lead to serious consequences. On the other hand, CNN-LSTM’s recall of 75% in Belgium suggests a higher likelihood of failing to detect dangerous behaviors, which reduces its practical utility in critical safety scenarios. Another key metric, the false positive rate (FPR), measures how often the model incorrectly classifies non-hazardous behaviors as hazardous. In practice, a high FPR can lead to unnecessary interventions, such as flagging safe driving behaviors as risky, which could cause unnecessary alarms and erode driver trust in the system. The RF-DNN model’s FPR of 0.96% in Belgium, compared to CNN-LSTM’s 17.5%, reflects the model’s superior ability to avoid false alarms. This low FPR makes the RF-DNN model far more suitable for real-time applications where minimizing false positives is critical to maintaining system reliability. Precision, meanwhile, indicates how many of the model’s predicted risky behaviors are actually correct. High precision ensures that the model’s warnings about dangerous driving behaviors are accurate and trustworthy. Both datasets showed the RF-DNN model achieving 98% precision, meaning nearly all of its predictions were correct, thereby reducing the chance of false alarms. In contrast, the CNN-LSTM and RNN-AdaBoost models, while still performing reasonably well, demonstrated lower precision, particularly in the UK, where the RNN-AdaBoost model achieved only 79%. Finally, the F1-score balances precision and recall, offering a holistic view of model performance. The RF-DNN model’s F1-score of 96% in Belgium and 95% in the UK demonstrates its strength in maintaining a balance between identifying risky behaviors and minimizing false positives. This makes it highly suitable for road safety applications where both accurate detection of risks and avoiding unnecessary warnings are crucial.
4.2. Interpretability of Classification Models
To enhance the interpretability of the machine learning models, Local Interpretable Model-Agnostic Explanations (LIME) was employed. LIME was used to analyze the influence of specific driving features, such as average speed, total travel distance, harsh acceleration, and harsh braking events, on the model’s predictions. As transparency in machine learning models becomes increasingly important, especially in safety-critical applications like autonomous driving, interpretability techniques such as LIME can enhance the trustworthiness of the predictions. In applications such as malware classification or driver emotion detection, interpretability tools have proven invaluable in understanding the key features driving model decisions [
27]. This capability is critical for stakeholder acceptance and practical deployment of AI systems in road safety. The results, as shown in
Table 4, identify the most influential features in predicting risky driving behaviors for both Belgium and the UK.
The feature importance analysis revealed notable regional differences in the factors influencing risky driving behaviors. In Belgium, harsh acceleration and harsh braking emerged as the most significant predictors, likely due to differences in traffic density, road conditions, and driver behavior patterns. The prevalence of abrupt maneuvers in Belgium may be attributed to more frequent stop-and-go traffic situations or a higher tendency for aggressive driving styles. In contrast, total trip distance played a more prominent role in the UK dataset, suggesting that longer driving durations contribute to fatigue-related risk factors. The correlation between total trip distance and risky behavior aligns with findings from prior studies indicating that extended trips can lead to decreased driver attention and slower reaction times, increasing crash likelihood. These regional variations highlight the importance of tailoring driver intervention strategies to specific driving environments and behaviors.
These differences may be attributed to variations in traffic density, road infrastructure, and driving culture between the two regions. Belgium’s urban environments and frequent stop-and-go traffic likely contribute to a higher prevalence of abrupt acceleration and braking. In contrast, UK drivers tend to travel longer distances, leading to fatigue-related risks that may result in less abrupt but prolonged exposure to hazardous conditions. Future studies could further investigate how environmental and road network characteristics influence driver behavior across different regions.
5. Discussion
The current study developed hybrid classification models capable of accurately identifying dangerous driving behaviors using real-world driving data from Belgium and the UK. By employing a combination of machine learning and deep learning algorithms, the models demonstrated high precision in classifying drivers into distinct safety levels. Among the tested models, the Deep Neural Network (DNN) combined with Random Forest (RF) yielded the highest accuracy, achieving 98% in Belgium and 97% in the United Kingdom. This result supports recent advancements in the application of machine learning to improve road safety, particularly for real-time driving risk prediction. For instance, Peppes et al. (2021) [
28] used machine learning models to analyze vehicular data streams, showing the effectiveness of such models in identifying driving risks. However, this study goes beyond previous research by incorporating a cross-regional dataset, providing a comparative analysis between Belgium and the UK to highlight how geographical and cultural differences shape driving behaviors.
A similar approach was taken by Kwon et al. (2021) [
13], who employed a Convolutional Neural Network (CNN) combined with Long Short-Term Memory (LSTM) to classify aggressive driving behaviors, demonstrating the potential of deep learning in understanding complex driving dynamics. While their research focused on identifying aggressive drivers using time-series data, the present study introduces a novel hybrid modeling approach that integrates both machine learning and deep learning methods (DNN-RF). This approach not only achieved high accuracy but also enhanced model interpretability through the use of the LIME method. By classifying drivers into multiple safety levels and providing insights into specific driving behaviors that contribute to dangerous driving patterns, this study addresses a gap that has not been thoroughly explored in prior research.
The inclusion of interpretability tools in this study represents a significant advancement in the field. While predictive accuracy is essential, understanding the mechanisms behind risky driving behavior offers actionable insights for developing targeted interventions. For instance, harsh acceleration, often linked to cognitive impulsivity or frustration, can be addressed through real-time driver feedback systems that mitigate aggressive behaviors before they escalate. Similarly, identifying fatigue-related risks in long-distance driving highlights the need for adaptive technologies that monitor driver alertness and recommend breaks at appropriate intervals.
A comparative analysis between Belgium and the UK revealed significant differences in the factors influencing dangerous driving behaviors. In Belgium, harsh acceleration and harsh braking emerged as the most significant predictors of risky driving, while in the UK, total trip distance and harsh acceleration played more prominent roles. These findings suggest that geographical and cultural factors influence driving behaviors. For example, the longer distances and higher speeds typical in the UK may reflect differences in road infrastructure or social norms, whereas more abrupt driving maneuvers in Belgium appear to be key risk factors. This aligns with observations from other cross-regional studies, such as the work by Shangguan et al. (2021) [
11], which emphasized the importance of tailoring safety interventions to local driving patterns.
The study also highlighted the importance of vehicle speed in determining crash risk, particularly in high-speed environments where reduced reaction times increase the likelihood of incidents. This finding is consistent with earlier research, such as the work by Shi et al. (2019) [
9], which demonstrated a strong correlation between speed and crash severity. Furthermore, the connection between long-distance driving and fatigue, especially in the UK, was evident in the data. Drivers engaging in longer trips were more likely to display risky behaviors, a pattern that aligns with Roshandel et al. (2015) [
29] research, which found that fatigue significantly impacts driver safety.
The inclusion of LIME in this study is a significant novelty, providing transparency into the decision-making processes of the machine learning models. One of the main challenges with deep learning models is their “black-box” nature, where the reasoning behind predictions is difficult to interpret. LIME addressed this issue by offering insights into how specific behaviors, such as harsh acceleration or braking, influenced driving safety levels. This added interpretability is critical for real-world applications, as it allows for better understanding and actionable insights into how machine learning models classify dangerous behaviors. The need for model interpretability has been highlighted in other studies, such as Liu et al. (2024) [
30], which underscores the growing need for transparency in AI applications.
Harsh acceleration is often linked to aggressive driving, a significant risk factor in traffic crashes, as abrupt speed increases can reduce reaction time to unforeseen obstacles or changes in road conditions, leading to a higher likelihood of crashes. Similarly, harsh braking, typically caused by driver distraction or misjudgment, poses hazards, especially in congested or high-speed conditions. These behaviors reflect diminished control over the vehicle and delayed responses to road hazards, increasing the risk of avoidable crashes. The analysis revealed regional differences: in Belgium, harsh acceleration and braking were the primary predictors of risky driving, whereas in the UK, total trip distance and harsh acceleration played more prominent roles. Longer trips in the UK may correlate with fatigue or reduced attention, contributing to risky driving behavior, while abrupt maneuvers are more prevalent in Belgium. Harsh braking had less influence in the UK compared to Belgium, suggesting differences in traffic patterns, road designs, or driving behaviors between the two regions.
The false positive rate (FPR) is a critical factor in the practical deployment of driving risk classification models. While a low FPR, such as that observed in the RF-DNN model (0.96% in Belgium, 1.36% in the UK), minimizes unnecessary interventions, a higher FPR, as seen in the CNN-LSTM model (17.5% in Belgium, 11.11% in the UK), could lead to frequent false alarms. Excessive false positives may result in driver desensitization, where users begin to ignore or disable safety alerts, ultimately reducing the effectiveness of the system. Conversely, an excessively conservative approach with an extremely low FPR may fail to flag genuinely risky behaviors, potentially missing opportunities for timely interventions. Therefore, striking a balance between sensitivity and specificity is essential to maintaining driver trust and ensuring that alerts remain actionable without causing alert fatigue.
The findings from this study have important implications for both policy and practical applications. From a practical perspective, the models developed could be integrated into real-time driver assistance systems (ADAS) to provide immediate feedback to drivers. Such systems could alert drivers when they engage in risky behaviors, such as harsh braking or frequent acceleration, allowing them to adjust their driving in real time. Similar approaches have been explored in previous studies, such as the work by Michelaraki et al. (2023) [
31], which demonstrated that real-time feedback through ADAS can significantly reduce crash risks by notifying drivers of dangerous behaviors as they occur. This study suggests that these systems could be adapted to account for regional driving patterns, such as long-distance driving in the UK or abrupt maneuvers in Belgium, further enhancing their effectiveness.
The main contribution of this study is the demonstration of an end-to-end approach that maps naturalistic driving data to Safety Tolerance Zone (STZ) safety states and evaluates this approach across two national road-trial datasets (Belgium and the UK). Beyond reporting high classification performance, the results identify which driving factors are most associated with elevated risk states in each dataset, supporting the design of more targeted interventions. From an applied perspective, STZ-based classification outputs can support safer transport by enabling proactive risk-state monitoring and by informing whether an intervention should be delivered in real time (e.g., in-vehicle warnings) or post-trip (e.g., coaching/feedback), while accounting for deployment constraints such as alert fatigue due to false positives. Finally, the cross-country setting helps clarify where model behaviour appears consistent and where localization or recalibration may be required for practical deployment.
While the models showed strong performance, the study has some limitations that should be considered. One major challenge was the inherent imbalance in the dataset, with fewer samples representing dangerous driving events. Although techniques such as the Synthetic Minority Over-sampling Technique (SMOTE) were employed to address this issue, the limited representation of extreme behaviors, such as severe crashes or near misses, remains a constraint. Other studies, such as Zhu et al. (2022) [
32], have also noted the difficulty of modeling rare but critical events in road safety research. Additionally, the absence of demographic and psychological data (e.g., age, gender, risk aversion) limited the scope of the analysis. Including such variables in future research could provide a more comprehensive understanding of how individual characteristics influence dangerous driving behavior [
10]. Moreover, the on-road study comprised four intervention phases (baseline, ADAS warnings, feedback app, gamification), but the classification analysis pooled data across phases. Therefore, potential intervention-induced distribution shifts were not modelled explicitly and may influence the generalizability of the reported performance.
Excessive false positives in driver risk classification systems can lead to unintended consequences. Frequent unnecessary alerts may cause driver annoyance, resulting in desensitization to real risks, while overly conservative models that minimize false positives may fail to detect truly dangerous behaviors. In real-world applications, striking a balance is crucial ensuring that models provide reliable warnings without overwhelming users. Future work should explore adaptive thresholding techniques that dynamically adjust model sensitivity based on contextual factors, such as road conditions, driving history, and traffic density.
Although the proposed hybrid models demonstrated promising predictive performance for STZ classification, the present study did not include a systematic comparison with their corresponding standalone machine learning models (e.g., Random Forest, Deep Neural Network, RNN, or LSTM). Consequently, while the results demonstrate the effectiveness of the proposed hybrid architectures within the adopted experimental framework, the individual contribution of each hybrid component cannot be isolated. In addition, the class-wise results indicate that the minority risk categories, particularly the Dangerous class, remain more challenging to identify than the Normal class, reflecting the inherent class imbalance and behavioural variability present in naturalistic driving data.
Finally, expanding the geographical scope of this research to include additional regions with varying road infrastructures and traffic laws could improve the generalizability of the findings. Future studies could also explore more complex models that account for factors like urban versus rural driving, weather conditions, and time of day. Furthermore, integrating physiological data, such as heart rate or eye movements, could provide deeper insights into the impact of fatigue and stress on driving behavior [
33].
In conclusion, this study offers a novel approach to classifying dangerous driving behaviors using hybrid machine learning models, integrating both deep learning and machine learning techniques. Although LIME provided useful insight into the overall influence of the selected behavioural variables, the present study summarised feature importance across the analysed observations rather than investigating class-specific explanations. Consequently, the reported results should be interpreted as an overall indication of model behaviour and not as feature contributions for individual STZ classes. Future work should incorporate class-specific explainability analyses using LIME or complementary explainable artificial intelligence techniques, thereby providing a more detailed understanding of the factors influencing the classification of normal, dangerous and avoidable accident driving behaviour.
6. Conclusions
This research developed highly effective models for classifying dangerous driving behaviors, grounded in real-world data gathered from drivers in Belgium and the UK. By employing a combination of advanced machine learning and deep learning methodologies, the models achieved impressive accuracy in identifying risky driving patterns. A key outcome of the study is the identification of specific driving behaviors, particularly harsh acceleration, harsh braking, and total driving distance, as significant indicators of driver safety. The comparative analysis between Belgium and the UK also revealed notable differences in driving habits, with speed and long-distance travel being more critical in the UK, while sudden maneuvers were more prevalent in Belgium.
The hybrid modeling approach, combining Deep Neural Networks (DNN) and Random Forest (RF), was particularly successful, consistently delivering high accuracy across both countries. The study further highlighted that, while harsh acceleration and braking were dominant risk factors in Belgium, in the UK, longer travel distances and higher speeds posed greater risks. These insights point to the need for customized safety interventions that reflect the distinct driving behaviors of different regions.
A notable contribution of this study is the integration of hybrid machine learning models with explainable artificial intelligence techniques (LIME) for the classification and interpretation of risky driving behaviour. The ability to transparently understand how individual driving factors influence safety assessments provides crucial advantages, particularly in addressing concerns about the opaque nature of machine learning models. This transparency ensures that insights from the models are not only accurate but also actionable for stakeholders looking to enhance road safety policies and systems. By identifying the key variables influencing risky behaviors, such as cognitive overload or fatigue, these models pave the way for integrating behavioral science with predictive analytics. This fusion could lead to more targeted interventions that address the root causes of dangerous driving.
A limitation of the present study concerns the level of data aggregation and the validation strategy employed. Although the original i-DREAMS dataset was recorded in consecutive 30 s intervals, the modelling framework utilised trip-level summary descriptors (e.g., mean values and cumulative measures) derived from these intervals in order to characterise the overall driving behaviour during each trip. While this approach reduces data dimensionality and improves computational efficiency, it may not fully capture the temporal evolution of risky driving behaviour within individual intervals. Furthermore, the use of a conventional random hold-out split does not explicitly account for repeated observations from the same driver and may therefore result in slightly optimistic estimates of predictive performance. Future research should investigate interval-level modelling approaches that preserve the temporal characteristics of the data and employ driver-wise or trip-wise cross-validation strategies to provide a more rigorous evaluation of model generalizability across unseen drivers. A further limitation concerns the use of recurrent and convolutional-recurrent architectures with aggregated four-feature inputs. Although the original observations were derived from 30 s driving intervals, the four positions supplied to the RNN and CNN-LSTM represented different behavioural indicators rather than successive temporal observations. These models therefore did not exploit interval-to-interval temporal dependencies in the strict sequence-modelling sense. Their results should be interpreted as a comparison of alternative nonlinear architectures operating on a common four-feature representation. Future research should retain the chronological ordering of consecutive intervals and construct input tensors containing multiple observations per driver or trip. Such an approach would permit the RNN and CNN-LSTM models to evaluate changes in speed, acceleration, braking, and risk state over time.
It should also be noted that the main analysis pooled observations from all four field-trial phases. As the later phases introduced real-time ADAS warnings, post-trip feedback, and gamification, the distribution of the predictors and labels may have shifted over the course of the study. A Phase-1-only (intervention-free baseline) analysis would isolate this effect and represents an important robustness check; this was not performed in the present study and is identified as a priority for future work. Future studies should model intervention phase explicitly, for example by including phase as a covariate, training separate phase-specific models, or evaluating cross-phase transfer in which a model trained on baseline data is tested on intervention-period data.
A further limitation of this study is that the proposed hybrid architectures were not benchmarked against their corresponding standalone machine learning models, such as Random Forest, Deep Neural Networks, or recurrent neural networks implemented independently. Consequently, although the hybrid models demonstrated strong predictive performance, the individual contribution of each hybrid component cannot be quantified within the scope of the present work. In addition, while overall evaluation metrics were reported, the lower recall observed for the minority Dangerous and Avoidable Accident classes highlights the inherent difficulty of identifying higher-risk driving behaviour. Future research should include systematic benchmarking against standalone algorithms, together with detailed per-class performance analyses, to better assess the benefits and limitations of hybrid modelling strategies for imbalanced naturalistic driving datasets.
Expanding this research presents multiple opportunities to enhance the predictive power and applicability of hybrid models for driving risk classification. Increasing dataset size, particularly for rare and critical events such as severe crashes and near misses, would improve model reliability. Additionally, incorporating driver demographics, psychological traits (e.g., fatigue levels, risk tolerance), and physiological indicators (e.g., heart rate variability, eye tracking) could enable more personalized risk assessments. Broadening the geographic scope of future studies to include diverse road infrastructures, traffic laws, and driving cultures would enhance model generalizability. Testing these models in real-world settings, such as within Advanced Driver Assistance Systems (ADAS) or connected vehicle environments, could provide validation through live driving assessments. Real-time feedback systems that alert drivers to potential hazards could serve as proactive safety interventions, potentially reducing accident rates. Furthermore, integrating multi-modal data (e.g., behavioral, environmental, and physiological) could refine the models’ ability to predict and mitigate risky driving behaviors. Deploying these models in real-time driving environments and evaluating their effectiveness across varied conditions, such as urban versus rural settings and different weather scenarios, would ensure their robustness. Ultimately, these advancements could contribute to more adaptive and personalized road safety strategies, improving overall traffic safety outcomes.
In conclusion, this study marks a significant step forward in the application of machine learning for improving road safety. By leveraging predictive modeling and real-time systems, the research opens up new possibilities for reducing crash risks and promoting safer driving practices. Its focus on interpretability, behavioral mechanisms, and region-specific interventions provides a valuable contribution to ongoing efforts to bridge the gap between data-driven insights and practical road safety applications.