Article

Shear Performance of Sustainable Self-Compacting Geopolymer RC Beams: Experimental and Numerical Study


by
Mohamed E. Fathi
1,
Mohamed E. El-Zoughiby
1,
Mohamed Mortagi
1,2,
Osama Youssf
3,1,*,
Mohanad Abdulazeez
4 and
Ahmed M. Tahwia
1
1
Structural Engineering Department, Mansoura University, Mansoura 35516, Egypt
2
Faculty of Engineering, Mansoura National University, Gamasa 35712, Egypt
3
Civil and Environmental Engineering Department, United Arab Emirates University, Al Ain 15551, United Arab Emirates
4
School of Science and Engineering (SSE), University of Missouri-Kansas City (UMKC), Kansas City, MO 64110, USA
*
Author to whom correspondence should be addressed.
Infrastructures 2026, 11(3), 84; https://doi.org/10.3390/infrastructures11030084
Submission received: 27 November 2025 / Revised: 15 February 2026 / Accepted: 4 March 2026 / Published: 6 March 2026

Abstract

This research investigates the shear performance of sustainable self-compacting reinforced geopolymer concrete (GPC) beams incorporating granite waste powder (GWP) and ground granulated blast-furnace slag (GGBFS) as eco-friendly binding agents through experimental and numerical analyses. Five geopolymer reinforced concrete beam specimens (100 mm × 150 mm × 1500 mm) were tested under two-point loading conditions to evaluate the influence of longitudinal reinforcement ratio (0.85% to 2.0%) and shear span-to-effective depth ratio on the structural shear performance. The experimental investigation revealed that geopolymer reinforced concrete beams exhibit shear behavior characteristics similar to conventional Portland cement concrete beams, with the 2.0% reinforcement ratio achieving 18.3% higher shear strength compared to the 0.85% reinforcement ratio, while shear capacity increased proportionally with increasing shear span-to-depth ratio. Experimental data, including load–displacement response, shear strength measurements, strain distributions, failure modes, and crack patterns, were studied. Finite element nonlinear analysis was conducted by modifying the concrete modulus and stress–strain relationships to reflect the properties of geopolymer concrete using ABAQUS software integrated with the concrete damaged plasticity model. The results demonstrated that for the tested geopolymer reinforced concrete beams, first cracking load, steel yielding load, and ultimate load capacity increased systematically with increasing tension steel reinforcement ratio and proportionally with higher shear span-to-depth ratios.

1. Introduction

The global construction industry is a significant contributor to carbon dioxide (CO2) emissions [1,2,3,4], primarily due to the energy-intensive production of ordinary Portland cement (OPC), which has spurred extensive research into sustainable alternatives. Among these, geopolymer concrete (GPC) has emerged as a promising, eco-friendly solution [5,6,7]. GPC is synthesized through the alkali-activation of aluminosilicate-rich materials such as granite waste powder and ground granulated blast-furnace slag (GGBFS) to form a three-dimensional polymeric network that offers comparable or even superior mechanical and durability properties to conventional concrete, while significantly reducing CO2 emissions [8,9,10,11]. However, while the material properties of GPC are well-documented, its structural applications, particularly the shear behavior of reinforced GPC beams, remain a less explored yet critical area for ensuring design safety and reliability [11], despite initial studies indicating performance similarities to OPC [12,13,14,15,16,17]. Initial studies established a promising baseline, with researchers like Visintin et al. (2017) [17] and Yacob et al. (2019) [18] observing that GPC beams exhibit cracking patterns and failure modes comparable to their OPC counterparts. Furthermore, they found that existing design codes like ACI 318 [19] and Australian Standards AS-3600 [20] provide reasonable predictive accuracy for shear strength. Building on this, more recent research has delved deeper into specific parameters. For instance, the experimental work by Shibayama and Nishiyama (2023) [16] on fly-ash-based GPC beams confirmed that established design equations can be effectively applied, which is vital for building confidence in GPC’s structural use. Taking this a step further, Hui et al. (2025) [21] not only confirmed the significant influence of stirrup and shear span ratios but also proposed a new, tailored shear capacity equation that showed strong alignment with their experimental results. The scope of investigation has also expanded to more practical structural forms, with Mao et al. (2025) [22] examining T-beams and concluding that while failure modes were similar, current codes tend to underestimate their shear resistance, leading them to propose a more accurate predictive model. However, this body of work is not without cautionary findings; the work of Wu et al. (2020) [23] on slag-based GPC, for example, highlighted a potential vulnerability, noting that while ultimate strength was comparable to OPC, the cracking resistance was lower, suggesting that existing models still require refinement.
Self-compacting concrete (SCC), characterized by its high flowability, filling ability, and resistance to segregation, has revolutionized concrete placement in complex and densely reinforced structures [24]. The integration of geopolymer technology with self-compacting properties has led to the development of self-compacting geopolymer concrete (SCGC), offering both environmental and practical advantages [12,25,26]. SCGC must adhere to specific workability standards, such as those outlined by the European Guidelines for Self-Compacting Concrete (EFNARC) [27], to ensure its effectiveness in both fresh and hardened states.
While significant research has been conducted on the mechanical properties of geopolymer concrete using fly ash and slag, the structural behavior of members combining self-compacting geopolymer concrete (SCGC) with industrial by-products like granite waste powder (GWP) remains largely unexplored. Specifically, to the best of our knowledge, no previous studies have investigated the shear behavior of reinforced GPC beams incorporating GWP. This study aims to address this critical research gap. The novelty of this work lies in its focus on the synergistic effect of using SCGC and GWP on the shear transfer mechanisms, crack patterns, and overall failure modes of reinforced concrete beams. By focusing on key design parameters such as the longitudinal reinforcement ratio and shear span-to-effective depth ratio, this investigation aims to contribute to the understanding of this material’s behavior and provide initial data that can support the future development of design guidelines for this sustainable geopolymer concrete technology.

2. Materials and Methods

2.1. Binder

The geopolymer concrete (GPC) utilized in this investigation was formulated using a composite binder consisting of granite waste powder (GWP), silica fume (SF), and ground granulated blast-furnace slag (GGBFS). These components were selected for their inherent pozzolanic and latent hydraulic properties, which are essential for the geopolymerization process [28]. Detailed chemical and physical characteristics of GWP, GGBFS, and SF are presented in Table 1.

2.2. Fine Aggregate

Silica and quartz sand used as fine aggregates. These materials were tested in accordance with the relevant provisions of IS 2386 [29] to ensure compliance with the required specifications for particle size distribution and other physical properties essential for concrete production.

2.3. Reinforcing Steel Bars

Deformed steel bars (Grade B-420 DWR) were used for the primary longitudinal reinforcement, while plain steel bars (Grade B-300 C-P) were utilized for shear reinforcement (stirrups). For the purpose of analysis, the modulus of elasticity of the steel reinforcement (Es) was taken as the standard value of 200 GPa. The mechanical characteristics of these reinforcing steel bars were determined by conducting tensile tests on three representative samples for each bar type, in accordance with ASTM A615 [30]. The average results, which are critical for assessing the structural behavior of the reinforced geopolymer concrete beams, detailed in Table 2.

2.4. Alkaline Activator Solution

The alkaline activator solution (AAS) is a critical component that initiates and sustains the geopolymerization reaction. The AAS comprised a combination of sodium silicate solution (Na2SiO3), sodium hydroxide (NaOH) pellets, and potable water. Its primary function is to dissolve the reactive silicon (Si) and aluminum (Al) in the GWP and GGBFS, creating a highly alkaline environment conducive to the condensation polymerization reaction [31].
The commercially available sodium silicate (Na2SiO3) solution used in this study had a silicate modulus (MS = SiO2/Na2O) of 2.0, with a chemical composition of approximately 29.4% SiO2, 14.7% Na2O, and 55.9% water by mass.
Commercially sourced NaOH pellets (97–98% purity, approx. 2.5 mm size) were used to prepare a 14-molar (14M) NaOH solution by dissolving them in potable water. The alkaline activator solution (AAS) was prepared by mixing the sodium silicate (Na2SiO3) solution and the sodium hydroxide (NaOH) solution. A mass ratio of the Na2SiO3 solution to the NaOH solution of 2.0 was maintained for all mixes. This specific ratio was vital for optimizing the chemical reaction and ensuring the formation of a strong and durable geopolymer concrete matrix.
To manage the exothermic heat generated during the dissolution of NaOH pellets, the NaOH solution was prepared 24 h before casting to allow for gradual heat dissipation and ensure a stable solution temperature [3]. The final AAS was formed by combining the separately prepared sodium hydroxide and sodium silicate solutions immediately before casting.

2.5. Superplasticizer

To achieve the desired workability and self-compacting properties, a high-performance superplasticizer [22] was incorporated. This admixture enhanced the flowability of the concrete without increasing its water content, which was essential for ensuring the mix could achieve full compaction under its own weight, even with dense reinforcement, as required for self-compacting concrete applications. The key characteristics of the superplasticizer are presented in Table 3.

2.6. Ingredients and Mix Design Properties

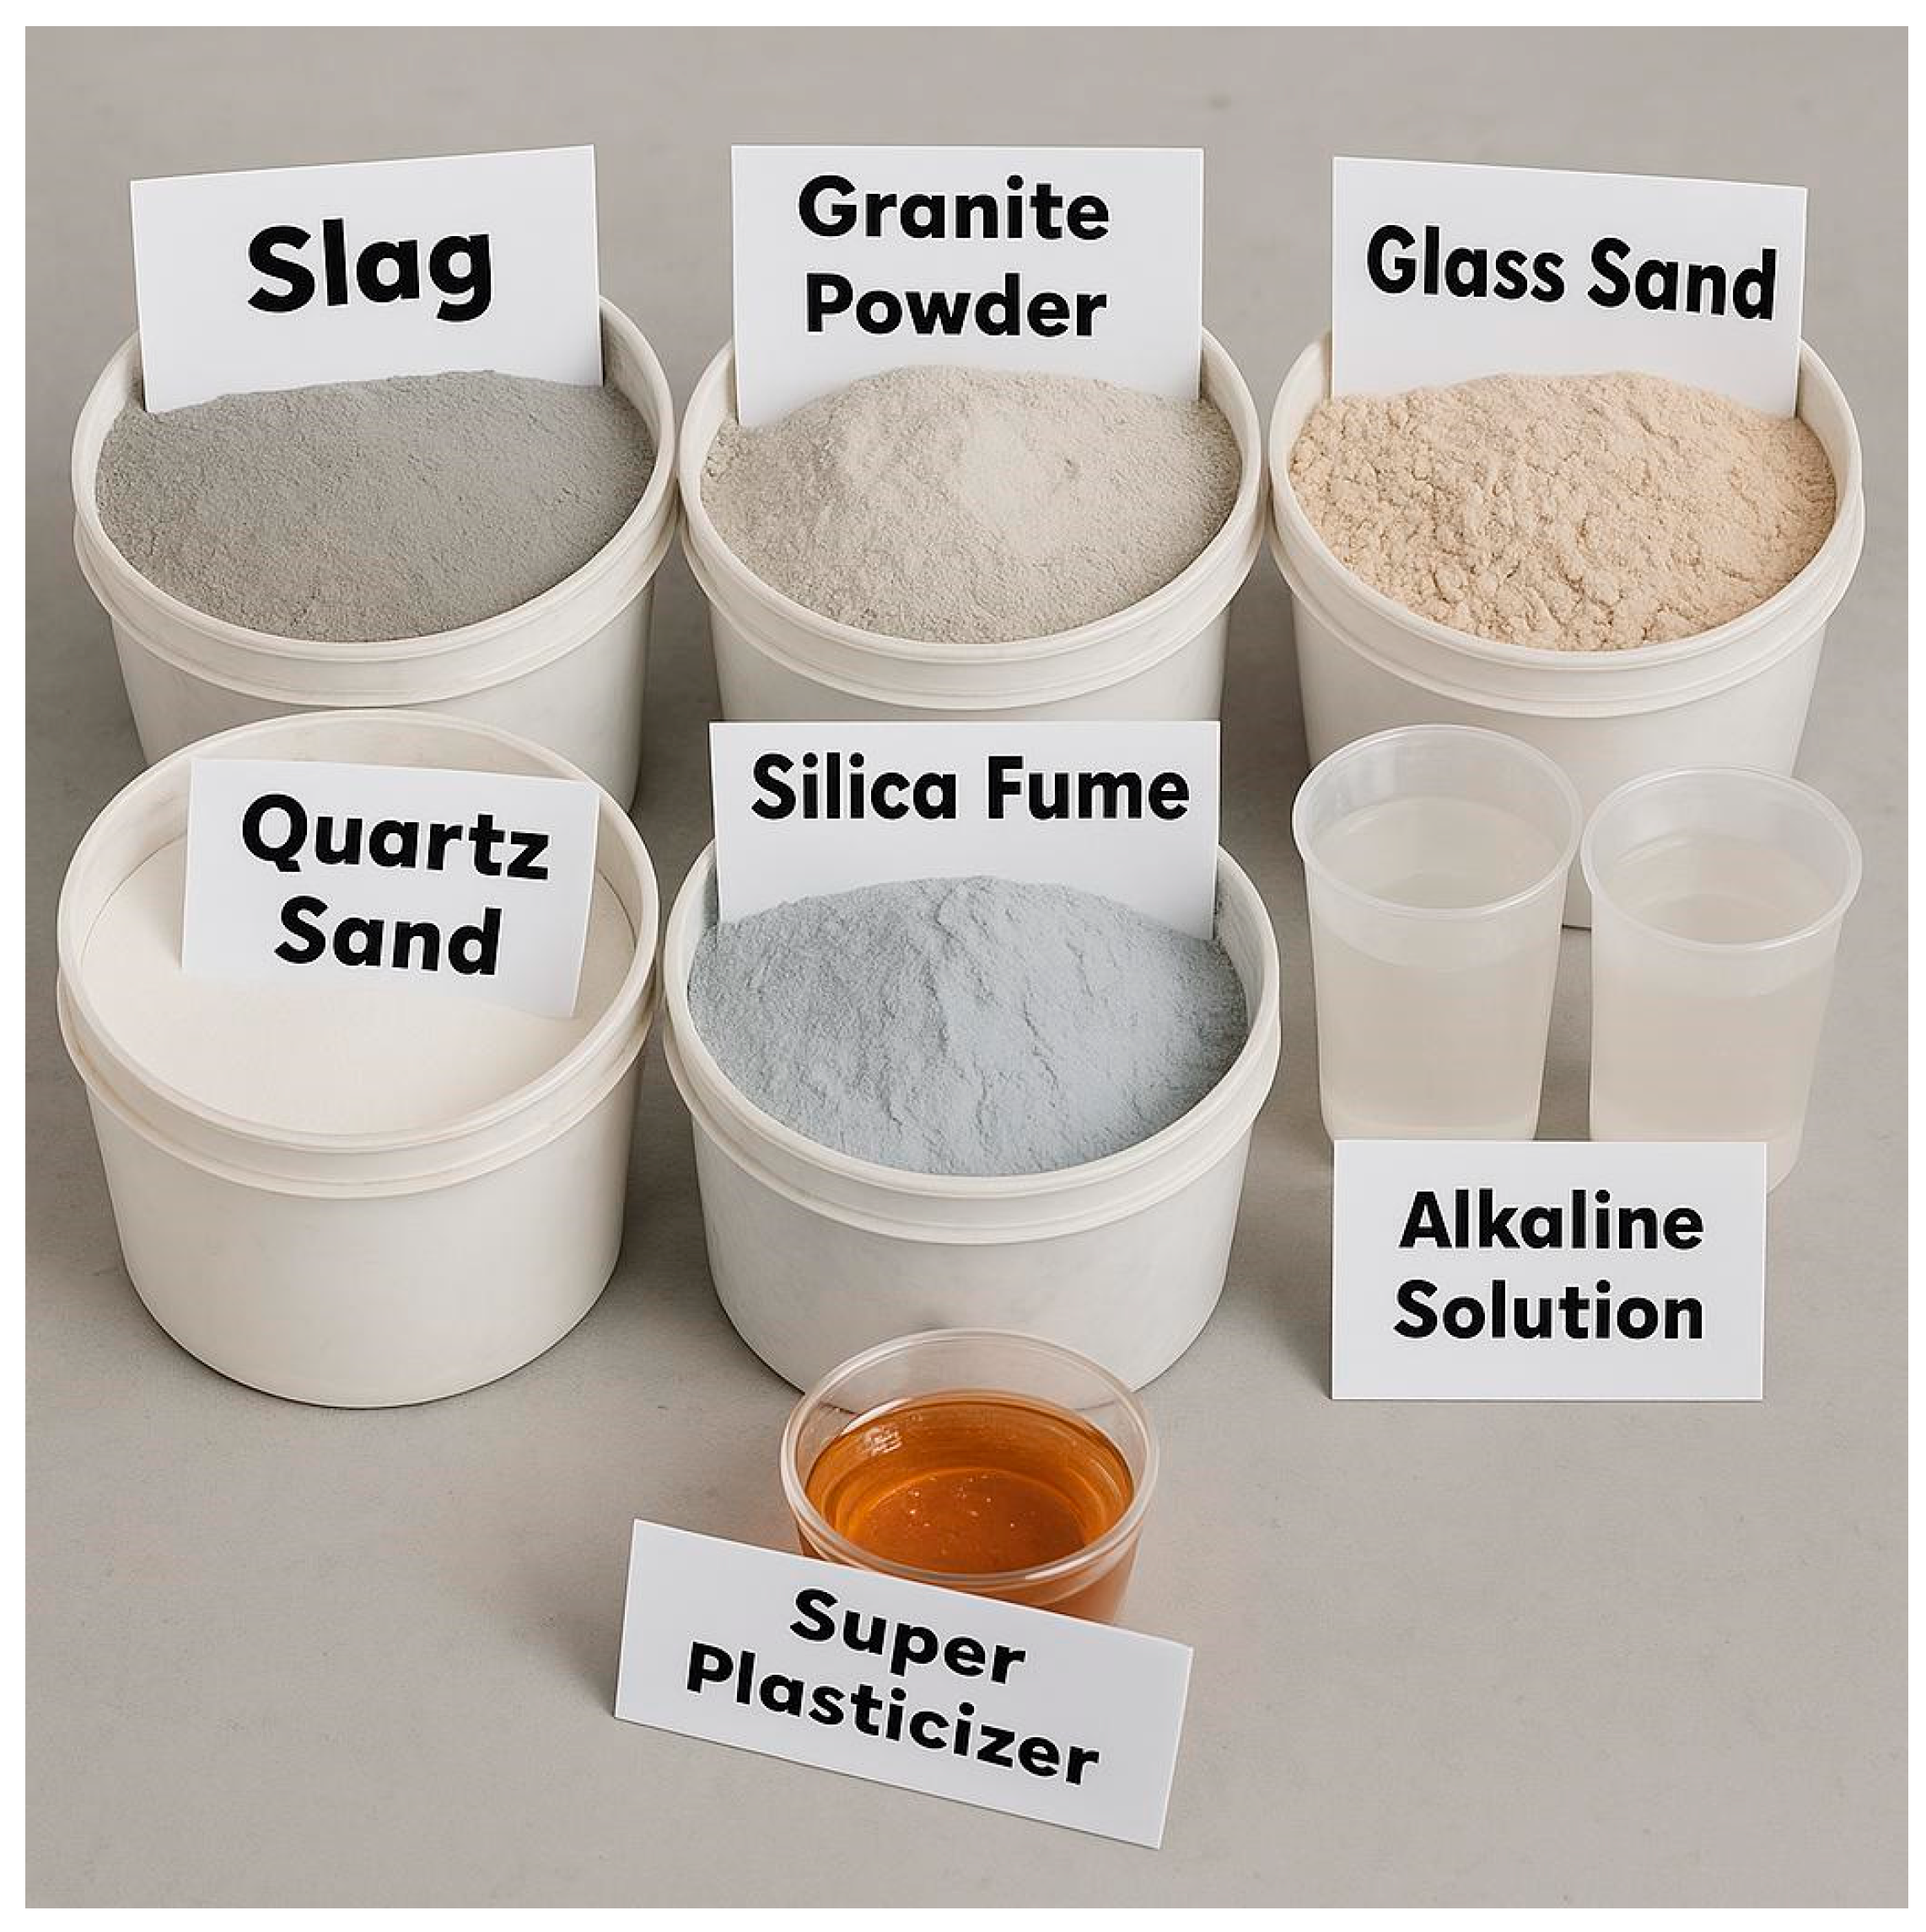
The selection and proportioning of ingredients were critical for achieving the desired performance characteristics of the geopolymer concrete. Figure 1 visually represents the various materials utilized in the preparation of the GPC mix [1,3,5,23]. The mix proportions for the GPC constituents are detailed in Table 4.
A key parameter governing concrete’s properties is the binder-to-water ratio. For this study, the total binder content (b), consisting of granite waste powder (GWP), silica fume (SF), and ground granulated blast-furnace slag (GGBFS), was 900 kg/m3. The total water content (w) was calculated by summing all water sources within the mix. No additional free water was used. The water content consisted solely of 34 kg/m3 from the sodium silicate solution and 59 kg/m3 used for dissolving the sodium hydroxide pellets. This resulted in a total water content of 93 kg/m3 and a final binder-to-water (b/w) ratio of 9.68.

2.6.1. Mixing

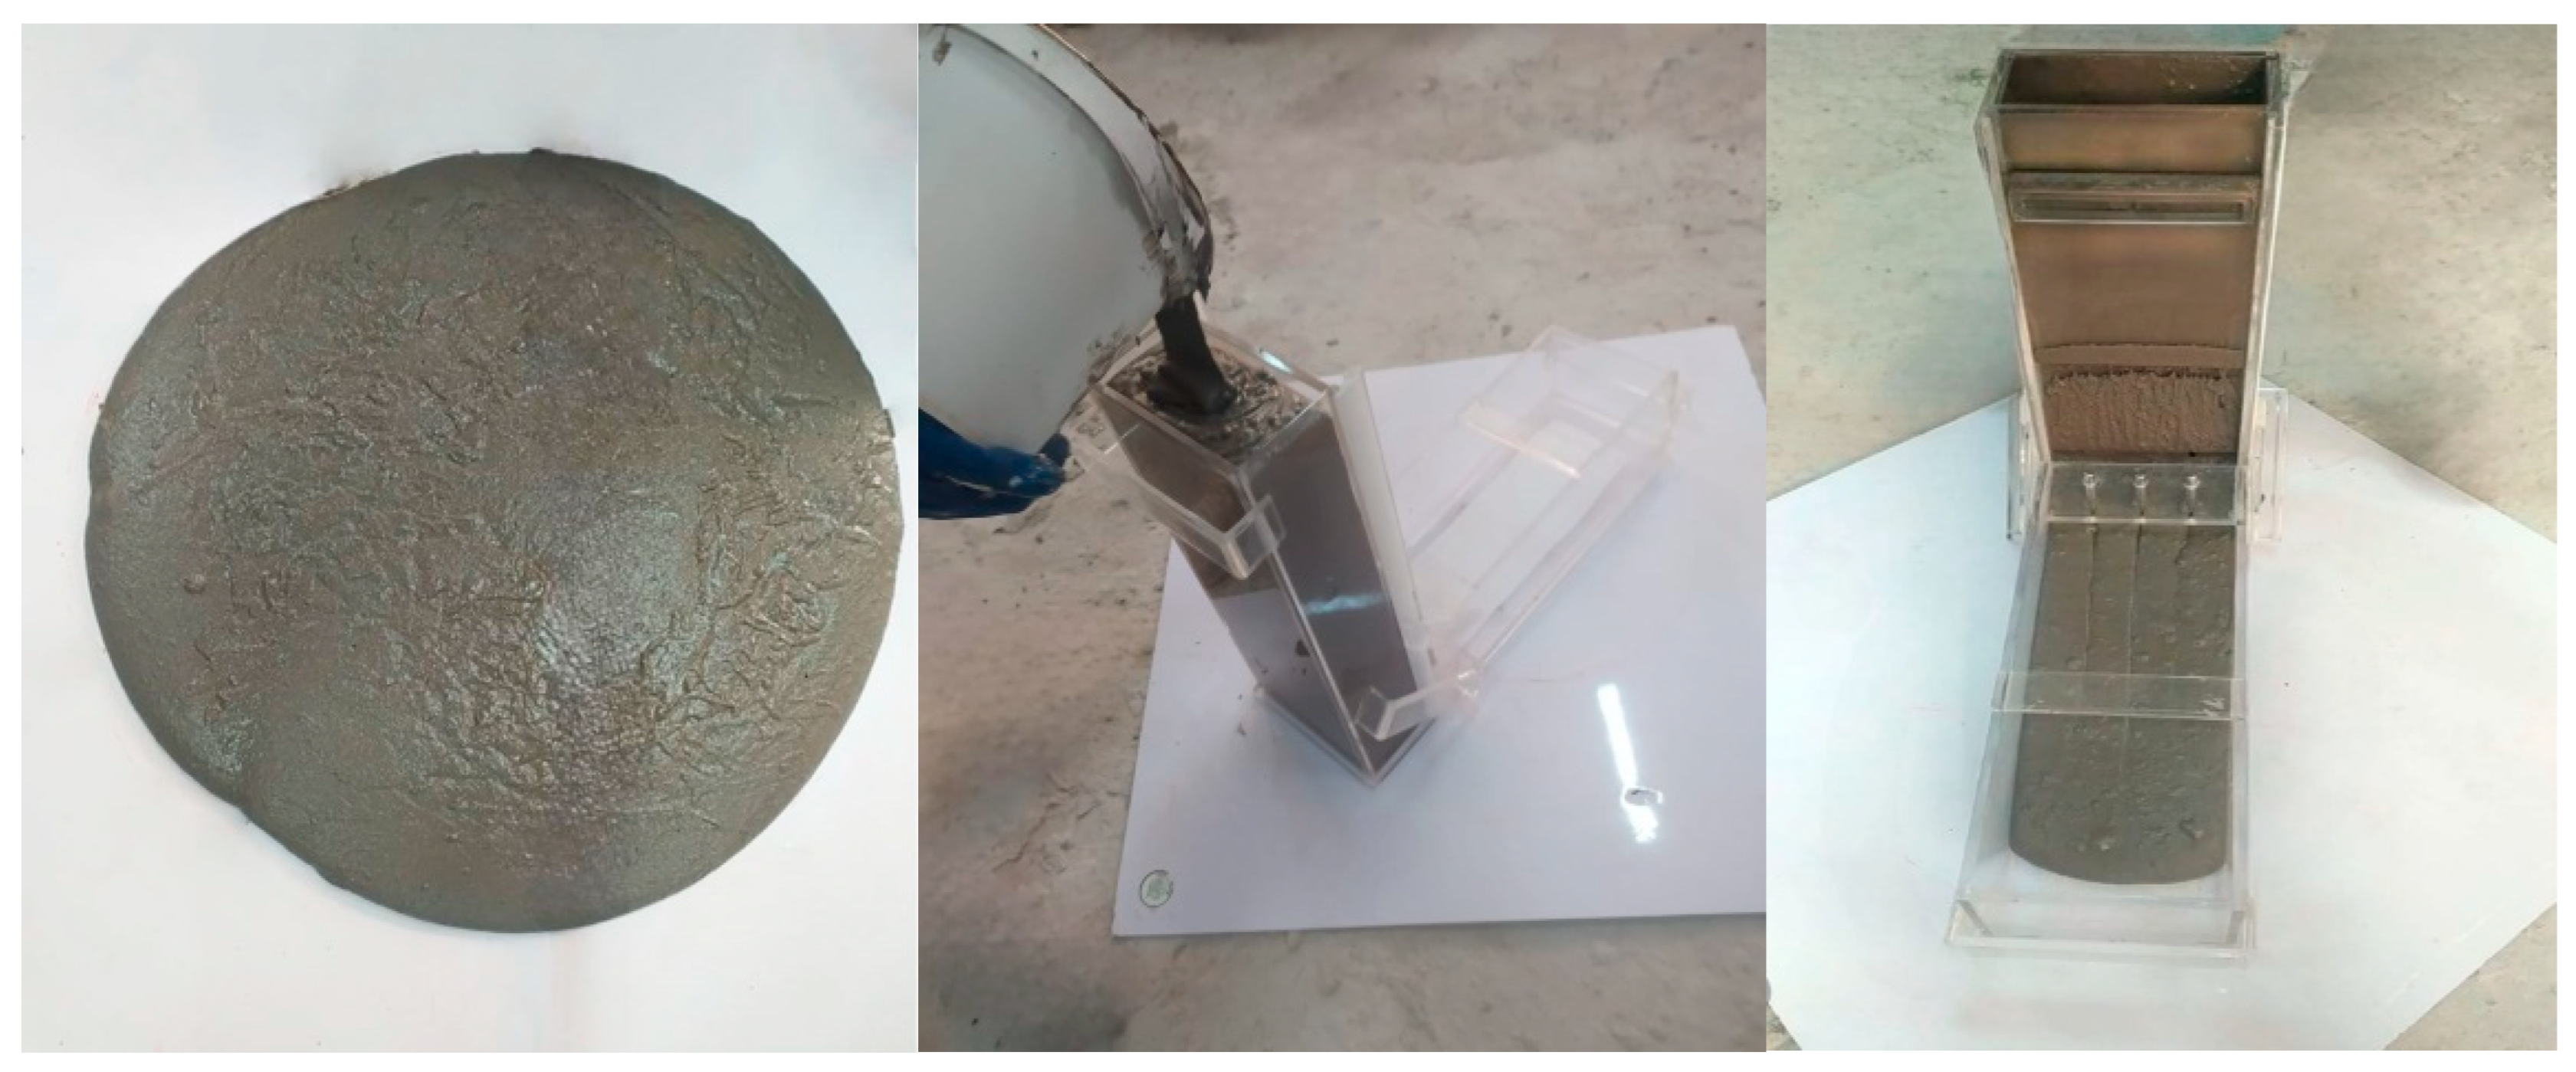
Self-compacting geopolymer concrete (SCGC) was prepared using a precise two-stage mixing process to ensure homogeneity and optimal performance. The process began with dry mixing the binder components (granite powder, silica fume, and ground granulated blast-furnace slag) with fine aggregates for three minutes. Subsequently, the alkaline activator solution was gradually added, followed by an additional four minutes of mixing to achieve complete homogeneity and initiate the geopolymerization reaction. Finally, the fresh concrete underwent workability assessments, including the slump-flow [32] and L-Box [33] tests (Figure 2), to verify its compliance with the European Guidelines for self-compacting concrete (EFNARC) [27]. The results of these fresh property tests are detailed in Table 5.

2.6.2. Casting

The internal surfaces of the molds were treated with a release agent before the self-compacting geopolymer concrete was poured, relying on its own weight for placement. The material’s high flowability ensured complete compaction without external vibration, preventing segregation, even in densely reinforced sections. Concurrently, for each of the five-geopolymer beams, a comprehensive set of auxiliary specimens was casted to determine the concrete’s mechanical properties. This set included three 50 mm cubes for compressive strength [34], six 50 × 100 mm cylinders for splitting tensile strength [35], six 40 × 40 × 160 mm prisms for flexural strength [36], and three 150 × 300 mm cylinders for modulus of elasticity [37]. All specimens were demolded 24 h after casting [2,38].

2.6.3. Heat Curing

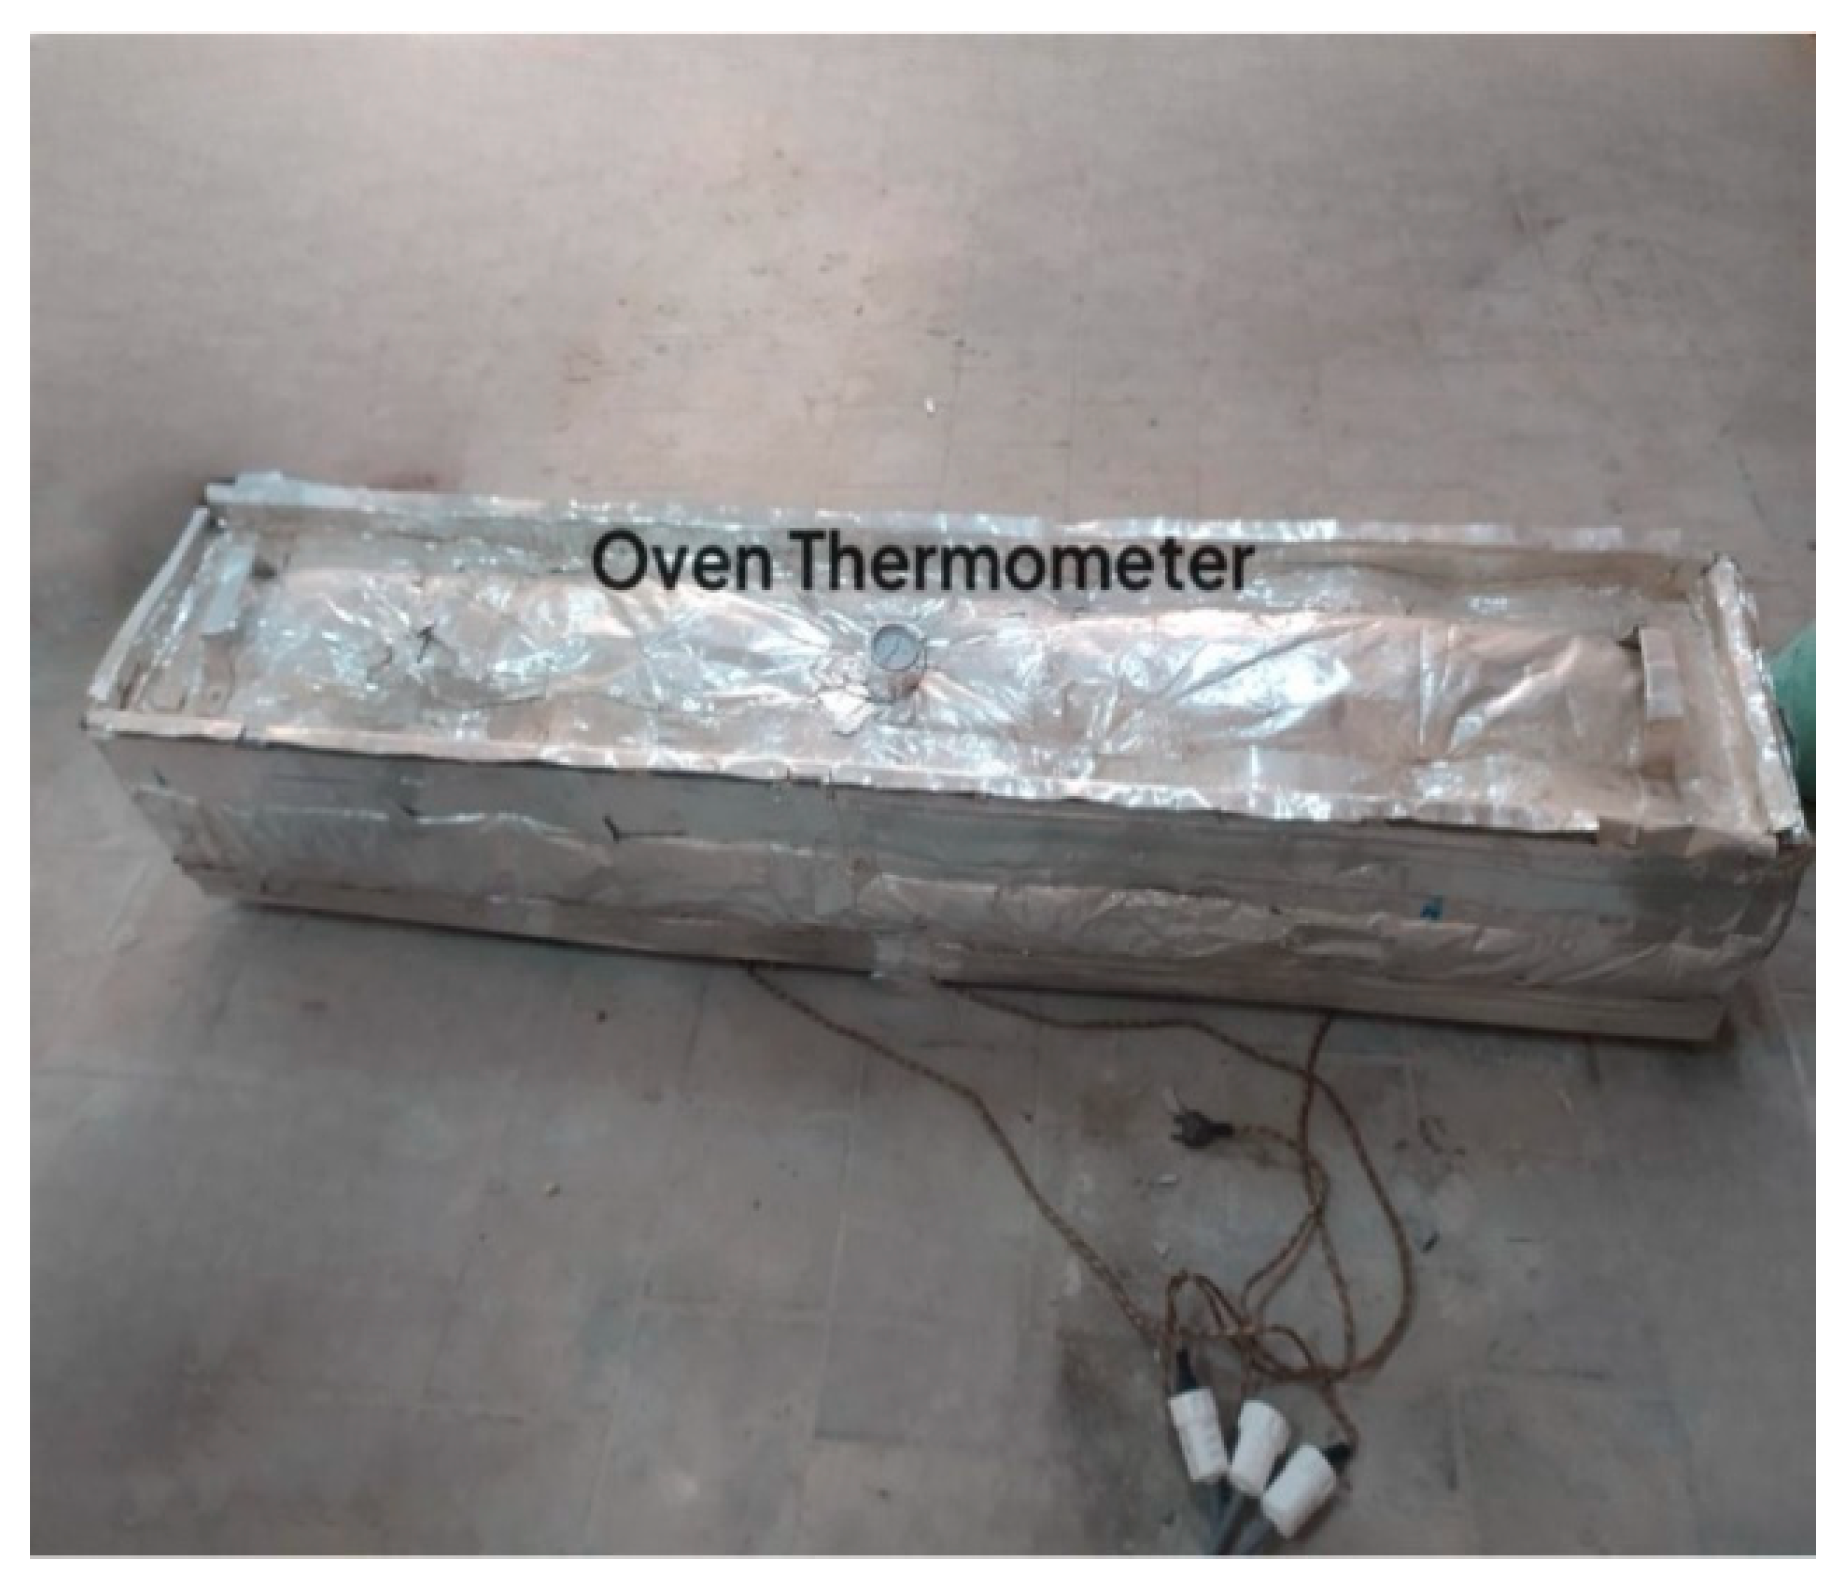
Following demolding, the geopolymer concrete specimens were placed in an oven for a 24 h heat curing cycle at a controlled temperature of 65 °C (Figure 3). This thermal treatment is a critical step designed to accelerate the geopolymerization process and significantly enhance the early-age strength development of the GPC.

3. Experimental Program

3.1. Input Data

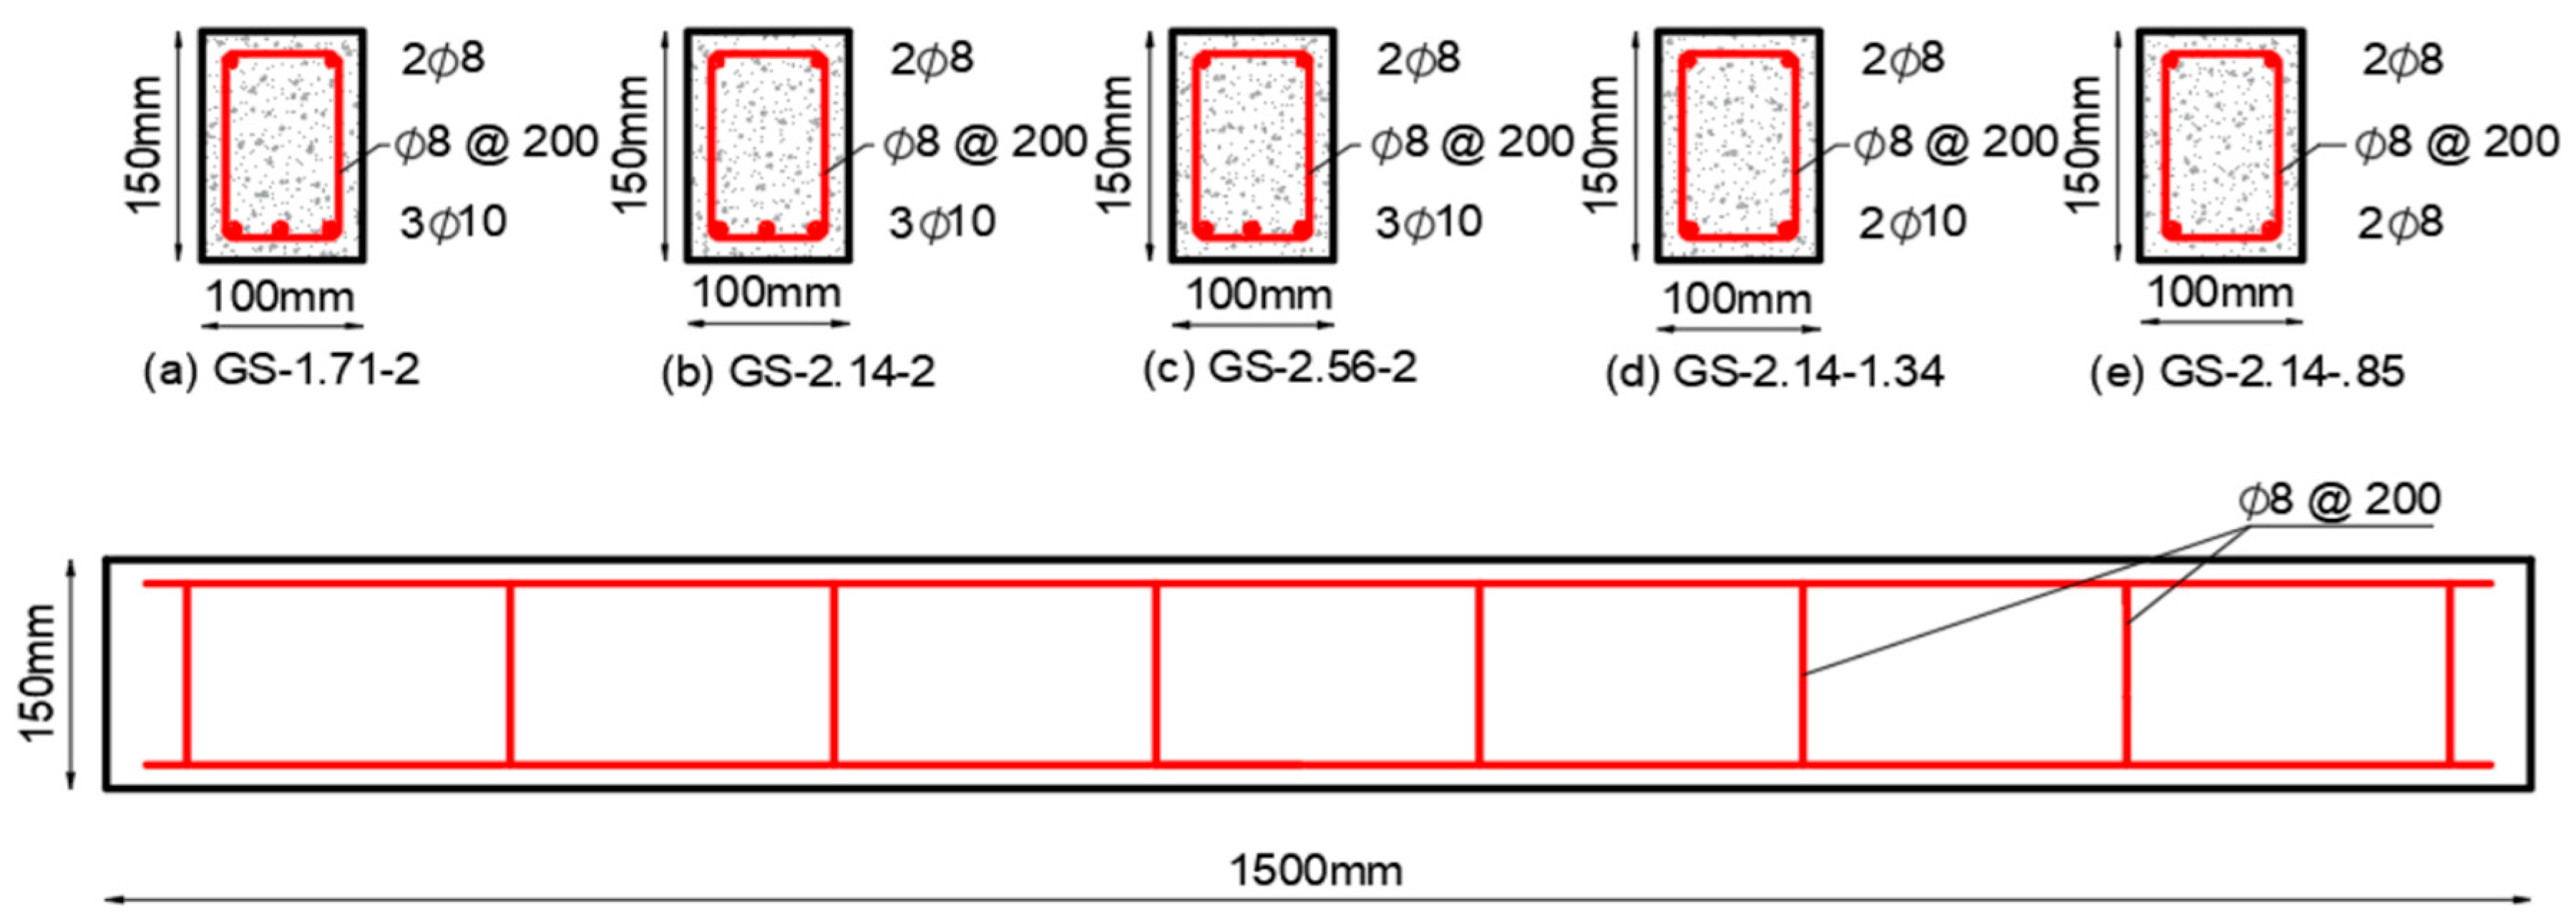
The experimental program involved testing five geopolymer concrete beams: one beam per variable. Each beam had a rectangular cross-section of 100 mm width (bw) and 150 mm depth, and a total length of 1500 mm. As the beams were rectangular, the flange-to-web width ratio (b/bw) was 1.0 for all specimens. The beams were designed as simply supported over a clear span of 1300 mm, with a constant concrete clear cover of 20 mm maintained for all specimens. High-yield strength deformed steel bars were used for longitudinal reinforcement (8 mm and 10 mm diameters, with mean yield strengths of 531.5 MPa and 517.1 MPa, respectively). For shear reinforcement, 8 mm diameter plain steel stirrups with mean yield strength of 354 MPa were utilized. The mechanical properties of the geopolymer concrete were characterized (elastic modulus (Ec) of 2.8 × 10⁴ MPa and Poisson’s ratio (ν) of 0.2). The hardened concrete properties are summarized in Table 6. The detailed methodology for these tests, including specimen dimensions and standards, is described in Section 2.6.2, as the auxiliary specimens were prepared concurrently with the main beams.
Test Configurations:
To investigate the shear behavior of GPC beams, two primary experimental variables were considered:
  • Shear span-to-depth ratio (a/d): Three beams were designed to study the influence of varying (a/d) ratios. These beams were consistently reinforced with 3T10 bars at the bottom (longitudinal reinforcement ratio, μs = 2%) and 2T8 bars at the top. Shear reinforcement consisted of 8 mm diameter (two-leg) stirrups spaced at 200 mm center-to-center (c/c).
  • Longitudinal reinforcement ratio (μs): To assess the impact of varying longitudinal reinforcement, the μs values were set at 2%, 1.34%, and 0.85%. For this series of tests, the (a/d) ratio was kept constant at 2.14. The top reinforcement remained consistent at 2T8 bars, while the bottom reinforcement varied: 3T10 bars (μs = 2.0%), 2T10 bars (μs = 1.34%), and 2T8 bars (μs = 0.85%).
Shear reinforcement for this set of beams also consisted of 8 mm diameter (two-leg) stirrups spaced at 200 mm c/c. The geometric and reinforcement details of the tested beams are presented in Table 7 and Figure 4.

3.2. Test Setup

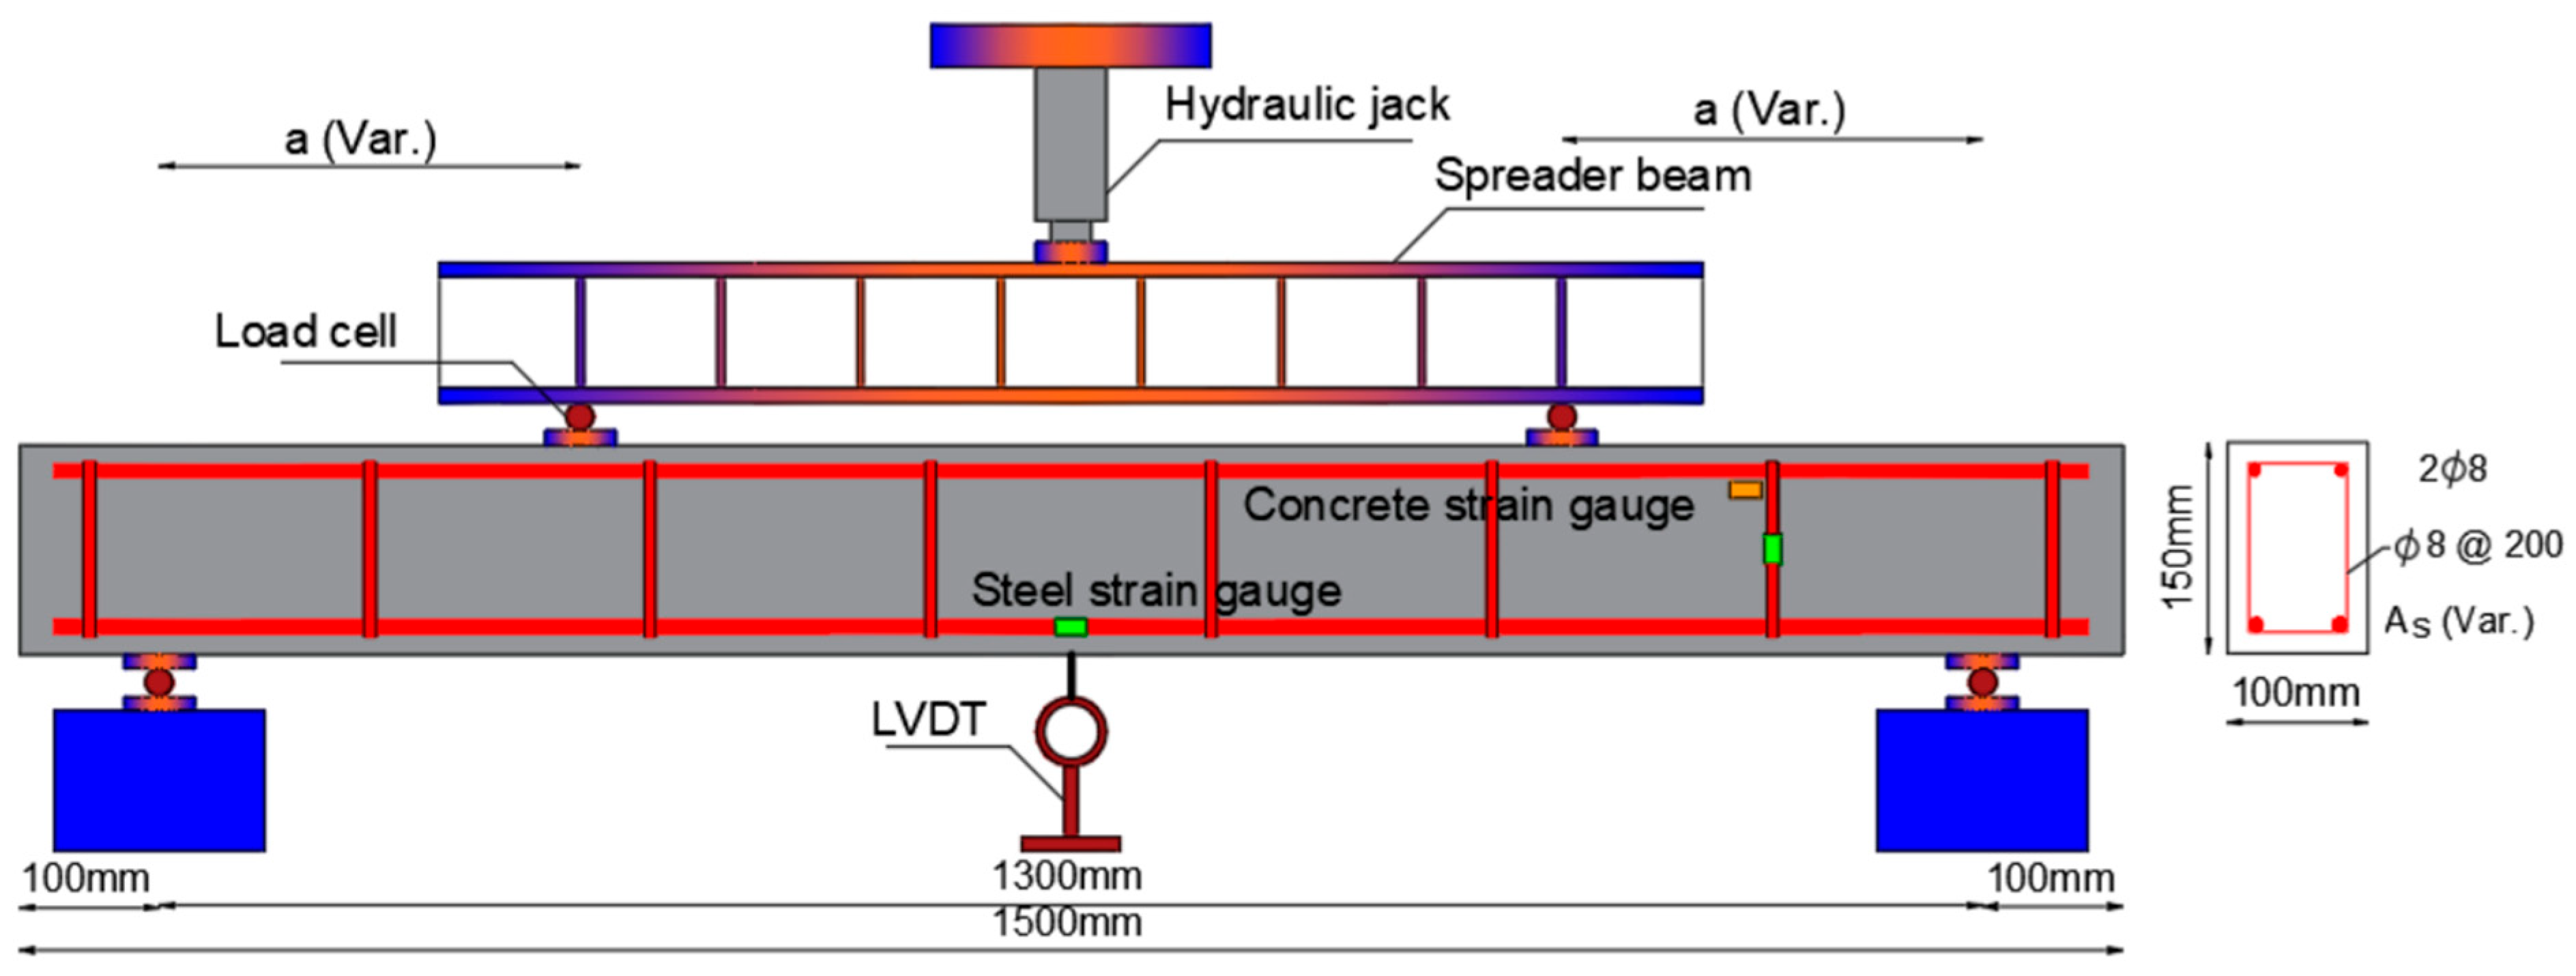
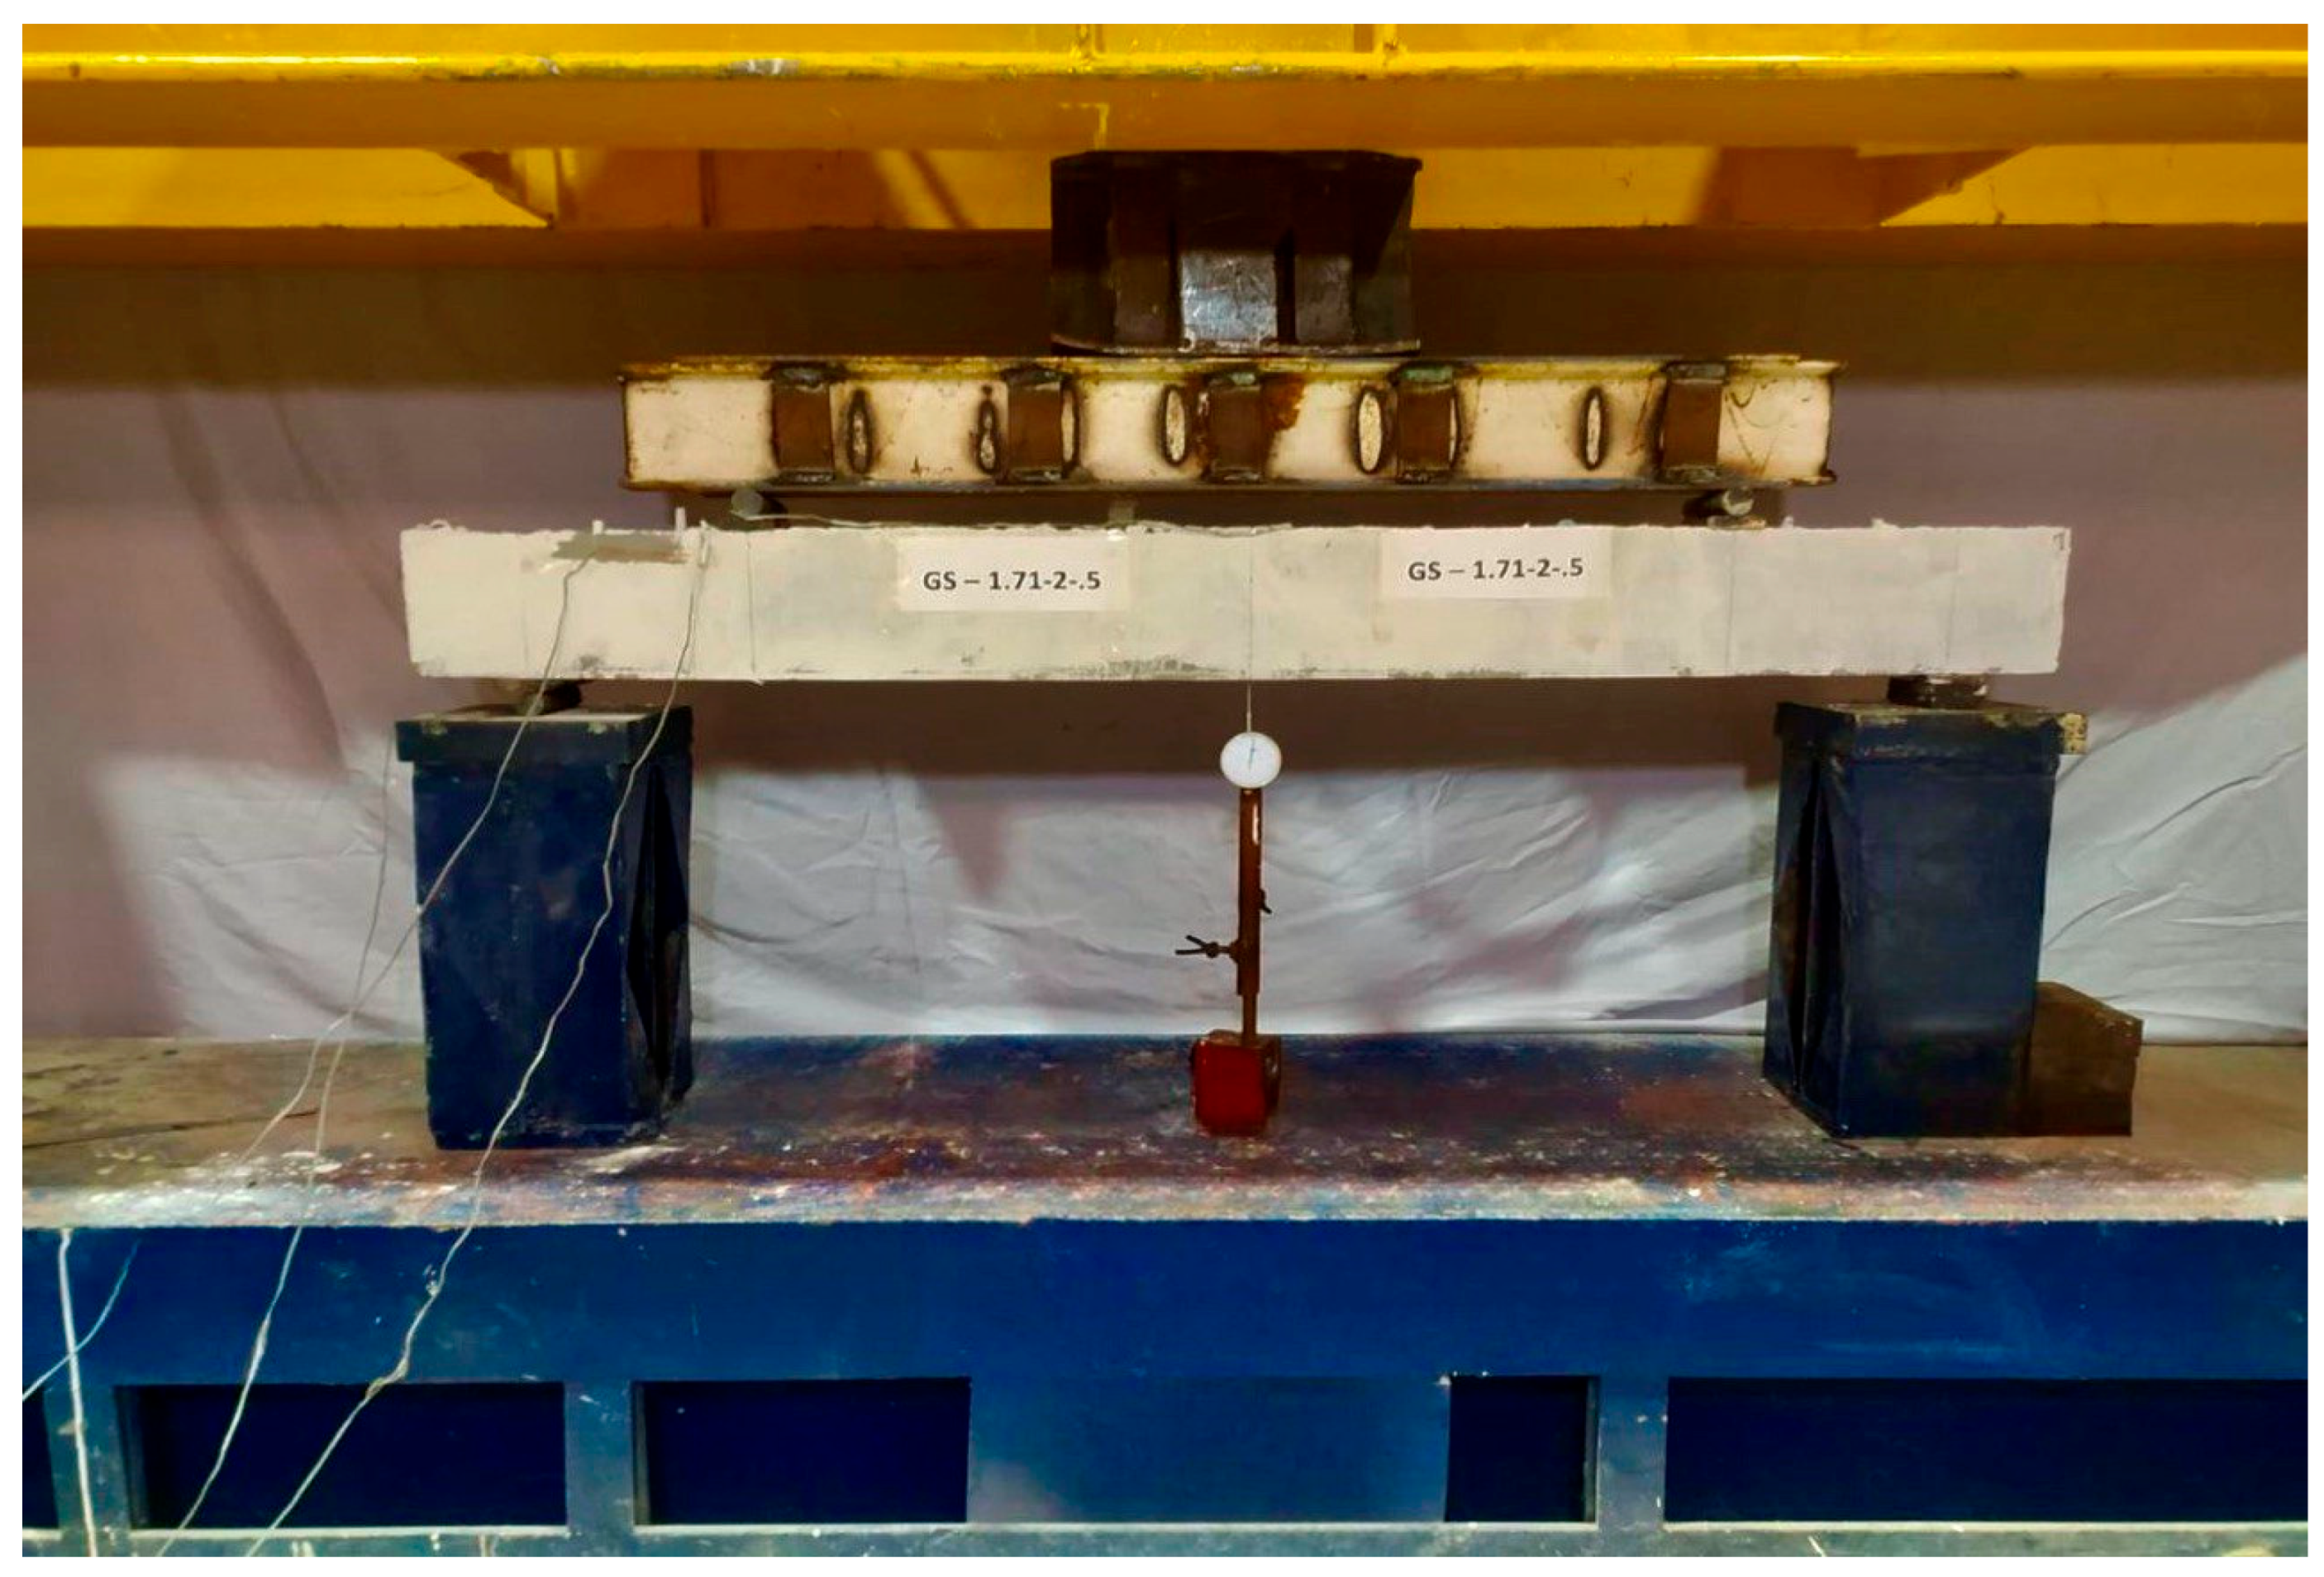
The experimental setup [37], schematically illustrated in Figure 5 and Figure 6, was designed to apply two-point loads symmetrically along the beam’s span, simulating typical shear loading conditions. The spacing of these point loads was a key experimental variable, adjusted to achieve the different target shear span-to-effective depth ratios (a/d) under investigation. The detailed rationale and the specific a/d values for each beam are described in the Experimental Program section (Section 3.1), and the specific a/d values for each beam are summarized in Table 7. Key components and details of the test setup include:
  • Beam geometry: The specimens were positioned within the beam testing frame with a capacity of 500 kN. The center-to-center span of the simply supported beams was maintained at 1300 mm.
  • Reinforcement placement: Figure 5 and Figure 6 clearly depict the precise placement of both longitudinal (top and bottom) and shear (stirrups) reinforcement within the beam cross-section, along with their respective dimensions and spacing.
  • Instrumentation: A comprehensive instrumentation scheme was employed to capture the structural response of the beams under loading:
    • Strain gauges: Dial gauges with a precision of 0.001 mm were affixed to both the concrete surface and the reinforcing steel bars to measure strains at various load levels, enabling detailed analysis of material deformation;
    • Linear variable displacement transducers (LVDTs): LVDTs were strategically positioned at mid-span to precisely monitor and record deflections throughout the loading process, providing critical data for constructing load–deflection curves.
The test setup ensured controlled loading conditions and accurate data acquisition with a loading rate of 0.5 kN/s until specimen failure, enabling a thorough investigation of the shear behavior of the geopolymer concrete beams.

4. Results and Discussion

4.1. Failure Modes and Crack Patterns

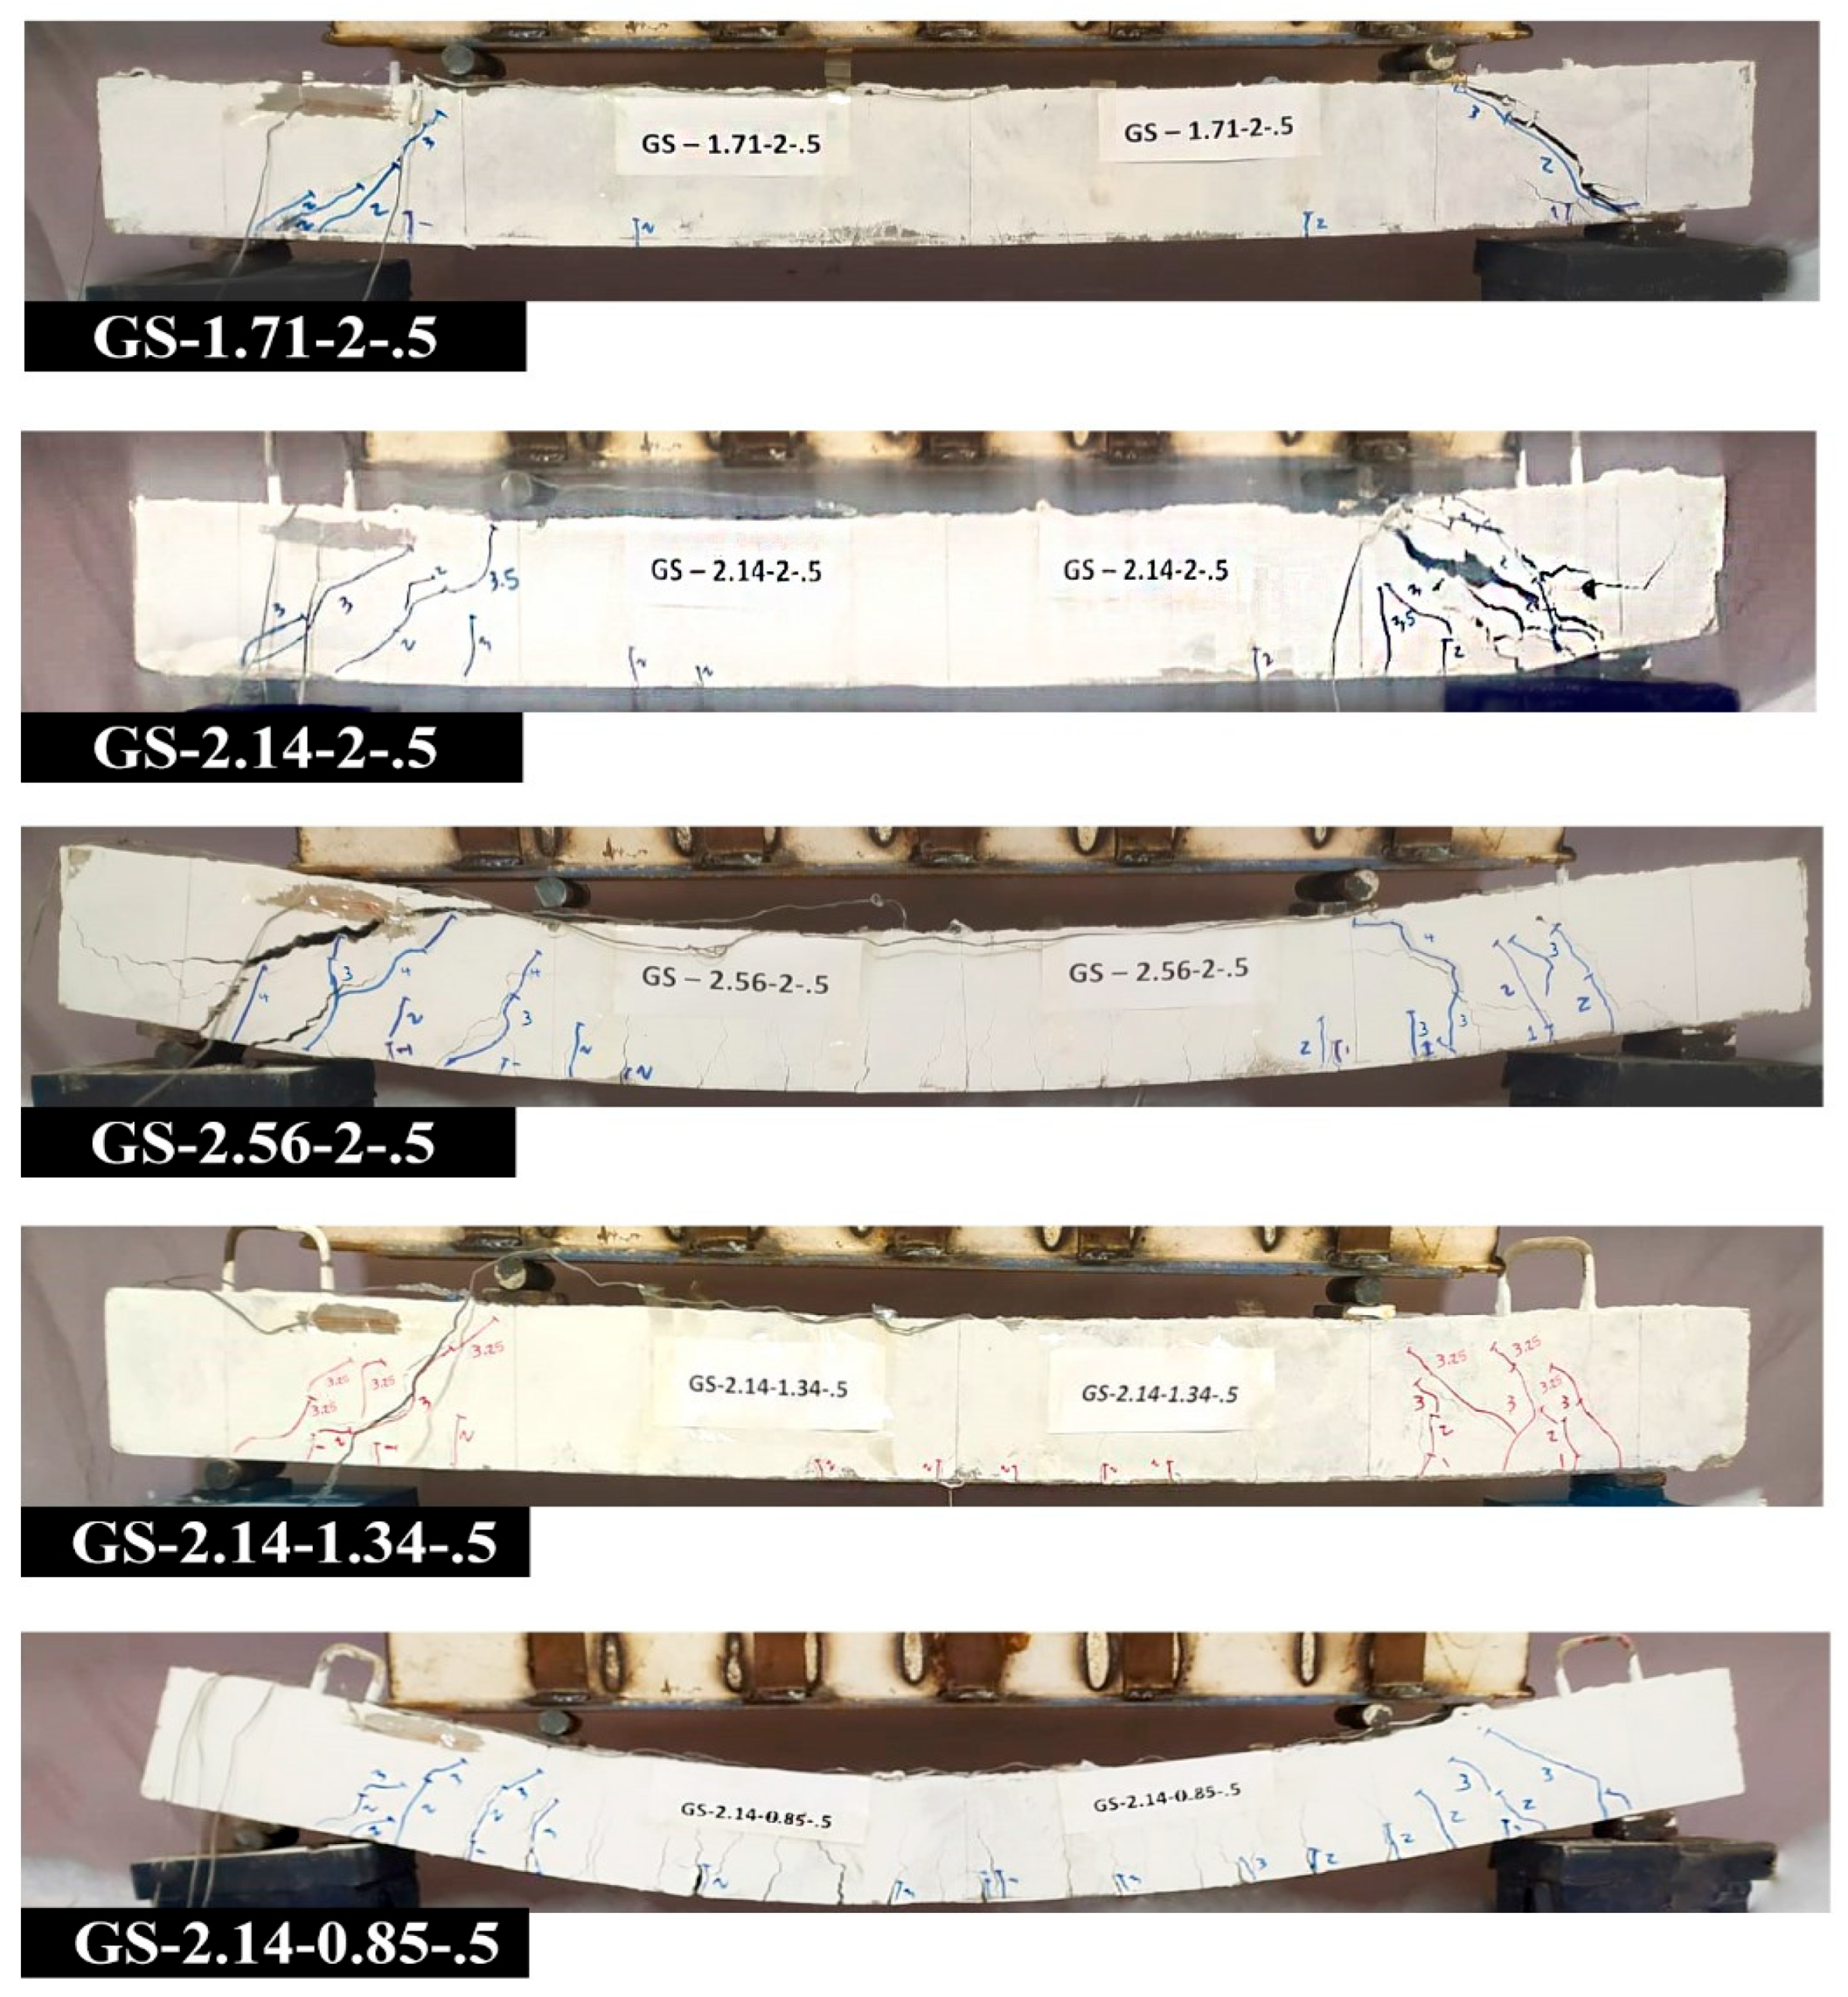
Figure 7 visually represents the failure mechanisms and crack patterns observed in the tested beams under monotonically increasing loads. The consistency of the behaviors noted across all specimens provides a clear and detailed understanding of the progressive damage development.
A noteworthy aspect of the observed behavior is the potential influence of the granite waste powder (GWP) incorporated into the self-compacting geopolymer concrete mix. The inclusion of GWP is reported to enhance the concrete matrix through a micro-filler effect, leading to a denser microstructure and an improved interfacial transition zone (Saxena et al., 2021) [39]. This densification can increase the matrix’s tensile strength and fracture energy (Saxena et al., 2022) [40]. In the context of shear behavior, this enhanced tensile capacity is significant. It likely contributed to delaying the onset of the initial diagonal crack and promoting the formation of finer, more distributed micro-cracks before the localization into a single critical shear crack. This behavior suggests that GWP does not merely act as inert filler but actively participates in improving the shear transfer mechanisms, particularly the aggregate interlock and the contribution of the uncracked concrete zone.
The observed crack patterns and failure modes offer valuable empirical data regarding the load transfer mechanisms and the progressive degradation of the geopolymer concrete beams under shear loading. The consistency of these observations across varying beam configurations reinforces the fundamental understanding of GPC’s structural behavior.
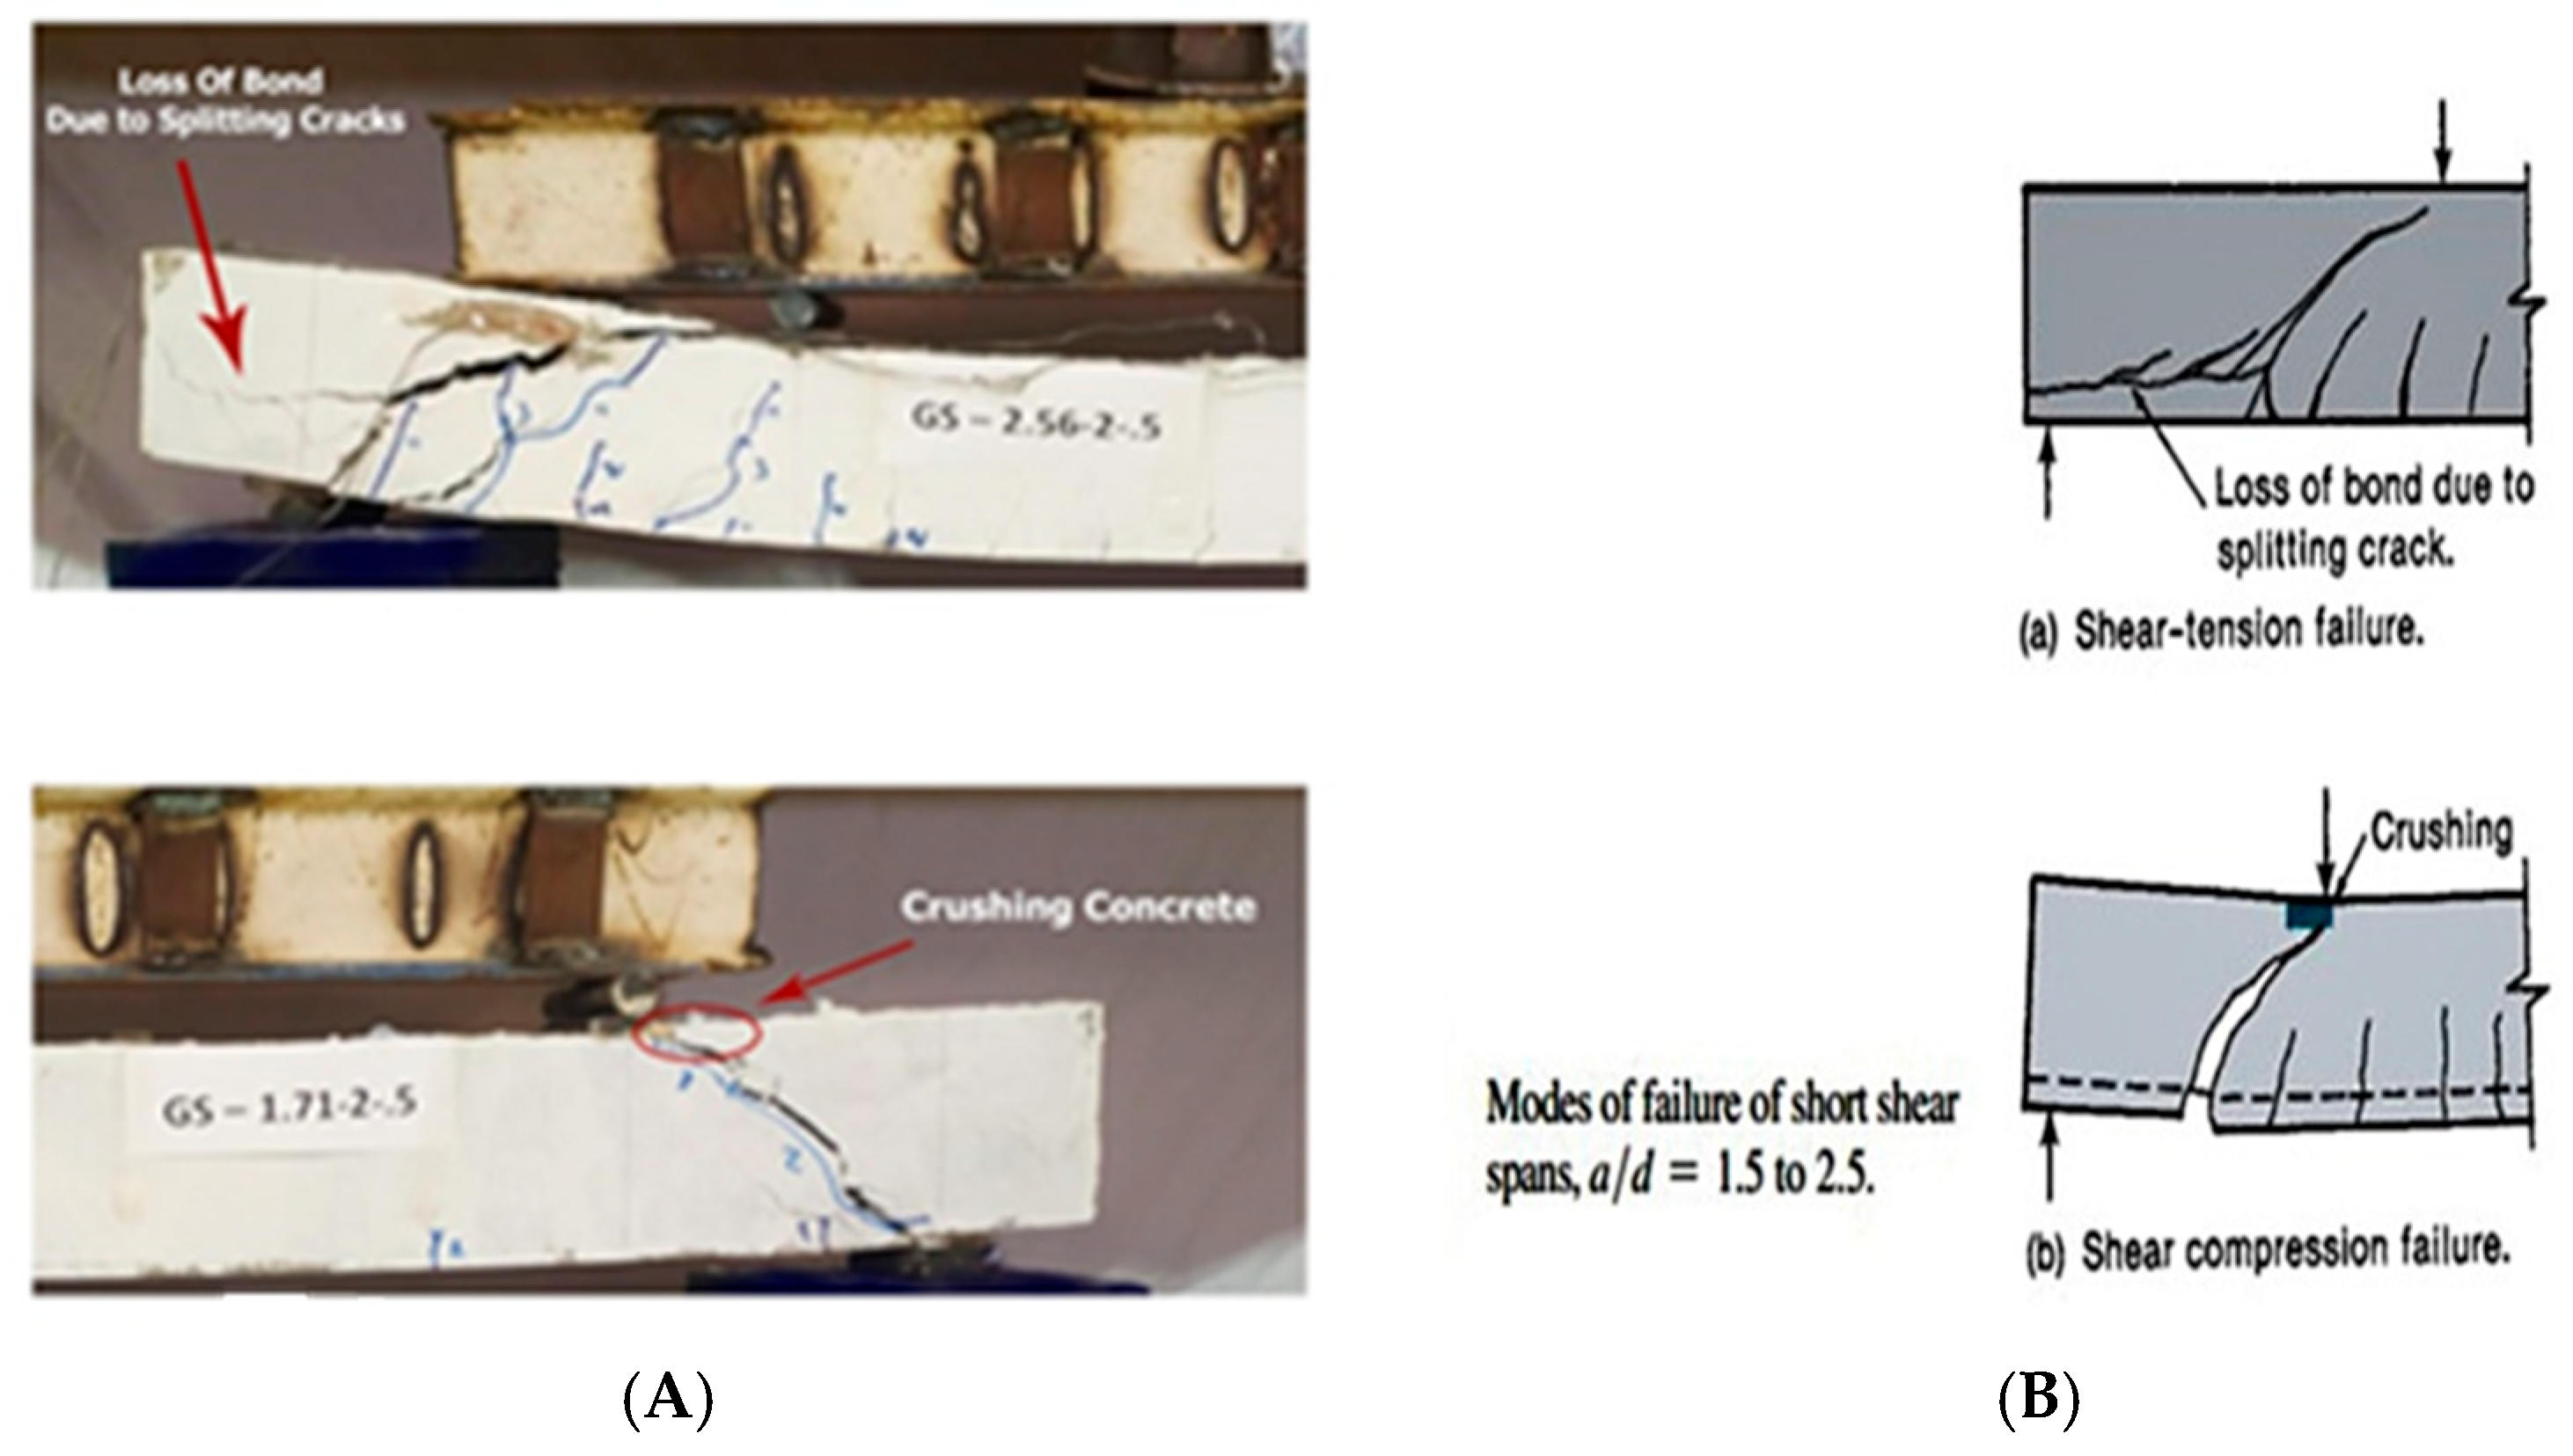
Figure 8 shows the direct comparison of experimentally observed failure modes with classical reinforced concrete mechanisms. Column (A) shows photographs of typical failure modes from the current study’s GPC beams. Column (B) shows the corresponding theoretical failure mechanisms adapted from Wight (2012) [41]. The strong visual correlation between the experimental results (A) and the established mechanisms (B) validates that the tested GPC beams exhibit behavior consistent with conventional reinforced concrete theory.
The effectiveness of the role of dowel action presented in all reinforced concrete in our GPC-GGBFS beams is unique. The geopolymer matrix provides a stronger bond to the reinforcement compared to OPC (Al-Azzawi, Yu and Hadi, 2018) [42], enhancing initial dowel resistance. However, the inherent brittleness of GPC can be a limiting factor. We propose that the inclusion of GPC-GGBFS in our mix improved the matrix’s fracture properties and ductility, as supported by studies on GGBFS-based geopolymer concrete (Mousavinejad and Gashti, 2021) [43]. This enhancement, which aligns with recent findings on the improved durability of GGBS concrete (Paruthi et al., 2024) [44], likely helped resist splitting cracks and sustained the dowel action’s contribution to the overall shear capacity.

4.2. Load-Deformation Response

All tested geopolymer concrete beams exhibited shear failure, with the specific details of failure modes, ultimate shear force (Vtest), and average shear stress (τtest = Vtest/bwd) summarized in Table 8. The crack initiation and propagation patterns observed in the GPC beams closely mirrored those typically seen in conventional reinforced concrete beams, as noted in previous studies [14,45,46]. As the applied load increased, crack widths expanded significantly, ultimately leading to failure. It was observed that the stirrups in all beams yielded, confirming their effective contribution to resisting shear forces.
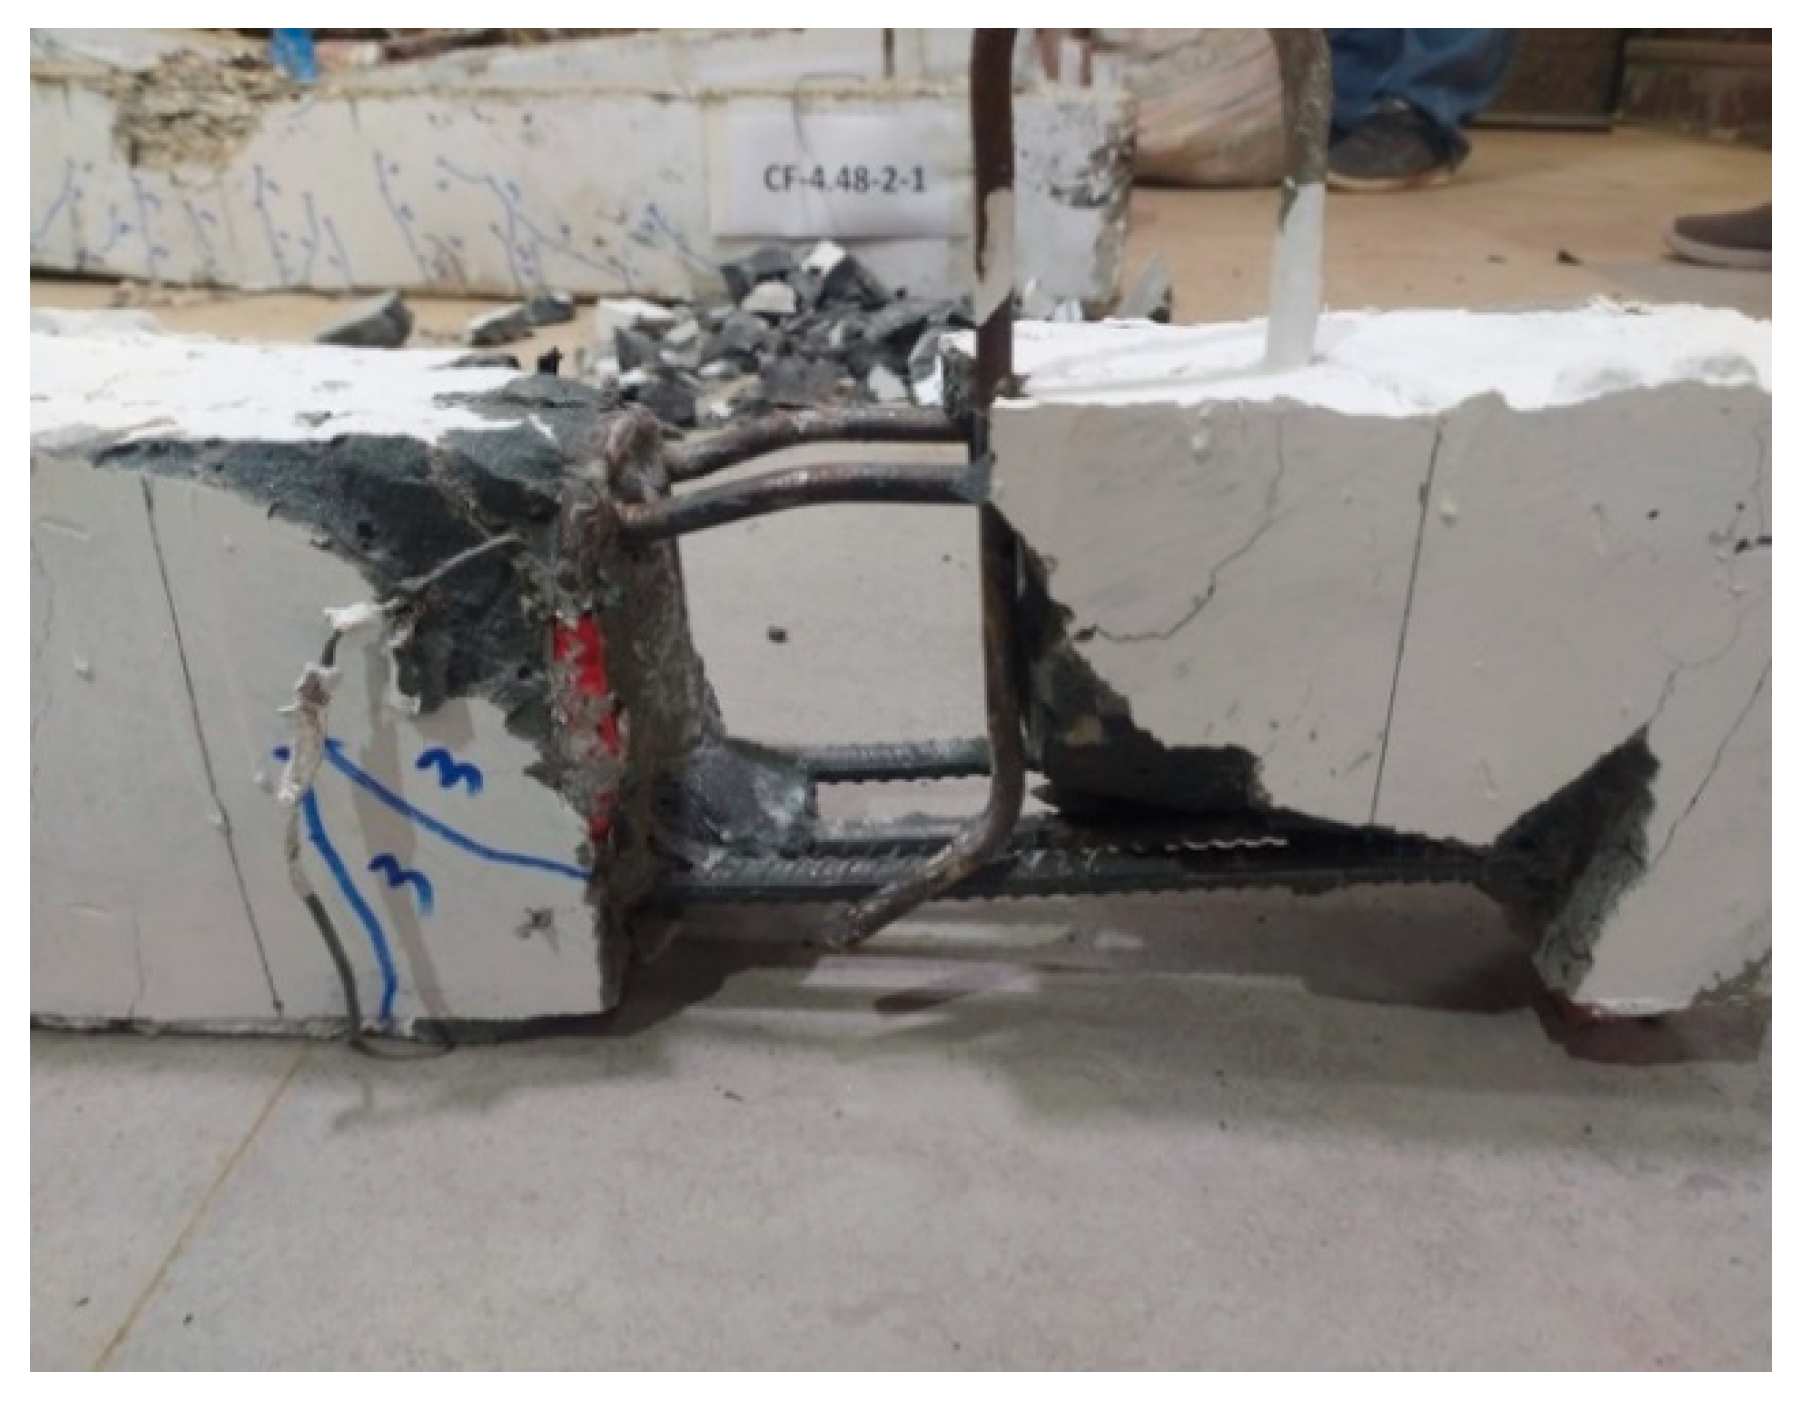
A comparative analysis of the results reveals that beams GS-2.14-2 and GS-2.14-1.34 exhibited superior shear strength in comparison to beam GS-2.14-.85 (Table 8, Figure 9). This notable enhancement in shear capacity is primarily attributable to the direct dowel action provided by the increased longitudinal reinforcement. Dowel action is a significant contributor to the overall shear resistance of the beam, and its influence extends to indirectly controlling the width of diagonal shear cracks. This control mechanism positively influences the aggregate interlock (friction) between the aggregate particles and the geopolymer paste, thereby substantially enhancing the shear transfer mechanism.
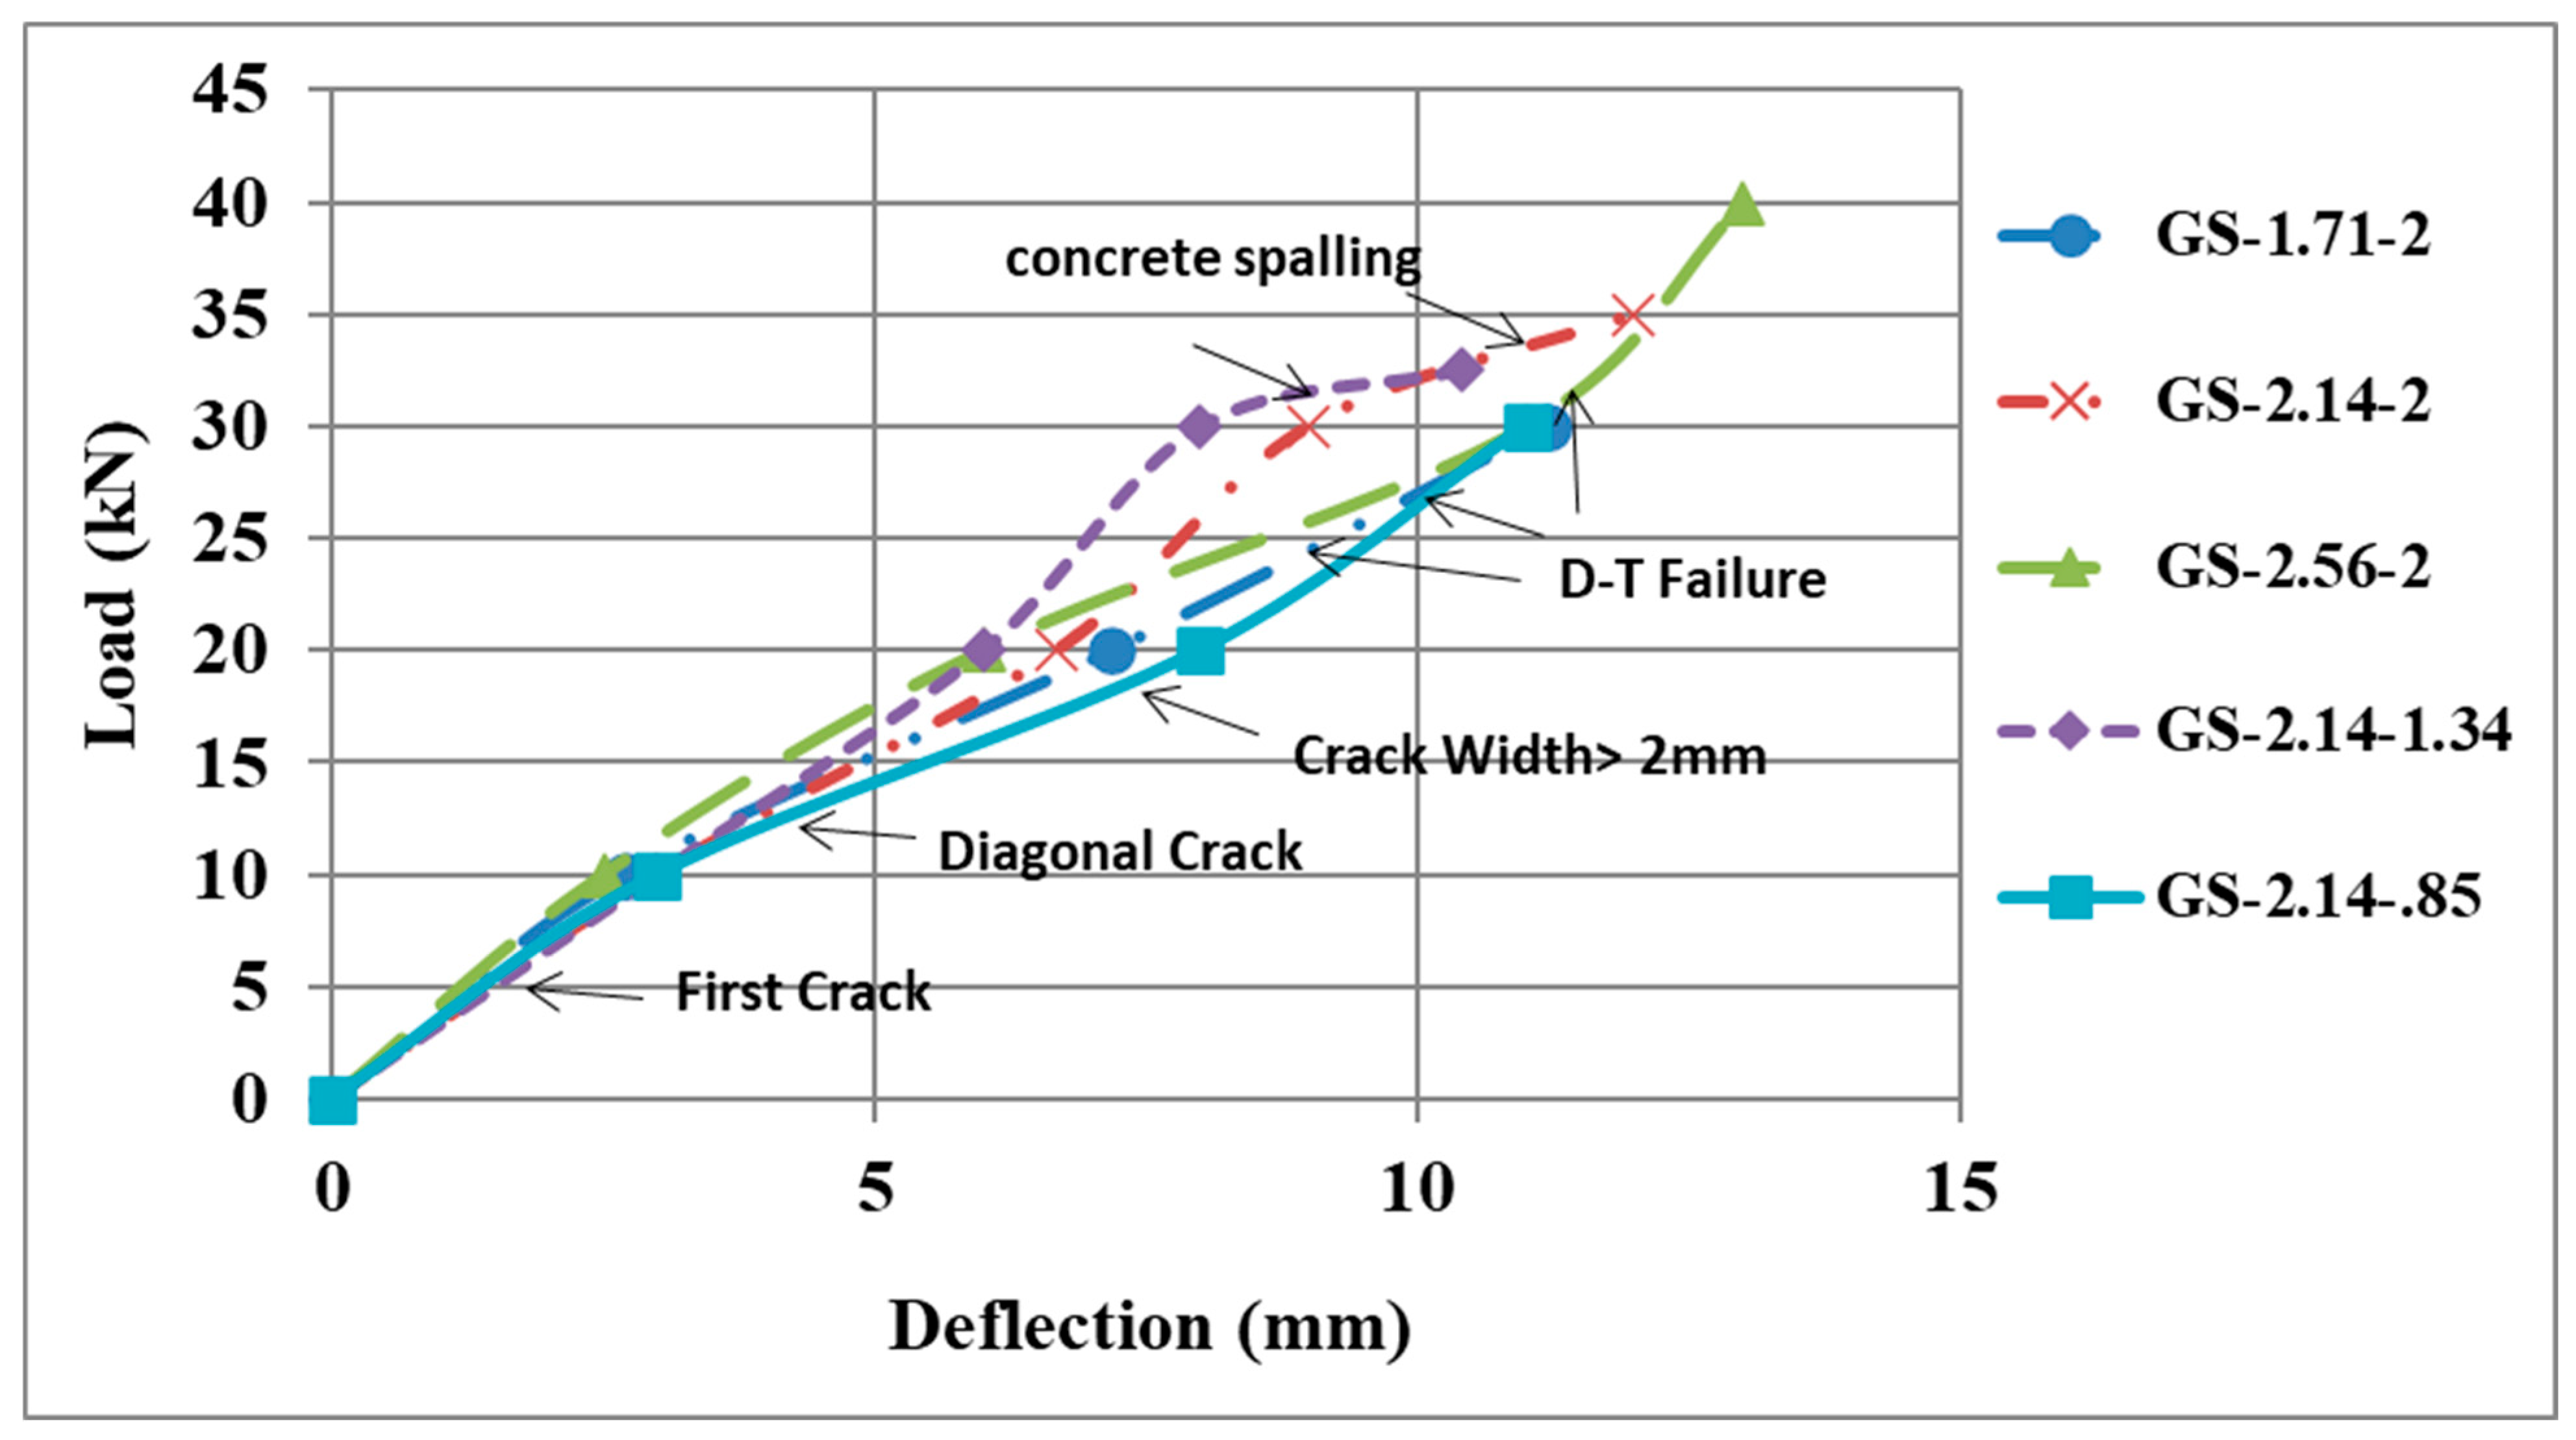
The load–deflection curves (Figure 10) suggest that beams GS-2.14-.85 and GS-2.14-1.34 displayed a more ductile behavior relative to GS-2.14-2. This heightened ductility is a direct consequence of their lower longitudinal reinforcement ratios (µs) and the resultant reduction in structural stiffness. Conversely, beam GS-2.56-2, while achieving the highest peak load of the set, experienced a flexure–shear failure mode. This behavior was intrinsically linked to its greater longitudinal steel reinforcement ratio (µs), which augmented its shear capacity. The increased µs ratio contributed to shear resistance through an improved direct dowel action, underscoring the complex interplay between flexural and shear mechanisms in the ultimate limit state.
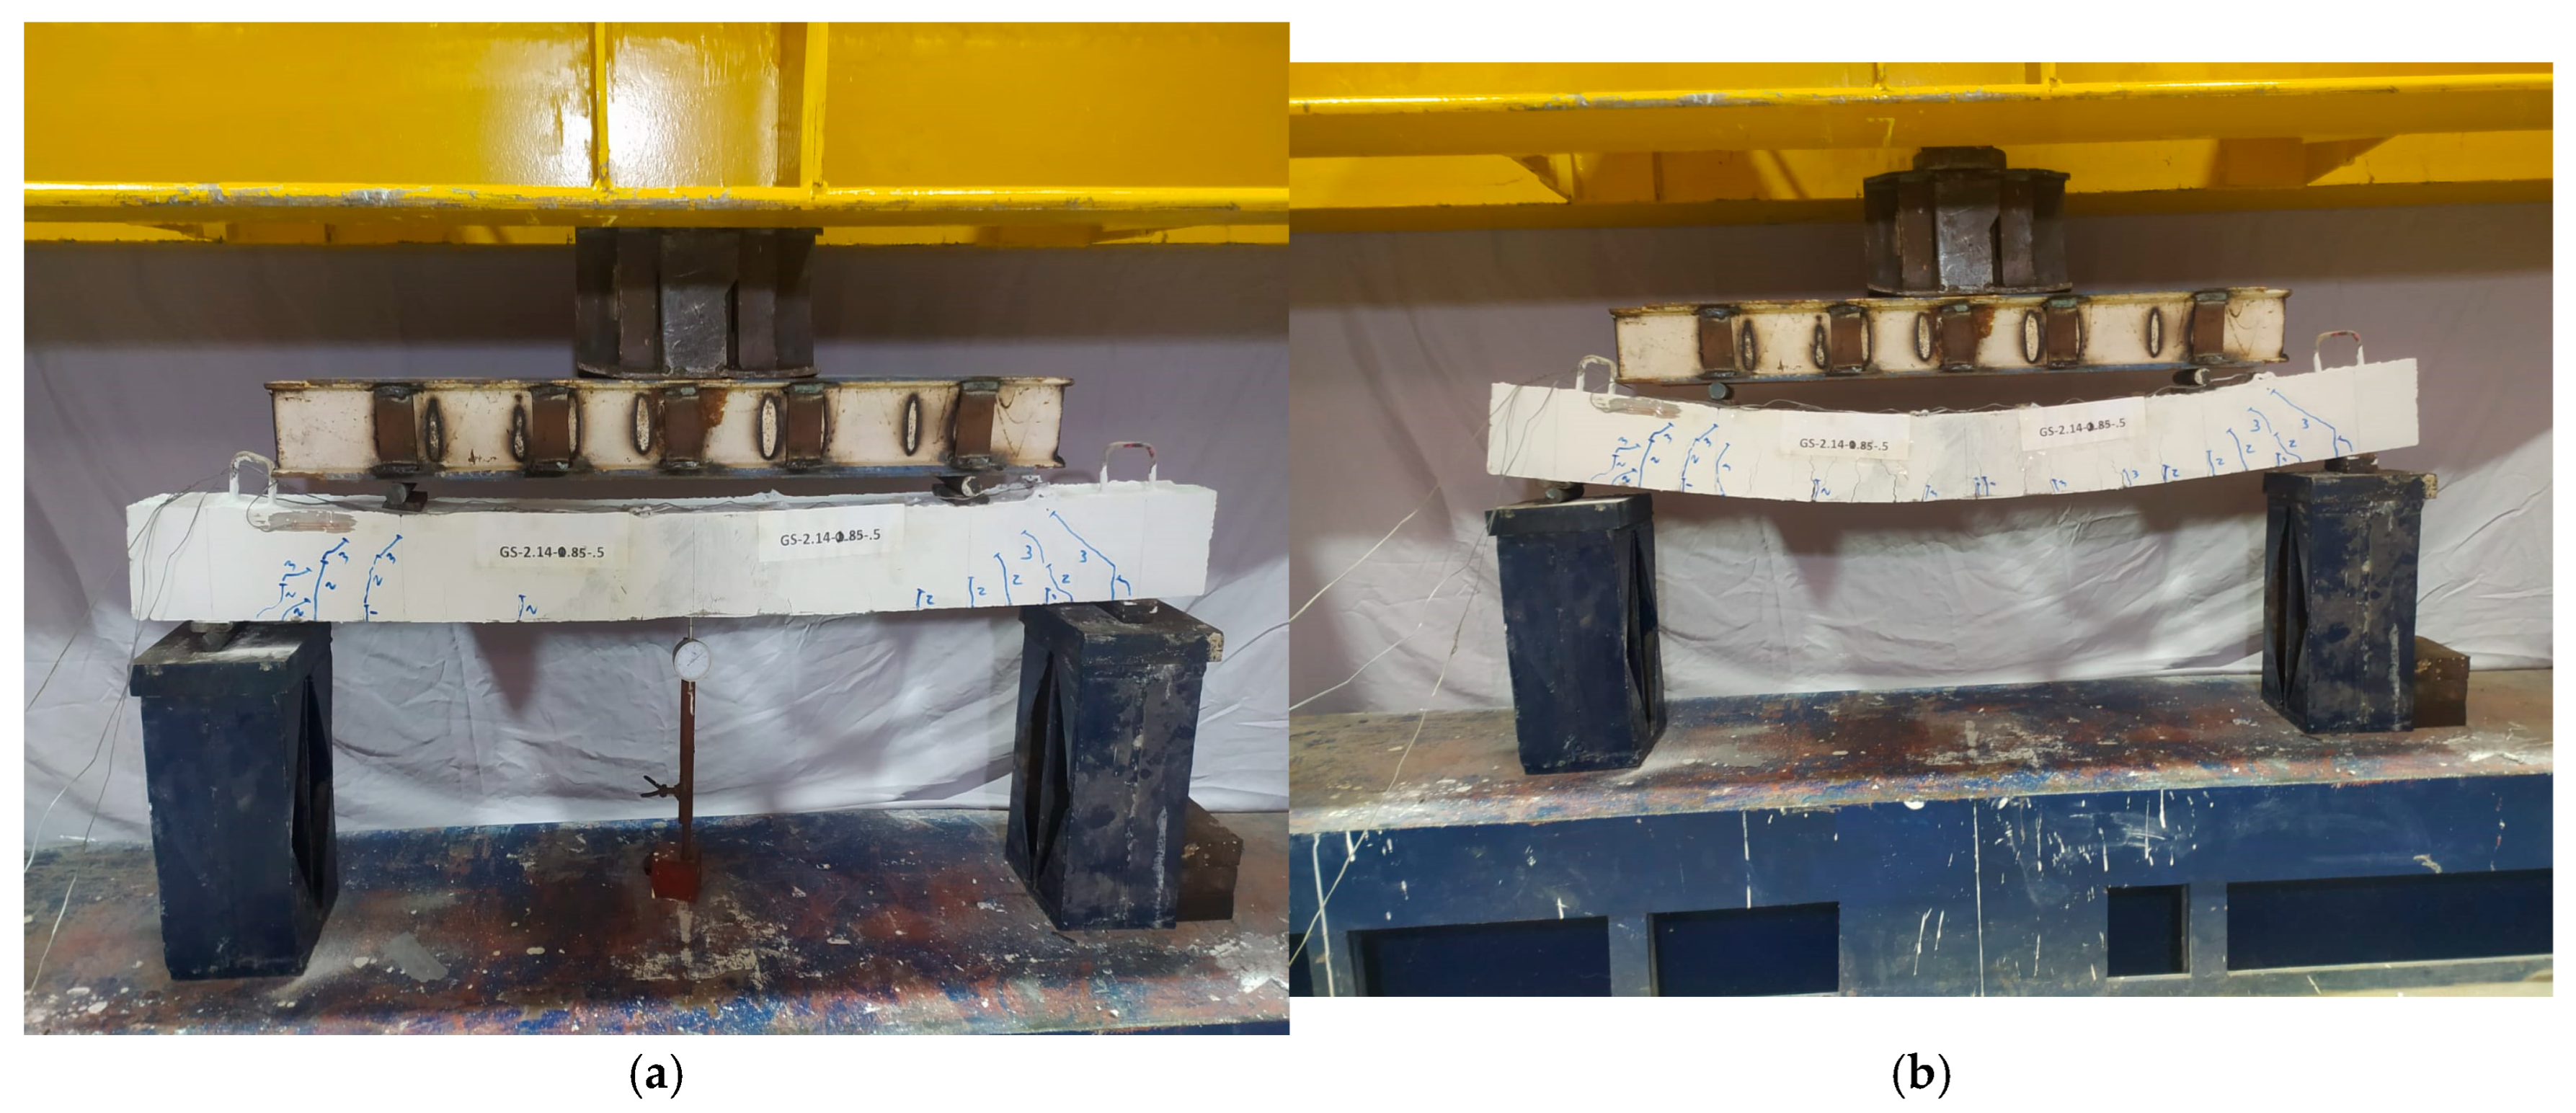
Figure 10 further elucidates that the beam behavior was profoundly influenced by the reinforcement configuration. Specimens exhibited distinct failure modes, including diagonal-tension failures characterized by abrupt load capacity drops (e.g., beams GS-2.14-2 and GS-2.14-1.34 at peak loads around 35 kN), shear compression failures showing a more gradual post-peak decline, and combined flexural–shear mechanisms. Notably, beam GS-2.56-2 attained the maximum load capacity of approximately 40 kN, as a result of its superior reinforcement ratio and the consequent enhancement of shear capacity via improved dowel action. In contrast, beam GS-2.14-0.85 demonstrated the most pronounced ductile behavior, characterized by a prolonged load–deflection response and failure at 30 kN, which was attributed to its minimal reinforcement ratio and reduced stiffness (Figure 11). To provide a clearer visual documentation of this ductile failure process, Figure 11 presents the behavior of beam GS-2.14-0.85 at two critical stages. Figure 11a captures the beam at its measured ultimate load, where the deflection profile and support conditions are shown to be stable and consistent with standard testing. In contrast, Figure 11b illustrates the same beam in a far post-peak state. This second image is included specifically to demonstrate the significant ductility and large deformation capacity inherent to the under-reinforced geopolymer concrete, which persists long after the technical failure load has been surpassed.
As shown in Table 9, a rigorous comparison was made between the experimental ultimate loads (PExp.) and the theoretical shear capacities (PCalc.) calculated according to the ACI 318-19 code (ACI Committee 318, 2019) [19]. An excellent correlation was observed, with the PExp./PCalc. ratio ranging from 0.98 to 1.3. This demonstrates that the ACI code provides a reliable, and for most cases conservative, prediction for the shear strength of the tested GPC beams. Furthermore, these minimal deviations from the predictions of a code developed for OPC provide robust confirmation that geopolymer concrete members can exhibit a shear behavior functionally equivalent to that of conventional concrete, a conclusion that is well-supported by the existing literature [14,45,46].
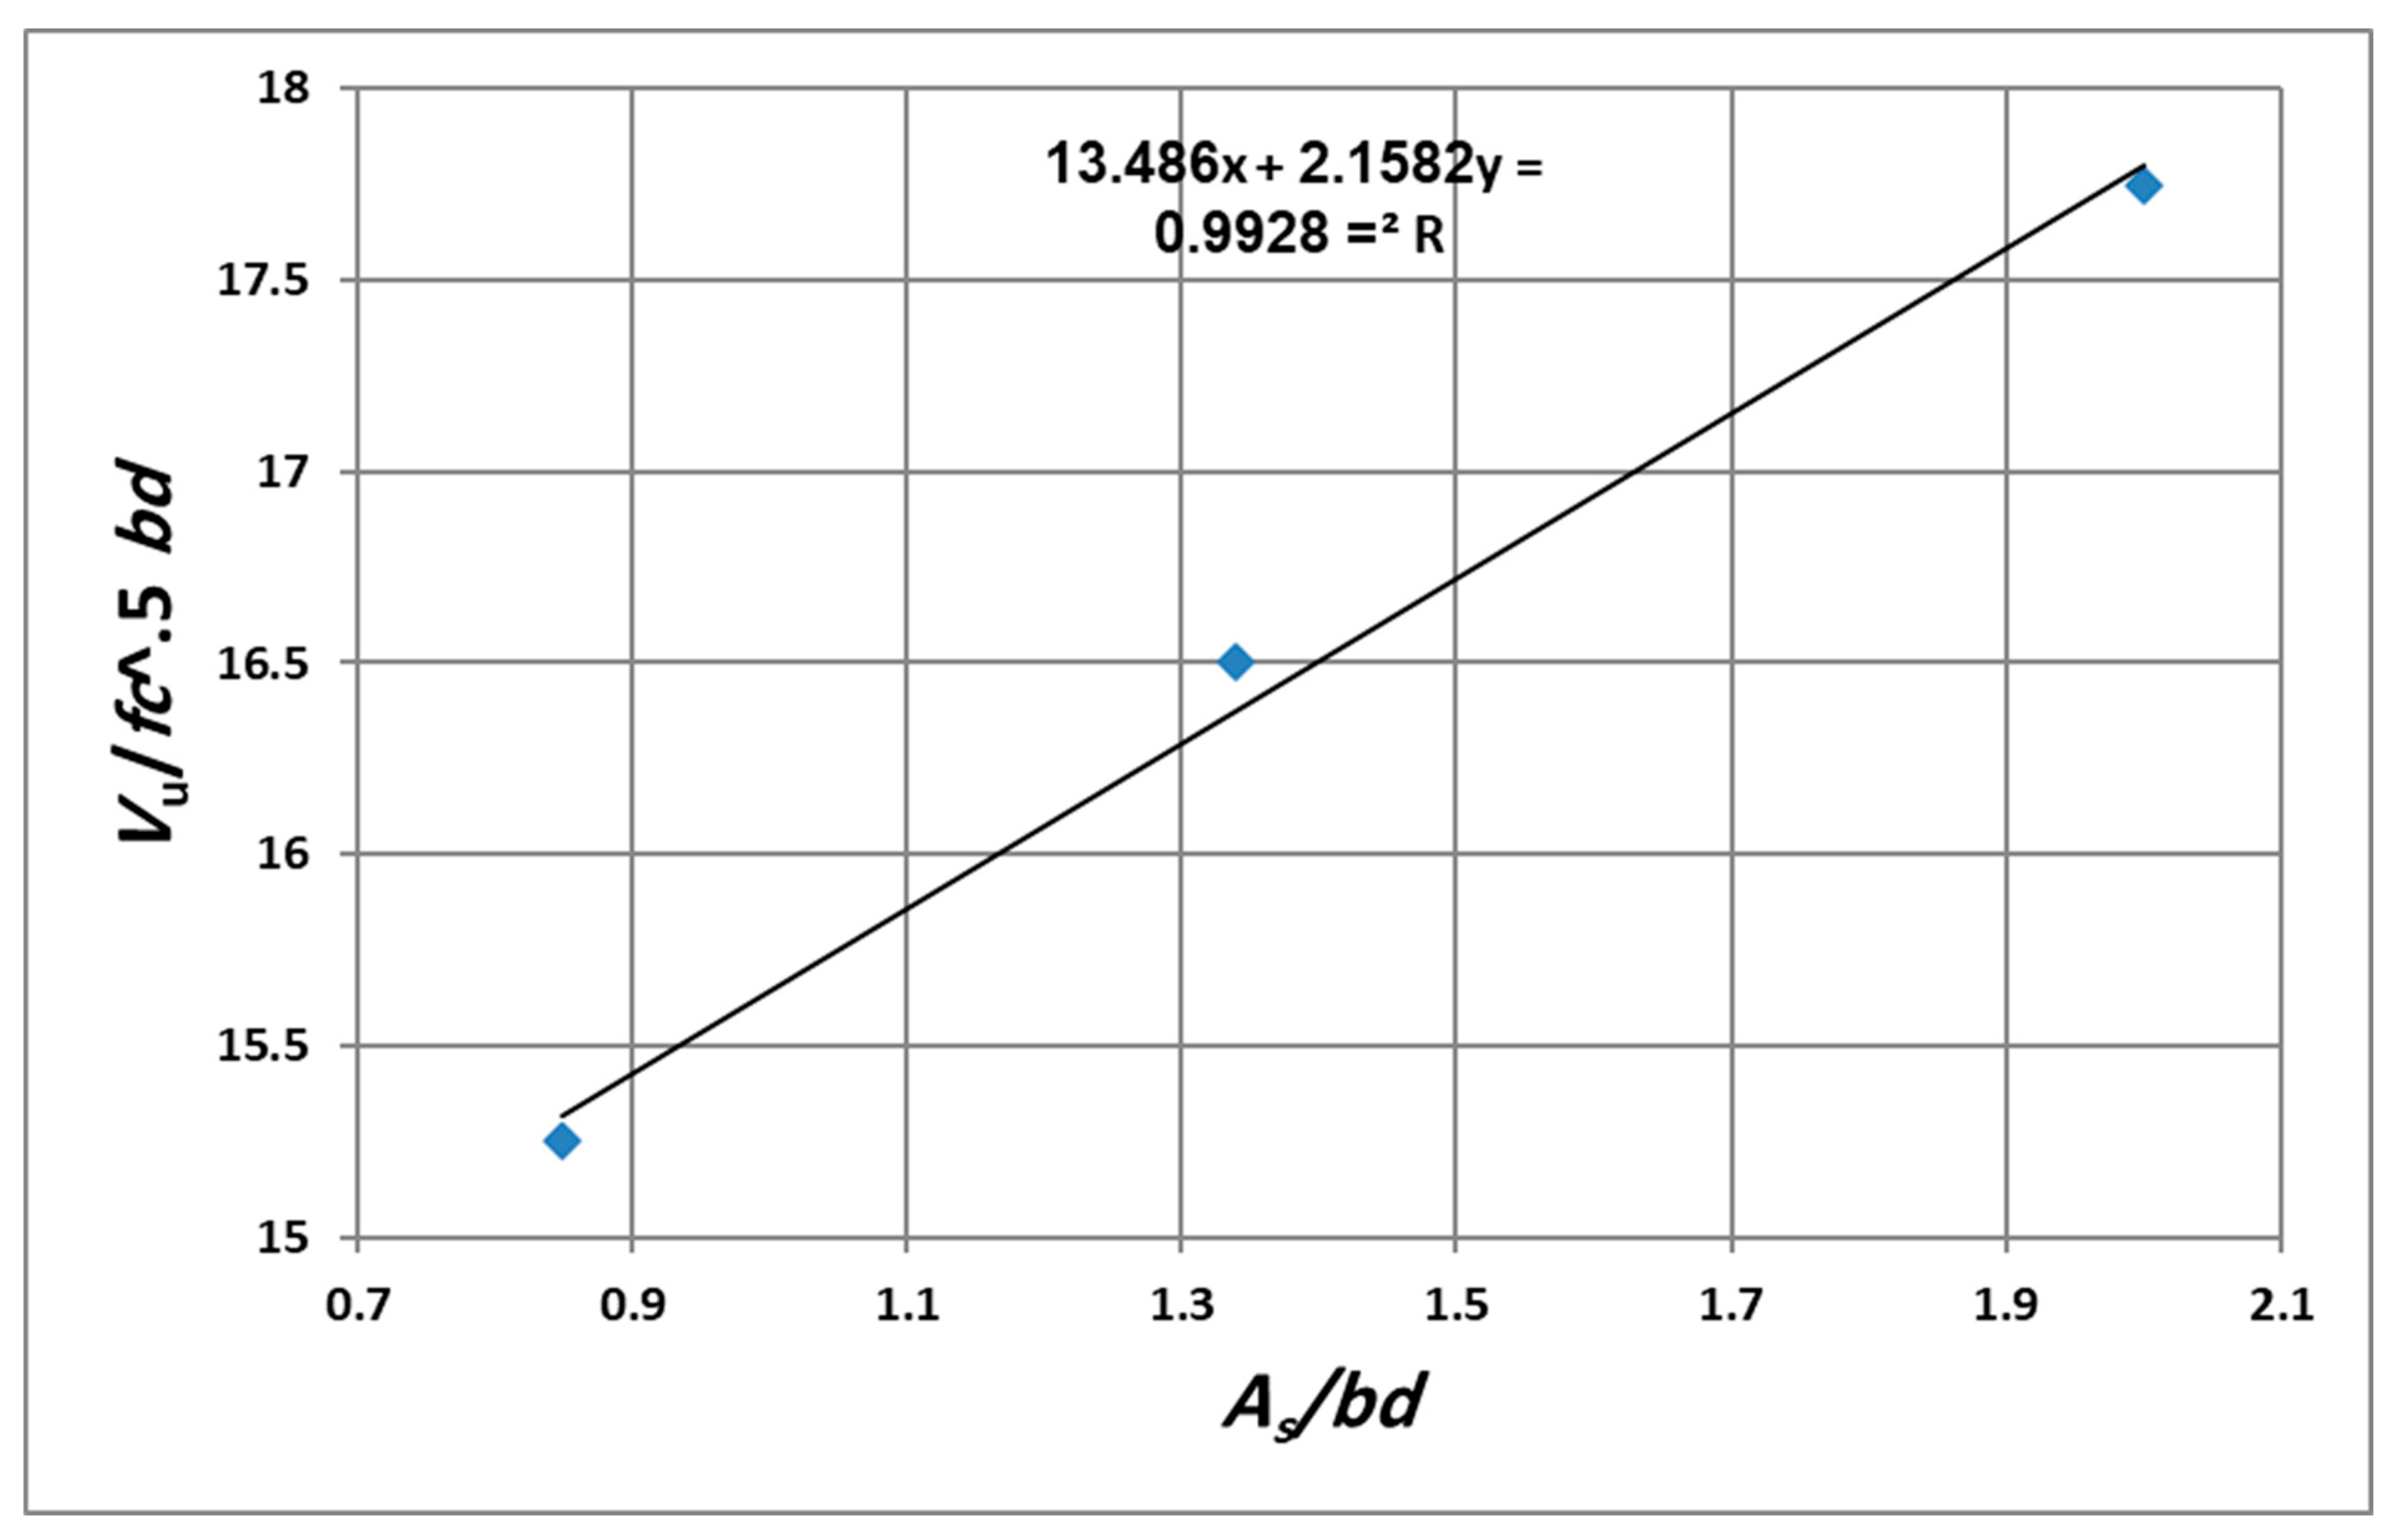
The quantitative data presented in Table 10 further substantiates this relationship, unequivocally showing that beams with higher reinforcement ratios attained significantly greater peak loads and enhanced shear strengths. Figure 12 graphically illustrates the pronounced impact of the longitudinal tensile reinforcement ratio (µs) on the shear capacity of the tested beams.
The amount of longitudinal reinforcement had a significant influence on the overall structural response. Specifically, beam GS-2.14-2, with the maximum reinforcement ratio (2.0%), registered the highest peak load (35 kN) and shear strength (17.75 kN). This superior performance is primarily attributed to the enhanced dowel action from the greater reinforcement area, which limits diagonal crack widths and improves aggregate interlock. This behavior is fully consistent with established findings reported for conventional cement concrete beams by Rangan (1998) [11].
In stark contrast, beam GS-2.14-0.85 (Figure 11), with the minimum reinforcement ratio (0.85%), not only yielded the lowest corresponding values (a 30 kN peak load and 15.25 kN shear strength) but also exhibited a distinctly more ductile failure mode. It is particularly noteworthy that this beam sustained large and increasing deflections at a near-constant load even after reaching its peak capacity, highlighting the flexible nature of the geopolymer concrete matrix, especially in under-reinforced members.

4.3. Strain Analysis and Mechanisms

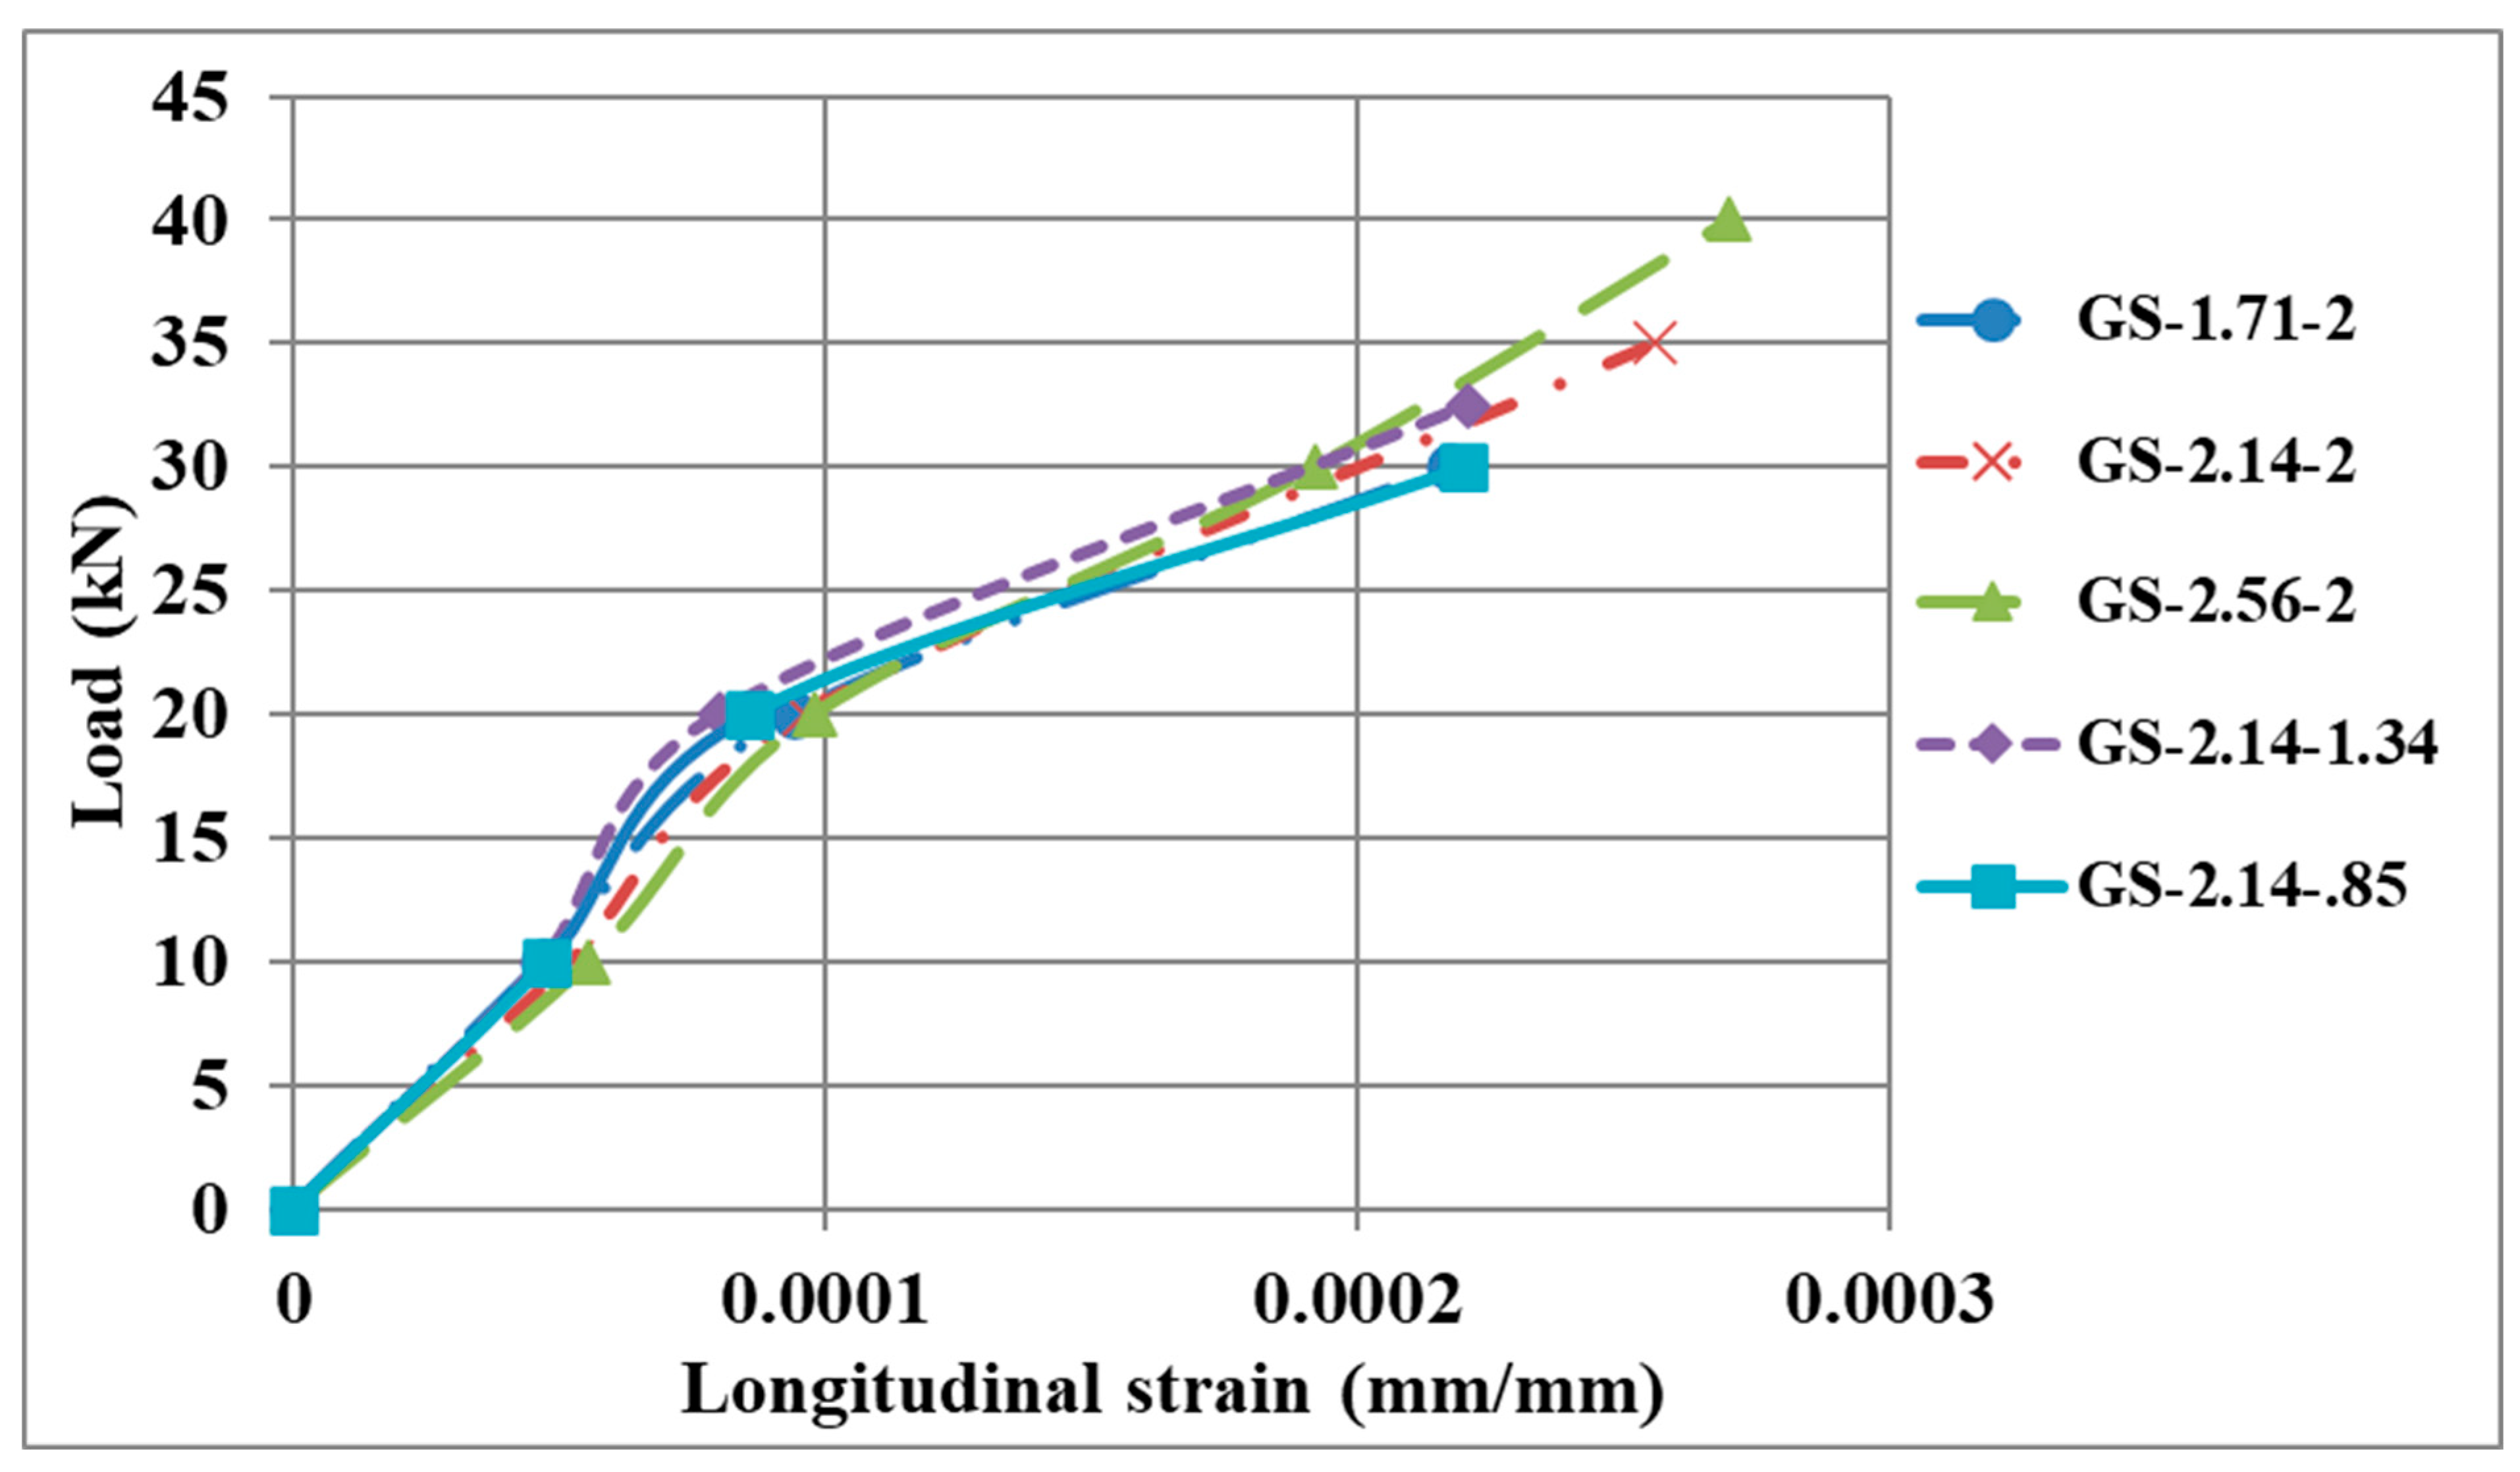
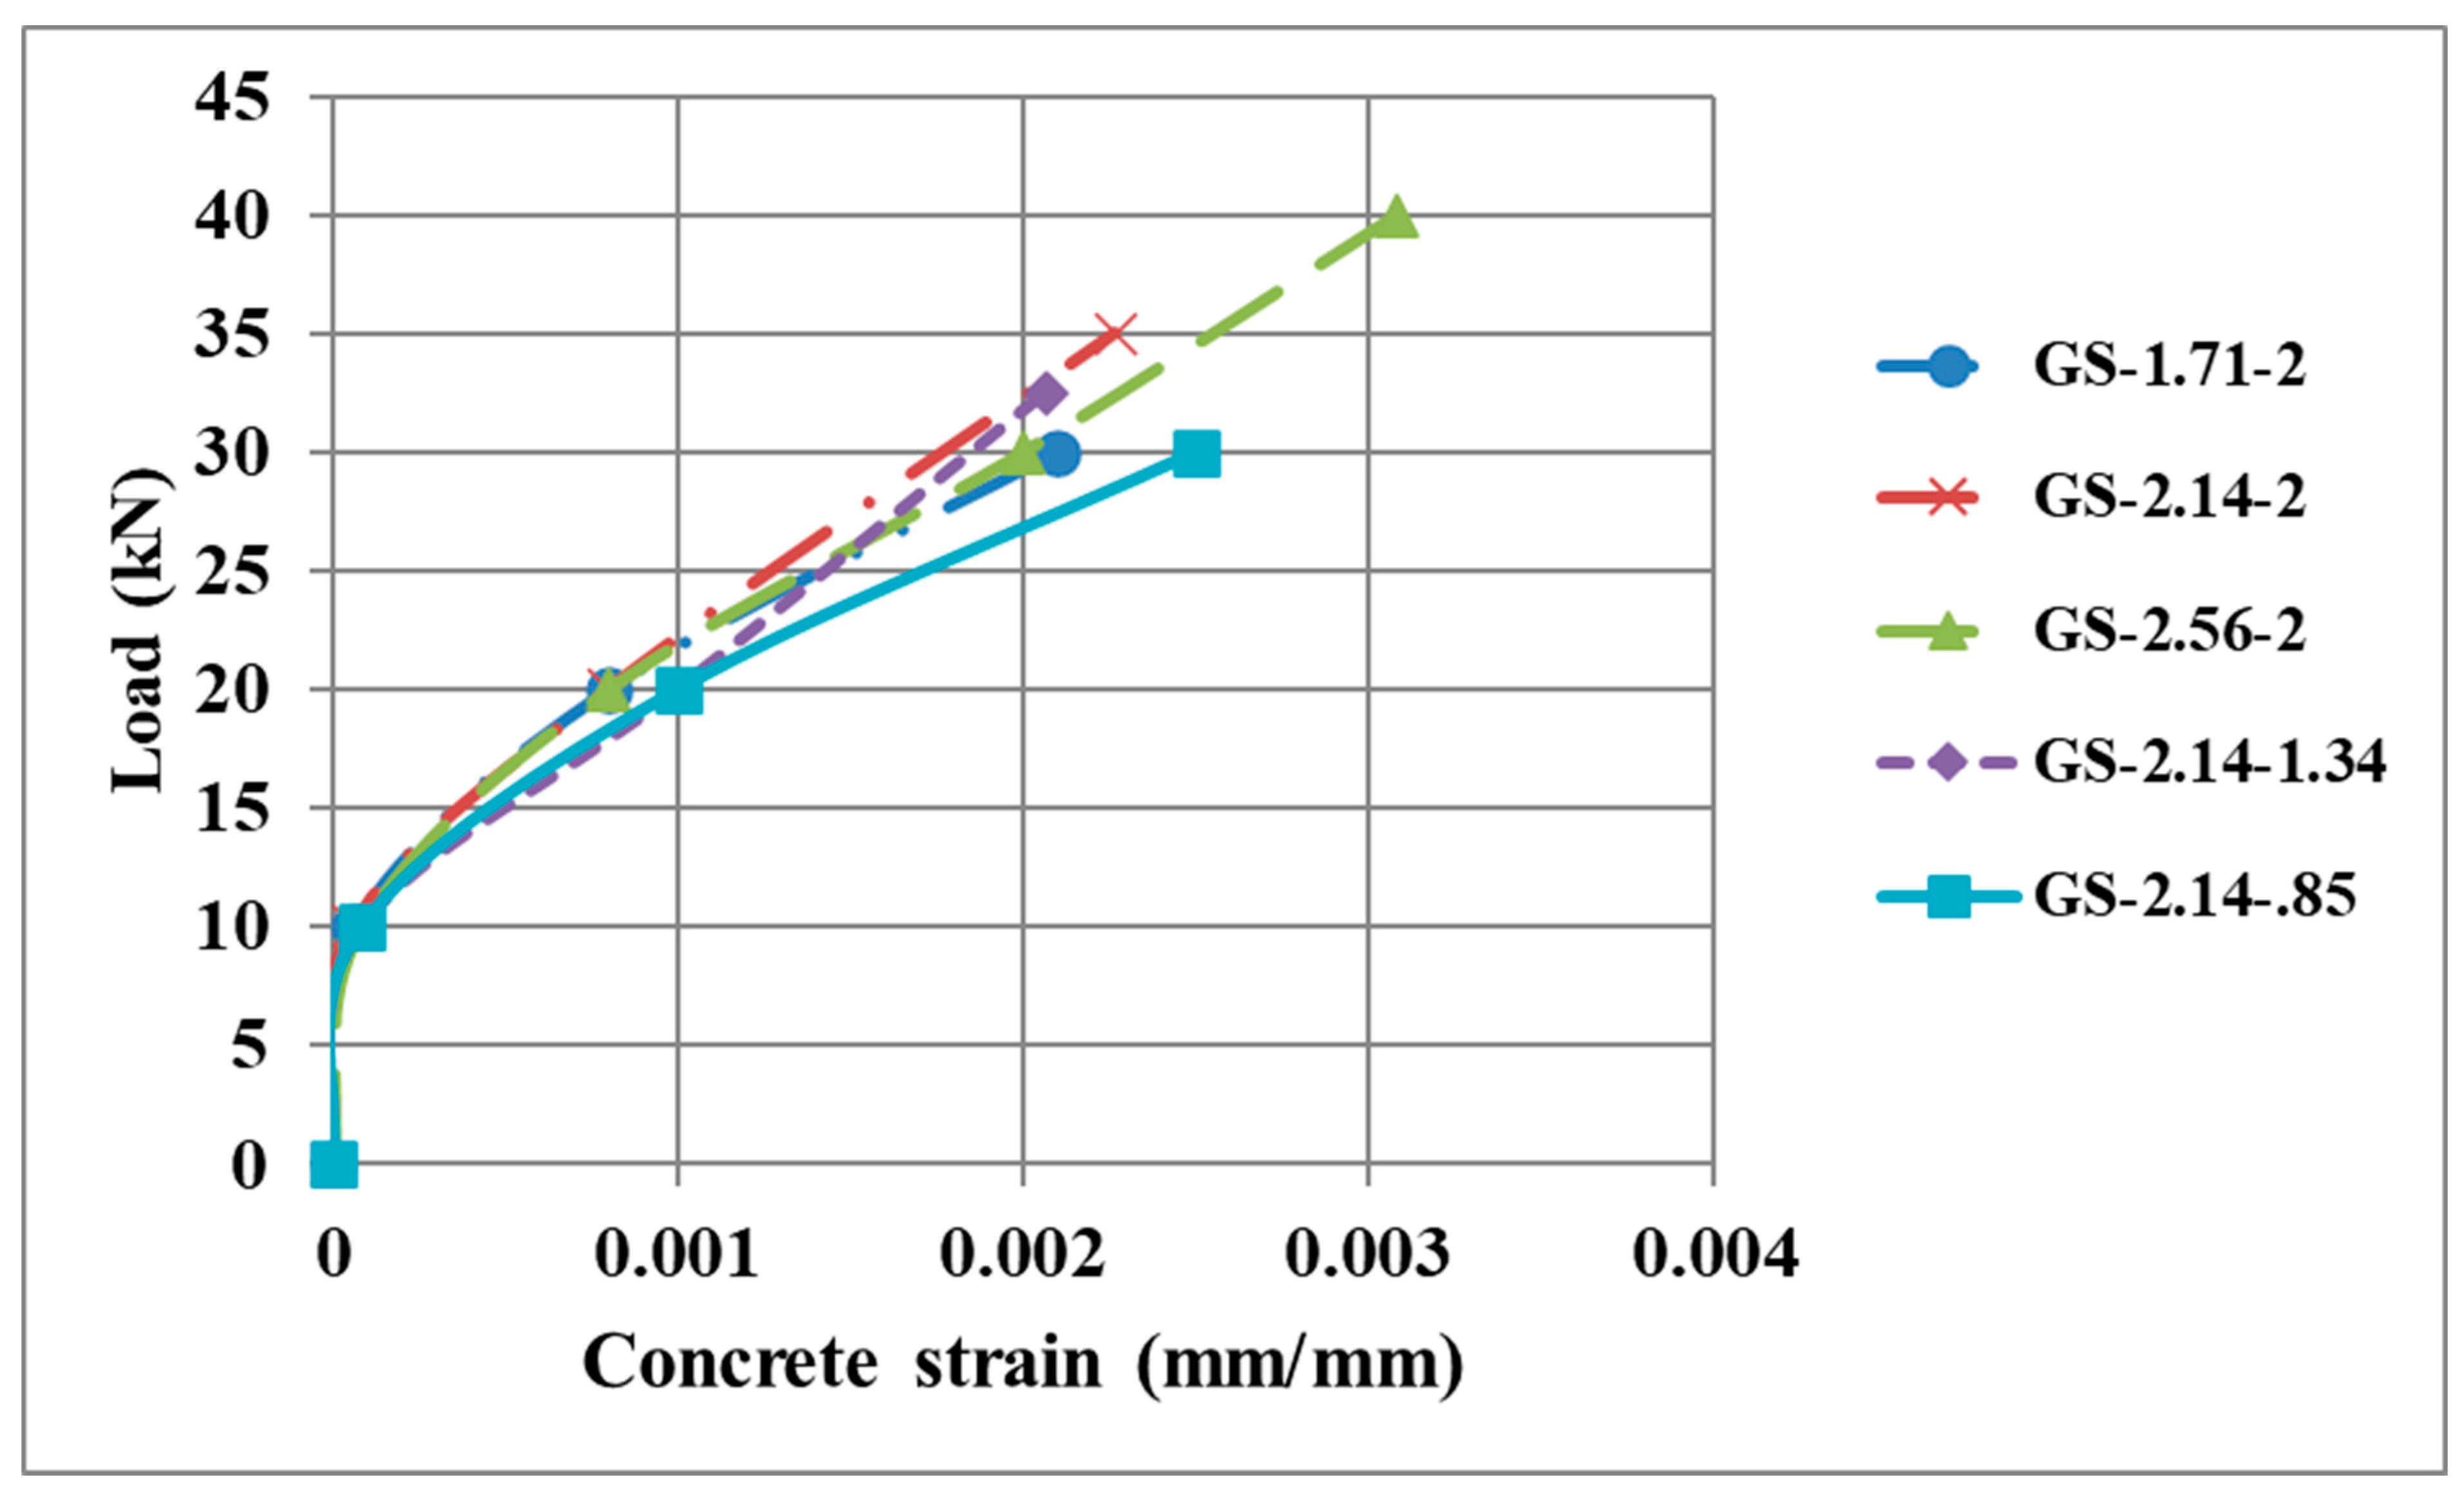
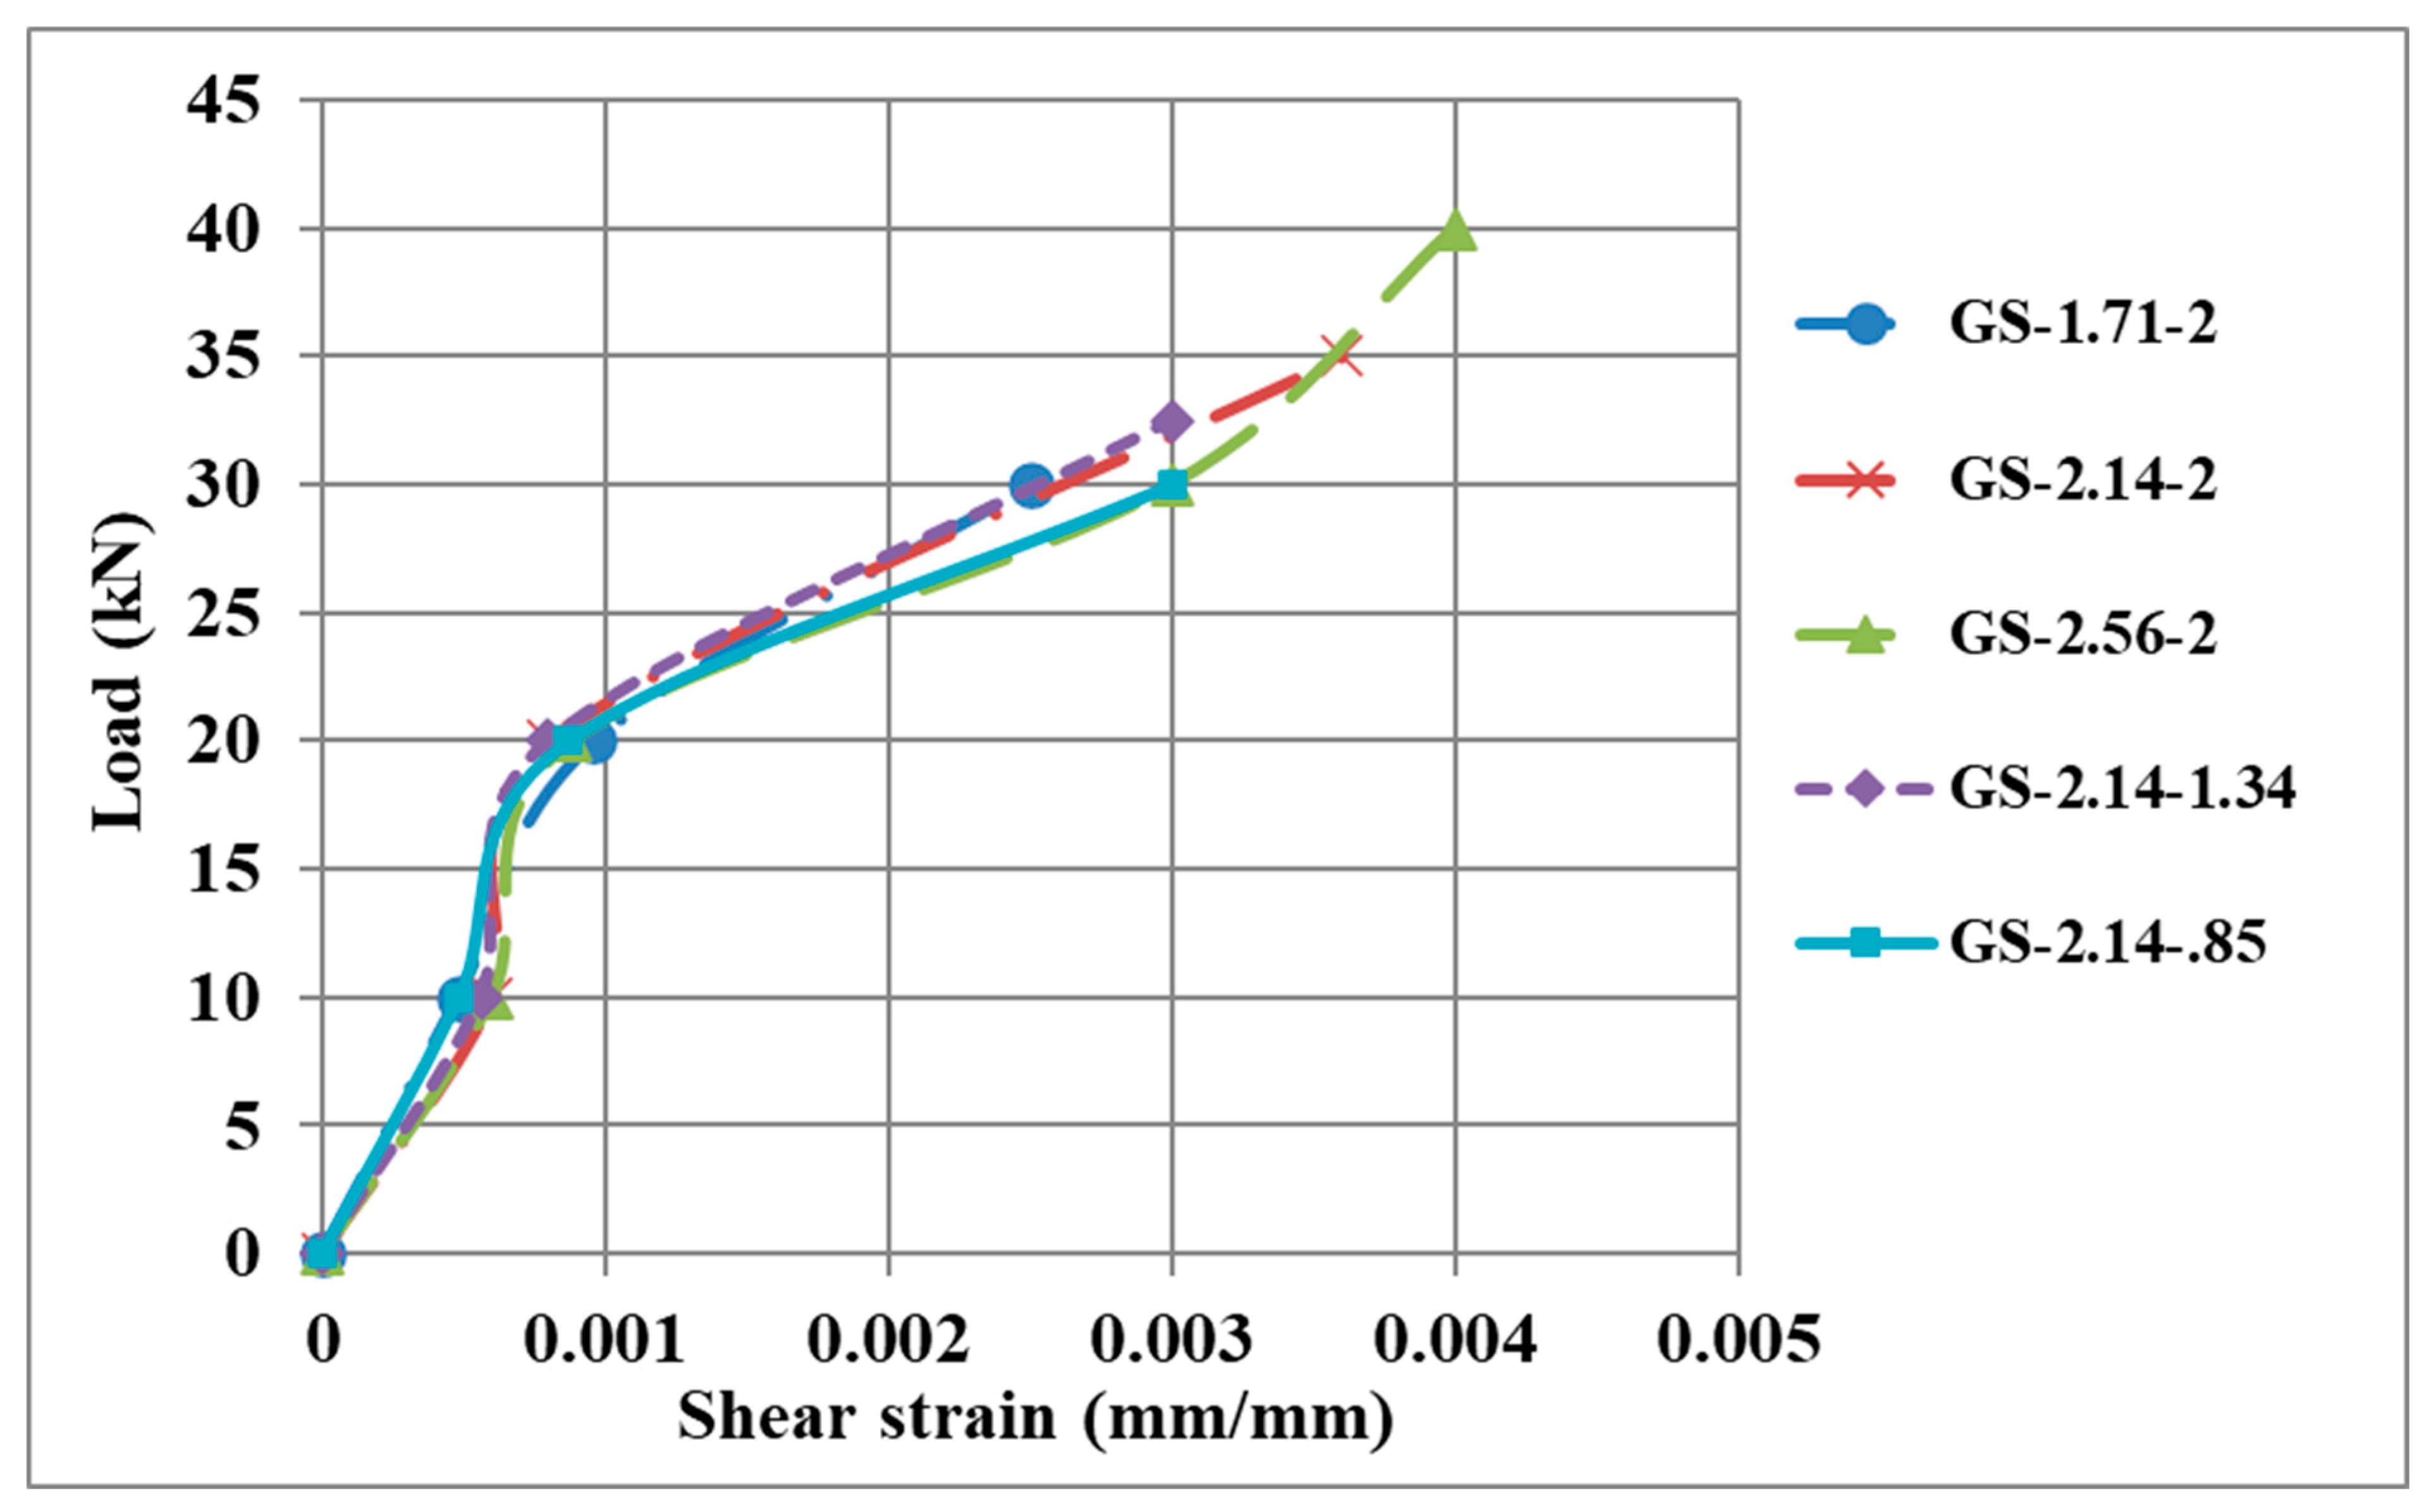
Figure 13, Figure 14 and Figure 15 provide a detailed depiction of the load–strain relationships observed in the tested beams, offering critical insights into the mechanical response of the tensile steel reinforcement, concrete, and stirrups under shear loading. The load–strain responses demonstrate a close correspondence to their respective load–deflection curves, revealing three distinct phases of material behavior:
  • Initial Linear Segment: Characterized by a steep slope, this segment represents the uncracked elastic behavior of the beam, where both the concrete and steel respond linearly to the applied load.
  • Cracked Linear and Nonlinear Segment: Following the onset of concrete cracking, the curve’s slope decreases, signifying a reduction in sectional stiffness. This phase transitions from the linear elastic behavior of the cracked section to a nonlinear response as cracks propagate and widen.
  • Nonlinear Segment Post-Failure: This final phase is initiated after the crushing of the geopolymer concrete, indicating significant material degradation and a substantial, irreversible loss of load-carrying capacity.
It is pertinent to note that due to the failure of strain gauges during the concrete crushing phase, the load–strain curves for the geopolymer concrete in the compression zone were only able to capture the first three phases of behavior.
Figure 13 illustrates the load–strain behavior of the tensile steel reinforcement at mid-span. The longitudinal bar strains observed to either closely approach or remain marginally below the yielding strain, which signifies effective load transfer and optimal utilization of the steel’s capacity prior to the ultimate failure of the beam.
Figure 14 depicts the load–compressive strain behavior of the geopolymer concrete in the shear members. The ultimate compressive strain was found to range between 0.0021 and 0.0031. This range aligns favorably with the expected deformation capacity values for geopolymer concrete under compression.
Figure 15 presents the load–shear strain behavior for the stirrups (shear reinforcement). The maximum shear strains within the shear span were recorded between 0.0021 and 0.0031. These values strongly suggest the significant engagement of the stirrups in resisting shear forces and their effectiveness in controlling the propagation of diagonal cracks.
Collectively, these findings conclusively confirm the robust and synergistic interaction among the tensile reinforcement, stirrups, and the geopolymer concrete matrix in resisting shear forces. The observed performance metrics are fully comparable to those of traditional Portland cement concrete members, further solidifying the viability of GPC as a structural material.

5. Finite Element Model Validation

The material nonlinearity of the geopolymer reinforced concrete beams was simulated by developing a finite-element (FE) model using Abaqus software (CAE 6.13-1). The FE model was then validated against the experimental results presented in this study. This numerical investigation was conducted to provide deeper insight into the overall shear behavior of the beams, allowing for a detailed analysis of the load–displacement response and the progression of crack patterns.

5.1. Material Constitutive Models

5.1.1. Concrete

To simulate its behavior, the concrete damage plasticity (CDP) model was used [31]. This model requires concrete stress–strain relationships in compression and tension, parameters for cracking and crushing, dilation (φ), eccentricity (ε), uniaxial-to-biaxial compressive strength ( f b o / f c o ), K-factor and viscosity factor (μ), as shown in Table 11.

5.1.2. Reinforcing Steel Bars

The linear isotropic part of the stress–strain relationship for reinforcing steel bars is defined by the elastic modulus and Poisson’s ratio (200 × 103 MPa and 0.3, respectively). Otherwise, it is perfectly plasticized and defined by yield stress   f y .

5.2. Element Type, Meshing, and Boundary Conditions

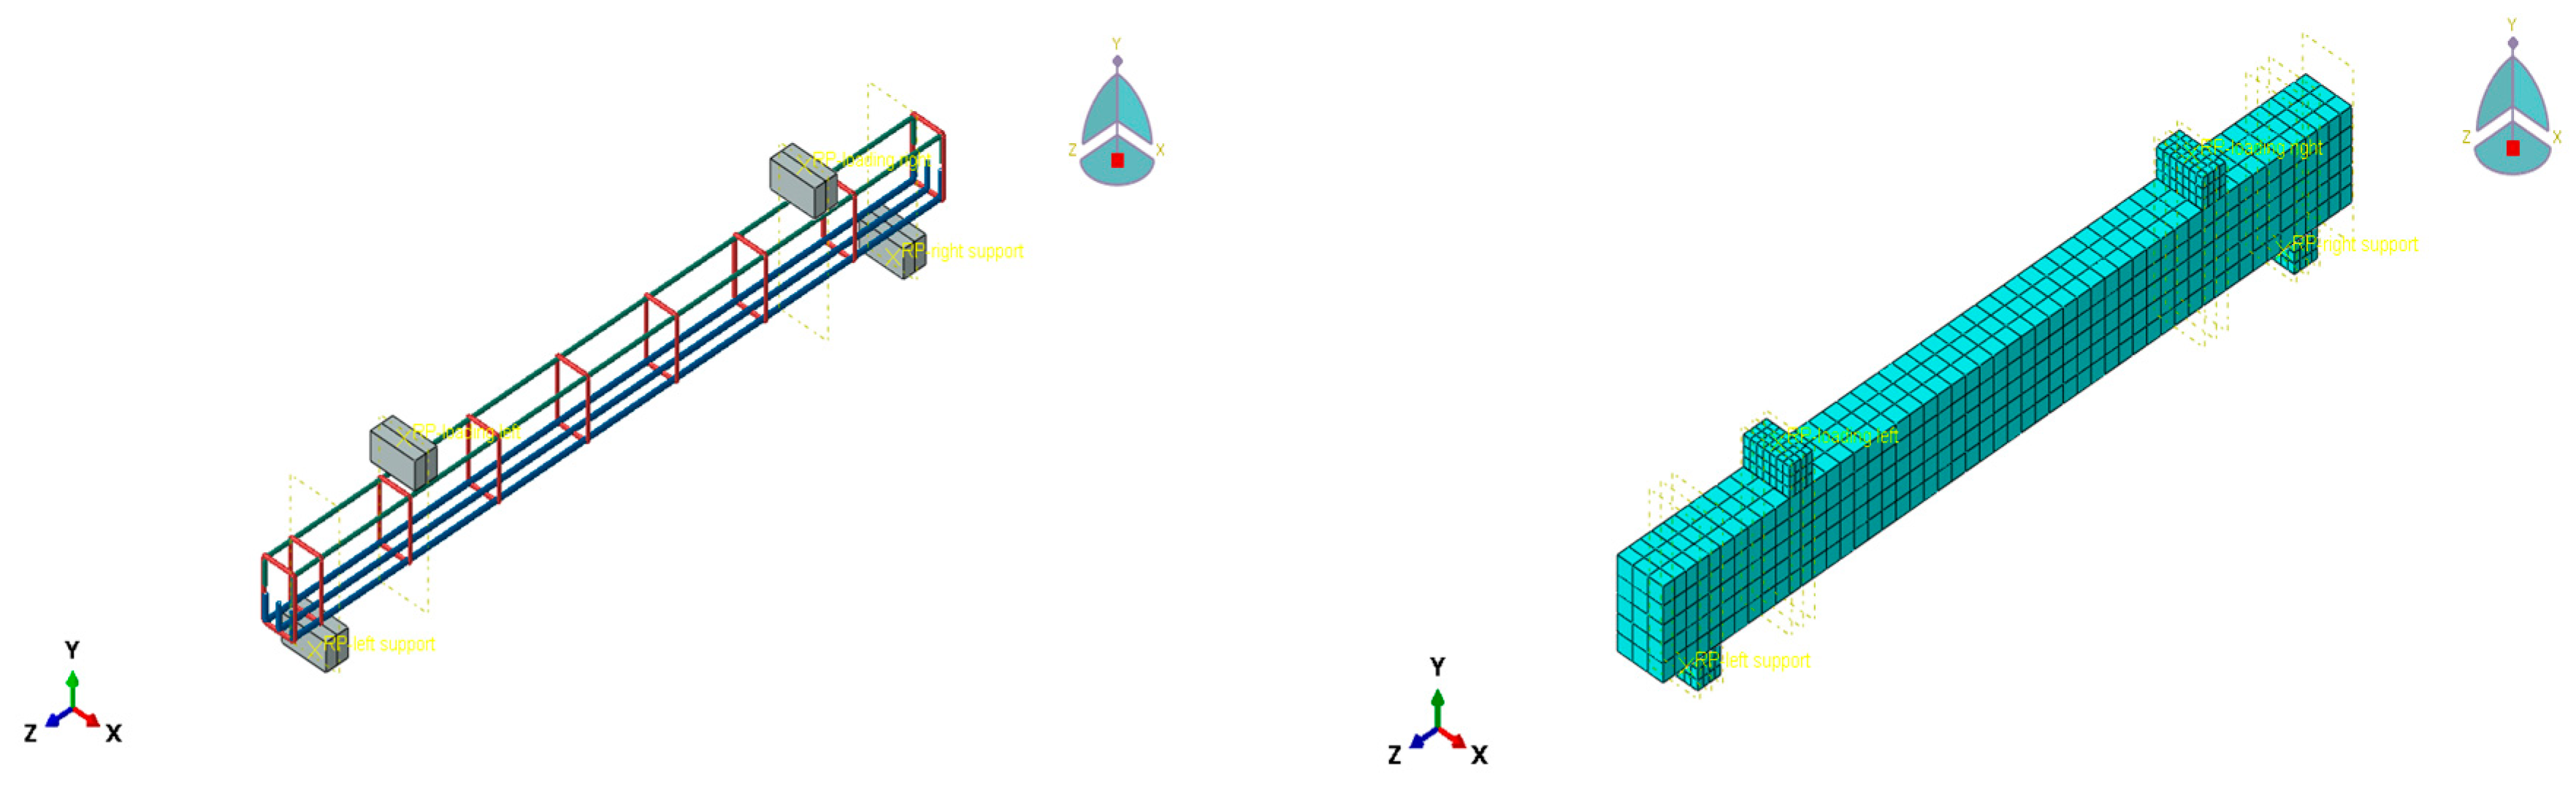
The concrete modeled using a solid element C3D8 possessing cracking and crushing in tension and compression, respectively. The reinforcing bars were modeled using a 3D truss element T3D2. At supports and loading points, bearings were modeled using a solid element. Several trials were performed to determine the proper mesh size, and consequently, concrete elements with maximum dimensions of 30   × 30 × 30 mm were used (Figure 16). Regarding the boundary conditions, at one support, translation was restrained in the x- and y-directions. At the other one, only translation in the y-direction was restrained. A perfect bond was assumed between the embedded steel bars and the concrete. It is acknowledged that this common simplification neglects potential bond-slip, which could have a minor influence on local stress distributions and crack widths, even though the overall predicted behavior showed good agreement with the experiments. Additionally, to simulate the contact between the concrete surface and steel bearings, tie constraints were used.

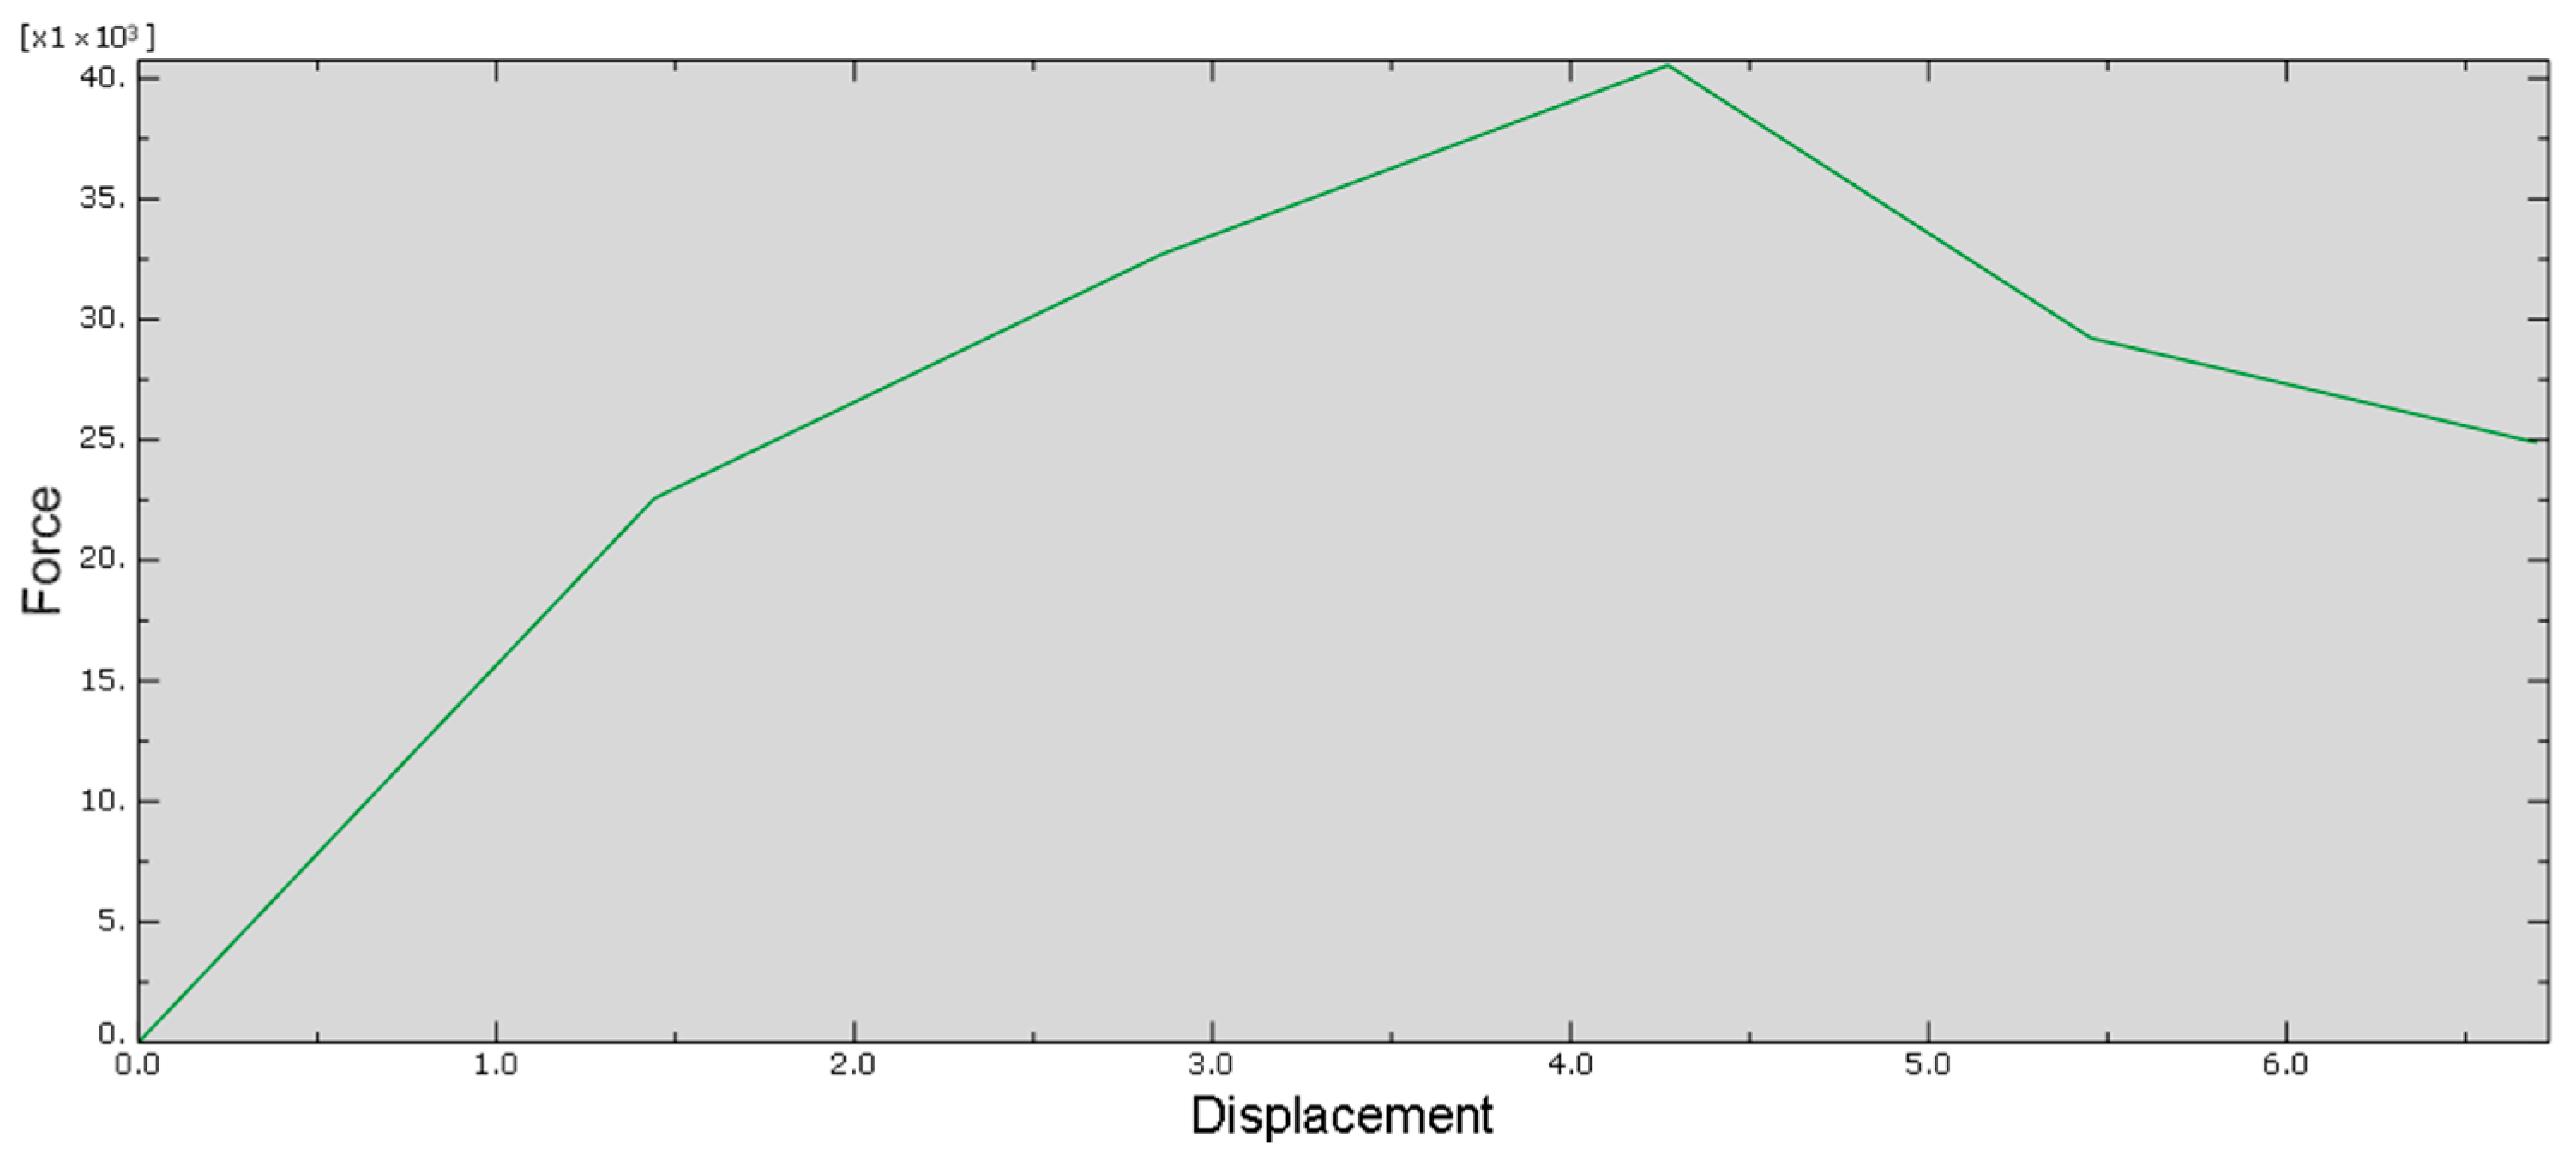
5.3. Load-Deflection Curve

Figure 17 shows the numerical (FE) results for GS-2.56-2. During the elastic phase and upon reaching the yielding load, and due to assuming a complete bond between concrete and steel bars, the FE behavior became slightly stiffer. However, there is general agreement among the results.

5.4. Crack Pattern

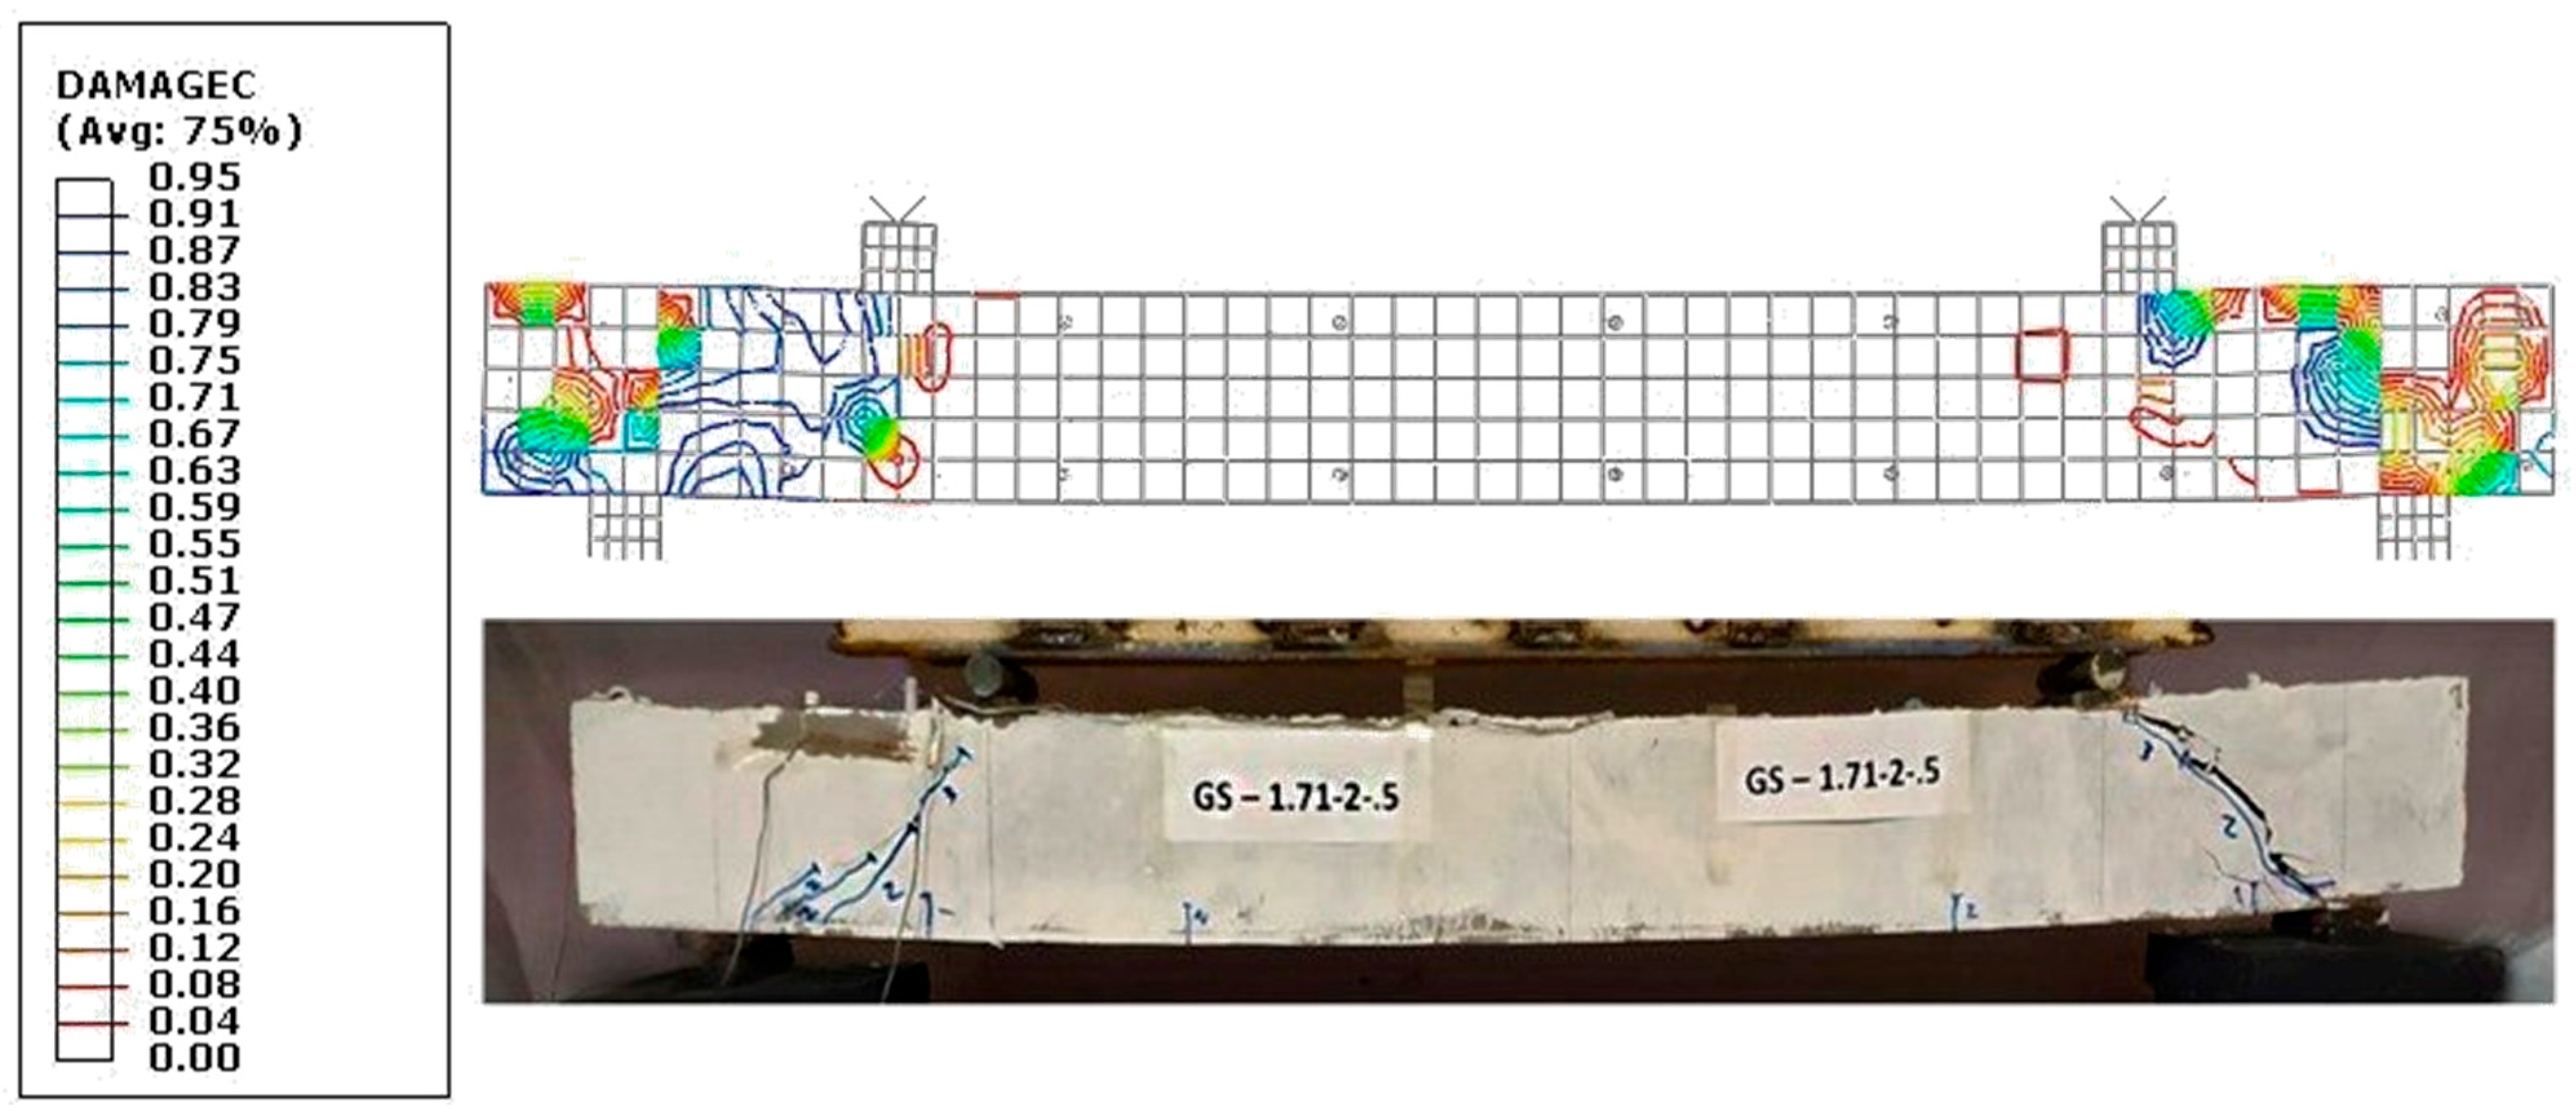
Finite element (FE) nonlinear analysis was performed using the ABAQUS software (CAE 6.13-1), employing the concrete damaged plasticity (CDP) material model. This model is specifically designed to define the post-cracking damage and stiffness degradation attributes of concrete-like materials, as outlined in previous research [17].
The accuracy of the FE model in predicting the failure mode was further validated by comparing the final crack patterns. Figure 18 presents a direct comparison between the damage distribution predicted by the FE model and the actual crack pattern observed on the tested beam (GS-1.71-2). The model successfully captured the critical diagonal shear crack, showing excellent qualitative agreement with the experimental result. This strong correlation provides further confidence in the numerical model’s ability to accurately simulate the key failure mechanisms of the GPC beams.

6. Conclusions

Based on the results of this exploratory investigation into the shear performance of sustainable self-compacting geopolymer reinforced concrete beams, the following preliminary conclusions can be drawn:
  • The structural behavior of the tested GPC beams was consistent with the well-established findings of conventional concrete members. Specifically, increasing the longitudinal reinforcement ratio from 0.85% to 2.0% enhanced the ultimate shear capacity by 18.3%, and all beams exhibited shear-dominated failure modes.
  • Detailed strain measurements confirmed the expected material and member response. The ultimate compressive strain of the geopolymer concrete ranged between 0.0021 and 0.0031, aligning well with typical values. Furthermore, measured shear strains within the shear span (up to 4.0 × 10⁻³) indicated significant and effective engagement of the stirrups in resisting shear forces.
  • The inclusion of GWP appears to contribute positively to the matrix integrity, likely through a physical micro-filler effect, which supports the development of effective shear transfer mechanisms like dowel action.
  • A comparison with ACI 318-19 and AS 3600-2018 showed that both codes provided safe and reasonably accurate shear capacity predictions, with the experimental-to-predicted ratio consistently remaining above 0.98.
  • The nonlinear FE model, utilizing the CDP material properties, successfully validated the experimental results, accurately predicting the load–deflection response and the final crack patterns.
Although this study’s findings show a promising and consistent correlation with the predictive models of ACI 318 and AS 3600, it must be emphasized that these results are not conclusive due to the relatively limited number of specimens. Robust validation can be achieved through future studies with a significantly larger dataset.

Author Contributions

Conceptualization, M.E.F., M.E.E.-Z. and A.M.T.; methodology, M.E.F., M.E.E.-Z. and M.M.; software, M.E.F.; validation, M.E.F., O.Y. and M.A.; formal analysis, M.E.F. and M.M.; investigation, M.E.F. and M.E.E.-Z.; resources, A.M.T. and O.Y.; data curation, A.M.T. and M.A.; writing—original draft preparation, M.E.F., M.M. and A.M.T.; writing—review and editing, M.E.F., M.E.E.-Z., O.Y., M.A. and A.M.T.; visualization, M.M.; supervision, M.E.F., M.E.E.-Z. and A.M.T.; project administration, M.E.E.-Z. and A.M.T.; funding acquisition, M.M. and A.M.T. All authors have read and agreed to the published version of the manuscript.

Funding

This research received no external funding.

Data Availability Statement

All data supporting the findings of this study are available within the manuscript.

Conflicts of Interest

The authors declare that they have no known competing financial interests or personal relationships that could have appeared to influence the work reported in this paper.

Abbreviations

AASAlkali activator solution
a/dShear span-to-depth ratio
A s Nominal area of tension steel
CDPConcrete damage plasticity
dEffective depth of beam section
E c Concrete modulus
εEccentricity
f c Compressive strength
f t Splitting strength
f y Yield strength
f u , t Ultimate tensile strength
f b o / f c o Uniaxial-to-biaxial compressive strength
φDilation
Curvature
y Yield curvature
GPCGeopolymer concrete
GWPGranite waste powder
GGBFSGround granulated blast furnaces slag
µs (ρ)Longitudinal reinforcement ratio
µ S T R . Shear reinforcement ratio
µ B Balanced reinforcement ratio
µ M A X Maximum reinforcement ratio
μViscosity factor
Na2SiO3 (SS)Sodium silicate solution
NaOH (SH)Sodium hydroxide solution
P u Ultimate load
τtestShear strength
V testShear force

References

  1. Abdellatief, M.; Elrahman, M.A.; Abadel, A.A.; Wasim, M.; Tahwia, A. Ultra-high performance concrete versus ultra-high performance geopolymer concrete: Mechanical performance, microstructure, and ecological assessment. J. Build. Eng. 2023, 79, 107835. [Google Scholar] [CrossRef]
  2. Davidovits, J. Geopolymers-Inorganic polymeric new materials. J. Therm. Anal. Calorim. 1991, 37, 1633–1656. [Google Scholar] [CrossRef]
  3. Tahwia, A.M.; Abd Ellatief, M.; Heneigel, A.M.; Abd Elrahman, M. Characteristics of eco-friendly ultra-high-performance geopolymer concrete incorporating waste materials. Ceram. Int. 2022, 48, 19662–19674. [Google Scholar] [CrossRef]
  4. Youssf, O.; Abbass, A.M.; Ahmed, A.K.; Tahwia, A.M. Sustainable High-Performance Geopolymer Concrete: The Role of Recycled Industrial Wastes in Strength, Durability, and Microstructure Enhancement. Infrastructures 2025, 10, 241. [Google Scholar] [CrossRef]
  5. Rajini, B.; Rao, A.V.N. Mechanical Properties of Geopolymer Concrete with Fly Ash and GGBS as Source Materials. Int. J. Innov. Res. Sci. Eng. Technol. 2014, 3, 15944–15953. [Google Scholar] [CrossRef]
  6. Tahwia, A.M.; Heniegal, A.M.; Abdellatief, M.; Tayeh, B.A.; Elrahman, M.A. Properties of ultra-high performance geopolymer concrete incorporating recycled waste glass. Case Stud. Constr. Mater. 2022, 17, e01393. [Google Scholar] [CrossRef]
  7. Kumar, P.U.; Bendapudi, S.C.K. Flexural behaviour of reinforced geopolymer concrete beams with GGBS and metakaoline. Int. J. Civ. Eng. Technol. 2016, 7, 260–277. [Google Scholar]
  8. Davidovits, J. Geopolymer Chemistry and Applications, 5th ed.; Geopolymer Institute: Saint-Quentin, France, 2008. [Google Scholar]
  9. Li, N.; Shi, C.; Zhang, Z.; Wang, H.; Liu, Y. A review on mixture design methods for geopolymer concrete. Compos. Part B Eng. 2019, 178, 107490. [Google Scholar] [CrossRef]
  10. Lee, K.M.; Choi, S.; Choo, J.F.; Choi, Y.C.; Yoo, S.W. Flexural and Shear Behaviors of Reinforced Alkali-Activated Slag Concrete Beams. Adv. Mater. Sci. Eng. 2017, 2017, 1–12. [Google Scholar] [CrossRef]
  11. Rangan, B.V. Shear design of reinforced concrete beams, slabs and walls. Cem. Concr. Compos. 1998, 20, 455–464. [Google Scholar] [CrossRef]
  12. Ajay Kumar, T.M.; Eshwar Prabhath, K.; Aishwarya, V.N.L.S.; Venkatesan, V. Self-compacting geopolymer concrete with an alkaline activator ratio. Int. J. Civ. Eng. Technol. 2018, 9, 1877–1882. [Google Scholar]
  13. Fathi, M.E.; El-Zoughiby, M.E.; Mortagi, M.; Tahwia, A.M. Experimental and Numerical Investigation of Flexural Behavior of Sustainable Self-Compacting Geopolymer RC Beams. Innov. Infrastruct. Solut. 2026, in press. [Google Scholar]
  14. Mo, K.H.; Alengaram, U.J.; Jumaat, M.Z. Structural performance of reinforced geopolymer concrete members: A review. Constr. Build. Mater. 2016, 120, 251–264. [Google Scholar] [CrossRef]
  15. Palomo, A.; Grutzeck, M.W.; Blanco, M.T. Alkali-activated fly ashes: A cement for the future. Cem. Concr. Res. 1999, 29, 1323–1329. [Google Scholar] [CrossRef]
  16. Shibayama, A.; Nishiyama, M. Shear strength of reinforced fly-ash-based geopolymer concrete beams with and without shear reinforcement. Structures 2023, 50, 603–614. [Google Scholar] [CrossRef]
  17. Visintin, P.; Mohamed Ali, M.S.; Albitar, M.; Lucas, W. Shear behaviour of geopolymer concrete beams without stirrups. Constr. Build. Mater. 2017, 148, 10–21. [Google Scholar] [CrossRef]
  18. Yacob, N.S.; ElGawady, M.A.; Sneed, L.H.; Said, A. Shear strength of fly ash-based geopolymer reinforced concrete beams. Eng. Struct. 2019, 196, 109298. [Google Scholar] [CrossRef]
  19. ACI Committee 318. Building Code Requirements for Structural Concrete and Commentary (ACI 318R-19); American Concrete Institute: Farmington Hills, MI, USA, 2019. [Google Scholar]
  20. AS 3600-2009; Concrete Structures. Australia Standards: Sydney, Australia, 2009; p. 198.
  21. Hui, C.; Wang, Y.; Cheng, X.; Liu, J.; Lei, F.; Hai, R.; Wu, H.; Yang, F. Shear capacity experiment, load-bearing capacity calculation, and numerical simulation of reinforced geopolymer concrete beams. J. Build. Eng. 2025, 111, 113375. [Google Scholar] [CrossRef]
  22. Mao, Y.; Song, J.; Hwang, H.-J.; Du, Y.; Shi, C. Shear behavior of reinforced slag-based geopolymer concrete T-shaped beams. Structures 2025, 74, 108491. [Google Scholar] [CrossRef]
  23. Wu, C.; Hwang, H.-J.; Shi, C.; Li, N.; Du, Y. Shear tests on reinforced slag-based geopolymer concrete beams with transverse reinforcement. Eng. Struct. 2020, 219, 110966. [Google Scholar] [CrossRef]
  24. Thakur, M.; Bawa, S. Self-Compacting geopolymer Concrete: A review. Mater. Today Proc. 2022, 59, 1683–1693. [Google Scholar] [CrossRef]
  25. Raia, A.; Tahwia, A.; Raheem, A.H.A.; Elrahman, M.A. Synergistic influence of metakaolin and slag cement on the properties of self-compacting fiber-reinforced concrete. Innov. Infrastruct. Solut. 2022, 7, 69. [Google Scholar] [CrossRef]
  26. Sashidhar, C.; Guru, J.J.; Neelima, C.; Pavan, K.D. Preliminary studies on self-compacting geopolymer concrete using manufactured sand. Asian J. Civ. Eng. 2016, 17, 277–288. [Google Scholar]
  27. EFNARC. The European Guidelines for Self-Compacting Concrete; EFNARC: Flums, Switzerland, 2005. [Google Scholar]
  28. BS EN 197-1:2000; Cement—Part 1: Composition, Specifications and Conformity Criteria for Common Cements. British Standard: London, UK, 2000.
  29. IS 2386; Part I—Method of Test for Aggregate for Concrete (Particle Size and Shape). Indian Standards: New Delhi, India, 1963.
  30. ASTM A615/A615M; Standard Specification for Deformed and Carbon-Steel Bars for Concrete Reinforcement. ASTM International: West Conshohocken, PA, USA, 2017.
  31. Mathern, A.; Yang, J. A practical finite element modeling strategy to capture cracking and crushing behavior of reinforced concrete structures. Materials 2021, 14, 506. [Google Scholar] [CrossRef] [PubMed]
  32. ASTM C1611/C1611M; Standard Test Method for Slump Flow of Self-Consolidating Concrete. ASTM International: West Conshohocken, PA, USA, 2009; pp. 1–6.
  33. BS EN 12350-10:2010; Testing Fresh Concrete—Self-Compacting Concrete: L-Box Test—Part 10. BSI Standards: London, UK, 2010.
  34. ASTM C39/C39M; Standard Test Method for Compressive Strength of Cylindrical Concrete Specimens. ASTM International: West Conshohocken, PA, USA, 2001; pp. 1–5.
  35. ASTM C496M-11; Standard Test Method for Splitting Tensile Test. ASTM International: West Conshohocken, PA, USA, 2017.
  36. ASTM C78/C78M-22; Standard Test Method for Flexural Strength of Concrete. ASTM International: West Conshohocken, PA, USA, 2009; pp. 14–17.
  37. ASTM C469; Standard Test Method for Static Modulus of Elasticity and Poisson’s Ratio of Concrete in Compression. ASTM International: West Conshohocken, PA, USA, 2014; pp. 1–5.
  38. Duxson, P.; Fernández-Jiménez, A.; Provis, J.L.; Lukey, G.C.; Palomo, A.; Van Deventer, J.S.J. Geopolymer technology: The current state of the art. J. Mater. Sci. 2007, 42, 2917–2933. [Google Scholar] [CrossRef]
  39. Saxena, R.; Gupta, T.; Sharma, R.K.; Panwar, N.L. Influence of granite waste on mechanical and durability properties of fly ash-based geopolymer concrete. Environ. Dev. Sustain. 2021, 23, 17810–17834. [Google Scholar] [CrossRef]
  40. Saxena, R.; Gupta, T.; Sharma, R.K.; Siddique, S. Mechanical, durability and microstructural assessment of geopolymer concrete incorporating fine granite waste powder. J. Mater. Cycles Waste Manag. 2022, 24, 1842–1858. [Google Scholar] [CrossRef]
  41. Wight, J.K.; MacGregor, J.G. Reinforced Concrete: Mechanics and Design, 6th ed.; Pearson Education, Inc.: Upper Saddle River, NJ, USA, 2012. [Google Scholar]
  42. Al-Azzawi, M.; Yu, T.; Hadi, M.N.S. Factors affecting the bond strength between the fly ash-based geopolymer concrete and steel reinforcement. Structures 2018, 14, 262–272. [Google Scholar] [CrossRef]
  43. Mousavinejad, S.H.G.; Gashti, M.F. Effects of alkaline solution/binder and Na2SiO3/NaOH ratios on fracture properties and ductility of ambient-cured GGBFS based heavyweight geopolymer concrete. Structures 2021, 32, 2118–2129. [Google Scholar] [CrossRef]
  44. Paruthi, S.; Rahman, I.; Khan, A.H.; Sharma, N.; Alyaseen, A. Strength, durability, and economic analysis of GGBS-based geopolymer concrete with silica fume under harsh conditions. Sci. Rep. 2024, 14, 31572. [Google Scholar] [CrossRef]
  45. Hardjito, D.; Rangan, B.V. Development and Properties of Low-Calcium Fly Ash-Based Geopolymer Concrete; Curtin University of Technology: Perth, Australia, 2014. [Google Scholar]
  46. Hardjito, D. Studies on Fly Ash-Based Geopolymer Concrete; Curtin University of Technology: Perth, Australia, 2005. [Google Scholar]
Figure 1. Materials used for geopolymer concrete.
Infrastructures 11 00084 g001
Figure 2. Slump-flow and L-box tests.
Infrastructures 11 00084 g002
Figure 3. Heat curing treatment.
Infrastructures 11 00084 g003
Figure 4. Geometric and reinforcement details of the beam specimens.
Infrastructures 11 00084 g004
Figure 5. Test setup—Elev. view.
Infrastructures 11 00084 g005
Figure 6. Test setup—3D view.
Infrastructures 11 00084 g006
Figure 7. Crack pattern of tested specimens.
Infrastructures 11 00084 g007
Figure 8. Direct comparison of experimentally observed failure modes with classical reinforced concrete mechanisms: (A) photographs from the current study, and (B) the corresponding mechanisms adapted from Wight (2012) [41].
Infrastructures 11 00084 g008
Figure 9. The dowel action for GS-2.14-2.
Infrastructures 11 00084 g009
Figure 10. Load-mid-span deflection and failure modes.
Infrastructures 11 00084 g010
Figure 11. Deflection of beam GS-2.14-.85: (a) measured at ultimate load, and (b) measured at far post-peak load.
Infrastructures 11 00084 g011
Figure 12. Effect of longitudinal tensile reinforcement ratio on beams’ shear capacity.
Infrastructures 11 00084 g012
Figure 13. Load–strain curves of strain at mid-span of longitudinal tensile steel.
Infrastructures 11 00084 g013
Figure 14. Load–strain curves of strain at surface of concrete.
Infrastructures 11 00084 g014
Figure 15. Load–strain curves of stirrups.
Infrastructures 11 00084 g015
Figure 16. Finite-element meshing and boundary conditions.
Infrastructures 11 00084 g016
Figure 17. Numerical (FE) load–displacement curve for GS-2.56-2.
Infrastructures 11 00084 g017
Figure 18. Numerical and experimental crack patterns of beam GS-1.71-2.
Infrastructures 11 00084 g018
Table 1. Chemical and physical properties of GWP, GGBFS and SF.
ConstituentsGWP (%)GGBFS (%)SF (%)
SiO269.539.9894.73
Al2O314.516.22-
Fe2O33.011.11-
CaO3.0029.2-
MgO0.647.74-
SO30.192.250.20
Cl0.110.30-
Na2O3.461.040.51
K2O4.290.65-
TiO20.370.61-
P2O50.080.01-
ZnO0.070.005-
Fineness (m2/kg)41940020,000
Loss of Ignition (%)0.652.11.5
Bulk density (kg/m3)7001100220
Specific gravity2.82.92.25
Table 2. Characteristics of the reinforcing steel bars.
No.Bar Diameter (mm)GradeCross-Sectional Area (mm2) Yield   Strength   f y (MPa) Ultimate   Tensile   Strength   f u , t (MPa)
18 (Plain)B 300 C-P50.3354446.2
28 (Deformed)B 420 DWR50.3531.5593.7
310 (Deformed)B 420 DWR78.5517.1676
Table 3. Characteristics of the superplasticizer.
PropertyValue
Specific gravity1.09
Chloride ion contentLess than 0.1%
Recommended dosage1 to 2% by weight
pH4.5
Table 4. Mix proportions of GPC constituents.
ItemBinderFine AggregateASSSuperplasticizer
Constituent
(Quantity, kg/m3)
GWP
(360)
GGBFS
(360)
SF
(180)
Silica
(577)
Quartz
(385)
SH (135)SS
(270)
SP
(14)
Table 5. Fresh test results following the European Guidelines.
TestMeasured PropertyResults (mm)Guidelines Range (mm)
Slump-flowFilling ability600550–850
L-boxPassing ability0.92≥0.8
Sieve segregation, %Segregation11≤15
Table 6. Hardened concrete properties.
Beam Type Compressive   Strength   ( f c , MPa) Splitting   Tensile   Strength   ( f t , MPa)Modulus of Elasticity (Ec, GPa)
GC50528
GC: geopolymer concrete.
Table 7. Details of the beam specimens.
No.Beam ID *Longitudinal Reinforcementµs (%)µb (%) [19]µmax (%) [19]Shear Reinforcementµstr (%)(a/d) Ratio
1GS-1.71-23T10 (Bottom), 2T8 (Top)23.262.44T8-200 c/c0.51.71
2GS-2.14-23T10 (Bottom), 2T8 (Top)22.82.1T8-200 c/c0.52.14
3GS-2.56-23T10 (Bottom), 2T8 (Top)22.882.16T8-200 c/c0.52.56
4GS-2.14-1.342T10 (Bottom), 2T8 (Top)1.342.742.0T8-200 c/c0.52.14
5GS-2.14-.852T8 (Bottom), 2T8 (Top)0.852.742.0T8-200 c/c0.52.14
* G: geopolymer concrete, S: shear behavior, a/d = 1.71, and µs = 2.
Table 8. Shear test results and failure modes.
Beam IDPtest (kN)Vtest (kN)τtest (kN/mm2)Failure Mode
GS-1.71-230151.28Shear
GS-2.14-23517.51.49Shear
GS-2.56-240201.7Shear
GS-2.14-1.3432.516.251.39Shear
GS-2.14-.8530151.28Shear
Table 9. Experimental and predicted ultimate load.
Beam IDPExp. (kN)PCalc. (kN)PExp./PCalc.
GS-1.71-23030.480.98
GS-2.14-23530.481.15
GS-2.56-24030.481.3
GS-2.14-1.3432.530.481.07
GS-2.14-.853030.480.98
Table 10. Influence of longitudinal tensile reinforcement ratio on shear capacity.
Beam IDf′c (MPa)µs (%)Peak Load (kN)Test Shear Strength (kN)
GS-2.14-.85530.853015.25
GS-2.14-1.34561.3432.516.5
GS-2.14-25723517.75
Table 11. CDP model parameters.
ParameterCategoryValue
φPlastic flow potential33°
ε0.1
f b o / f c o Yield surface1.16
K0.667
μViscosity parameter0.001
Disclaimer/Publisher’s Note: The statements, opinions and data contained in all publications are solely those of the individual author(s) and contributor(s) and not of MDPI and/or the editor(s). MDPI and/or the editor(s) disclaim responsibility for any injury to people or property resulting from any ideas, methods, instructions or products referred to in the content.