4.1. Exploratory Data Analysis
An exploratory data analysis was conducted to understand the variables in the dataset.
Table 4 presents the results of the univariate statistical analysis for the numerical variables. Time deviations in the executed projects ranged from 0% to 510%, with a mean of 29%. In contrast, cost deviations were relatively moderate, with a maximum of 54% and an average of 8.6%. These figures suggest that the projects and their respective addenda remained within the legal limits established by Colombian regulations. Regarding the initial contract values, these ranged from 42.11 to 20,264 CLMMW (Current Legal Monthly Minimum Wage), with an average of 1516 CLMMW. However, the coefficient of variation (CV) of 175% indicated a considerable disparity in project sizes. Furthermore, the CVs for time and cost increases during project execution exceeded 100%, highlighting substantial deviations from the initial estimates in time and cost. Regarding variable award growth, this represented the difference between the project value in the planning stage (bidding cost) and the awarded value to the winning bid as a percentage. Although this variable always had negative or zero values, since a contract could not be awarded for an amount greater than the estimated bid, the variable was presented in absolute value. Most projects were bid on at a value very close to zero; however, the maximum value was 6.55%.
The variable project intensity, which evaluated the contract value divided by the number of days, measured the amount of money invested per day. While similar behavior could be expected for projects of the same type, it was observed that although the average was 12.15, there were values as high as 116.86.
Figure 3a illustrates the number of projects that experienced time and cost deviations compared to those that did not have any deviations or showed both types of deviations. It was found that 48.9% of the projects were executed as planned, meaning that nearly half had no deviations. However, 24% of the projects experienced both time and cost deviations. Additionally, 15.3% faced planning or execution challenges that may have contributed to time deviations, while 11.8% reported cost deviations.
Figure 3b illustrates the distribution of the analyzed projects according to the year in which the contract was signed. Notably, all selected projects corresponded to the pre-pandemic period to avoid potential biases associated with the COVID-19 pandemic’s impacts on rural road infrastructure projects. The years with the highest number of analyzed projects were 2017, with 64 projects (27.9%), and 2015, with 63 projects (27.5%). In contrast, 2016 had the lowest number of projects included in the sample, with 34 projects, representing 14.8% of the total analyzed.
Figure 3c shows the distribution of analyzed projects based on the promoting entity. A significant concentration was noted among municipal-level promoters, who were responsible for 217 projects (94.8%) of the total projects. In contrast, only 12 projects (5.2%) were initiated by other entities, such as departmental governments or national-level institutions.
Figure 4a summarizes the composition of the sample in terms of project type. New construction contracts accounted for the largest share, with 96 projects (41.9%), highlighting the government’s recent push to expand the tertiary road network rather than simply upgrading existing roads. Improvement works, which typically involve widening, geometric corrections, and drainage upgrades, ranked a close second, accounting for 87 projects (38.0%). Together, these two categories represented nearly four-fifths of the total portfolio, emphasizing a strategic focus on enhancing rural connectivity through capital-intensive initiatives. In contrast, routine maintenance agreements amounted to 37 projects (16.2%), indicating that preventive upkeep receives less budgetary attention than expansion efforts, despite being recognized as cost-effective for maintaining service levels. Rehabilitation projects, aimed at restoring severely deteriorated sections to their original operating standards, were comparatively rare, with only nine cases (3.9%). This limited number may have resulted from successful preventive maintenance in previous years or suggest that major restorative actions are being postponed until roadway conditions become critical.
Figure 4b illustrates the geographic distribution of the 229 rural road projects analyzed. A significant majority of these projects, totaling 186 (81.2%), were located in the Andean region. In contrast, the Orinoquía region accounted for only 18 projects (7.9%), while the Caribbean and Pacific regions had 11 (4.8%) and 10 projects (4.4%), respectively. The Amazon region had the smallest share, with just four initiatives (1.7%). This noticeable imbalance reflects Colombia’s demographic and economic center: most rural settlements, agricultural corridors, and tertiary roads in need of rehabilitation or upgrading are found in the Andean highlands. Conversely, the Amazon and Pacific basins, which are characterized by lower population densities and limited road networks, attract relatively fewer investments.
Figure 4c shows the project distribution based on the winning contractors’ legal status. Consortia were the most common, securing 89 contracts (38.9%), which highlights the frequent need for combined technical and financial resources to meet the public tender requirements for road construction projects. Corporate entities that participated individually followed, winning 72 projects (31.4%). Natural persons obtained 58 contracts (25.3%). The “other” category, which included foundations and mixed-economy firms, accounted for only 10 projects (4.4%). The dominance of consortia and corporate entities indicated that institutional clients prefer bidders who can leverage multidisciplinary teams and substantial bonding capacity, attributes that individual contractors often lack for rural infrastructure programs.
Then, unsupervised learning was developed through MCA, including the independent variables: bidding value, initial duration, project intensity, award growth, year, promoter, contractor, project type, and region, to analyze the relationships between them. The process began with the generation of new components. The explanatory capacity of each component was identified and the proportion of variance accounted for by each dimension was determined. The first component explained 10.2% of the variance and the second component explained 8.3% of the variance. One of the inherent characteristics of MCA is that the components, dimensions, or factors created do not necessarily explain large percentages of the total variance [
74]. A biplot of the multiple correspondence analysis (MCA) with dimension 1 (Dim1) as the x-axis and dimension 2 (Dim2) as the y-axis helped to identify the variables that were most related to each dimension (see
Figure 5). Variables with similar profiles were grouped. It could be observed that the variable “Bidding value” was most related to dimension 1 (x-axis). Since this variable was discretized, the group that contributed the most was the one corresponding to projects with a value greater than 9590 CMMLV (bidding value between 9590 and 20305). Similarly, promoters in the category “Others” also contributed to dimension 1. The variable project intensity contributed significantly (y-axis) to dimension 2, with values ranging from 78.8 to 1217, mainly corresponding to the year 2019.
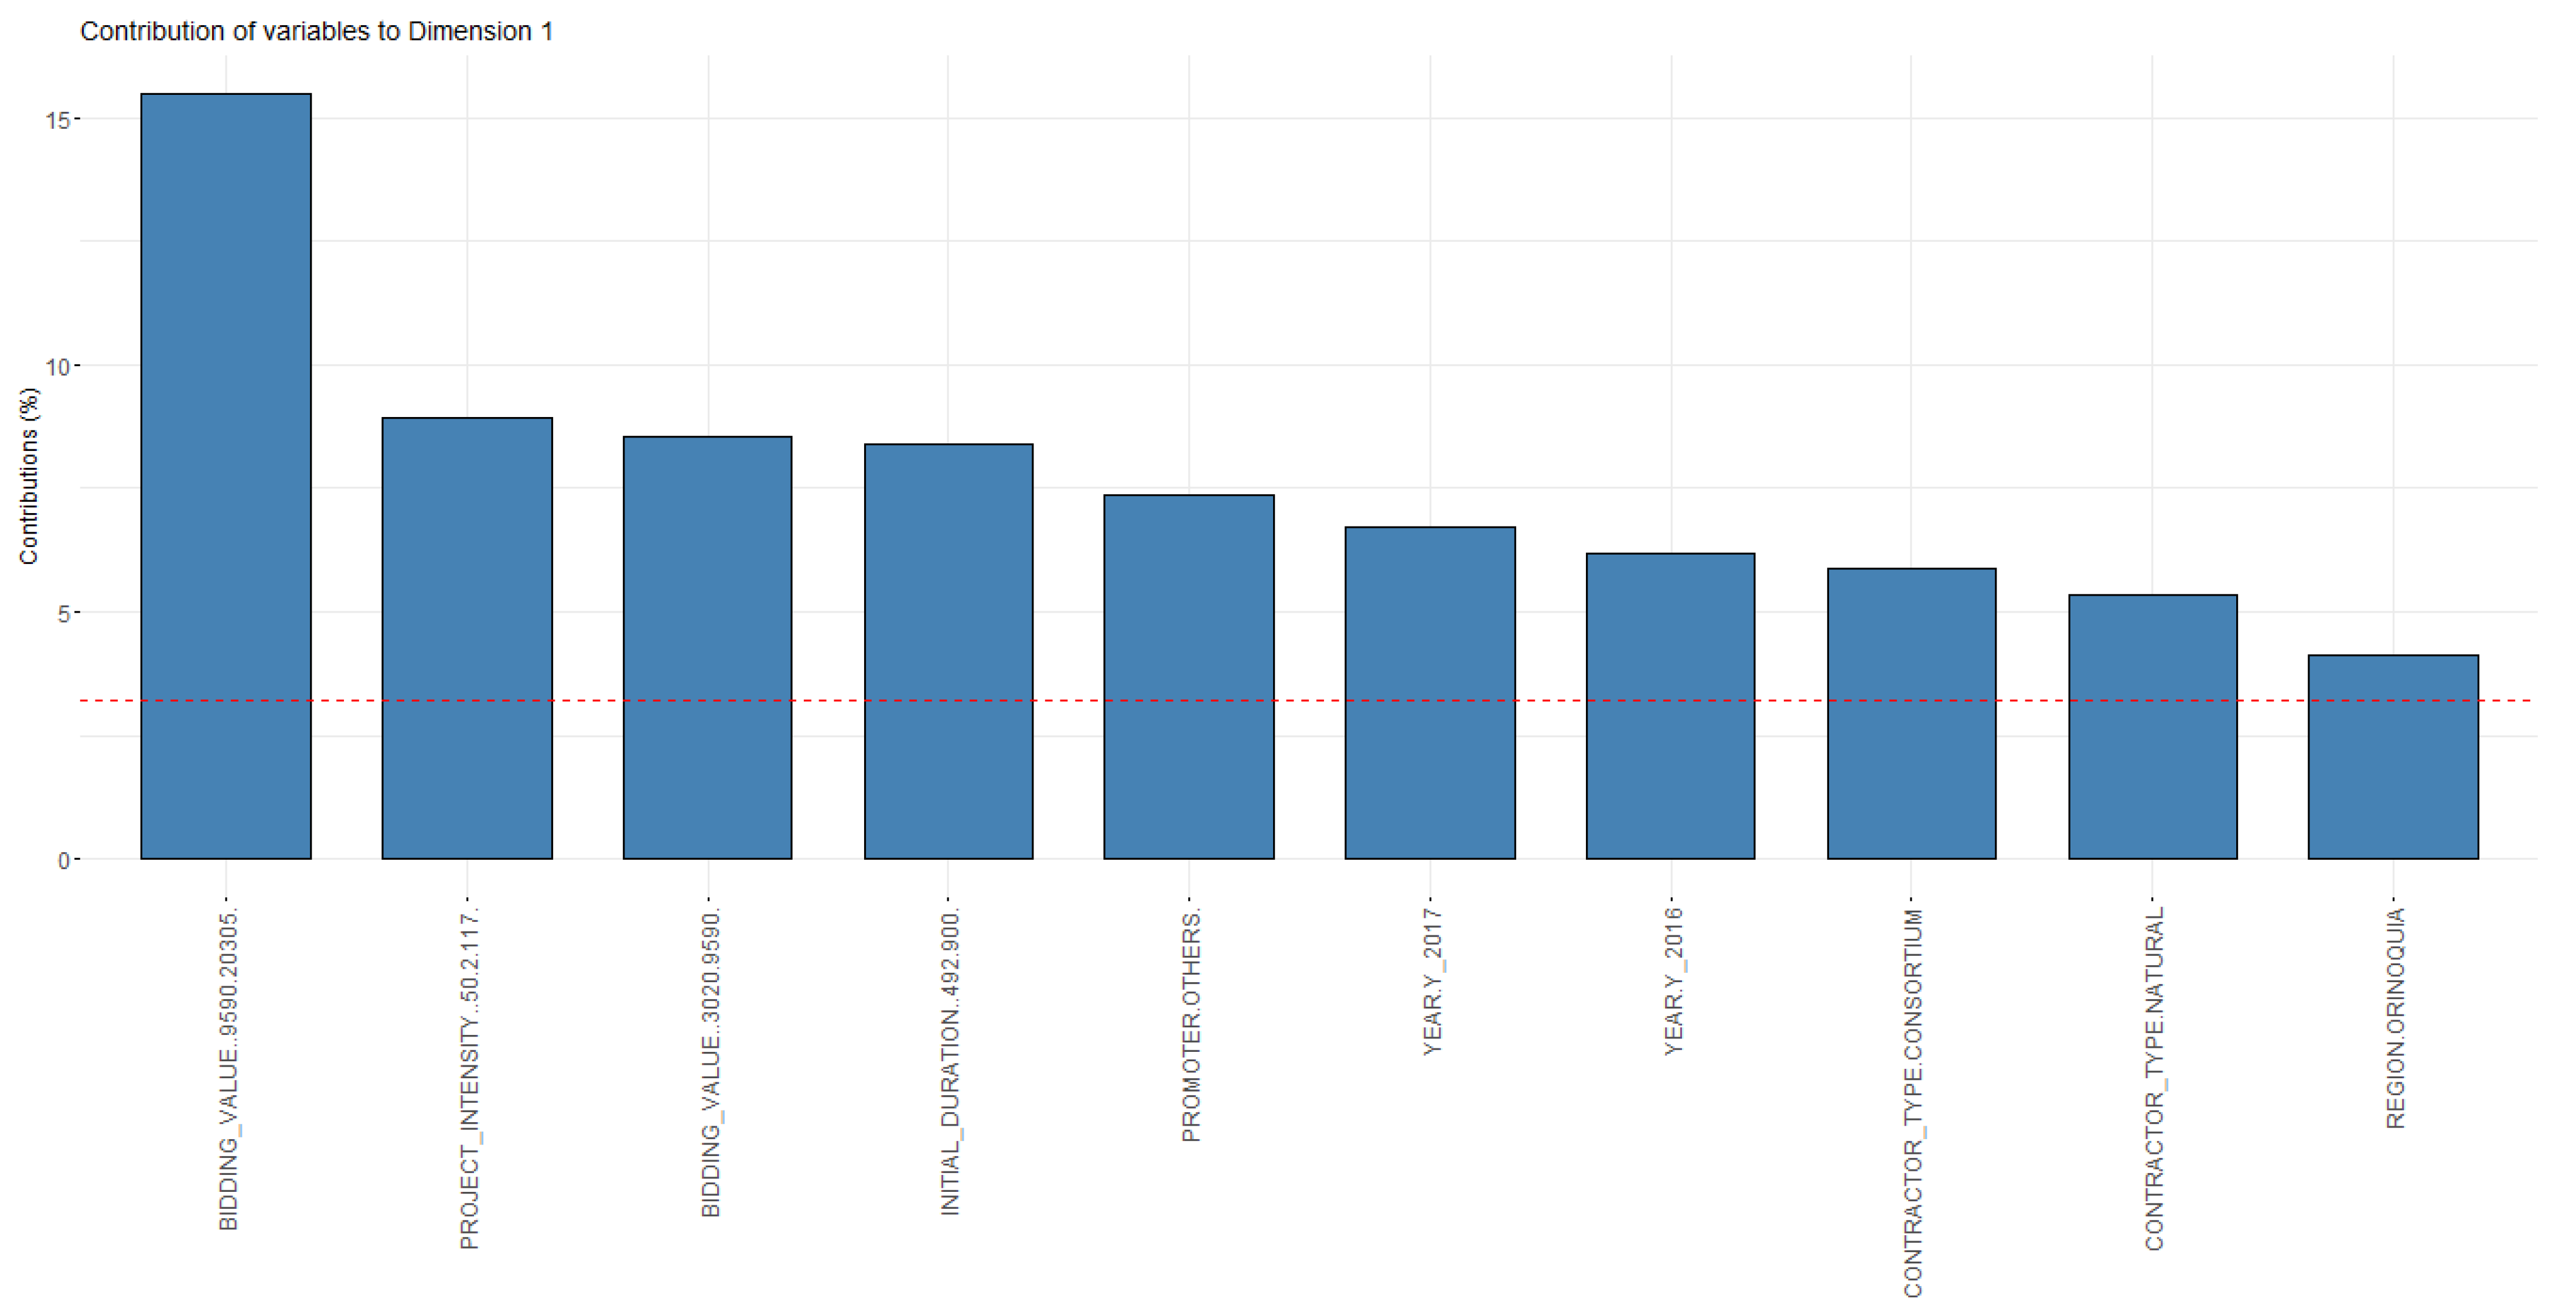
The ranking of variables contributing, in percentage, to dimension 1 (the first component) is shown in
Figure 6. The red dashed line in the above graph indicates the expected average contribution. For a certain component, a variable with a contribution exceeding this threshold is considered important in contributing to the component. Variables above this line were the most important contributors (in this case all the included in the figure). The categories with a bidding value higher than 9590 and a project intensity higher than 50.2 were most important in defining the first dimension and also appeared in the first places in the second dimension. They were the most important for explaining the variability of the dataset.
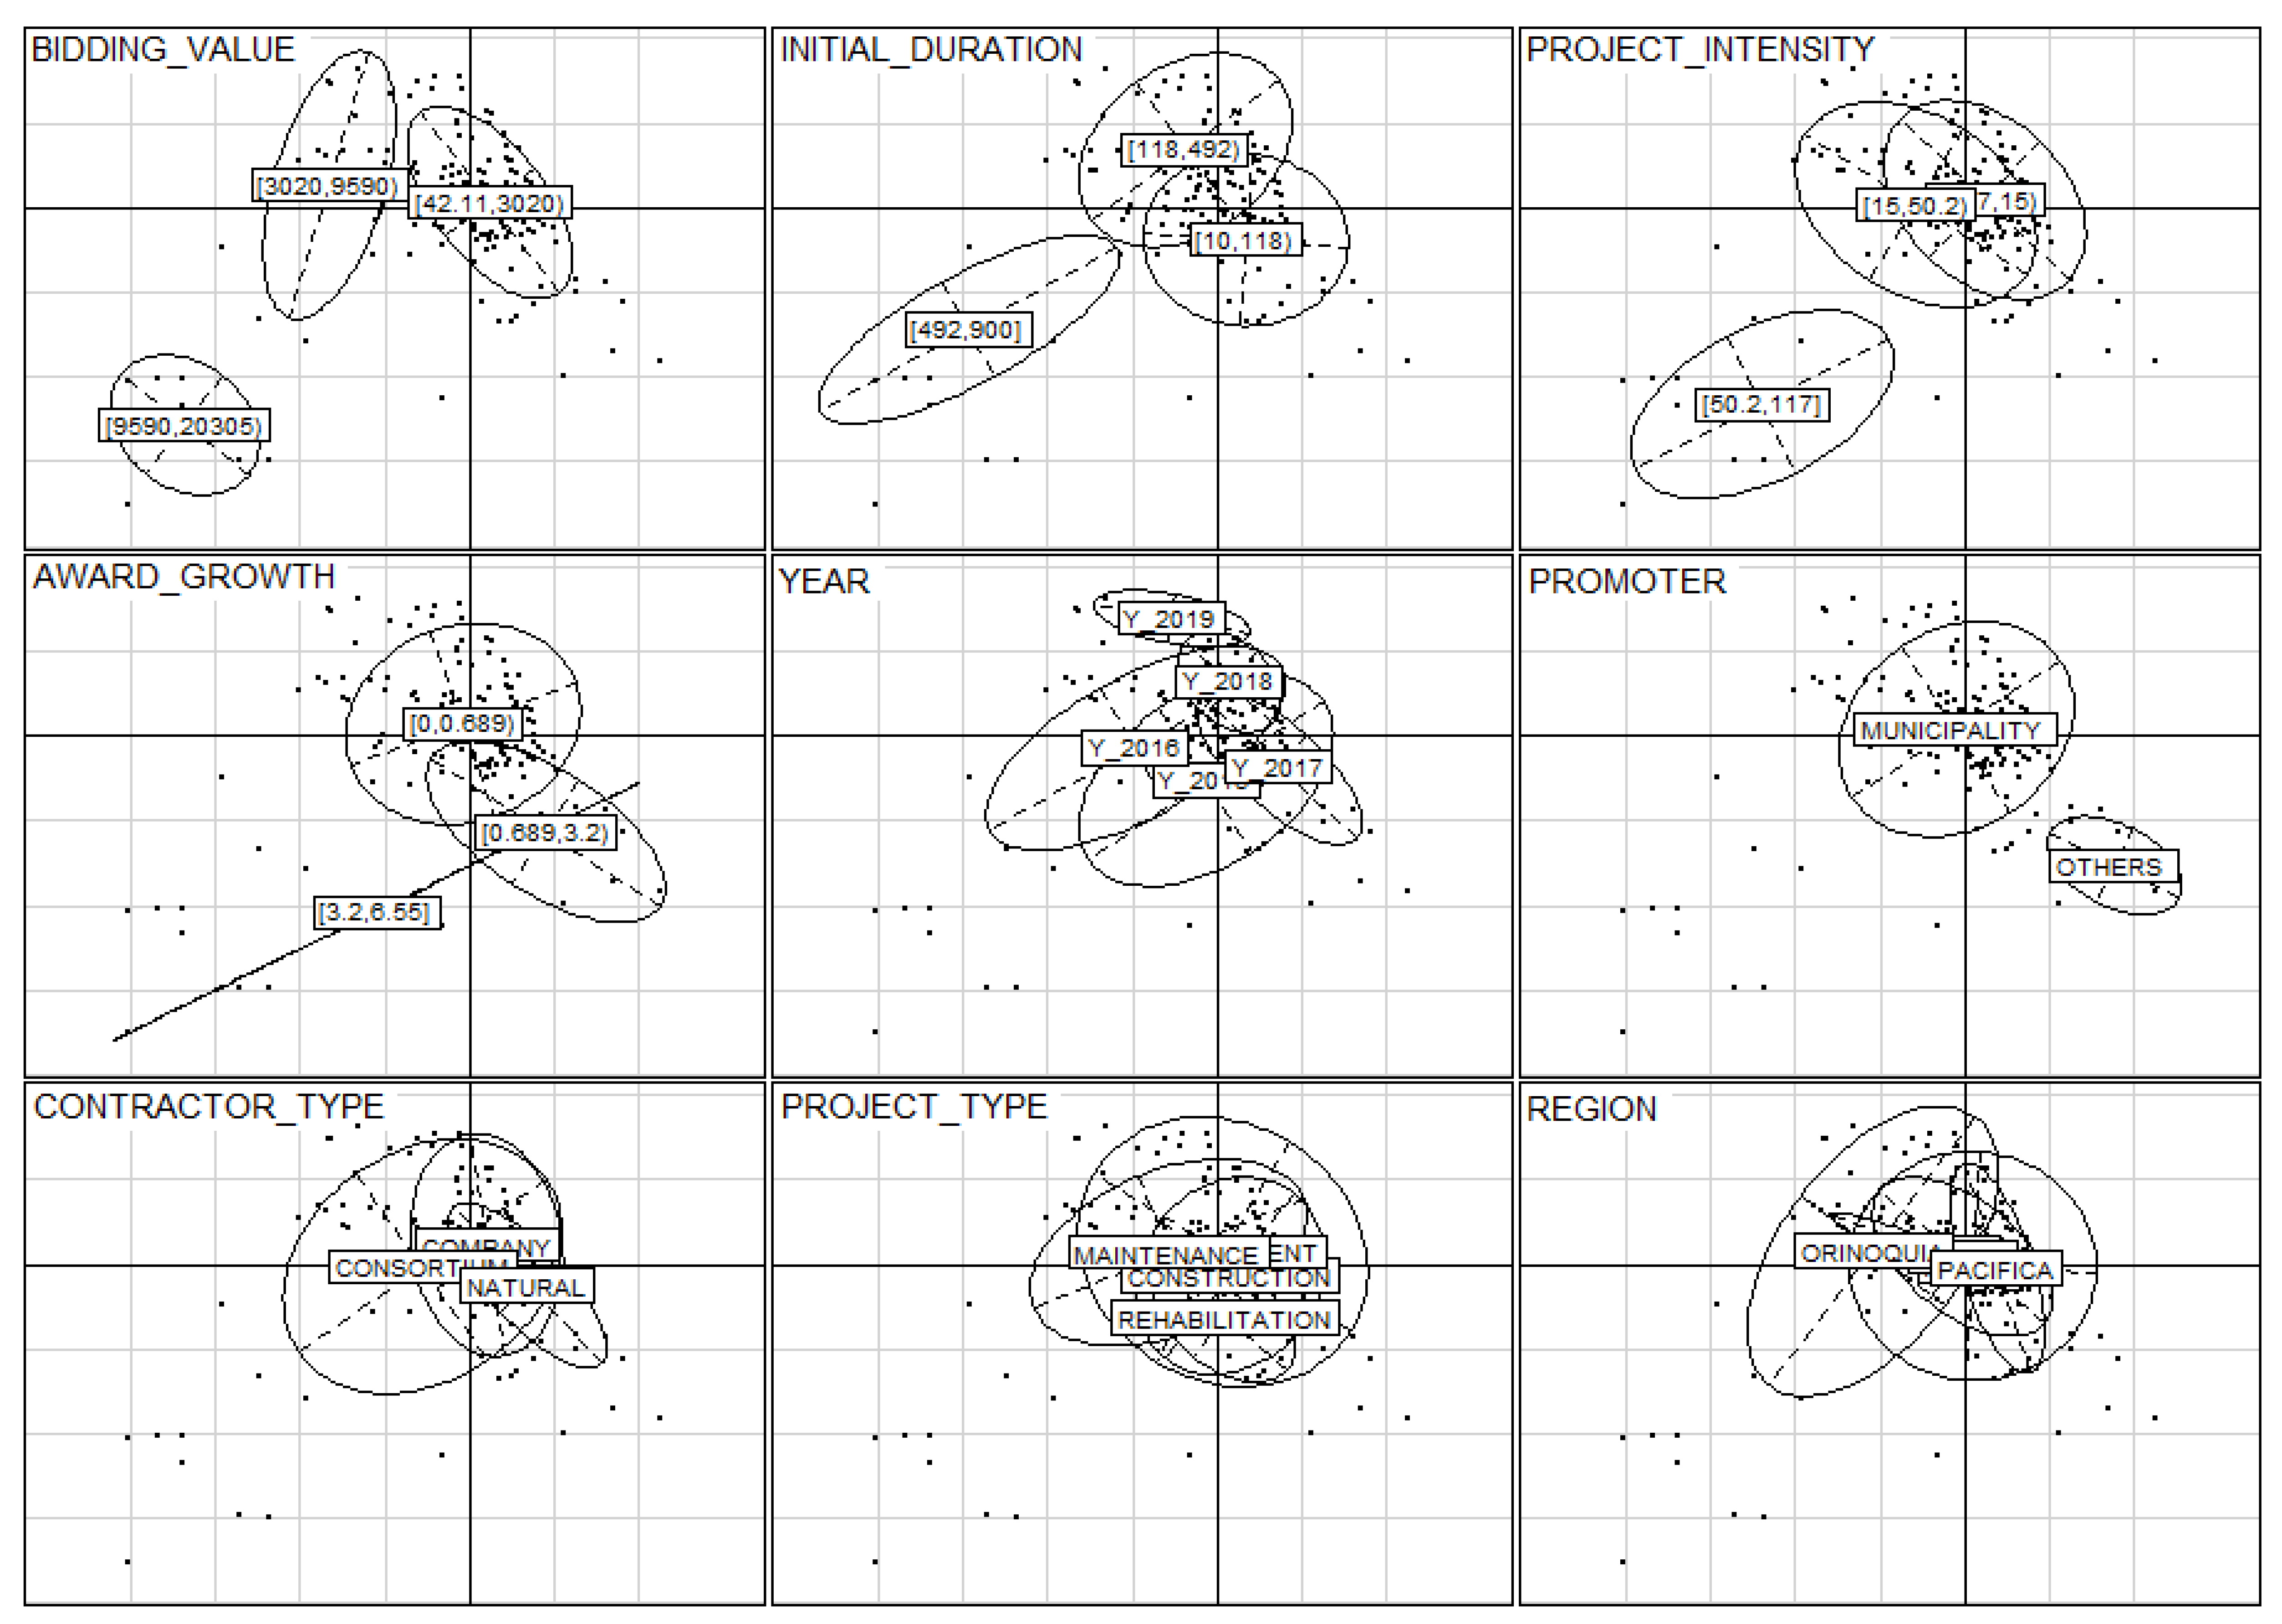
The MCA plot reveals that certain variables exhibited distinct patterns within specific categories (see
Figure 7). It is important to analyze the groups that are clearly separated from the others, such as bidding value for higher amounts (9590.00 to 20305.00 CLMMW) or initial duration for longer projects (492 to 900 days). Similarly, projects with higher project intensity (50.20 to 117.00) and award growth (3.20 to 6.55) display distinct behaviors compared to other groups. Additionally, variation was observed in the behavior of promoters within the “Others” category. However, variables such as year, project type, region, and contractor type did not contribute significantly to the variability in the data and tend to overlap. This analysis allowed for the identification of variables that exerted the most influence on the outcomes and those that did not have a significant impact.
4.3. Analysis of Numerical and Categorical Variables
To explore the relationships between time and cost deviations and categorical variables, the Kruskal–Wallis test was implemented, as the distribution of the numerical variables did not meet the assumptions required for parametric tests (non-normality).
4.3.1. Cost Deviation Versus Categorical Variables
The bivariate analysis of cost deviation and categorical variables is summarized in
Table 7, which presents the results of the Kruskal–Wallis test. Only statistically significant variables are included. For these variables, pairwise comparisons were additionally conducted using the Wilcoxon Mann–Whitney test to identify which specific groups showed significant differences. In each case, the category that exhibited different behavior from the others is presented, along with its mean and median values.
The year 2016 stood out from the others due to higher values for cost deviation, and it coincided with the mayoral election year. This supported the hypothesis that electoral turnover disrupts budget control through the renegotiation of priorities and the replacement of supervisory teams. Construction projects differed from the others, with lower values in cost deviation. Maintenance and rehabilitation projects in this case showed higher deviations, probably due to the execution along the roads and their operation, which could be affected by interactions with the community and the inability to work continuously. Regarding the promoter, the executors, which were municipalities, showed a higher cost deviation in the projects they carried out. The others corresponded to community action boards or community associations, in which other factors could influence the outcomes. The management of these projects may differ significantly from that of municipalities, which are governed by different legislation.
The statistical analysis presented above revealed that projects contracted in 2016 had the highest median schedule deviation (39%) and cost deviation (21%) among the entire 2013–2019 panel. A purely descriptive interpretation would label 2016 as an “outlier year,” yet such a label does little to advance the understanding of why time and cost performance deteriorated so sharply. A closer examination of Colombia’s political–institutional landscape revealed that 2016 combined three mutually reinforcing shocks (municipal administrative turnover, national fiscal austerity, and uncertainty surrounding the peace agreement plebiscite) that together disrupted the execution of rural road contracts. Although each factor has been documented separately in the public administration literature, their simultaneous occurrence in a single budget cycle created an especially unfavorable environment for project delivery, thereby offering a substantive causal narrative that complements the purely statistical correlations.
First, Colombia’s local elections were held in late 2015, with newly elected mayors and municipal councils assuming office on 1 January 2016. The first year of a municipal administration invariably entails cabinet reshuffles, renegotiations of advisory contracts, and the drafting and approval of the legally binding Plan de Desarrollo Municipal (MDP). During this transition, ongoing public work contracts are subject to intensified legal and technical review, and supervisory engineers are frequently replaced. Empirical studies of Colombian procurement show that various municipal infrastructure contracts experience at least one suspension or amendment in the first two quarters of a new mayoral term, largely because newly appointed legal teams revisit inherited obligations and adjust investment priorities [
13]. Such “administrative friction” slows the certification of completed work and delays cash payments to contractors, a sequence that leads directly to time extensions and cost overruns, as captured in the additional cost variable of our database. In the 2016 subsample, 63% of rural road contracts signed in October–December 2015 were amended between February and August 2016, 21 percentage points higher than the long-term series average, and the mean amendment added 78 calendar days to the contractual schedule.
Second, at the national level, the collapse of oil price revenues in 2015 eroded the central government’s fiscal space and triggered a mid-year expenditure cut in the GDP. While tertiary road projects were predominantly financed with municipal resources, an average of 30% of their budgets depended on co-financing transfers from the Sistema General de Regalías and Invías programs targeted at rural connectivity. Contractors, therefore, faced a liquidity squeeze that forced them to decelerate on-site activities or secure bridge financing at higher interest rates. Both responses had predictable consequences: slower field progress lengthened the critical path, and more expensive working capital raised effective unit costs. Because Colombian public work contracts use indexed escalation formulas only for materials and fuel (not for financial charges), the extra interest payments are typically absorbed as overhead, contributing to the cost deviations recorded in SECOP audit trails.
The third destabilizing element was the political uncertainty surrounding the 2 October 2016 plebiscite on the final peace accord between the Colombian government and the FARC insurgency. The unexpected outcome generated a four- to six-week legislative hiatus while negotiators revised the agreement and Congress awaited clarification on its fiscal implications. During this period, the National Planning Department and the Ministry of Finance issued circulars advising contracting authorities to refrain from launching new procurement processes until the revised accord’s budgetary footprint could be quantified. SECOP records show that the number of new bidding invitations in October and November 2016 decreased by 35% relative to the average of the same months in 2013–2015. Although our sample focused on contracts already underway, the administrative pause had indirect effects: supervising agencies diverted personnel to peace-related tasks, and contractors preparing claims for time extensions or compensation faced delayed responses. Moreover, resources initially earmarked for generic rural development programs were temporarily reprioritized toward Zonas Más Afectadas por el Conflicto (ZOMAC), creating further cash flow uncertainty for projects outside those geographies. Early drafts of the post-conflict implementation decrees also contemplated labor quota requirements for ex-combatants, forcing some contractors to revisit staffing plans and subcontracting chains.
4.3.2. Time Deviation Versus Categorical Variables
The bivariate analysis of time deviation and categorical variables is summarized in
Table 8, which presents the results of the Kruskal–Wallis test. In this case, the year 2016 stood out from the others due to higher values for time deviation as it coincided with the mayoral election year, similar to cost deviation. This supported the hypothesis that electoral turnover disrupts budget control through the renegotiation of priorities and supervisory teams. Contractor type was also a significant variable, with Consortium contractors differing from others, with higher values for time deviation. Complex governance arrangements, multi-layered decision chains, and heterogeneity in resource mobilization within consortia can prolong approval cycles for design changes and claim negotiations, thereby extending project schedules.
4.4. Analysis of Cost and Time Deviations and Project Characteristics
This study identified statistically significant relationships between the causes of time and cost deviations and the characteristics of rural road infrastructure projects in Colombia. The analysis included 229 completed projects, and the findings are summarized across several key dimensions. First, the exploratory analysis revealed that time deviations ranged from 0% to 510%, with an average deviation of 29%. In contrast, cost deviations were less pronounced, with a maximum deviation of 54% and an average of 8.6%. This average was within the limits established by Law 80 of 1993, which permits a maximum of 55% for cost additions in publicly funded projects.
Bivariate analysis revealed significant associations between cost and time deviations and variables such as initial contract value, project intensity, bidding value, year, additional cost and time, and initial and final contract values. Only variables such as initial duration and award growth were statistically significant for cost deviations. The analysis revealed that rural road infrastructure projects in Colombia are particularly susceptible to deviations, particularly in terms of cost overruns and delays. These findings highlight the need to improve planning practices and risk management strategies to mitigate the effects of such deviations. A summary of the statistically significant variables is presented in
Table 9. Statistical significance is represented by the symbol “✓”.
The findings of this study reveal that rural road infrastructure projects in Colombia are highly exposed to both time and cost overruns. This conclusion is based on a quantitative analysis of 229 completed projects, of which more than 70% experienced delays exceeding three months and approximately two-thirds surpassed their initial contract values by more than 15%. These figures not only indicate a statistically significant recurrence but also suggest the presence of structural patterns that specifically affect this type of intervention. The most frequently identified causes—such as scope changes, scheduling deficiencies, contractor financial issues, delayed payments, and adverse weather conditions—are particularly critical in rural environments, where local institutional capacity is often limited, technical oversight is more challenging, and the margin for managing unforeseen events is substantially reduced. Moreover, the geographic dispersion and accessibility constraints inherent to rural areas increase logistical costs and reduce operational efficiency, further amplifying the impact of any planning or execution discrepancies. Collectively, these factors create a scenario in which rural projects are not only more vulnerable to deviations but also face greater obstacles in correcting them in a timely manner. This highlights the need for tailored management approaches that are specific to the unique conditions of the Colombian rural context.
4.5. Multivariate Analysis of Cost and Time Deviations and Project Characteristics
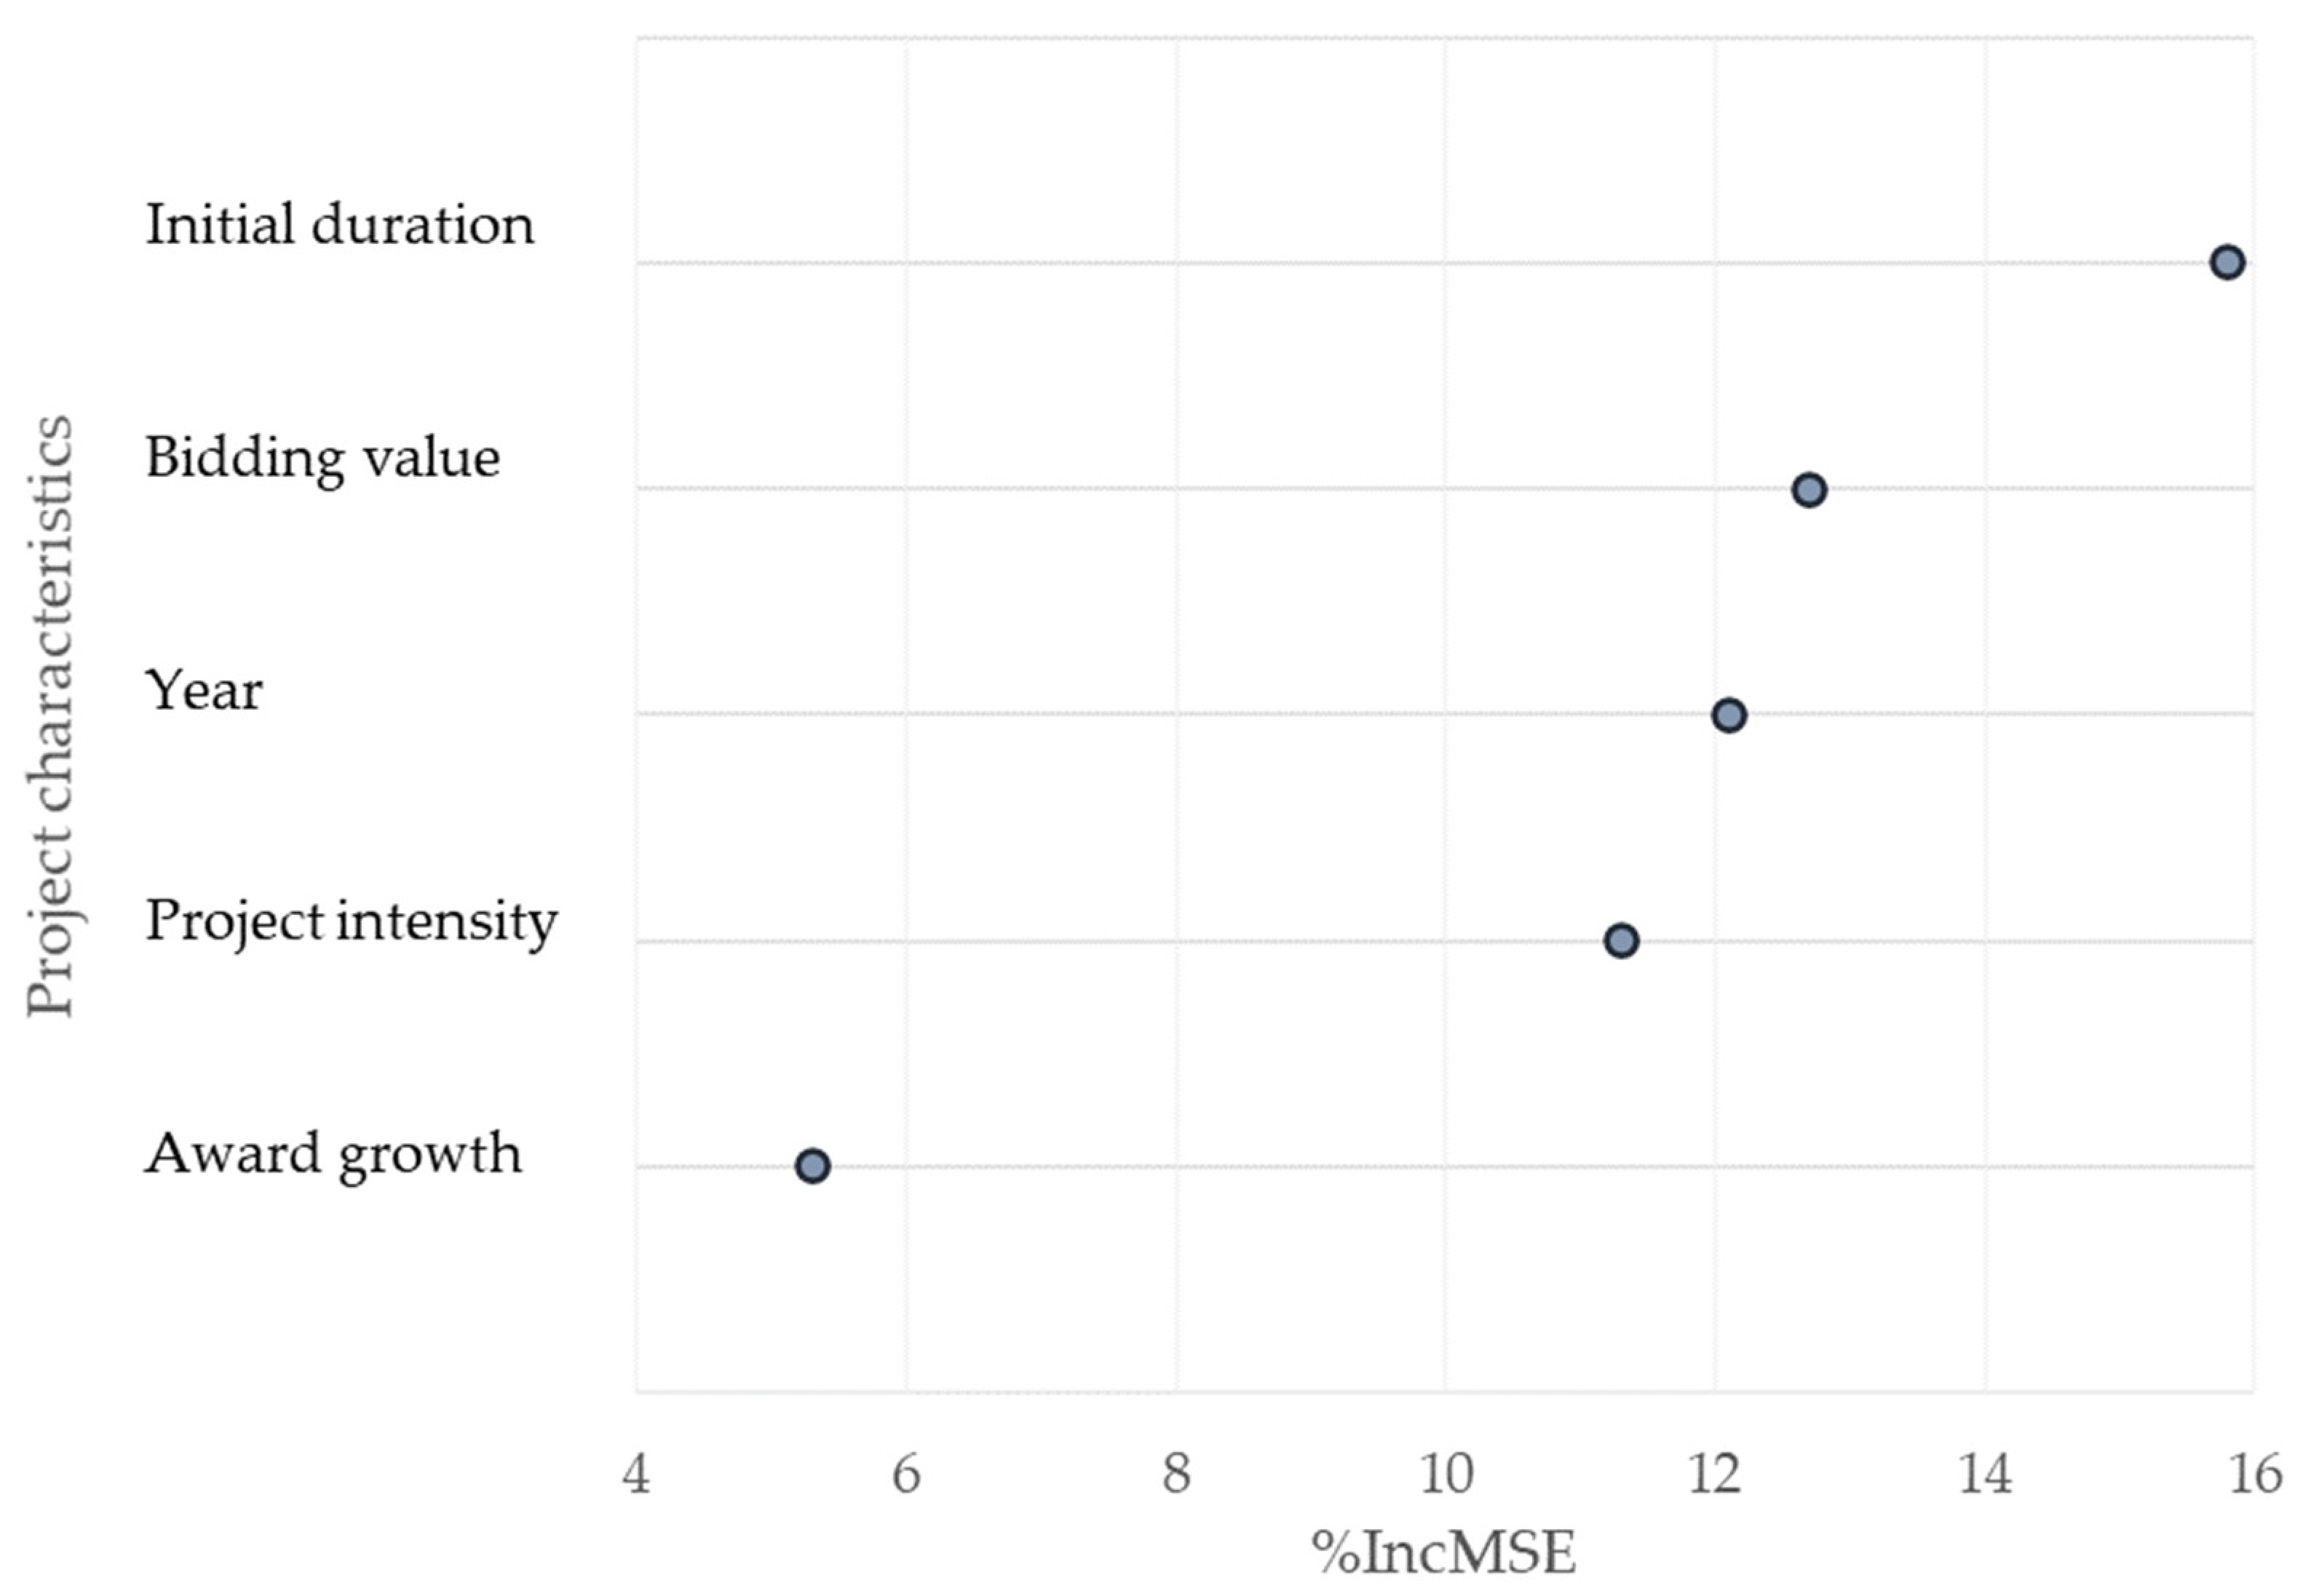
In the Random Forest model, the following independent variables were included: bidding value, initial duration, project intensity, award growth, year, promoter, project type, contractor type, and region. No numerical variables that might have been correlated with each other were included to avoid noise in the model. First, a comparison of the error reduction versus the number of trees determined an optimal number of trees; in this case, 92 trees were selected. After running the models, an optimal number of five predictors was obtained, based on the reduction in the out-of-bag error. Next, the most important predictors were ranked, considering the increment in Mean Squared Error (MSE) if the variable was eliminated (see
Figure 8). In this case, initial duration was followed by bidding value, year, project intensity, and award growth.
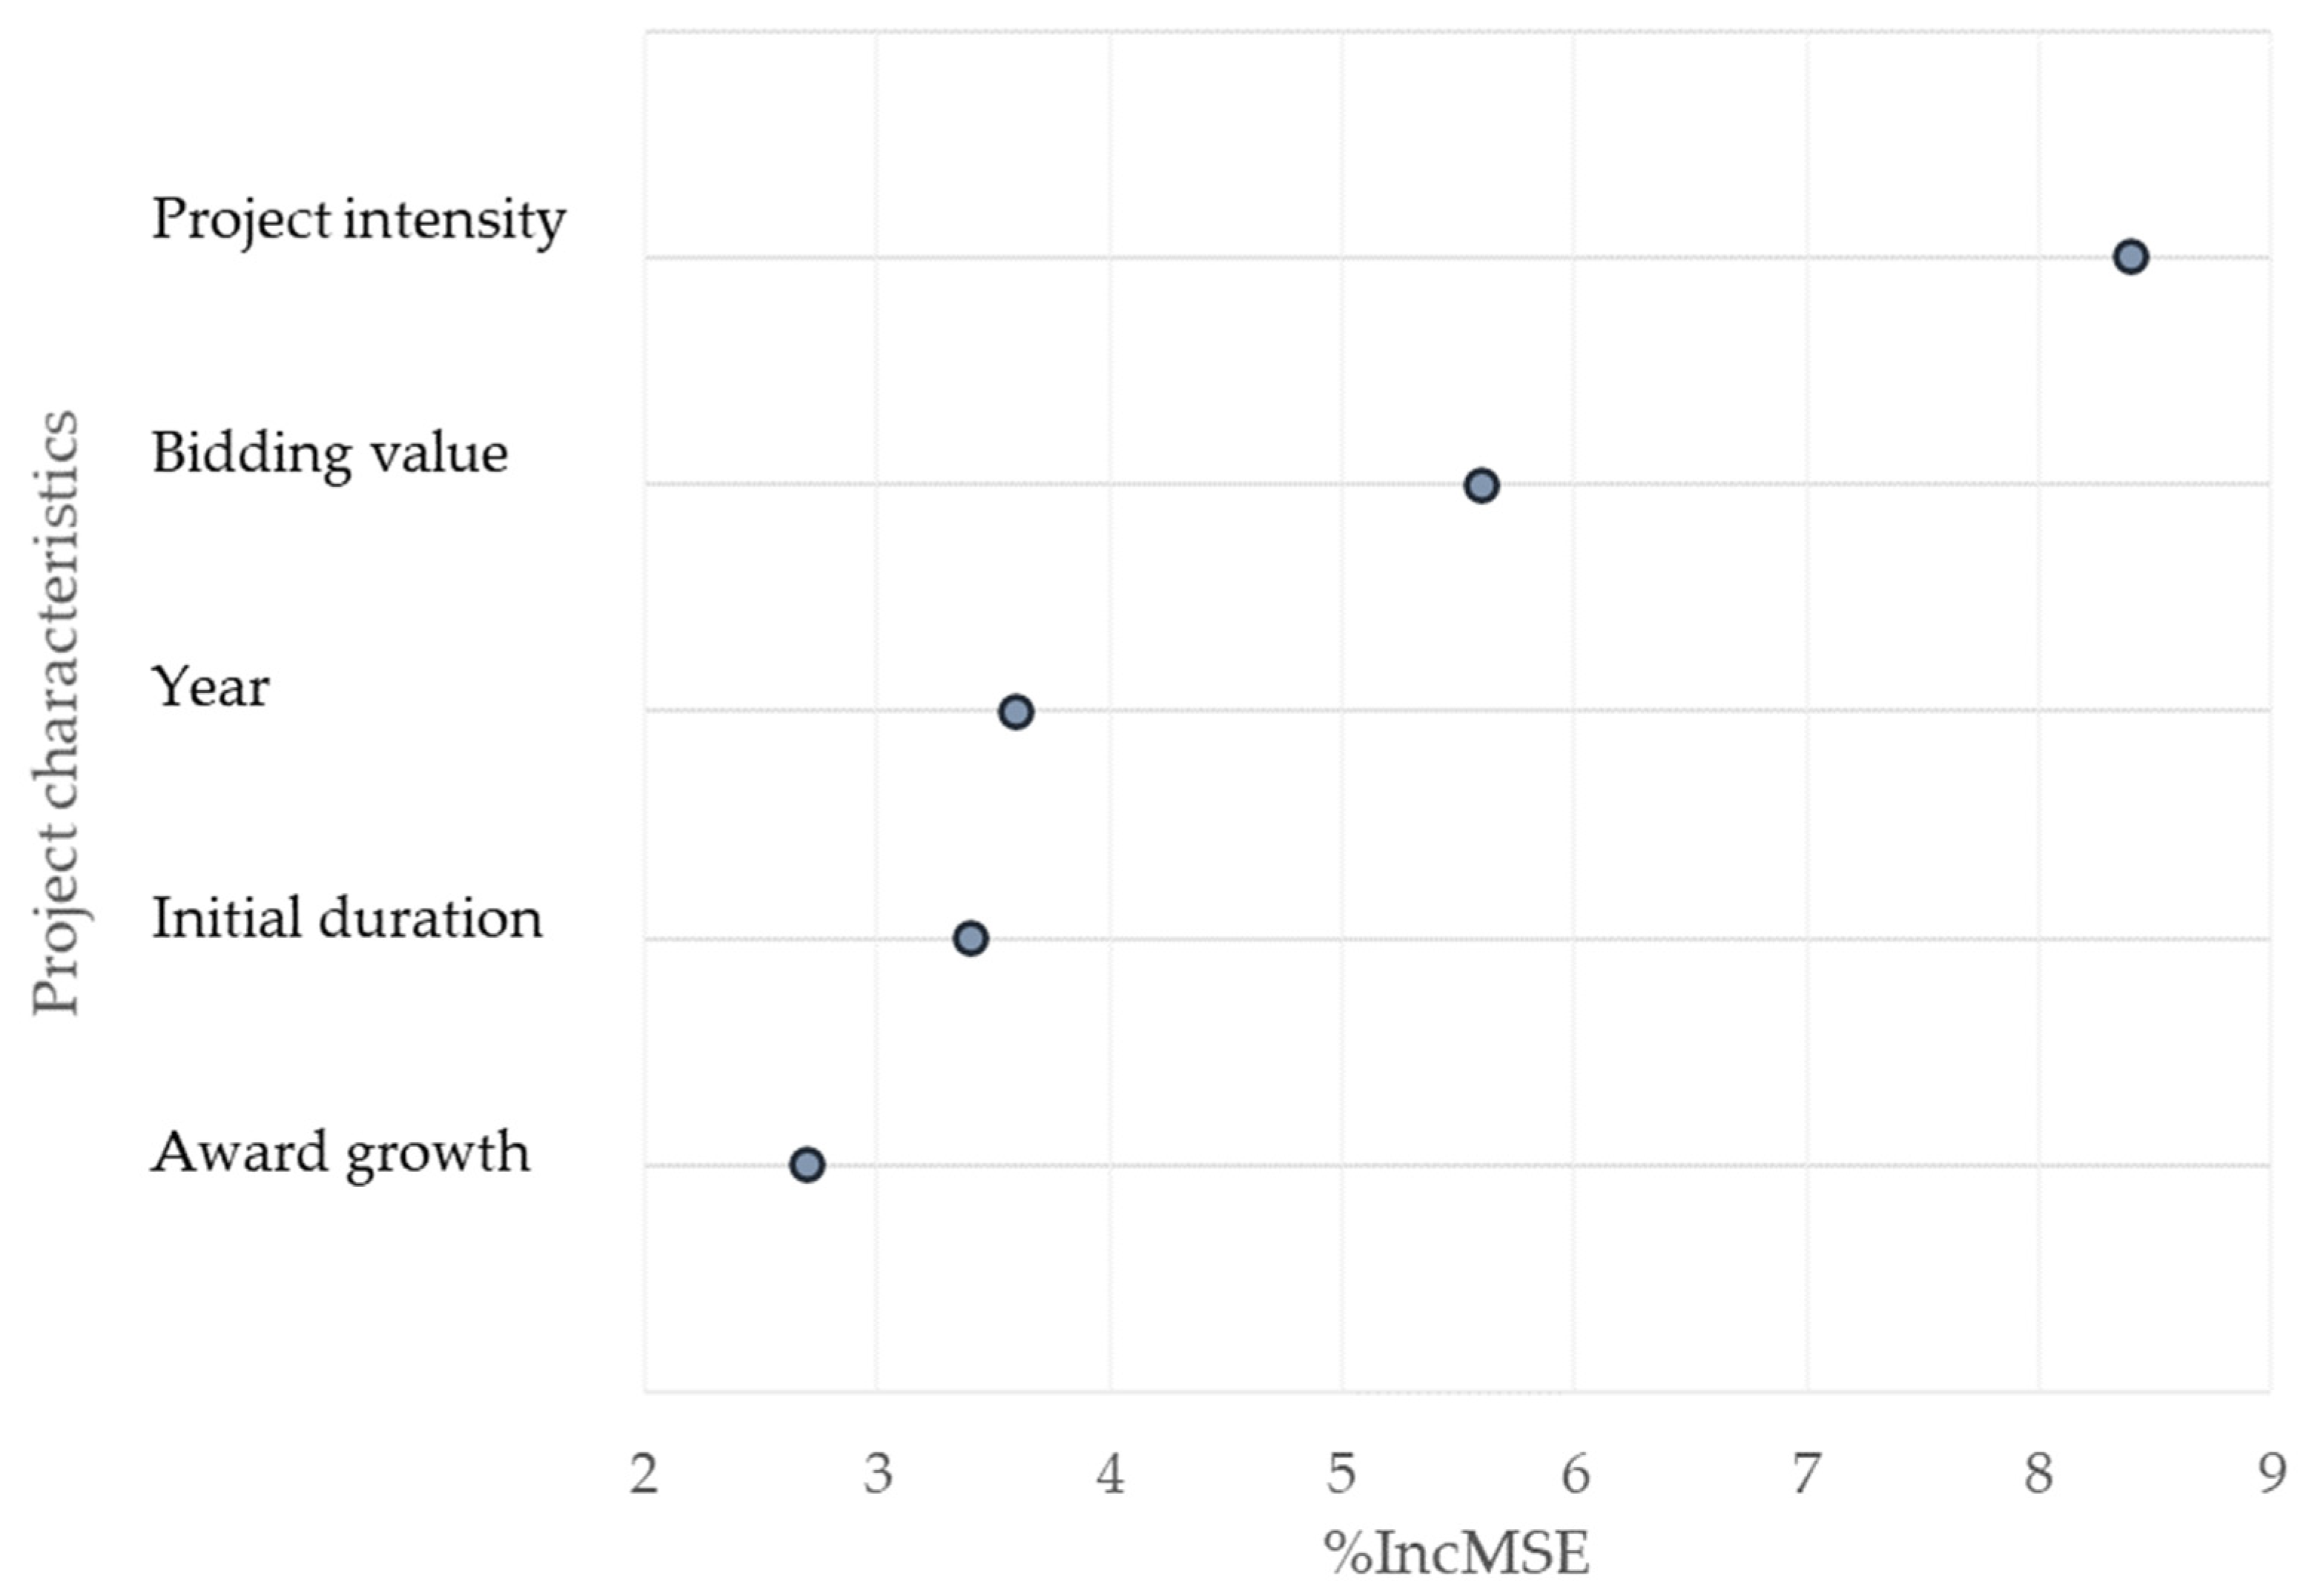
Next, the same steps were developed for time deviation and the most important predictors were ranked (see
Figure 9). In this case, project intensity was the primary factor, followed by bidding value, year, initial duration, and award growth.
The Random Forest model analysis identified several key variables that contributed to both cost and time deviations. These findings highlight the varying impact of different variables on project deviations. It can be observed that when combining numerical and categorical variables, the numerical variables were the most important and had the most relevance in time and cost deviations.
4.6. Analysis of the Identified Causes and Their Impact on Rural Road Projects
Table 10 illustrates the relationship between the causative factors identified in the international literature and the specific labels found in the contractual addenda and supporting documents of the 229 rural road projects analyzed in this study. A notable observation was the overwhelming prevalence of scope-related drivers, which accounted for 88 entries, or 59% of the total. This trend aligned with global evidence suggesting that poorly defined work packages, design omissions, and overly optimistic front-end planning are the most significant predictors of time and cost overruns in linear infrastructure [
75,
76]. The high frequency of scope adjustments for Colombian rural roads is not surprising, considering that rights-of-way often pass through geotechnically unstable areas and socially diverse communities. These conditions encourage post-award design optimization. However, the extent of the issue highlighted here reveals an institutional paradox: although the national contracting statute limits additive works to 50% of the original contract amount, project owners frequently implement small modifications that cumulatively approach, though rarely exceed, this statutory threshold.
Table 11 presents the causes analyzed based on the causes identified in the literature. Weather-induced aspects were the second most frequent category, accounting for 25 occurrences, or 17% of the total. This was lower than the frequency of scope changes, but it remained important in operational terms. Unlike megaprojects that typically have detailed hydro-meteorological baselines, contracts for tertiary roads rarely include adequate climate risk allowances. As a result, contractors are left vulnerable to El Niño and La Niña phenomena, which can intensify both the amount and duration of rainfall in Andean watersheds. These findings align with recent studies in Colombia [
5,
31] that identified weather conditions as a common reason for contract deviations. Changes in the original designs were noted nine times, while social conflicts were mentioned eight times, placing them in the third and fourth positions, respectively. Design adjustments typically indicated technical oversights, whereas social conflicts highlighted the changing governance landscape in post-Agreement rural Colombia. In this context, community expectations regarding labor quotas, environmental protections, and benefit-sharing have increased. Although less frequent, with six or fewer occurrences each, the remaining categories (planning deficiencies, input price volatility, difficult site access, labor scarcity, and financial mismanagement) should not be overlooked. Their combined impact can still undermine performance margins beyond acceptable limits, particularly when they coincide with more common factors.


