Technical Note

Railway Infrastructure Upgrade for Freight Transport: Case Study of the Røros Line, Norway

by
Are Solheim
1,
Gustav Carlsen Gjestad
1,
Christoffer Østmoen
1,
Ørjan Lydersen
2,
Stefan Andreas Edin Nilsen
2,
Diego Maria Barbieri
1,* and
Baowen Lou
3,4
1
Department of Built Environment, Oslo Metropolitan University, Pilestredet 35, 0166 Oslo, Norway
2
RAMBØLL Norway AS, Harbitzalléen 5, 0275 Oslo, Norway
3
Department of Civil and Environmental Engineering, Norwegian University of Science and Technology, Høgskoleringen 7A, 7491 Trondheim, Norway
4
Department of Engineering Technology and Didactics, Technical University of Denmark, Lautrupvang 15, 2750 Ballerup, Denmark
*
Author to whom correspondence should be addressed.
Infrastructures 2025, 10(7), 180; https://doi.org/10.3390/infrastructures10070180
Submission received: 2 June 2025 / Revised: 2 July 2025 / Accepted: 8 July 2025 / Published: 10 July 2025

Abstract

Compared to road trucks, the use of trains to move goods along railway lines is a more sustainable freight transport system. In Norway, where several main lines are single tracks, the insufficient length of many of the existing passing loops considerably restricts the operational and economic benefits of long trains. This brief technical note revolves around the possible upgrade of the Røros line connecting Oslo and Trondheim to accommodate 650 m-long freight trains as an alternative to the heavily trafficked Dovre line. Pivoting on regulatory standards, this exploratory work identifies the minimum set of infrastructure modifications required to achieve the necessary increase in capacity by extending the existing passing loops and creating a branch line. The results indicate that 8 freight train routes can be efficiently implemented, in addition to the 12 existing passenger train routes. This brief technical note employs building information modeling software Trimble Novapoint edition 2024 to position the existing railway infrastructure on topographic data and visualize the suggested upgrade. Notwithstanding the limitations of this exploratory work, dwelling on capacity calculation and the design of infrastructure upgrades, the results demonstrate that modest and well-placed interventions can significantly enhance the strategic value of a single-track rail corridor. This brief technical note sheds light on the main areas to be addressed by future studies to achieve a comprehensive evaluation of the infrastructure upgrade, also covering technical construction and economic aspects.

1. Introduction

The adoption of trains to move goods along a railway line is known as railway freight transport. In this regard, the logistics chain typically comprises one or more locomotives that haul a group of freight wagons containing commodities in various forms (e.g., bulk, containers, specialized wagons) [1,2]. Generally speaking, railway transport is more environmentally friendly than other modes, such as road transport [3,4,5]. For instance, in the last decade it was estimated that the transport sector accounted for approximately 23% of the carbon dioxide emissions globally, with railways contributing only 3% of that amount [6]. As the increasing population worldwide is tackling the effects caused by human activities [7,8], many countries have incentivized the switch of freight from trucks to trains by leveraging governmental policies, among others [9,10].
In Norway, the transport sector is responsible for approximately 30% of all the generated carbon dioxide emissions. In this regard, railway transport stands out, as it only produces 0.1%, thus representing a strategic area when it comes to the sustainability goals of the national transit systems [11]. Furthermore, Bane NOR, the government agency that owns, maintains, and operates the national network [12], has calculated that one freight train replaces on average 30 semitrailer trucks and that moving goods along non-electrified railway lines still produces less CO2 emissions than using road trucks [13]. Nevertheless, Norwegian railway freight transport suffers from limited capacity and outdated infrastructure and, as a matter of fact, it has represented approximately only 5% of the total freight transport nationally since 2010 [14].
The Norwegian railway system has approximately 350 stations, extends 4200 km, and implements standard gauges (i.e., 1435 mm). Almost 65% of the lines are electrified, and 93% of the network is single-track [15]. The mountainous topography of the country requires the use of many infrastructural assets (e.g., 2800 bridges, 700 tunnels) and thus poses a major challenge when it comes to maximum train speed, which is currently limited to 100 km/h for approximately 70% of the network. The main operating company is VY, and its subsidiary CargoNet is the primary freight operator [16,17].
In central Norway, the city of Trondheim and the capital Oslo are connected by two railway lines, namely, the Dovre line and the Røros line [18,19]. Traditionally, the former has been widely employed for both passenger and freight, whereas the latter is rarely trafficked by trains carrying goods. Considering the more complicated topography of the Dovre line and its associated higher operational costs, this brief technical note focuses on the possible upgrade and construction of key elements (i.e., passing loops, branch lines) along the Røros line to increase its capacity for freight transport. This work is a preliminary effort, which, notwithstanding its limited scope related to capacity calculation as well as the design of passing loops and branch lines without dealing with technical construction and economic aspects, can still portray useful information regarding the upgrade of the Røros line as a matter of national priority.

2. Methodology

2.1. Railway Track Design, Capacity, and Digital Tools

A typical railway track is composed of two discrete subsystems. On the top there is the superstructure (i.e., rails, sleepers, fastenings, ballast, sub-ballast) to bear and distribute the train loads. At the bottom lies the subgrade, namely, the natural soil that supports the superstructure and in general is not maintained [20,21,22]. The construction and maintenance procedures must satisfy geometrical, mechanical, as well as physical criteria to ensure a long-lasting transport system [23,24]. In Norway, such requirements are primarily set by the “Technical regulations” developed by Bane NOR [25]. Among the others, these rules cover the aspects of track geometry, safety, electrification, and signaling systems.
A passing loop is a double-ended sidetrack that is commonly placed at or near a station on a single track where trains moving in opposite directions can pass each other. As shown in Figure 1, this element is connected to the main line at both ends with turnouts, namely, a mechanical installation that gives a train the ability to change course from one track to another [25,26]. A passing loop should be long enough to accommodate the longest train used on the railway line and, therefore, represents a critical factor in determining the route capacity. Furthermore, safety device (i.e., trap points, catch points) are usually installed to prevent unauthorized vehicles moving along the main track or sidetrack to reduce potential hazards. Such safety mechanisms typically lead the cars into a safety stop siding. Furthermore, to ensure efficient and safe operation, the distance between the track centers, i.e., track spacing, must respect the limitations based on the curve radius R reported in Table 1 [25].
In railway engineering, the headway is the space interval (i.e., headway distance) between the front ends of two consecutive trains moving along the same track in the same direction. Broadly speaking, a shorter headway, which means closer spacing between trains, requires more economic investments in the transport infrastructure. The headway can also be measured as the “tip-to-tip” time th (i.e., headway time). The railway track capacity C is the maximum amount of trains that can travel along a route per unit of time and is generally expressed as the number of trains per hour (tph)
C ( t p h ) = k · 1   h o u r t h ( h o u r )
where k is a coefficient accounting for delays and capacity use [28]. In this regard, it is worth mentioning that software programs are available for improving the management of timetables and train paths, namely, the Timetable Planning System (TPS) [29], and for adjusting train schedules to recover from disruptions, namely, Train Timetable Rescheduling (TTR) [30]. Furthermore, such tools are central for the development of railway capacity planning at the European scale [31].
Building information modeling (BIM) is a digital syntactic portrayal of constructed or to-be-constructed facilities [32]. After its inception, the BIM concept was mainly implemented for “vertical” structures (e.g., buildings) [33] and, subsequently, for “horizontal” structures (e.g., roadways, railways) [34,35]. Pivoting on many different commercial software programs, the BIM approach is widely employed in the Norwegian scenario, comprising a broad range of stakeholders spanning from public and private agencies [36,37] to educational organizations [38,39]. In this regard, the software house Trimble offers many digital solutions that enable BIM representations of the built environment. This brief technical note leveraged the software Trimble Novapoint, which is commonly used in relation to roadway and railway systems in the Nordic countries [40], for the design and visualization of the rail infrastructure along the Røros line. It is worthwhile to mention that other software tools developed by different software houses (e.g., Autodesk, Bentley Systems, Nemetschek Group) could have been employed as well. Nevertheless, considering the historical development of Novapoint, which was conceived in Norway [41], a very large majority of the consulting companies and public agencies operating in the country seamlessly use this specific BIM tool. Therefore, digital representations of Norwegian infrastructure are often only available in Trimble systems.

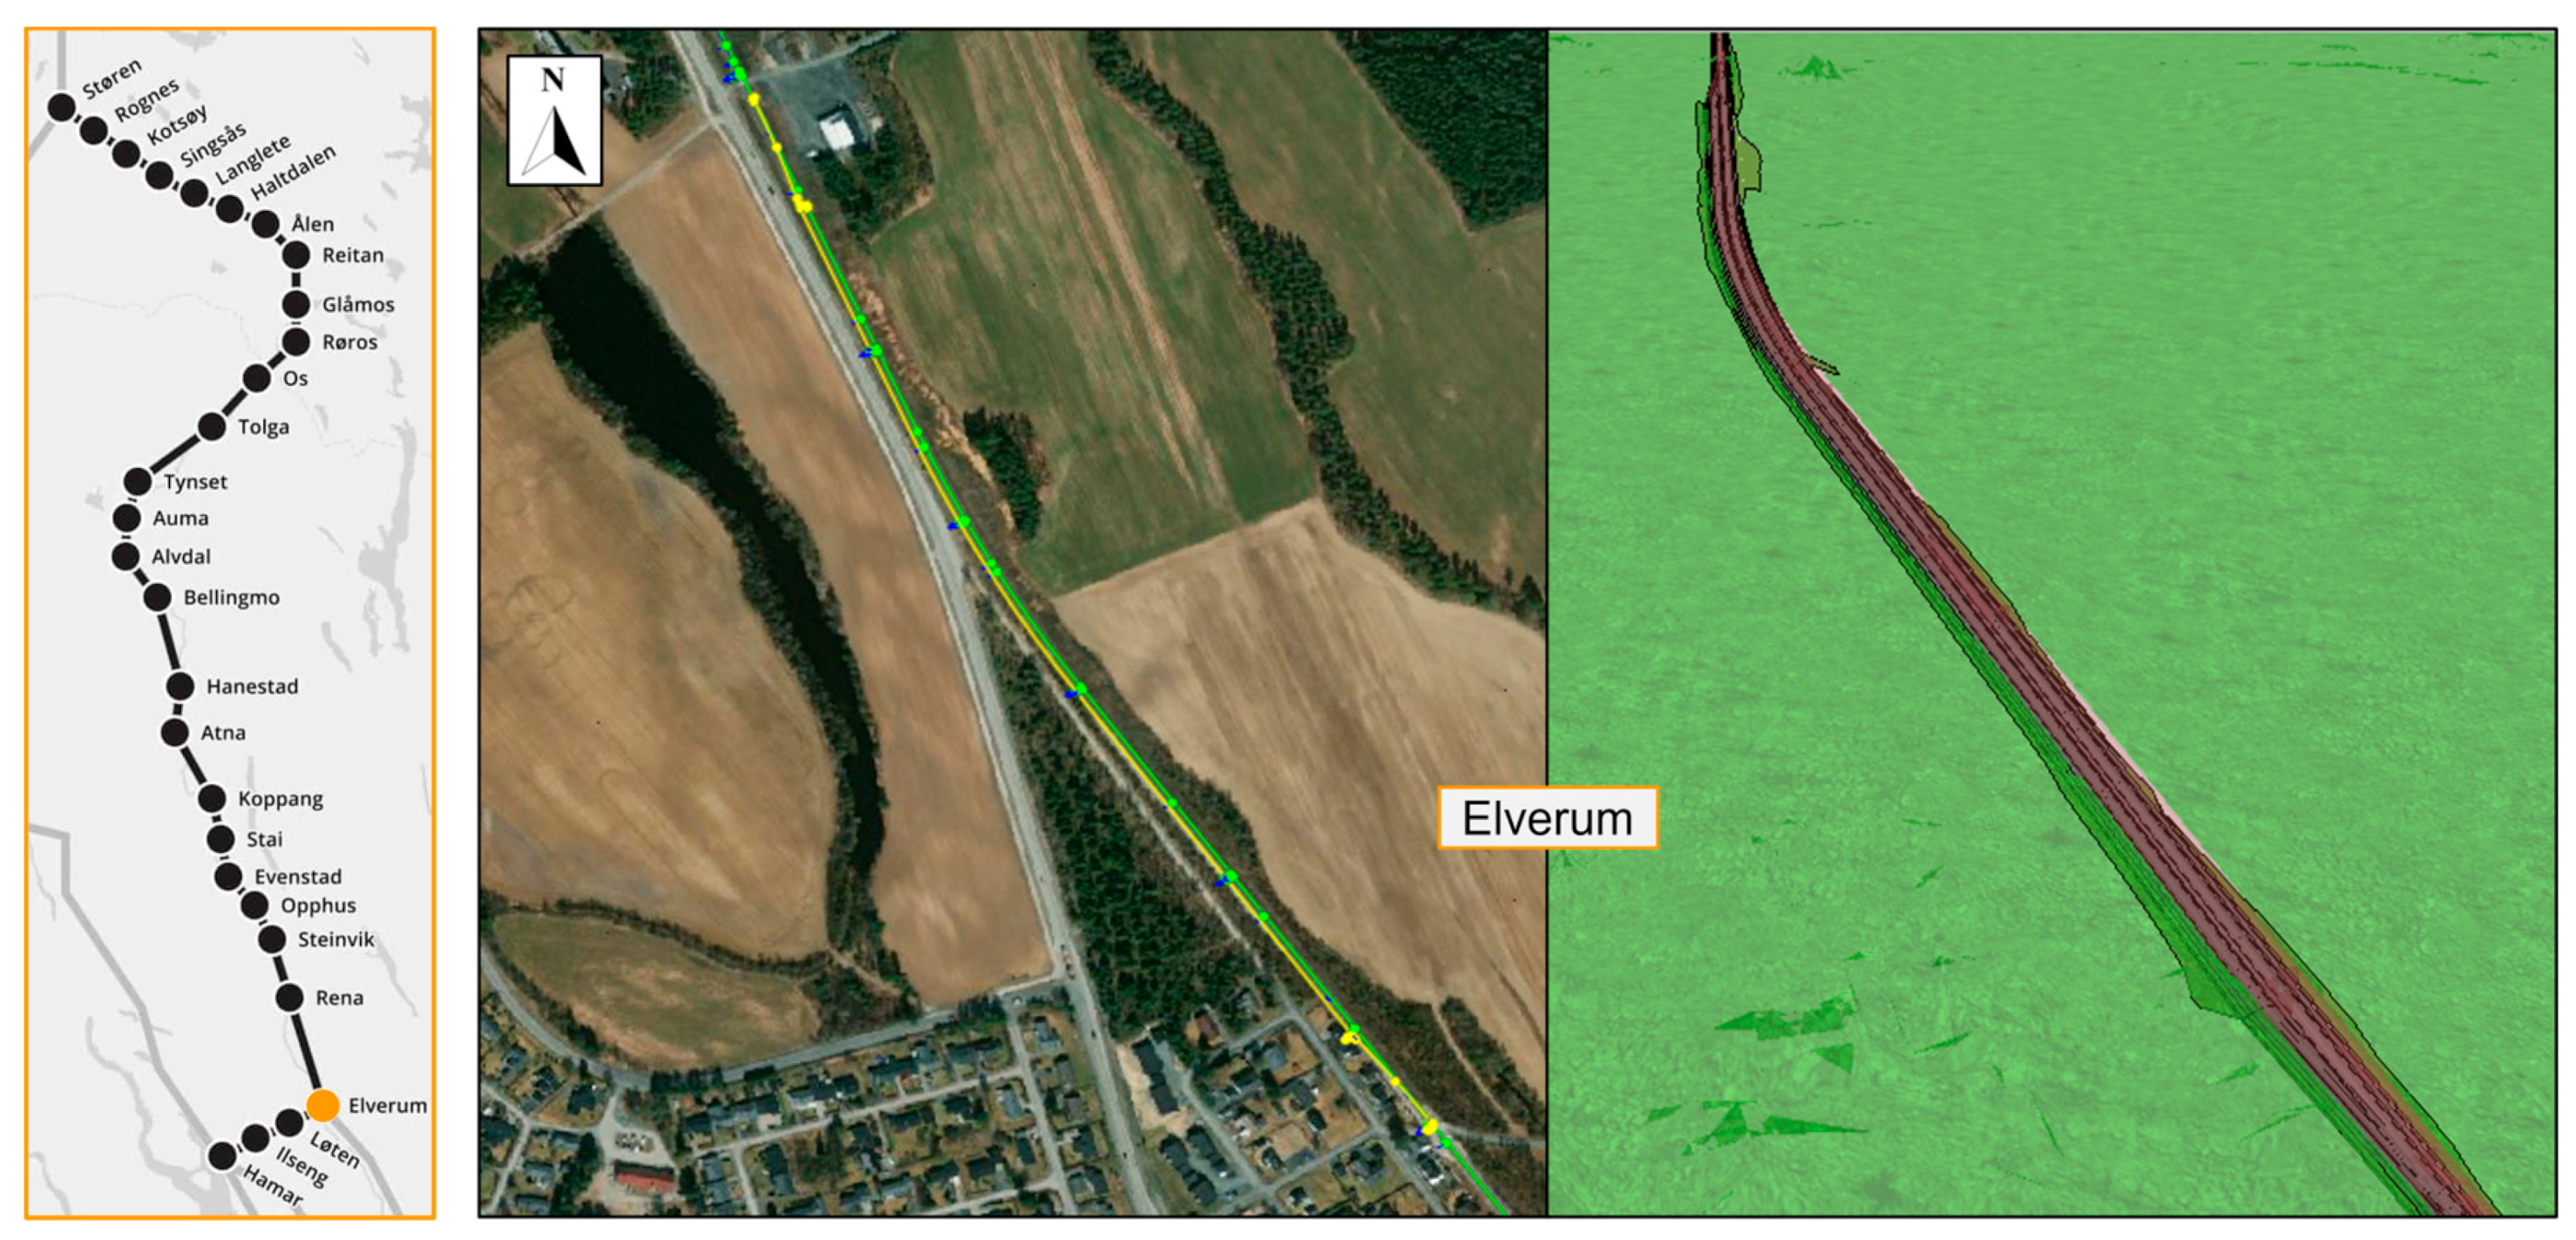
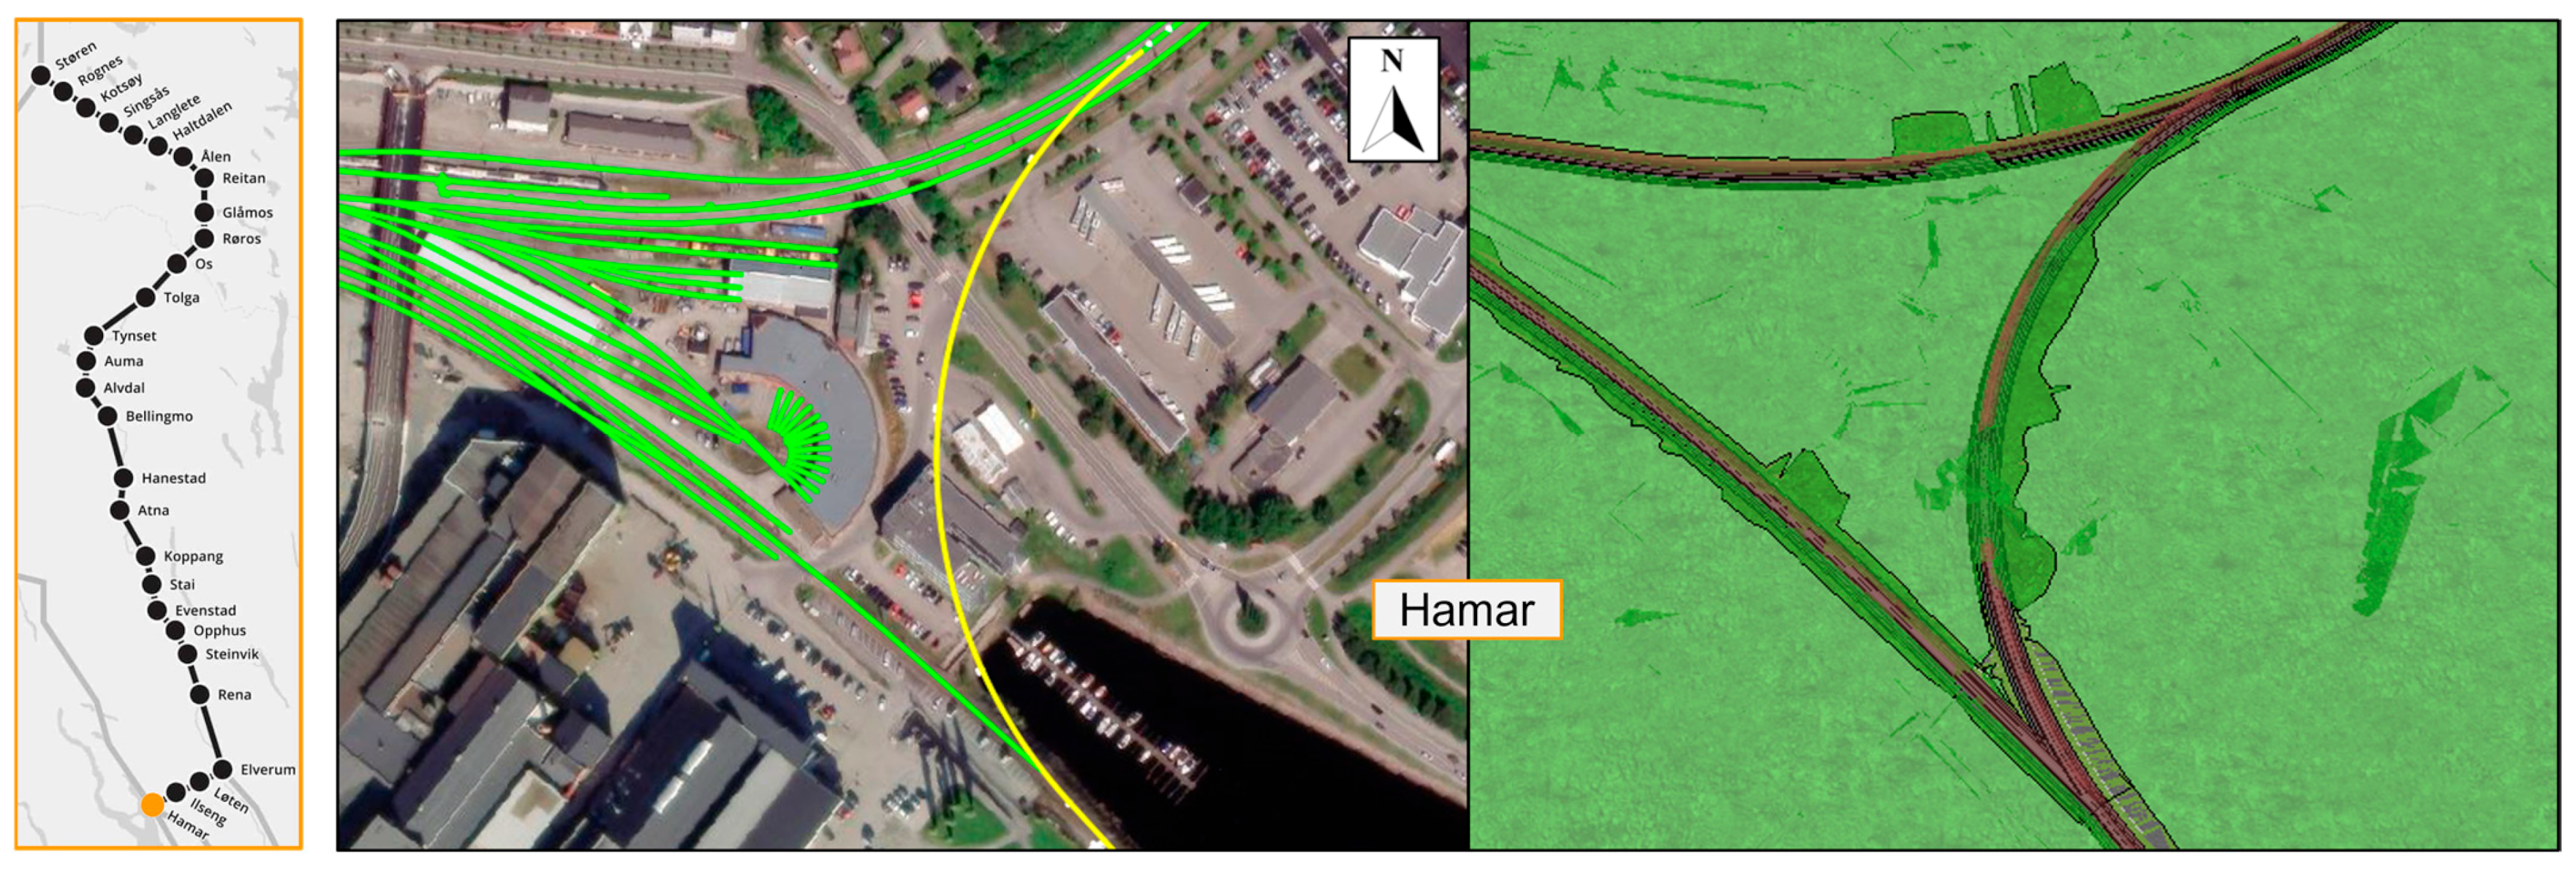
2.2. Case Study: The Røros Line

Focusing on railway freight transport in central Norway between the city of Trondheim and the capital Oslo, this work dealt with the possible upgrade of the Røros line (“Rørosbanen” in Norwegian, opening year 1877) as an alternative to the current one serving for goods haulage, namely, the Dovre line (“Dovrebanen” in Norwegian, opening year 1921). As depicted in Figure 2, the non-electrified Røros line is 382 km long and runs from Hamar through the Østerdalen valley along the rover Glomma and over Røros to Støren [18]. The length of the electrified Dovre line is 485 km, which connects Eidsvoll to Trondheim [19]. Currently, the Røros line is mostly used for passenger traffic (average speed 80 km/h) and serves as a bypass route when there is a stop on the Dovre line such as in the case of extreme weather events. In this regard, major economic losses were registered in 2024 due to the record-breaking rainfall “Hans” [42] or in early 2025 as a result of excessive ice formation and the subsequent high water levels affecting the safety of the railway bridges [43]. In both cases, the Røros line did not have enough capacity to accommodate all the redirected freight traffic, which was consequently also moved by trucks.
As shown in Table 2 and Table 3, the alignment geometry of the Dovre line (maximum altitude 1024 m above sea level) is more demanding compared to that of the Røros line (maximum altitude 670 m above sea level). Table 4 reports the length of the earthworks and infrastructure along the routes. The percentages of embankment sections and bridges are approximately the same, whereas the Dovre line is characterized by a larger number of cutting sections and tunnels compared to the Røros line. In particular, the former line has 42 tunnels, whereas the latter one has only 6 [44]. Therefore, it is natural to expect that the Røros line, which is characterized by a lower maximum peak to climb, larger curve radii, lower slope gradients, and fewer built infrastructure, has great potential to bolster the freight traffic between Trondheim and Oslo.
Norway participates in the Trans-European Network for Transports (TEN-T) to improve internal European trade, for instance, by gradually implementing European Rail Traffic Management System (ERTMS) signaling, with standardized loading gauge and a minimum train length of 740 m [46]. This work focused on the operation of freight trains with a length of 650 m as defined by national strategic plans [47], thus bringing the Norwegian railway infrastructure closer to the recommended European goal.

3. Results and Discussion
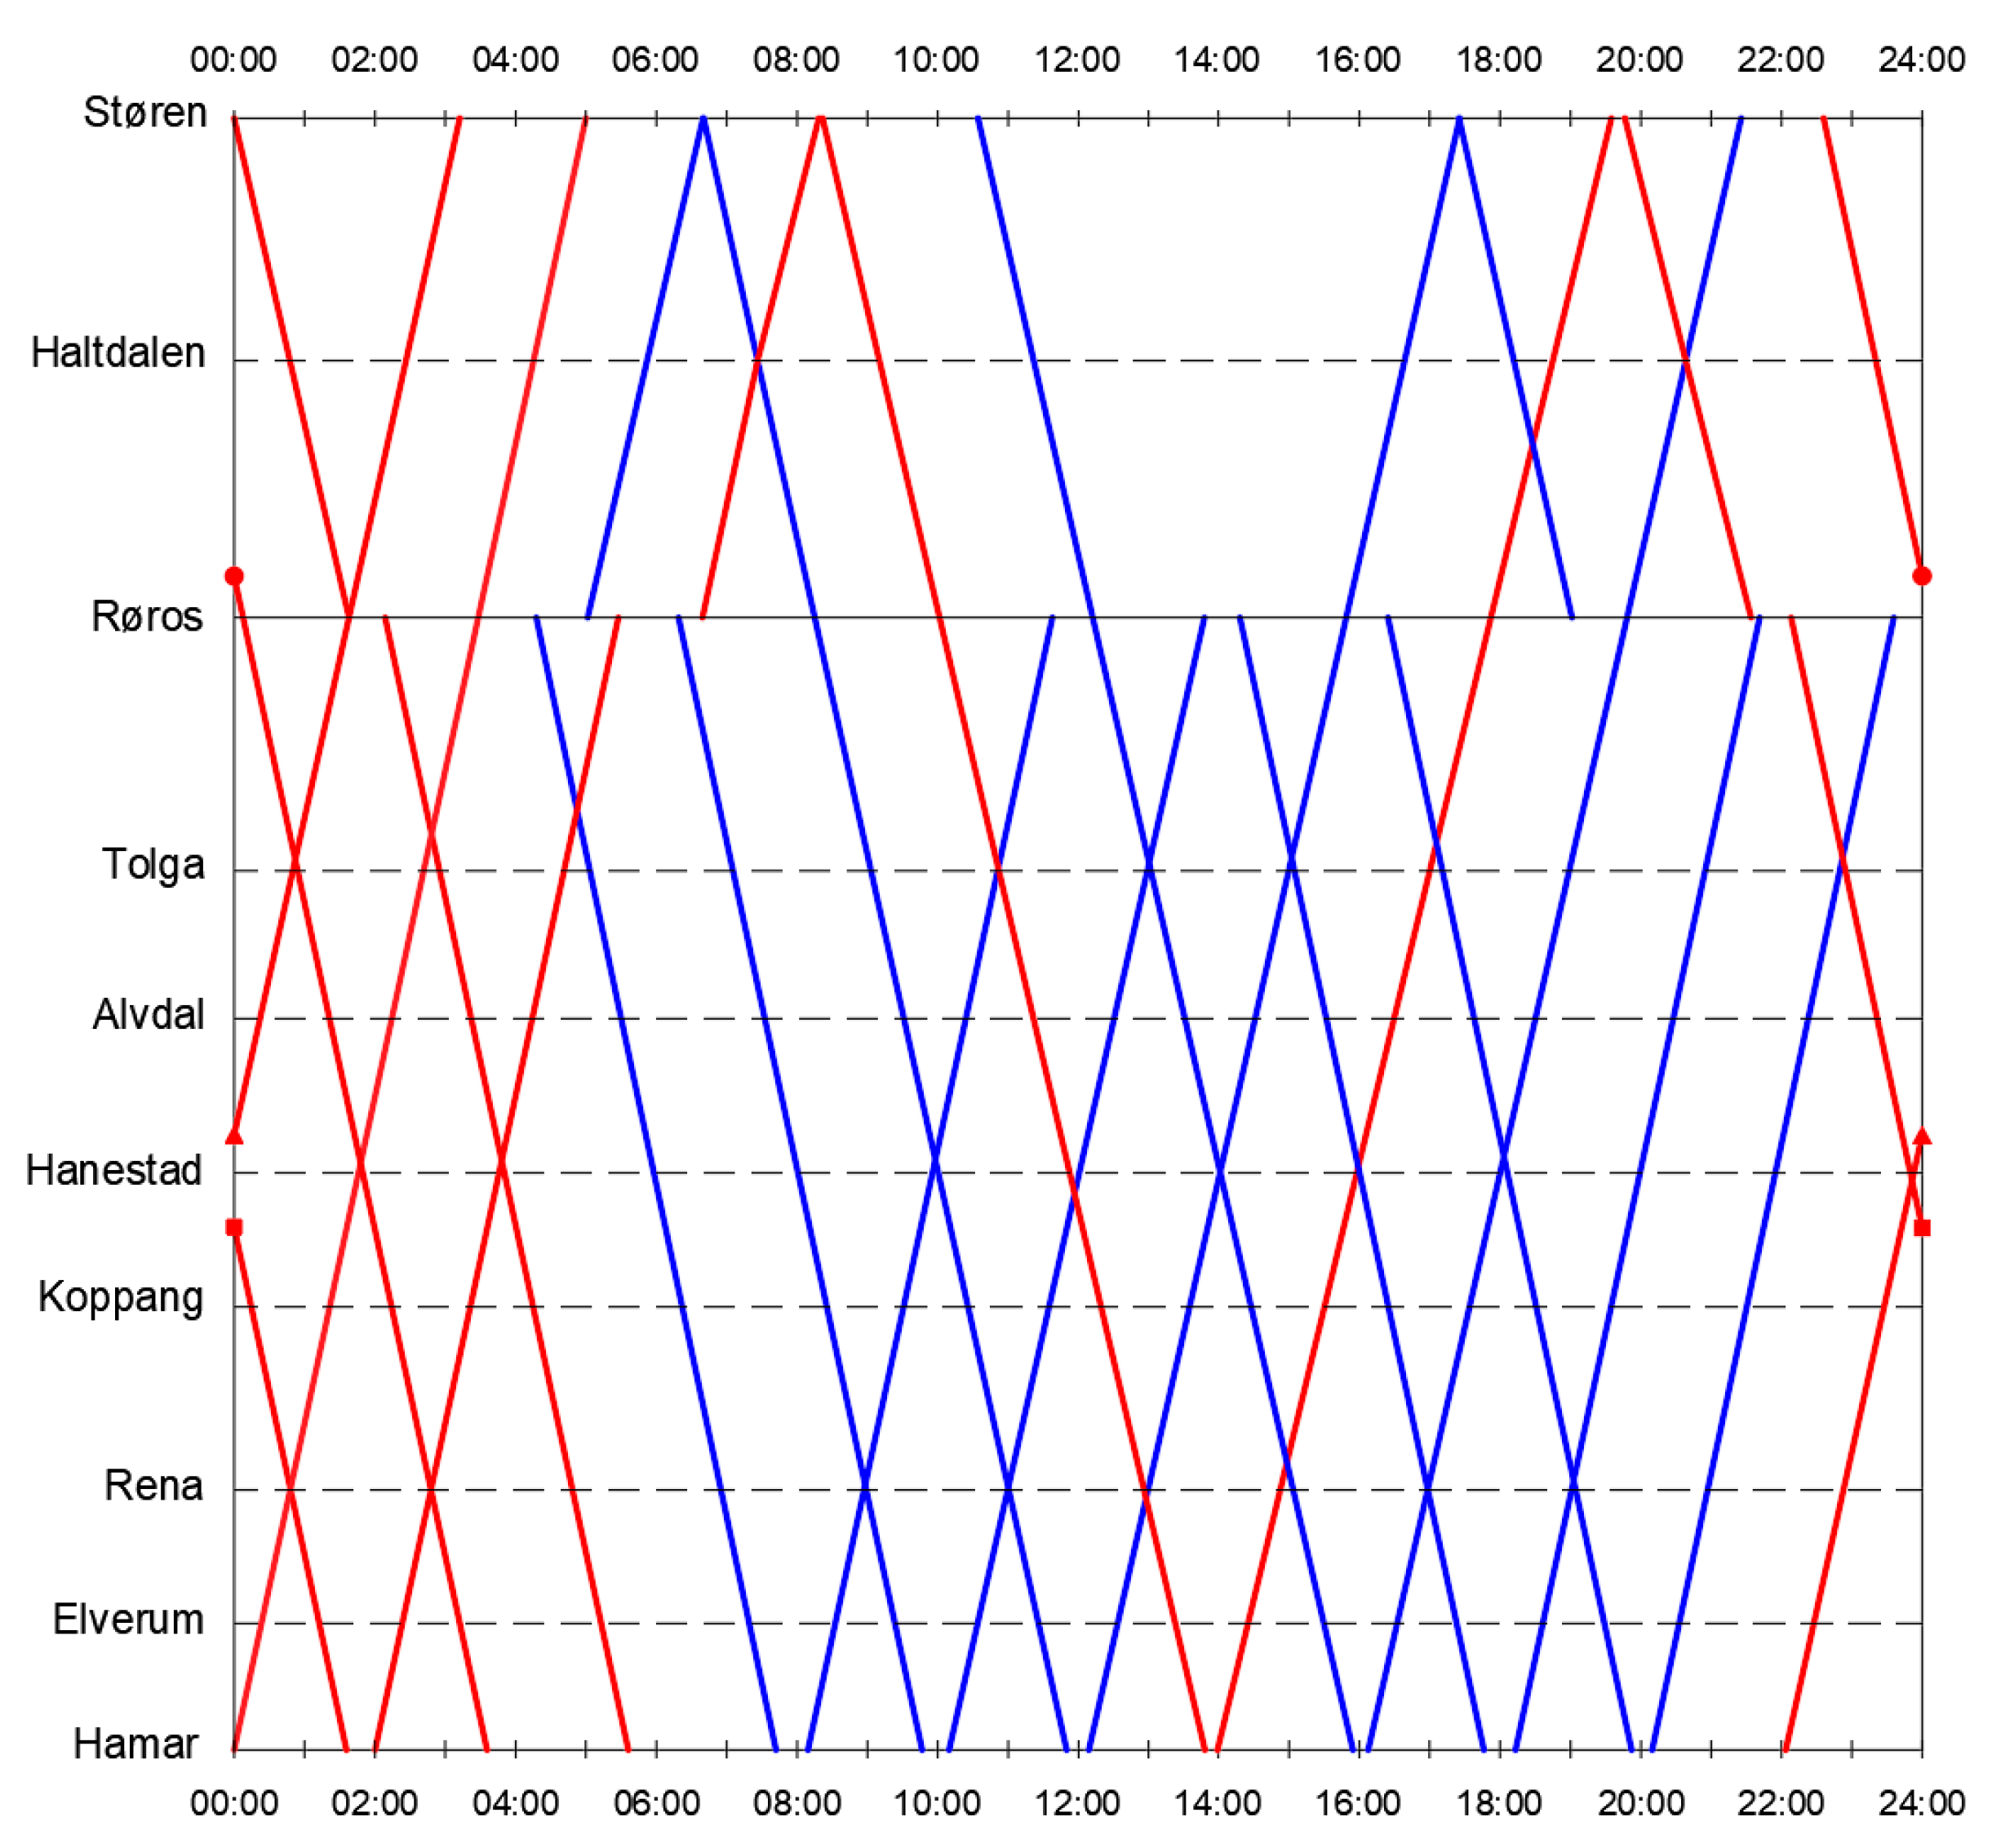
3.1. Track Capacity

In light of the preliminary nature of this work, the following simplifications were adopted when it came to track capacity: (i) freight and passenger trains had the same average speed (i.e., homogenous timetable) and (ii) the dwelling time at stations was not taken into account. The current timetable for passenger trains along the Røros line during weekdays is shown in Figure 3 using blue lines, where it is possible to identify two routes, namely, one between Hamar and Røros (12 trains daily) and another one between Røros and Støren (6 trains daily). Considering the busiest stretch between Hamar and Røros, 8 freight trains can be added (at night and 2 during the daytime), as indicated by the red lines in Figure 3. In this scenario, the 20 daily trains are characterized by one departure approximately every two hours at Hamar station and the minimum headway time between two trains traveling in opposite directions is 48 min (0.8 h). Assuming k = 0.60 in Equation (1), the track capacity was calculated as C = 0.75 tph. This preliminary plan does not substantially increase the complexity of the train operation scheduling or affect the punctuality of the transport system.
Currently, there are 17 passing loops along the Røros line [48]. To accommodate a 650 m-long train considering safety margins, a passing loop designed for simultaneous entry with a maximum speed of 40 km/h must have a minimum length of 800 m [49]. Røros is the only station that meets this requirement thanks to its double-ended sidetrack extending 840 m. Considering that the minimum headway time is 48 min, this work suggests upgrading the passing loops at the following stations, which are located approximately equally far apart [50,51,52]: Elverum, Rena, Koppang, Hanestad, Alvdal, Tolga, and Haltdalen. These locations are highlighted with dashed lines in Figure 3. The longest travel time between two consecutive stations (i.e., Rena and Koppang) thus becomes 42 min, and this value is below the minimum headway time.
Taking these considerations as the point of departure and leveraging BIM software Novapoint, Section 3.2 deals with the upgrade design of the passing loops and Section 3.3 presents the development of a new branch line close to Hamar station.

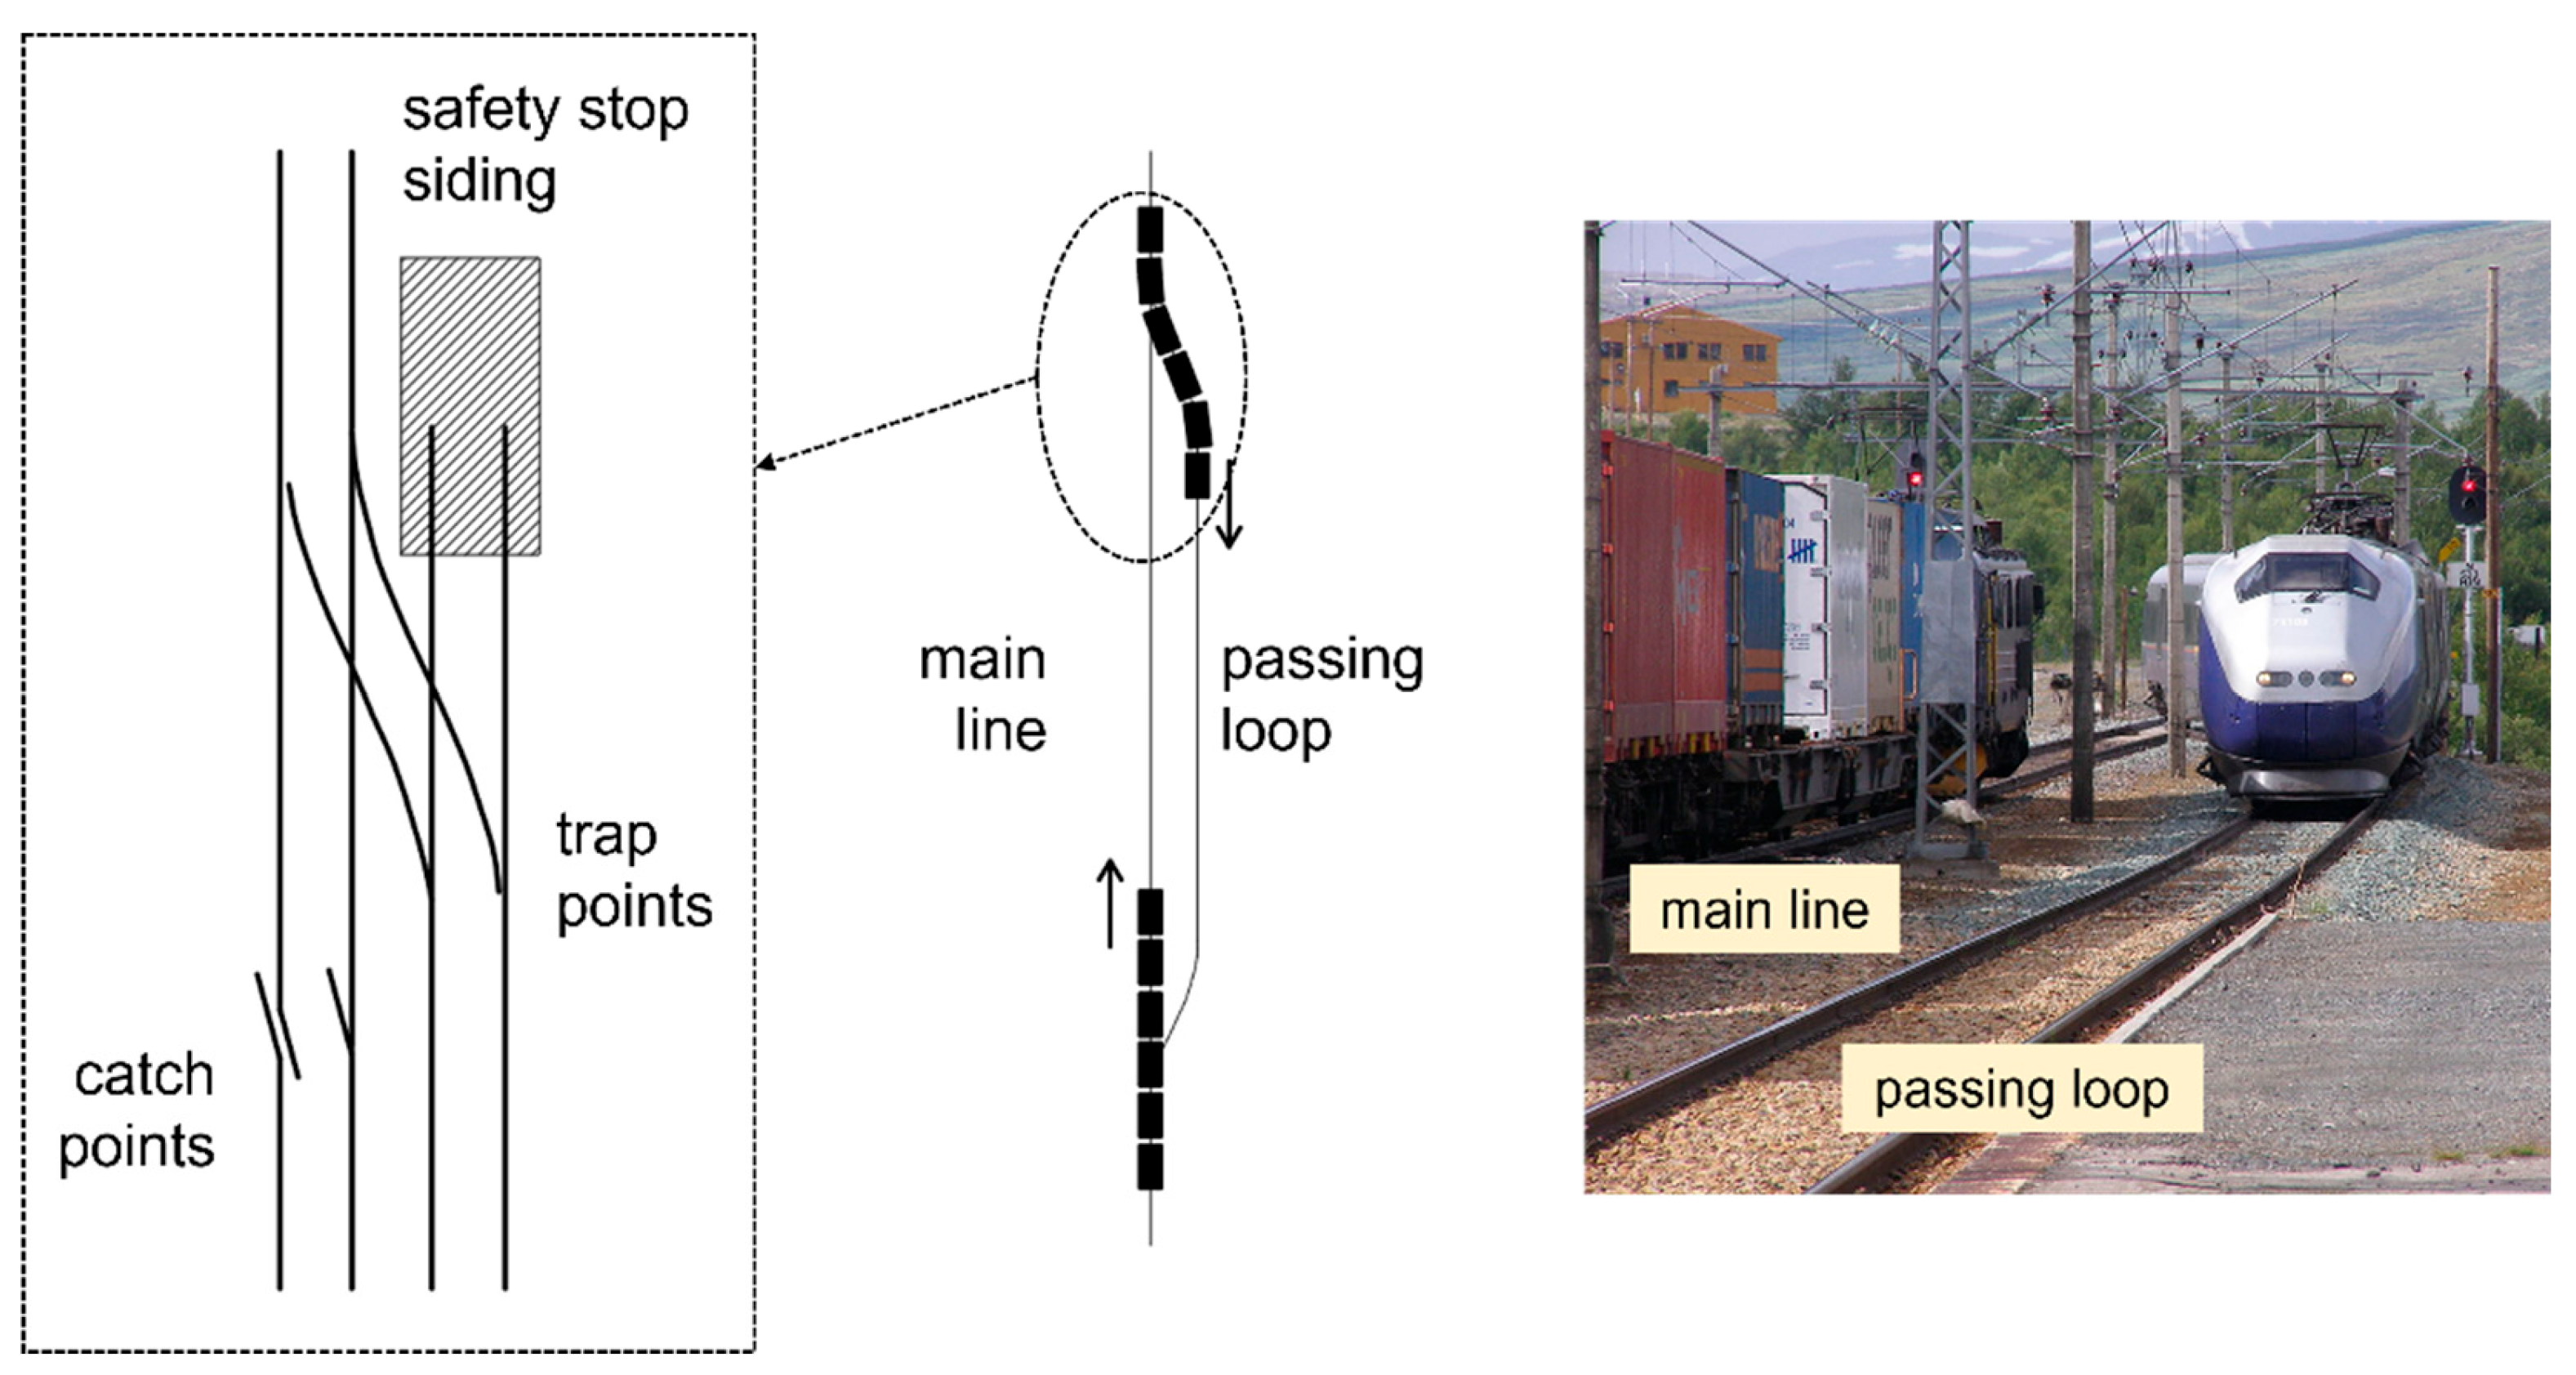
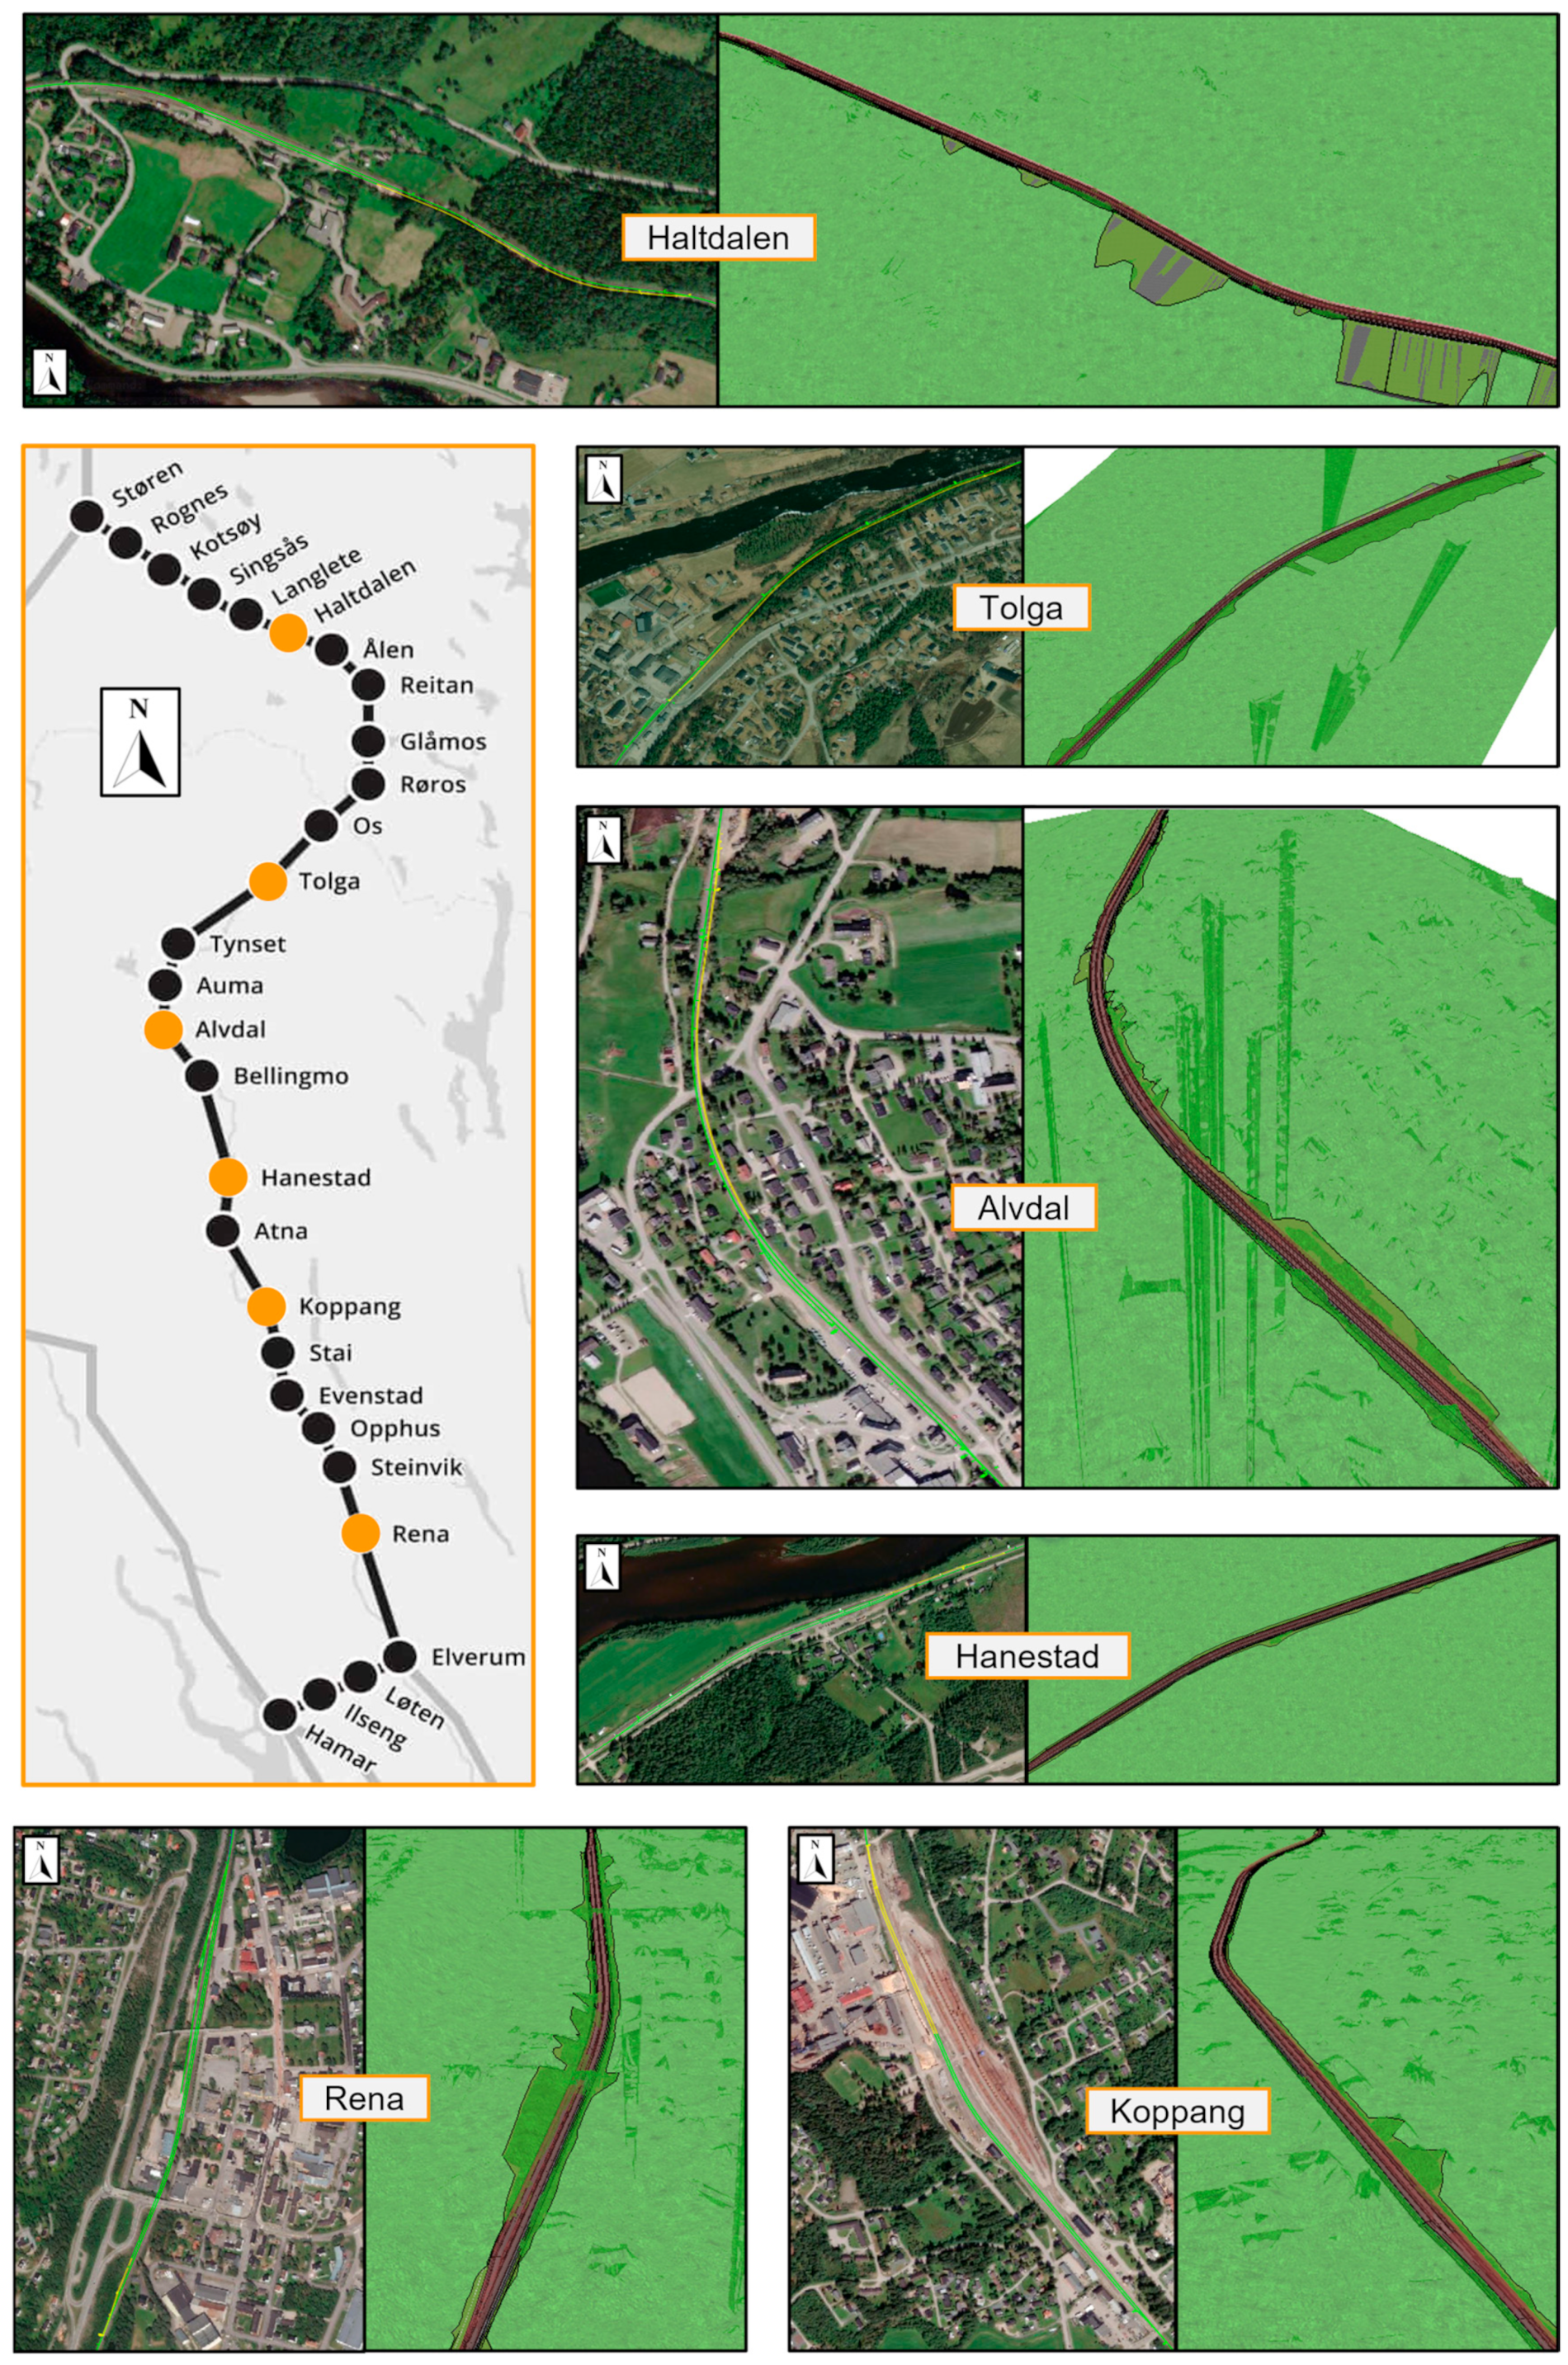
3.2. Passing Loop Design

BIM software Trimble Novapoint was leveraged to represent the existing railway track as well as to illustrate the suggested upgrades concerning the passing loops at the selected locations: Elverum, Rena, Koppang, Hanestad, Alvdal, Tolga, and Haltdalen. This work only visualized information related to the position of the transport infrastructure on the terrain without representing other elements in the vicinities such as buildings or roads to lower the software processing time. Furthermore, the same version of Novapoint, namely, the 2024 edition, was consistently used to ensure full compatibility and reduce the potential for errors.
In addition to its main track, Elverum train station (km 158.38, starts in Oslo) has three passing loops with lengths equal to 150 m, 320 m, 535 m. The longest one is therefore 265 m too short compared to the minimum requirement of 800 m. As shown in Figure 4, the proposed solution is building a new double-ended sidetrack northward after the level crossing located at km 159.05. The curve radius R is equal to 1000 m, and, based on the requirements reported in Table 1, the track spacing between the main track and the passing loop is 4.64 m. The existing track and the suggested track upgrade are highlighted in green and yellow, respectively, in Figure 4. Furthermore, the topographic map reported in the left-hand part was derived from the Norwegian Mapping Authority [53], whereas the image illustrated in the right-side part was generated by Trimble Novapoint software.
The designs of the passing loops at the other locations, namely, Rena, Koppang, Hanestad, Alvdal, Tolga, and Haltdalen, are illustrated in Figure 5. The train station in Rena (km 190.38) has an existing passing loop extending 674 m. Therefore, the needed lengthening is 126 m and can be placed south of the station where there are no level crossings. The curve radius R is equal to 700 m and the corresponding track spacing is 4.64 m. The length of the passing loop currently placed along the Koppang train station (km 246.81) is 692 m. It is recommended performing a 108 m extension between the two level crossings nearby (km 246.71 and km 247.35). The value of the curve radius R is 500 m, the corresponding track spacing is 4.68 m. Hanestad train station (km 285.00) currently has a passing loop measuring 545 m. Therefore, this double-ended sidetrack must be lengthened by 255 m. It is suggested upgrading the passing loop to the north to avoid issues with the existing level crossing (km 284.51). Meanwhile, attention must be paid due potential natural hazards related to the vicinity to the Glomma river. The track spacing is 4.66 m, and the curve radius R equals 600 m. The length of the passing loop currently located along the Alvdal train station (km 324.23) is 320 m and thus requires an extension of 480 m. As there are spatial constraints near the railway station; it is proposed building a new double-ended sidetrack northwards, where there is a flat area available. The curve radius R is 500 m, and a track spacing of 4.68 m is needed. Tolga train station (km 368.15) has a 326 m-long double-ended sidetrack. As there is a level crossing nearby (km 368.18) and the railway line already runs very close to the Glomma river, it is suggested building a new passing loop running south, parallel to the main track. The curve radius R is 500 m, and a track spacing of 4.68 m is needed. The train station in Haltdalen (km 453.85) currently has a passing loop extending 324 m, thus requiring a lengthening of 476 m. As there is a bridge west of the railway station, it is recommended extending the double-ended sidetrack eastward. The curve radius R is 300 m, which necessitates a track spacing of 4.70 m.
This work thus recommends the extension of the passing loops located at four stations (i.e., Rena, Koppang, Hanestad, Haltdalen) and the construction of new passing loops in the proximities of three stations (i.e., Elverum, Alvdal, Tolga). Trimble Novapoint software has been central for geolocating the railway sections as well as identifying the most convenient infrastructure upgrade in each case. The findings are in line with other studies leveraging BIM tools for upgrading existing railway lines [54,55] as well as positioning them on topography data [56,57].

3.3. Branch Line Design

In addition to the upgrade of passing loops, it was also important to make some considerations regarding Hamar railway station [58], which is located at one of the two extremities of the Røros line. Currently, a freight train that departs from Oslo and plans to reach Trondheim traveling along the mentioned railway route must first enter the station in Hamar; afterwards, shunting operations take place so that the locomotive is moved to the front, and eventually the train can continue and enter the Røros Line. As this scenario inevitably generates additional waiting time and negative externalities, this work suggests creating a branch line as depicted in Figure 6 to avoid shunting operations. Novapoint software represented the geographical location of the existing railway tracks in green and visualized the branch line position in yellow. Furthermore, to limit the impact on the protected Åkersvika nature reserve located nearby, the branch line should have the smallest curve radius R permitted by technical regulations, namely, 190 m [25].
For passing loops and considering the preliminary nature of this work, Novapoint software was essential for geolocating the existing railway infrastructure and identifying the improvements. The suggested outcome regarding branch line construction agrees well with other studies documenting the value of BIM tools when it comes to conducted pre-feasibility studies aimed at the more efficient use of node points or areas where multiple transport routes intersect [59,60].

3.4. Limitations and Future Work

This preliminary work focused on the possible enhancement of railway freight transport along the Røros line, performing capacity calculations and the design of infrastructure upgrades (i.e., passing loops, branch line) without dealing with technical construction or economic considerations. Notwithstanding its limitations, this brief technical note sheds light on the importance of upgrading the railway line as a matter of national priority. Therefore, future work can cover the following aspects to perform a more comprehensive evaluation:
(i)
Despite not being placed on unstable mountains [61] or areas displaying quick clay [62], some locations along the Røros are prone to flooding [63]. Research is needed to ascertain aspects related to geological limitations, natural hazards, and the associated mitigation costs [64,65].
(ii)
As the main protected area along the Røros line is the Åkersvika nature reserve in Hamar, it is necessary to make sure that the upgrade of the passing loops does not impair sensitive ecological areas [66]. Moreover, future research can also focus on minimizing land acquisition and resettlement processes [67,68].
(iii)
As this exploratory work employed BIM software only to position the transport infrastructure on the terrain, future work can delve into structural considerations such as the bearing capacity of the soil, bridges, and culverts, also considering the possible presence of underground pipelines.
(iv)
Future research can take into consideration that the length of the freight trains is 740 m in order to meet the European goal [69]. In this regard, it is also necessary to control operational quality in terms of robustness and capacity utilization, which requires a certain level of resilience to delays and disruptions [70].
(v)
Given the national relevance of upgrading the Røros line, it is necessary to consider the long-term economic impact of the project so that the initial investment can be recouped [71]. From the perspective of the investment return rate, cost–benefit analyses can ascertain whether the benefits brought by the enhanced freight transport system can cover the cost of the infrastructure upgrade [72].

4. Conclusions

Globally, governmental agencies are spurring the shift of freight transport from trucks to trains thanks to their much lower environmental impact. In the central part of Norway, the city of Trondheim and the capital Oslo are connected by two railway routes, namely, the Dovre line and the Røros line. The former is currently employed for freight transport, but it is also characterized by a more complicated topography compared to the latter. Due to the necessity of accommodating freight trains with a length of 650 m, this brief technical note shed light on the key elements (i.e., passing loops, branch line) that should be upgraded along the Røros line to increase its capacity for goods’ haulage.
Considering the regulatory standards, the results showed that 8 train routes can be added for freight transport, in addition to the 12 existing train routes for passengers. In this scenario, the minimum headway time is 48 min. Therefore, this work identified the minimum set of infrastructure modifications required to achieve the necessary increase in capacity by upgrading seven passing loops located at seven train stations located approximately equally far apart. Moreover, this brief technical note also shed light on improving the railway infrastructure close to Hamar station, which is located at one of the two extremities of the Røros line, by means of a branch line, which would avoid time-consuming shunting operations.
The brief technical note leveraged the building information modeling (BIM) concept to geolocate the railway infrastructure along the Røros line. In this regard, this work employed the BIM software Trimble Novapoint, as it is commonly used in Norway by private and public stakeholders. The digital tool enabled the visualization of the suggested infrastructure upgrades. Considering the limitations of this brief technical note, future work can focus on other relevant aspects that were not covered here such as the assessment of technical construction, natural hazards, and cost–benefit analyses.

Author Contributions

A.S.: data curation, formal analysis, investigation, methodology, software, Vvsualization, writing—original draft. G.C.G.: data curation, formal analysis, investigation, methodology, software, visualization, writing—original draft. C.Ø.: data curation, formal analysis, investigation, methodology, software, visualization, writing—original draft. Ø.L.: conceptualization, project administration, resources, supervision, writing—review and editing. S.A.E.N.: conceptualization, project administration, resources, supervision, writing—review and editing. D.M.B.: conceptualization, data curation, methodology, project administration, resources, supervision, visualization, writing—original draft. B.L.: conceptualization, data curation, methodology, project administration, resources, supervision, visualization, writing—original draft. All authors have read and agreed to the published version of the manuscript.

Funding

This research did not receive any specific grant from funding agencies in the public, commercial, or not-for-profit sectors.

Data Availability Statement

The raw data supporting the conclusions of this article will be made available by the authors on request.

Acknowledgments

The authors thank Thomas Vatn Bjørge, track engineer at Bane NOR, for his kind support in accessing the Bane NOR catalogue “Maximo”.

Conflicts of Interest

The authors declare no conflicts of interest.

References

  1. Bektas, T. Freight Transport and Distribution, 1st ed.; CRC Press: Boca Raton, FL, USA, 2017. [Google Scholar]
  2. Monios, J.; Bergqvist, R. Intermodal Freight Transport and Logistics, 1st ed.; CRC Press: Boca Raton, FL, USA, 2017. [Google Scholar]
  3. Ahsan, N.; Hewage, K.; Razi, F.; Hussain, S.A.; Sadiq, R. A critical review of sustainable rail technologies based on environmental, economic, social, and technical perspectives to achieve net zero emissions. Renew. Sustain. Energy Rev. 2023, 185, 113621. [Google Scholar] [CrossRef]
  4. Kirschstein, T.; Meisel, F. GHG-emission models for assessing the eco-friendliness of road and rail freight transports. Transp. Res. Part B Methodol. 2015, 73, 13–33. [Google Scholar] [CrossRef]
  5. Sha, A.; Jiang, W.; Wang, W.; Lou, B.; Cao, Y.; Jia, M. Design and prospect of new pavement materials for smart road. Chin. Sci. Bull. 2020, 65, 3259–3269. [Google Scholar] [CrossRef]
  6. Pinto, J.T.; de Miranda Pinto, M.; Mistage, O.; Bilotta, P.; Helmers, E. Road-rail intermodal freight transport as a strategy for climate change mitigation. Environ. Dev. 2018, 25, 100–110. [Google Scholar] [CrossRef]
  7. Barbieri, D.M.; Lou, B.; Passavanti, M.; Hui, C.; Lessa, D.A.; Maharaj, B.; Banerjee, A.; Wang, F.; Chang, K.; Naik, B.; et al. Survey data regarding perceived air quality in Australia, Brazil, China, Ghana, India, Iran, Italy, Norway, South Africa, United States before and during COVID-19 restrictions. Data Br. 2020, 32, 106169. [Google Scholar] [CrossRef]
  8. Rosales, R. Less emissions or less freight? Conflicting narratives for sustainable logistics in Norway. Energy Res. Soc. Sci. 2025, 122, 104010. [Google Scholar] [CrossRef]
  9. Laurino, A.; Ramella, F.; Beria, P. The economic regulation of railway networks: A worldwide survey. Transp. Res. Part A Policy Pract. 2015, 77, 202–212. [Google Scholar] [CrossRef]
  10. Li, L.; Zhang, X. Reducing CO2 emissions through pricing, planning, and subsidizing rail freight. Transp. Res. Part D Transp. Environ. 2020, 87, 102483. [Google Scholar] [CrossRef]
  11. Nasjonal Transportplan 2025–2036. Published by Samferdselsdepartement. Norway. 2024. Available online: https://www.regjeringen.no/contentassets/aaee20cf5a9e468ea97fd51638c42407/no/pdfs/stm202320240014000dddpdfs.pdf (accessed on 16 May 2025).
  12. Bane NOR Bane NOR. 2025. Available online: https://www.banenor.no/ (accessed on 16 May 2025).
  13. Bane NOR Stadig mer Gods på Bane—Åtte Prosents Økning Hittil i år. Available online: https://www.banenor.no/nyheter-og-aktuelt/nyheter/2022/stadig-mer-gods-pa-bane--atte-prosents-okning-hittil-i-ar/ (accessed on 16 May 2025).
  14. Oslo Economics. Kan Godstrafikken på Jernbanen Reddes? En Analyse av Togets Betydning og Konsekvenser ved Bortfall; Oslo Economics: Oslo, Norway, 2025. [Google Scholar]
  15. Norwegian Railway Directorate. 2025. Available online: https://www.jernbanedirektoratet.no/ (accessed on 16 May 2025).
  16. VY. 2025. Available online: https://www.vy.no/ (accessed on 16 May 2025).
  17. CargoNet. 2025. Available online: https://www.cargonet.no/ (accessed on 16 May 2025).
  18. Norwegian Railway Directorate, Rørosbanen. 2025. Available online: https://www.jernbanedirektoratet.no/jernbanestrekning/rorosbanen/ (accessed on 16 May 2025).
  19. Norwegian Railway Directorate, Dovrebanen. 2025. Available online: https://www.jernbanedirektoratet.no/jernbanestrekning/dovrebanen/ (accessed on 16 May 2025).
  20. Pyrgidis, C.N. Railway Transportation Systems, 2nd ed.; CRC Press: Boca Raton, FL, USA, 2022; ISBN 9780367494230. [Google Scholar]
  21. Profillidis, V. Railway Planning, Management, and Engineering, 5th ed.; CRC Press: Boca Raton, FL, USA, 2022; ISBN 9781032341699. [Google Scholar]
  22. Guerrieri, M. Fundamentals of Railway Design, 1st ed.; Springer: Cham, Switzerland, 2023. [Google Scholar]
  23. Barbieri, D.M.; Hoff, I.; Mork, H. Laboratory investigation on unbound materials used in a highway with premature damage. In Proceedings of the 10th International Conference on the Bearing Capacity of Roads, Railways and Airfields, Athens, Greece, 28–30 June 2017; Loizos, A., Al-Qadi, I.L., Scarpas, A.T., Eds.; Taylor & Francis: Athens, Greece, 2017; pp. 101–108. [Google Scholar]
  24. Barbieri, D.M.; Hoff, I.; Mørk, M.B.E. Mechanical assessment of crushed rocks rerived from tunnelling operations. In Sustainable Civil Infrastructures; Cheng, W.-C., Yang, J., Wang, J., Eds.; Springer: Hangzhou, China, 2019; pp. 225–241. [Google Scholar] [CrossRef]
  25. Bane NOR. Teknisk Regelverk. Norway. 2025. Available online: https://trv.banenor.no/wiki/Forside (accessed on 16 May 2025).
  26. Bane NOR. Sporets Komponenter/Sporveksler. 2025. Available online: https://www.jernbanekompetanse.no/wiki/Sporets_komponenter/Sporveksler (accessed on 16 May 2025).
  27. Jensen, M. Hjerkinn. 2009. Available online: https://commons.wikimedia.org/wiki/File:Hjerkinn_2009_(9050540644).jpg (accessed on 16 May 2025).
  28. UIC Code 406; International Union of Railways: Paris, France, 2013.
  29. Hacon. Timetable Construction and Dispatching. 2025. Available online: https://www.hacon.de/en/portfolio/timetable-construction-disposition/ (accessed on 16 May 2025).
  30. Zhan, S.; Xie, J.; Wong, S.C.; Zhu, Y.; Corman, F. Handling uncertainty in train timetable rescheduling: A review of the literature and future research directions. Transp. Res. Part E Logist. Transp. Rev. 2024, 183, 103429. [Google Scholar] [CrossRef]
  31. RailNetEurope Timetable Redesign for Smart Capacity Management. 2025. Available online: https://rne.eu/capacity-management/ttr/ (accessed on 16 May 2025).
  32. Eastman, C.; Teicholz, P.; Sacks, R.; Liston, K. BIM Handbook: A Guide to Building Information Modeling for Owners, Managers, Designers, Engineers and Contractors, 1st ed.; Wiley: Hoboken, NY, USA, 2008. [Google Scholar]
  33. Volk, R.; Stengel, J.; Schultmann, F. Building Information Modeling (BIM) for existing buildings—Literature review and future needs. Autom. Constr. 2014, 38, 109–127. [Google Scholar] [CrossRef]
  34. Bazán, Á.M.; Alberti, M.G.; Álvarez, A.A.; Trigueros, J.A. New perspectives for BIM usage in transportation infrastructure projects. Appl. Sci. 2020, 10, 7072. [Google Scholar] [CrossRef]
  35. Costin, A.; Adibfar, A.; Hu, H.; Chen, S.S. Building Information Modeling (BIM) for transportation infrastructure—Literature review, applications, challenges, and recommendations. Autom. Constr. 2018, 94, 257–281. [Google Scholar] [CrossRef]
  36. Norwegian public roads administration Håndbok V770 Modellgrunnlag; Vegdirektoratet: Oslo, Norway, 2015.
  37. Bane NOR. Krav Til Informasjonsmodellering (KIM). 2022. Available online: https://www.banenor.no/kim (accessed on 16 May 2025).
  38. Lassen, A.K.; Hjelseth, E.; Tollnes, T. Enhancing learning outcomes by introducing BIM in civil engineering studies–experiences from a university college in Norway. Int. J. Sustain. Dev. Plan. 2018, 13, 62–72. [Google Scholar] [CrossRef]
  39. Barbieri, D.M.; Lou, B.; Passavanti, M.; Barbieri, A.; Bjørheim, F. A survey dataset evaluating perceptions of civil engineering students about Building Information Modelling (BIM). Data 2023, 8, 114. [Google Scholar] [CrossRef]
  40. Trimble. Trimble Novapoint. 2025. Available online: https://www.novapoint.com/products/novapoint (accessed on 16 May 2025).
  41. Trimble. Om Trimble. 2025. Available online: https://civil.trimble.no/om/om-trimble (accessed on 16 May 2025).
  42. Rüther, D.C.; Lindsay, E.; Slåtten, M.S. Landslide inventory: ‘Hans’ storm southern Norway, August 7–9, 2023. Landslides 2024, 21, 1155–1159. [Google Scholar] [CrossRef]
  43. Virk, Z.T.; Fennell, J.; Haghighi, A.T.; Klove, B. Introducing the concept of “resource scapes” to account for water, energy and biomass resources’ nexus dependencies and governance. Resour. Environ. Sustain. 2025, 19, 100199. [Google Scholar] [CrossRef]
  44. Bane NOR. Datakatalogen “Maximo”. 2025. Available online: https://oppslagsverk.banenor.no/datakatalogen/ (accessed on 16 May 2025).
  45. Bane NOR. Sporets Trasé/Sporgeometri. 2025. Available online: https://www.jernbanekompetanse.no/wiki/Sporets_trasé/Sporgeometri (accessed on 16 May 2025).
  46. European Union. Regulation (EU) 2024/1679; European Union: Brussels, Belgium, 2024. [Google Scholar]
  47. Norwegian Railway Directorate. Godsstrategi—NTP 2022–2033; Norwegian Railway Directorate: Norway, Oslo, 2019. [Google Scholar]
  48. Bane NOR. Strekningsbeskrivelse Rørosbanen. 2025. Available online: https://orv.banenor.no/sjn/doku.php?id=strekningsbeskrivelse:strekningsoversikt:rorosbanen (accessed on 16 May 2025).
  49. Norwegian Railway Directorate. Standarder for Kapasitetsplanlegging; Norwegian Railway Directorate: Oslo, Norway, 2017. [Google Scholar]
  50. Ke, B.R.; Lin, C.L.; Chien, H.H.; Chiu, H.W.; Chen, N. A new approach for improving the performance of freight train timetabling of a single-track railway system. Transp. Plan. Technol. 2015, 38, 238–264. [Google Scholar] [CrossRef]
  51. Burdett, R.L.; Kozan, E. Techniques for absolute capacity determination in railways. Transp. Res. Part B Methodol. 2006, 40, 616–632. [Google Scholar] [CrossRef]
  52. Dick, C.T.; Atanassov, I.; Kippen, F.B.; Mussanov, D. Relative train length and the infrastructure required to mitigate delays from operating combinations of normal and over-length freight trains on single-track railway lines in North America. Proc. Inst. Mech. Eng. Part F J. Rail Rapid Transit 2019, 233, 731–742. [Google Scholar] [CrossRef]
  53. Norwegian Mapping Authority. Norges Kart. 2025. Available online: https://www.kartverket.no/til-lands/kart/norgeskart (accessed on 16 May 2025).
  54. Ciccone, A.; Di Stasio, S.; Asprone, D.; Salzano, A.; Nicolella, M. Application of openBIM for the management of existing railway infrastructure: Case study of the Cancello–Benevento railway line. Sustainability 2022, 14, 2283. [Google Scholar] [CrossRef]
  55. Bartonek, D.; Bures, J.; Vystavel, O.; Havlicek, R. Case study of remodelling the as-built documentation of a railway construction into the BIM and GIS environment. Appl. Sci. 2023, 13, 5591. [Google Scholar] [CrossRef]
  56. Queiroz, D.; Placido, M.; Silva, R.; Vital, W. Influence of topographic data in the development of railway projects using BIM. J. Transp. Eng. Part A Syst. 2023, 149, 04023036. [Google Scholar] [CrossRef]
  57. Liu, Z.; Han, F.; Ni, G.; Liang, T.; Qi, M. 3D visualization of railway development using GIS and BIM techniques. Adv. Transdiscipl. Eng. 2020, 14, 199–207. [Google Scholar] [CrossRef]
  58. Bane NOR. Hamar Stasjon. 2025. Available online: https://www.banenor.no/reise-og-trafikk/stasjoner/-h-/hamar/ (accessed on 16 May 2025).
  59. Acerra, E.M.; Busquet, G.F.D.; Parente, M.; Marinelli, M.; Vignali, V.; Simone, A. Building Information Modeling (BIM) application for a section of Bologna’s red tramway line. Infrastructures 2022, 7, 168. [Google Scholar] [CrossRef]
  60. Pasetto, M.; Giordano, A.; Borin, P.; Giacomello, G. Integrated railway design using Infrastructure-Building Information Modeling. The case study of the port of Venice. Transp. Res. Procedia 2020, 45, 850–857. [Google Scholar] [CrossRef]
  61. Geological Survey of Norway. Nasjonal Database for Ustabile Fjellpartier. 2025. Available online: https://geo.ngu.no/kart/ustabilefjellparti_mobil/ (accessed on 16 May 2025).
  62. Norwegian Water Resources and Energy Directorate. Kvikkleireskredfare. 2025. Available online: https://temakart.nve.no/tema/kvikkleire (accessed on 16 May 2025).
  63. Norwegian Water Resources and Energy Directorate. Flomsone. 2025. Available online: https://temakart.nve.no/tema/flomsone (accessed on 16 May 2025).
  64. Koks, E.E.; Rozenberg, J.; Zorn, C.; Tariverdi, M.; Vousdoukas, M.; Fraser, S.A.; Hall, J.W.; Hallegatte, S. A global multi-hazard risk analysis of road and railway infrastructure assets. Nat. Commun. 2019, 10, 2677. [Google Scholar] [CrossRef]
  65. Armstrong, J.; Helm, P.; Preston, J.; Loveridge, F. Economics of geotechnical asset deterioration, maintenance and renewal. Transp. Geotech. 2024, 45, 101185. [Google Scholar] [CrossRef]
  66. Norwegian Environment Agency. Norges Verneområder. 2025. Available online: https://www.miljodirektoratet.no/ansvarsomrader/vernet-natur/norges-verneomrader/ (accessed on 16 May 2025).
  67. Egze, A.; Zeleke, T.; Seyoum, A. The impact of involuntary resettlement on households’ livelihood: A case study of railway infrastructure induced resettlement in South Wello zone of Amhara Region, Ethiopia. J. Clean. Prod. 2023, 420, 138402. [Google Scholar] [CrossRef]
  68. Kasraian, D.; Maat, K.; Stead, D.; van Wee, B. Long-term impacts of transport infrastructure networks on land-use change: An international review of empirical studies. Transp. Rev. 2016, 36, 772–792. [Google Scholar] [CrossRef]
  69. Abramovic, B.; Majstrovic, M.; Mašek, J.; Šipuš, D. Railway freight corridors in the European Union. Transp. Res. Procedia 2024, 77, 109–115. [Google Scholar] [CrossRef]
  70. Al-Mousa, M.; Sipilä, H.; Fröidh, O. Railway capacity utilization and service quality of freight trains with increased top speed in mixed traffic. Transp. Res. Interdiscip. Perspect. 2024, 28, 101242. [Google Scholar] [CrossRef]
  71. Ahern, A.; Anandarajah, G. Railway projects prioritisation for investment: Application of goal programming. Transp. Policy 2007, 14, 70–80. [Google Scholar] [CrossRef]
  72. Jones, H.; Moura, F.; Domingos, T. Transport infrastructure project evaluation using cost-benefit analysis. Procedia Soc. Behav. Sci. 2014, 111, 400–409. [Google Scholar] [CrossRef]
Figure 1. Passing loop and an example from the Norwegian rail network [27].
Infrastructures 10 00180 g001
Figure 2. Norwegian railway network highlighting the alignments of the Dovre line (lilac) and the Røros line (orange) [15]. Railway stations along the Rørøs line [18].
Infrastructures 10 00180 g002
Figure 3. Current timetable for passenger trains (blue) and suggested timetable for freight trains (red) along the Røros line. The stations where passing loops can be upgraded are highlighted with dashed lines.
Infrastructures 10 00180 g003
Figure 4. Design of passing loop close to Elverum, mileage illustrated from km 159.08 to km 159.88 (mileage starts in Oslo) [53].
Infrastructures 10 00180 g004
Figure 5. Design of passing loops close to Rena, Koppang, Hanestad, Alvdal, Tolga, and Haltdalen [53].
Infrastructures 10 00180 g005
Figure 6. Design of branch line close to Hamar [53].
Infrastructures 10 00180 g006
Table 1. Minimum track spacing [25].
Radius (m)Track Spacing (m)
R ≤ 3504.70
350 < R ≤ 5004.68
500 < R ≤ 6004.66
600 < R ≤ 10004.64
1000 < R ≤ 40004.60
4000 < R ≤ 50004.56
R < 50004.40
Table 2. Radius R values of the curves along the Dovre line and the Røros line; data reported as percentages of the line length [45].
R ≤ 300 m300 m < R ≤ 500 m500 m < R ≤ 1100 mR > 1100 mStraight
Dovre line8%12%17%23%40%
Røros line7%13%16%14%50%
Table 3. Slope gradient s values along the Dovre line and the Røros line; data reported as percentages of the line length [45].
s > 20‰15‰ < s ≤ 20‰10‰ < s ≤ 15‰5‰ < s ≤ 10‰0‰ < s ≤ 5‰s = 0‰
Dovre line0%16%18%16%31%19%
Røros line0%0%14%30%37%19%
Table 4. Extent of earthworks and infrastructure along the Dovre line and the Røros line; data reported as percentages of the line length [44].
EmbankmentCuttingBridgeTunnel
Dovre line29.7%36.2%0.5%2.6%
Røros line34.0%14.1%0.7%0.4%
Disclaimer/Publisher’s Note: The statements, opinions and data contained in all publications are solely those of the individual author(s) and contributor(s) and not of MDPI and/or the editor(s). MDPI and/or the editor(s) disclaim responsibility for any injury to people or property resulting from any ideas, methods, instructions or products referred to in the content.

