Article

Age and Growth of Pacific Sardine (Sardinops sagax) off the U.S. Pacific Coast, 2012–2021

by
Kelsey C. James
1,*,
Jonathan M. Walker
2,
Brittany D. Schwartzkopf
1,
Emmanis Dorval
3 and
Brad E. Erisman
1
1
Fisheries Resources Division, Southwest Fisheries Science Center, NOAA National Marine Fisheries Service, San Diego, CA 92037, USA
2
Walker Environmental, San Diego, CA 92129, USA
3
Ocean Associates, Inc. Under Contract with Southwest Fisheries Science Center, Arlington, VA 22207, USA
*
Author to whom correspondence should be addressed.
Fishes 2026, 11(5), 290; https://doi.org/10.3390/fishes11050290
Submission received: 13 April 2026 / Revised: 12 May 2026 / Accepted: 12 May 2026 / Published: 14 May 2026
(This article belongs to the Special Issue Ecology of Fish: Age, Growth, Reproduction and Feeding Habits)

Abstract

Pacific sardine (Sardinops sagax) are an economically important forage fish in the Northeast Pacific Ocean that undergo large changes in abundance over decadal scales and exhibit high individual variation in somatic growth. Past studies have suggested that somatic growth in Pacific sardine may be density-dependent and vary regionally in response to environmental conditions. We analyzed somatic growth in Pacific sardine off the U.S. Pacific Coast during the recent period of low abundance (2012–2021) and compared the results to those of previous studies to evaluate evidence of spatial or temporal variation in growth. Sampled fish (n = 3228) ranged in length from 30 to 291 mm SL and in age from 0 to 9 years and displayed high individual variation in length-at-age and age-at-length. Length-at-age data were best explained by the von Bertalanffy growth model, and sample distribution simulations showed the dataset to be robust and unbiased. Estimated growth parameters (L = 243, K = 0.795, t0 = −0.638) were consistent with an opportunistic life history strategy characterized by rapid growth, early maturation, and a short lifespan. While the estimated growth rate (K) was higher than in a previous study conducted during a period of high abundance and indicated that growth may be density-dependent, the parameter estimates from the previous study were influenced by sample distribution bias. Similarly, differences in study region, season, collection method, aging methods, and other factors precluded any definitive conclusions on the source of reported differences in growth patterns among studies.
Key Contribution: Growth model parameters for Pacific sardine during a recent period of low abundance were consistent with an opportunistic life history strategy. Different studies on Pacific sardine age and growth have different growth model parameters, but the differences may be attributed to sampling bias, phenotypic plasticity, and density dependence rather than definitive differences in growth.

1. Introduction

The Pacific sardine (Sardinops sagax; hereafter sardine) are a small, coastal pelagic fish that range from southeastern Alaska, U.S., to the Gulf of California, Mexico, off the Pacific Coast of North America [1]. Throughout its range, the species serves as an important prey species for birds, marine mammals, and predatory fishes [2,3], and it has supported important commercial fisheries in the U.S. and Mexico [4,5]. Similar to other clupeoid fishes, sardine naturally undergo large and rapid fluctuations in distribution and abundance in response to changes in environmental conditions that impact spawning, recruitment, feeding and other vital processes [6,7,8]. They exhibit an opportunistic life history strategy that is linked to their population dynamics in relation to environmental forcing and that is characterized by fast growth, early maturation (age at 50% maturity is 6 months old [9]), a small body size, a short lifespan, and a high natural mortality rate, and which has evolved to succeed in highly variable environmental conditions [10,11,12].
In times of high abundance, sardine are found throughout their range, with their northern extent expanding farther north in the summer [13,14]. This is because larger sardine travel longer distances along the U.S. Pacific Coast during seasonal north–south movements [15,16], while juveniles in U.S. waters are non-migratory and most common in nearshore waters south of Pt. Conception [17,18,19]. The sardine fishery was first developed during a period of high abundance during World War I, with landings peaking in the 1930s at 700,000 mt per year [20]. This was followed by a decline in abundance to very low levels from the 1960s to 1980s and the closure of the fishery in the mid-1960s [21,22]. In times of low abundance, sardine distribution is patchy and closer to shore, and does not extend as far north [13,14]. Sardine increased in abundance again in the late 1980s–2000s, and a new fishery arose in the 2000s [23,24]. In the 2010s, landings decreased and the estimated biomass dropped below the 150,000 mt harvest guideline threshold, and the commercial targeted U.S. fishery has been under a moratorium since 2015 [22]. The importance of the sardine fishery has led to decades of population monitoring [25,26,27,28].
Paired age and length data for sardine have been generated consistently for nearly a century [29,30,31,32] and have been integral to the monitoring, assessment, and management of their fishery in the U.S., Mexico, and Canada (e.g., [24,27,33]) as well as to investigations of the physical and biological drivers of their population dynamics (e.g., [13,16]). Since the development of the fishery, nearly all studies of growth in sardine have been regionally focused (e.g., [9,34,35]). This is a result of logistical constraints (e.g., the large geographic range of sardine), international borders, and the hypothesized existence of three subpopulations of sardine that allegedly exhibit differences in growth [13,36]. The U.S. manages only a portion of the sardine population, the hypothesized northern subpopulation (NSP), which is reported to range from Alaska to northern Baja California, Mexico [28,37]. Two additional subpopulations that have been hypothesized to exist include a southern or temperate subpopulation (SSP) that ranges from Southern California, U.S., to the southern tip of Baja California, Mexico, and a warm subpopulation present in the Gulf of California (GOCSP [13,38,39]). These hypothesized subpopulations, however, lack empirical and theoretical support [12,40,41]. In addition, a recent review found no evidence of regional differences in growth in support of subpopulations (i.e., NSP and SSP) along the Pacific Coast [12]. In light of this new research, the Pacific Fisheries Management Council is in the process of re-evaluating the sardine stock definition to determine if all sardine in U.S. waters should be defined as one stock [42].
Butler et al. [43] were among the first to use otoliths to age and model somatic growth in sardine off the U.S. Pacific Coast. Dorval et al. [9] conducted the first statistically robust examination of growth patterns in sardine, investigating potential changes in the growth rate of sardine collected off California (NSP) in 1994 and from 2004 to 2010 in relation to changes in regional abundance following the recovery of the fishery in the 2000s. The study reported a compensatory relationship between growth rate and estimated population size, which they attributed to feeding conditions and density-dependent factors (e.g., intraspecific competition for resources). Dorval et al. [9] concluded that temporal variations in the size and age distributions of sardine were a consequence of the recovery dynamics of the population. Given the importance of growth information to stock assessments of sardine and the possibility that growth is density-dependent, a reexamination of growth during the current period of low abundance is warranted.
More recently, several studies on sardine growth off Mexico have emerged. Enciso-Enciso et al. [35] examined the growth of the hypothesized SSP off Baja California. Similarly, Nevárez-Martínez et al. [34] examined the growth of the hypothesized GOCSP in the Gulf of California. Sardine off North America are all now considered to comprise a single biological population with no heritable differences in growth or other life history traits [12,40,41], so comparing reported growth patterns is useful for understanding the influence of environmental conditions and other factors on growth in sardine.
The overall goal of this study was to provide an updated growth model for sardine off the U.S. Pacific Coast and to compare the results with previous studies. The first objective was to run simulations to investigate the effects of sample distribution on growth model parameters and to test for potential bias in our data. The second objective was to update the growth model for the hypothesized NSP of sardine during a period of low abundance (2012–2021). The third objective was to compare the sardine length-at-age and growth model parameters generated in this study to those reported in previous studies to evaluate evidence of spatial or temporal variations in growth.

2. Materials and Methods

2.1. Sample Collection

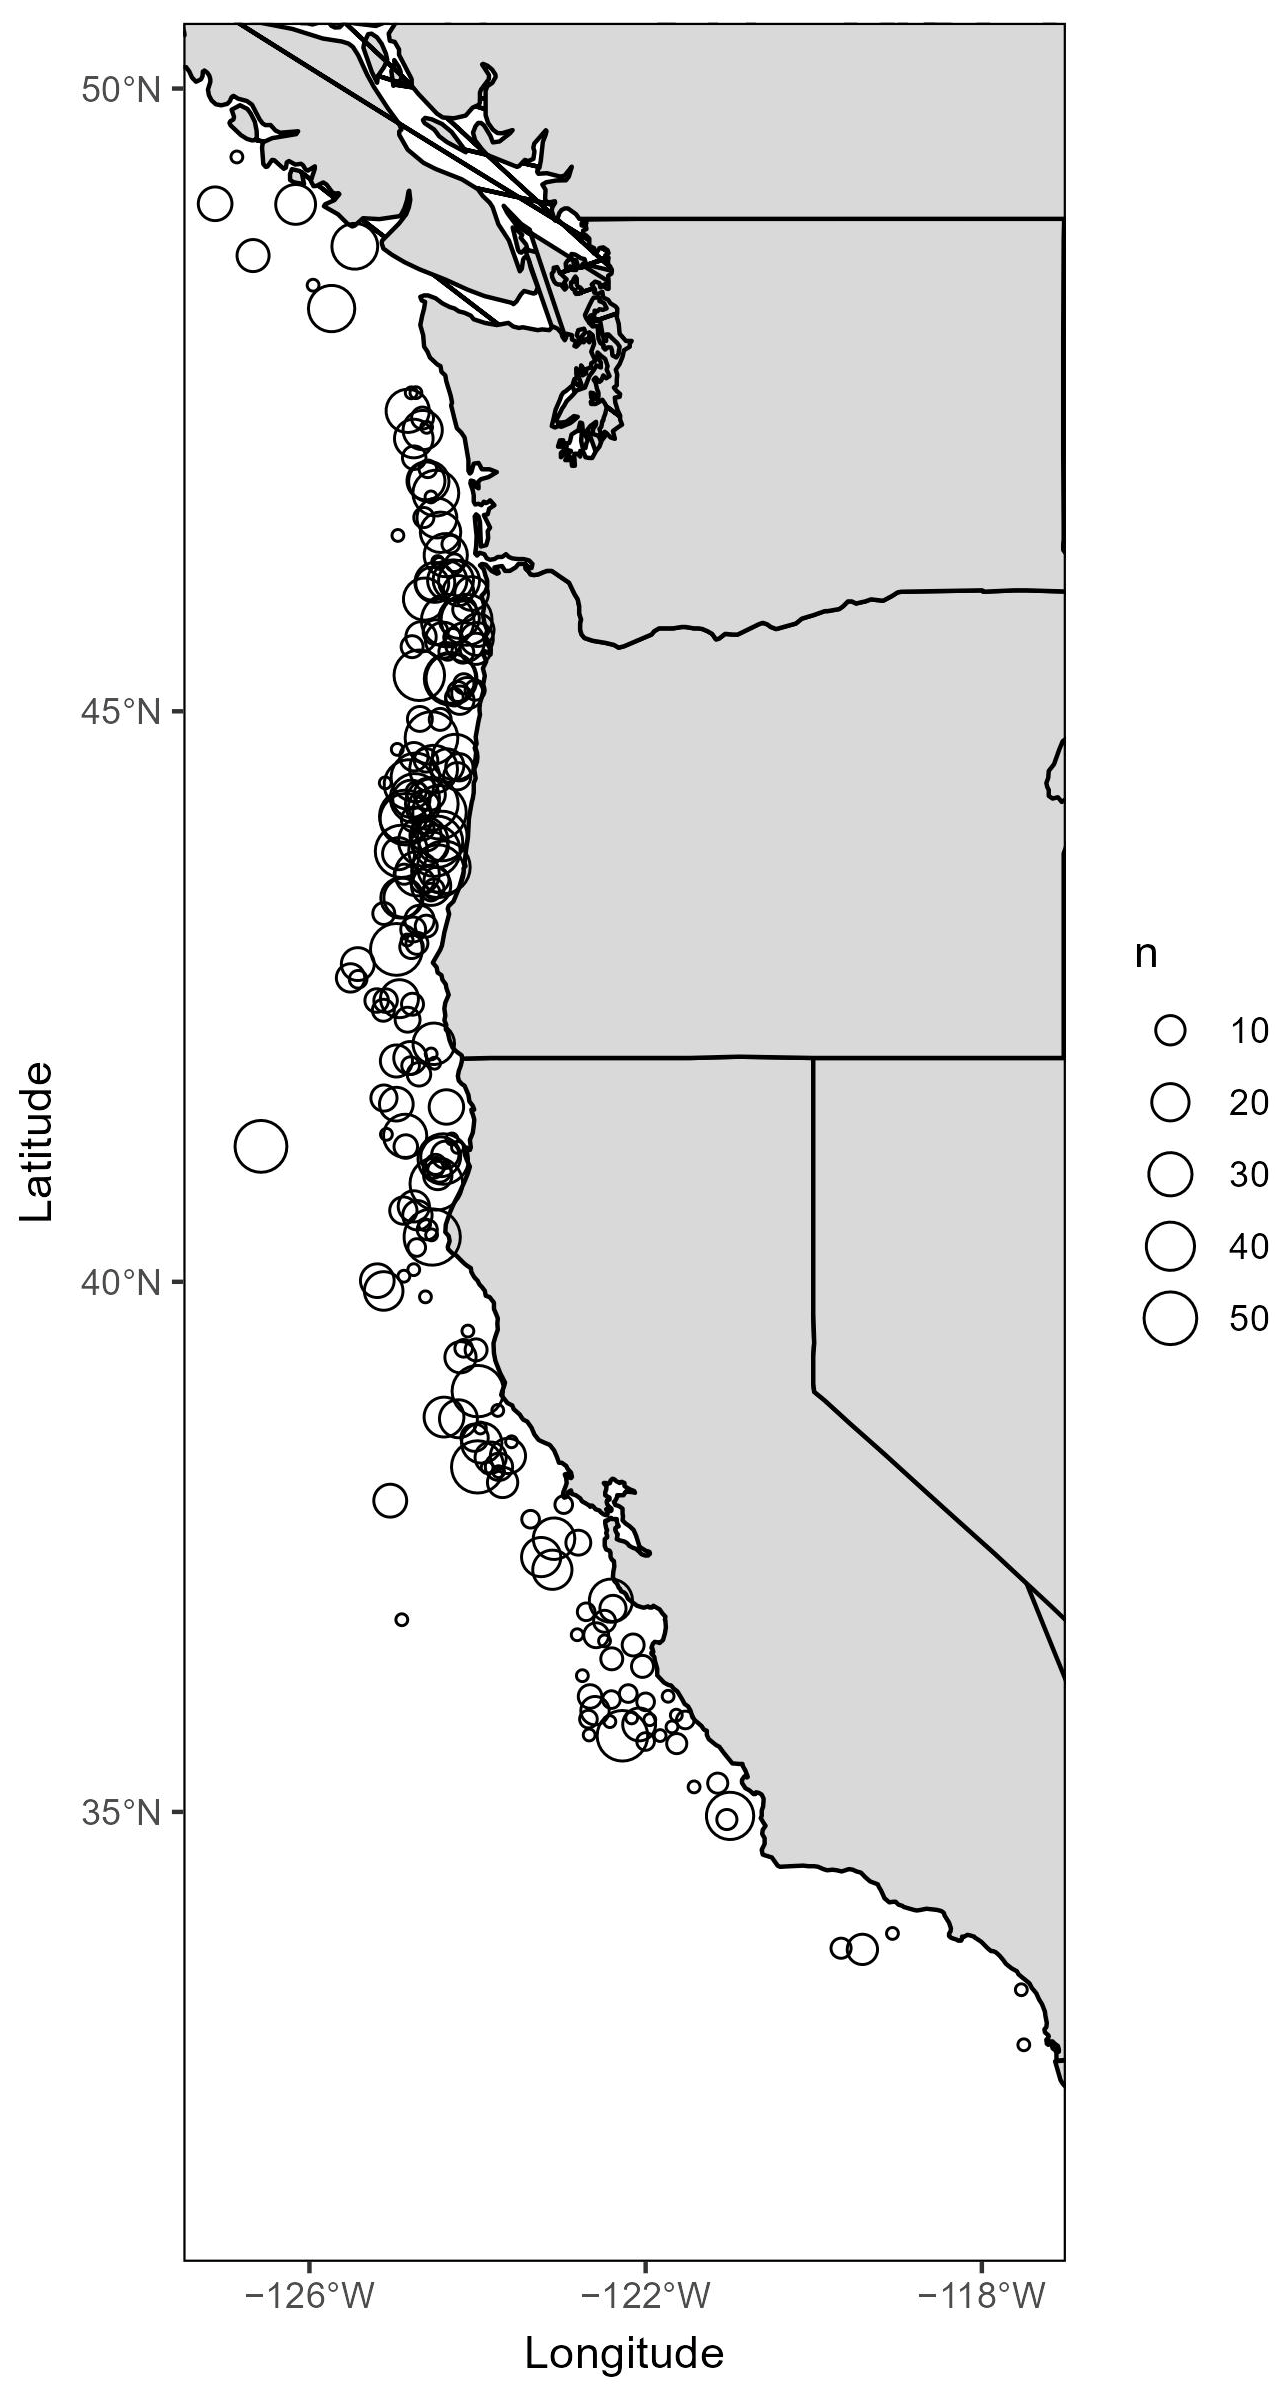
Sardine were collected using surface trawl gear operated at night during the Coastal Pelagic Species (CPS) Survey, which used the Acoustic-Trawl Method and was conducted by the NOAA Southwest Fisheries Science Center annually from June through September from 2012 to 2021. The survey was not conducted during 2020 due to the COVID-19 pandemic. The CPS Survey covered variable distances between Vancouver Island, British Columbia, Canada (49.65° N, 125.44° W), and San Diego, California, U.S. (33.25° N, −117.56° W), depending on the year. Sardine were measured to the nearest millimeter standard length (SL), and the sagittal otoliths were extracted, dried, and stored in microcentrifuge tubes. For this study, only data from sardine assigned to the NSP by the sardine potential habitat model [44,45] were used (Figure 1). More details on the trawl biosampling methodology of the CPS Survey can be found in Dorval et al. [46].

2.2. Age Determination

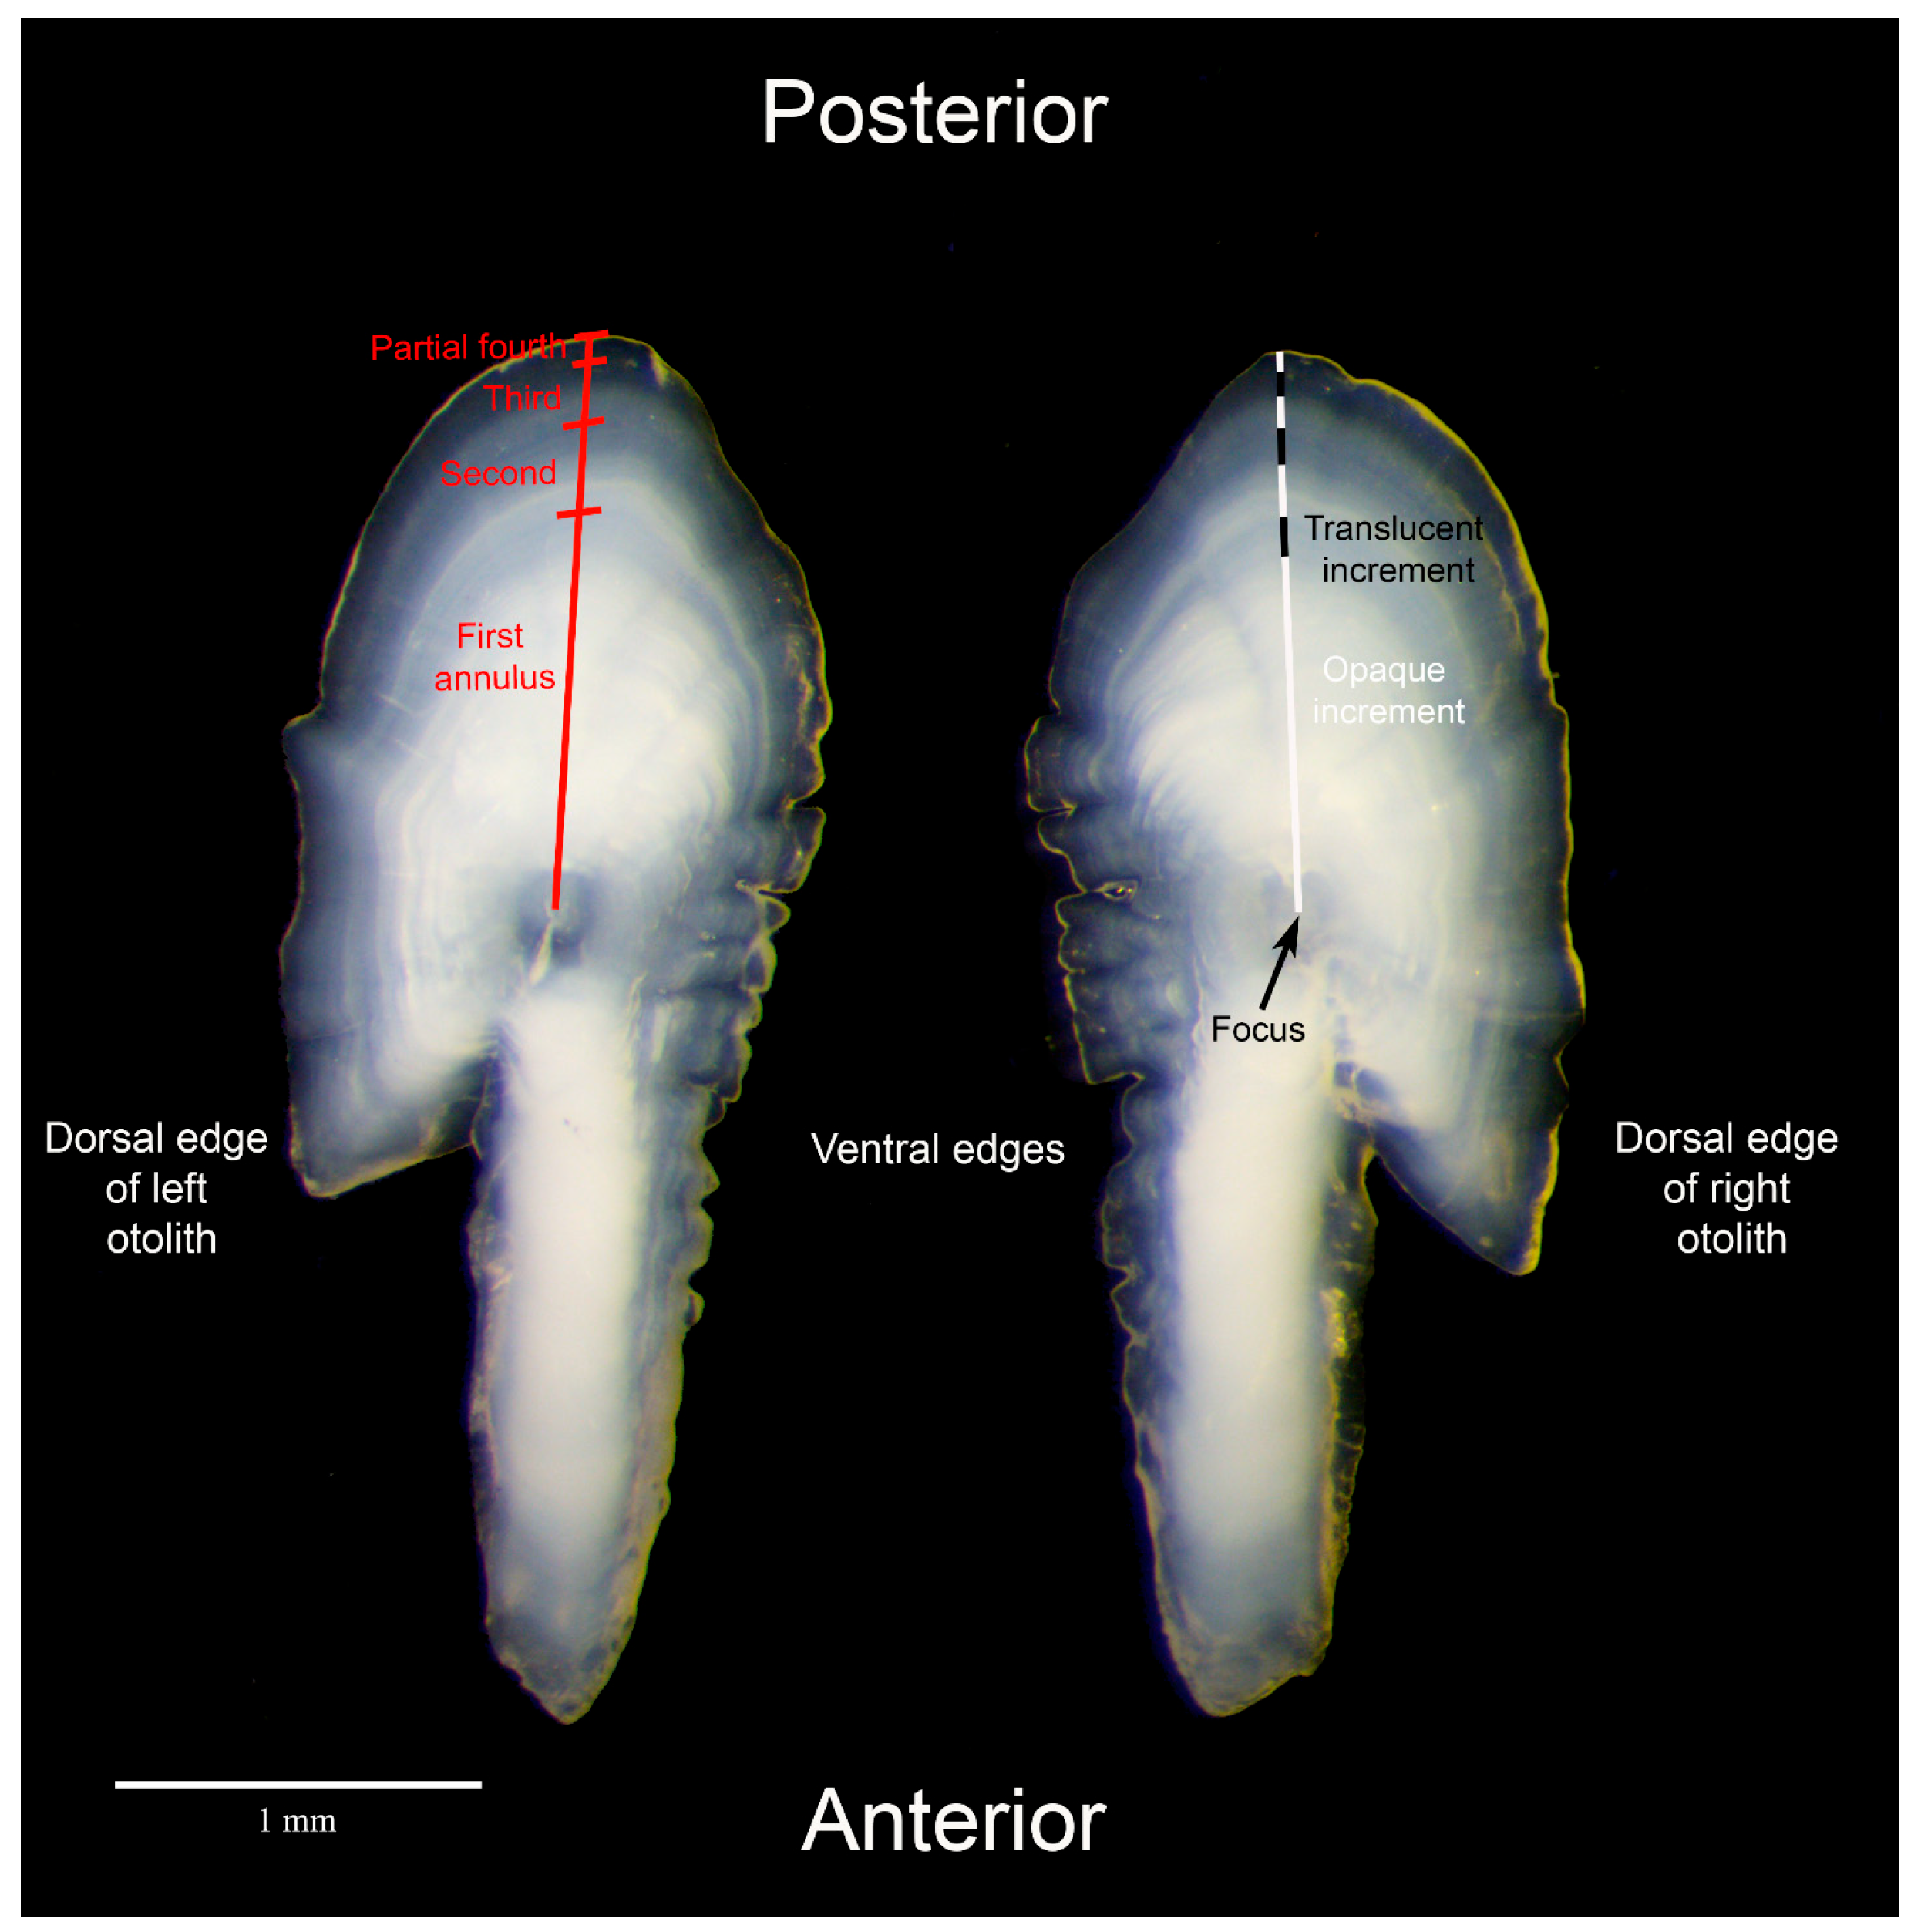
All otoliths were aged by trained and certified age readers using the standardized methods described by Dorval et al. [32]. Whole, unsectioned otoliths were immersed in distilled water for up to 3 min and the number of annuli observed on the distal side of the otolith was counted using a dissecting microscope with reflected light at 25× magnification (Figure 2). An annulus was defined as the interface between an inner translucent growth increment and the successive outer opaque growth increment [31]. All age data in this study were generated for and used in annual stock assessments with corresponding aging error matrices. These data underwent formal independent peer reviews called Stock Assessment Review Panels associated with the Pacific Fishery Management Council process (e.g., [28]).

2.3. Length and Age Distributions

Length and age frequencies were arranged into 10 mm SL bins and 1-year age bins, respectively. The mean, standard deviation, and range were calculated per length bin and age. To examine the extent of the variation in length-at-age, mean length-at-age was compared across age classes with a nonparametric test (Kruskal–Wallis) as the data were not normally distributed (Shapiro–Wilk test: W = 0.841, p < 0.001) and the variance was not homogenous (Bartlett test: K2 = 231.92, p < 0.001). Pairwise comparisons of the mean length-at-age across age classes were performed using Dunn’s test and a Hochberg correction [47]. These statistical tests were performed using the ‘stats’ and ‘FSA’ packages in R version 4.5.1 [48,49].

2.4. Sample Distribution Simulations

Based on the methodology presented in Bolser et al. [50], 2 simulations were performed to examine the effects of sample distribution on growth model parameters and to assess the completeness of our dataset. Simulated data were generated from a normal distribution using the calculated mean length-at-age and standard deviation for each age class using the ‘stats’ package in R [49]. Simulation #1 simulated 500 lengths for each age class (0–9). Simulation #2 randomly subsampled abundant ages to n and simulated lengths (as above) up to n for age classes with few ages. Two values of n (250 and 100) were used for Simulation #2 to see which value accurately captured the length distribution at age. The von Bertalanffy growth model (VBM) described below was fit to the simulated datasets as this was the best-fitting model (see Section 3.3). The VBM parameters and their 95% confidence intervals were calculated as above and compared among models.

2.5. Growth Models

Multiple growth models were used to fit length-at-age from otolith-based age estimates of sardine. These included the following: the von Bertalanffy growth model (VBM) attributable to Beverton and Holt [51,52]:
L t = L 1 e k ( t t 0 )
where Lt is the mean length at age t, L is the asymptotic mean length (mm SL), K is the growth rate coefficient at which Lt approaches L, and t0 is the theoretical age at which Lt is 0; the Gompertz growth model [53,54]:
L t = L e e g * T t *
where g* is the instantaneous growth rate at the inflection point, t*, which is also the maximum instantaneous growth rate, and T is the age [54,55]; and the logistic model [54,56]:
L t = L ( 1 e g T t * )
where g−∞ is the positive instantaneous growth rate as age approaches negative infinity.
Model parameters and confidence intervals were estimated using non-linear least squares regression with the ‘FSA’ v.0.9.3.9000 R package [48] and nlsBoot function from the ‘nlstools’ v.2.0-0 R package [57], respectively. Starting values were obtained by fitting the models to the observed data, and alternative starting values were used to confirm that a global minimum was obtained. The Akaike Information Criterion (AIC) [58] and the Bayesian Information Criterion (BIC) [59] were used to evaluate model fit using the ‘AICcmodavg’ v. 2.3.3 R package [60] and the ‘stats’ R package [49], respectively. The best-fitting model was selected based on the lowest AIC or BIC and models were ranked according to the AIC and BIC differences (Δ values). Models with Δ values from 0 to 2 were considered indistinguishable (explaining the data equally well), models with Δ values from 2 to 6 were considered somewhat supported (cannot be discounted as explaining the data well), and models with Δ values over 6 were considered as not supported (explaining the data poorly compared to other models [61,62,63]).

2.6. Growth Parameter Comparison

The growth parameters of sardine generated from this study were compared to those in previously published age and growth studies to evaluate spatial and temporal variability in growth patterns. We qualitatively compared our VBM growth parameters to VBM growth parameters from studies from the U.S. [9,43] and Mexico [34,35].
Length-at-age data in Dorval et al. [9] were generated from sardine collected during spring surveys in 1994 and from 2004 to 2010 using the same surface trawl methods as this study. We removed the 1994 data due to their large temporal separation from the remaining data, which are mostly continuous (i.e., 2004–2010 and 2012–2021) and which have been used in recent stock assessments (e.g., [28]). We calculated the mean length-at-age for each age class of the Dorval et al. [9] data and compared them to the mean length-at-age for each age class of the current data using the Wilcoxon rank sum test in the ‘stats’ R package [49], as the data were not normally distributed for any of the 8 comparisons (Shapiro–Wilk test: W = 0.944–996, p < 0.05) and the variance was not homogenous for 4 of the comparisons (Bartlett test: K2 = 4.14–16.44, p < 0.05). Dorval et al. [9] originally modeled sardine growth using a random mixed-effects approach, but we were able to make a direct comparison to the current data by fitting a standard VBM to their age and length data.

3. Results

3.1. Length and Age Distributions

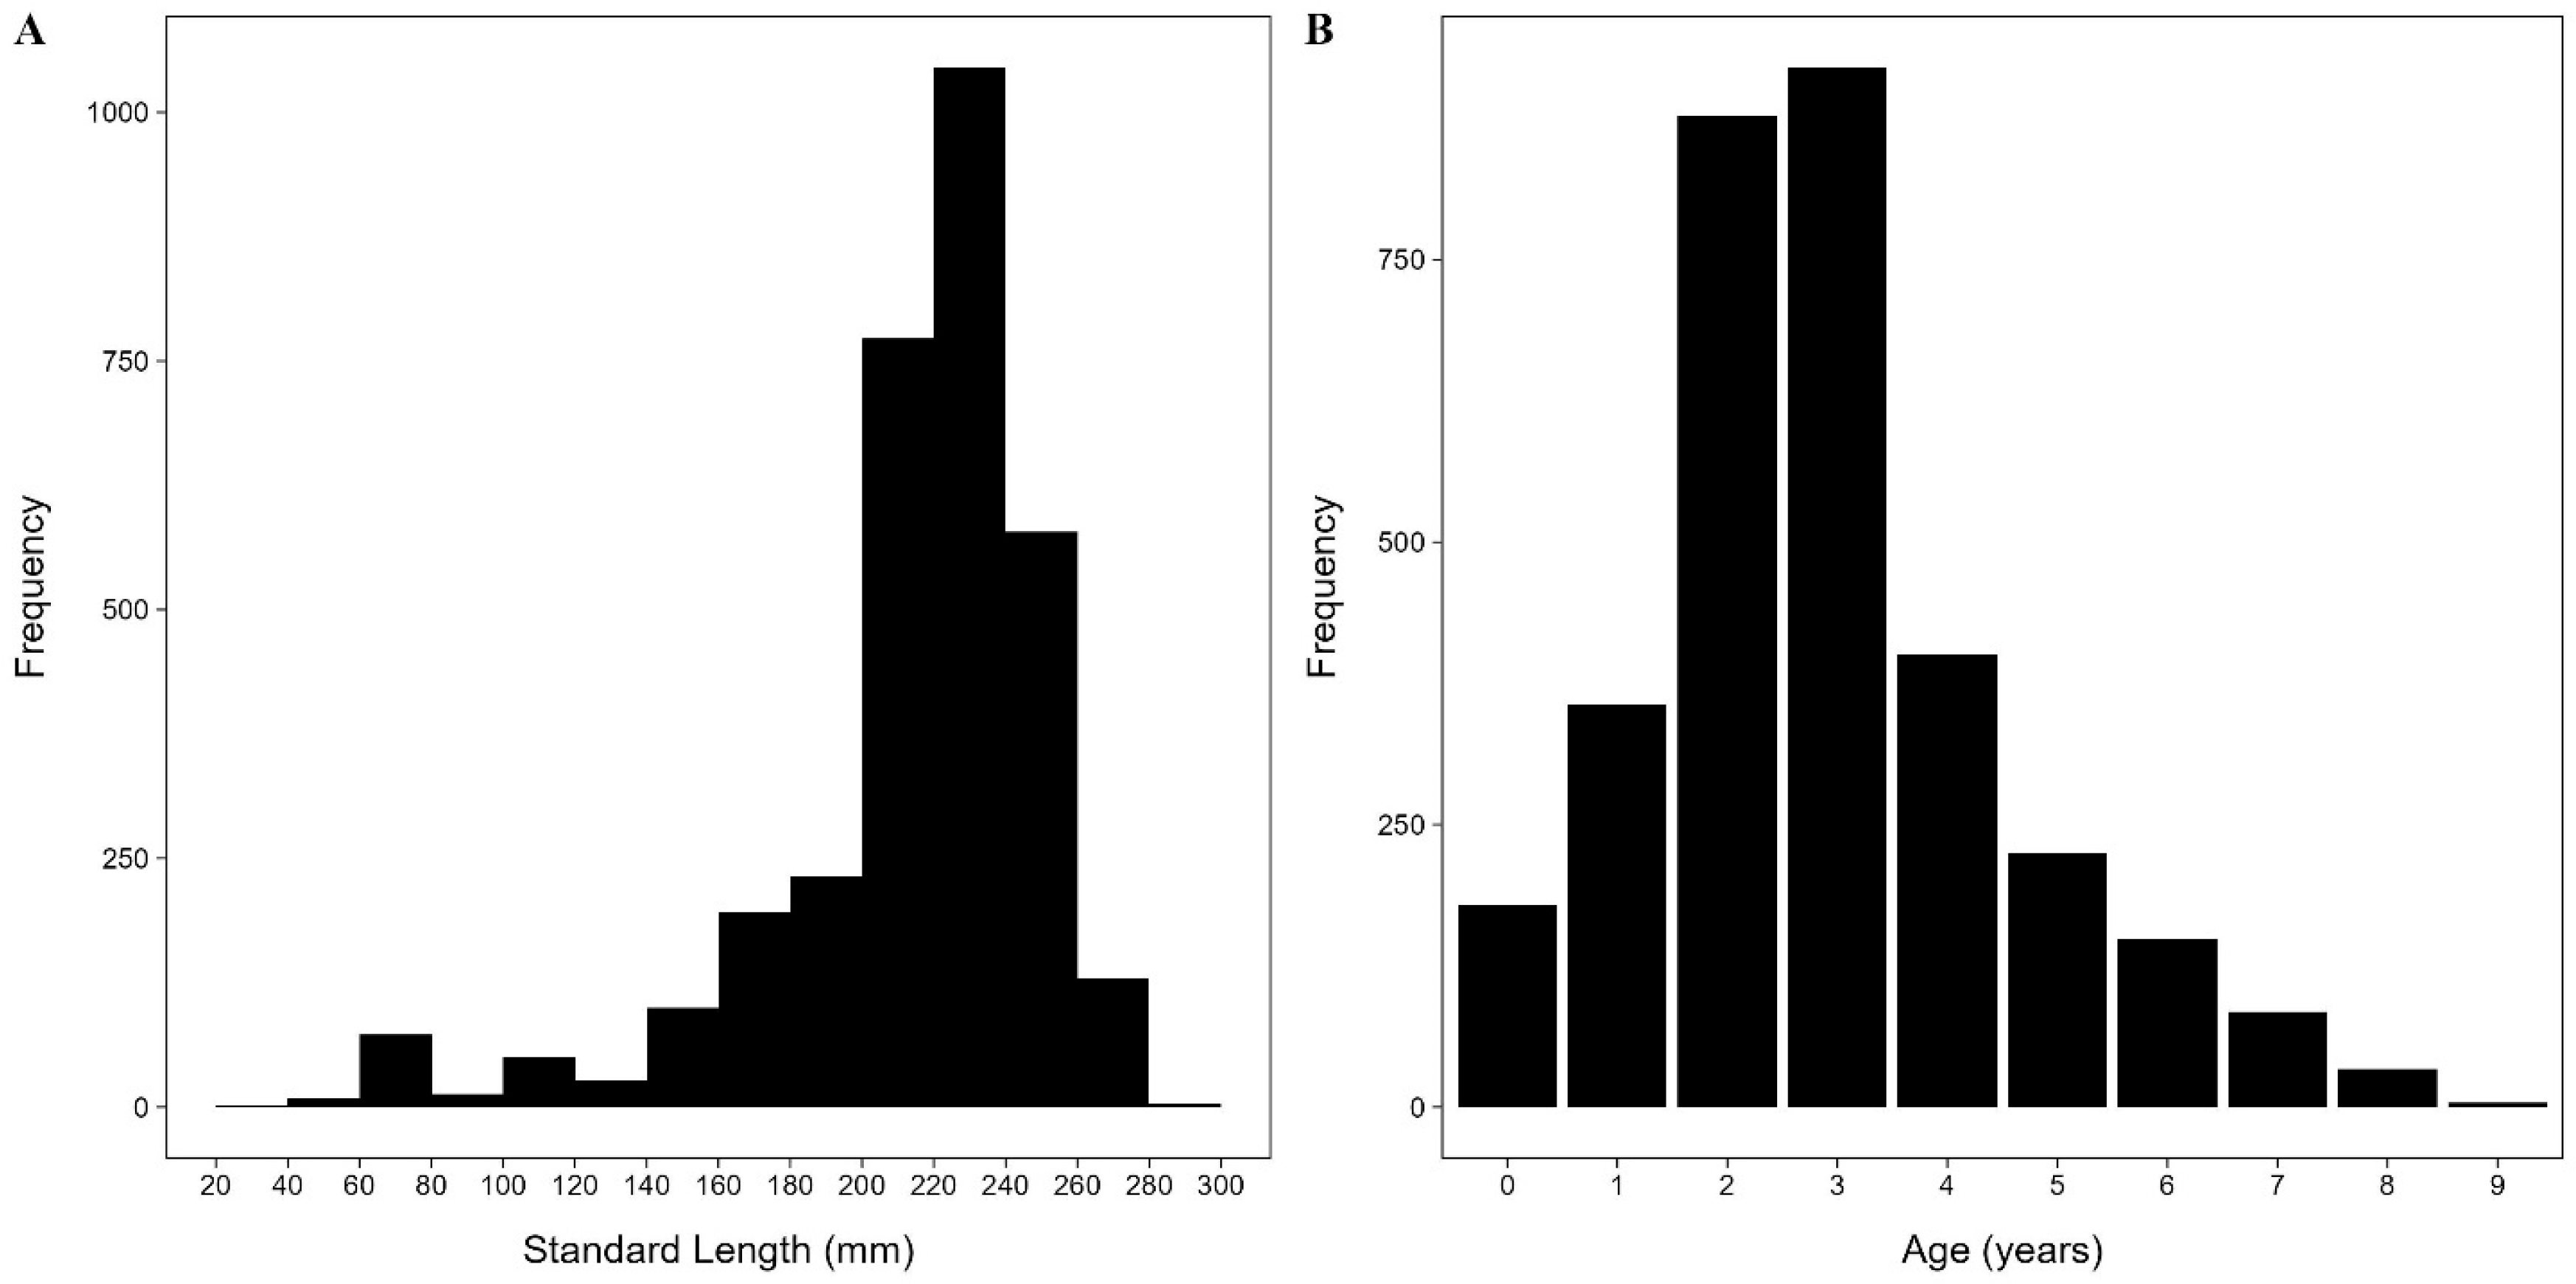
Age and length data were generated from a total of 3228 sardine sampled from 226 surface trawls during CPS Surveys conducted annually from 2012 to 2021. The length and age frequencies of sardine exhibited a unimodal distribution with length data skewed to the left and age data skewed to the right (Figure 3). Lengths from aged fish ranged from 30 to 291 mm SL (mean = 214.8 SL ± 39.4 SD), and estimated ages ranged from 0 to 9 years (mean = 2.9 years ± 1.7 SD). Age-3 was the most frequent age at 28.5% of the samples, followed by age-2, which accounted for 27.2% of the samples. Ages-6–9 together comprised a small percentage of the samples at 8.4%. The mean length, standard deviation, and count for each age class are presented in Table 1.
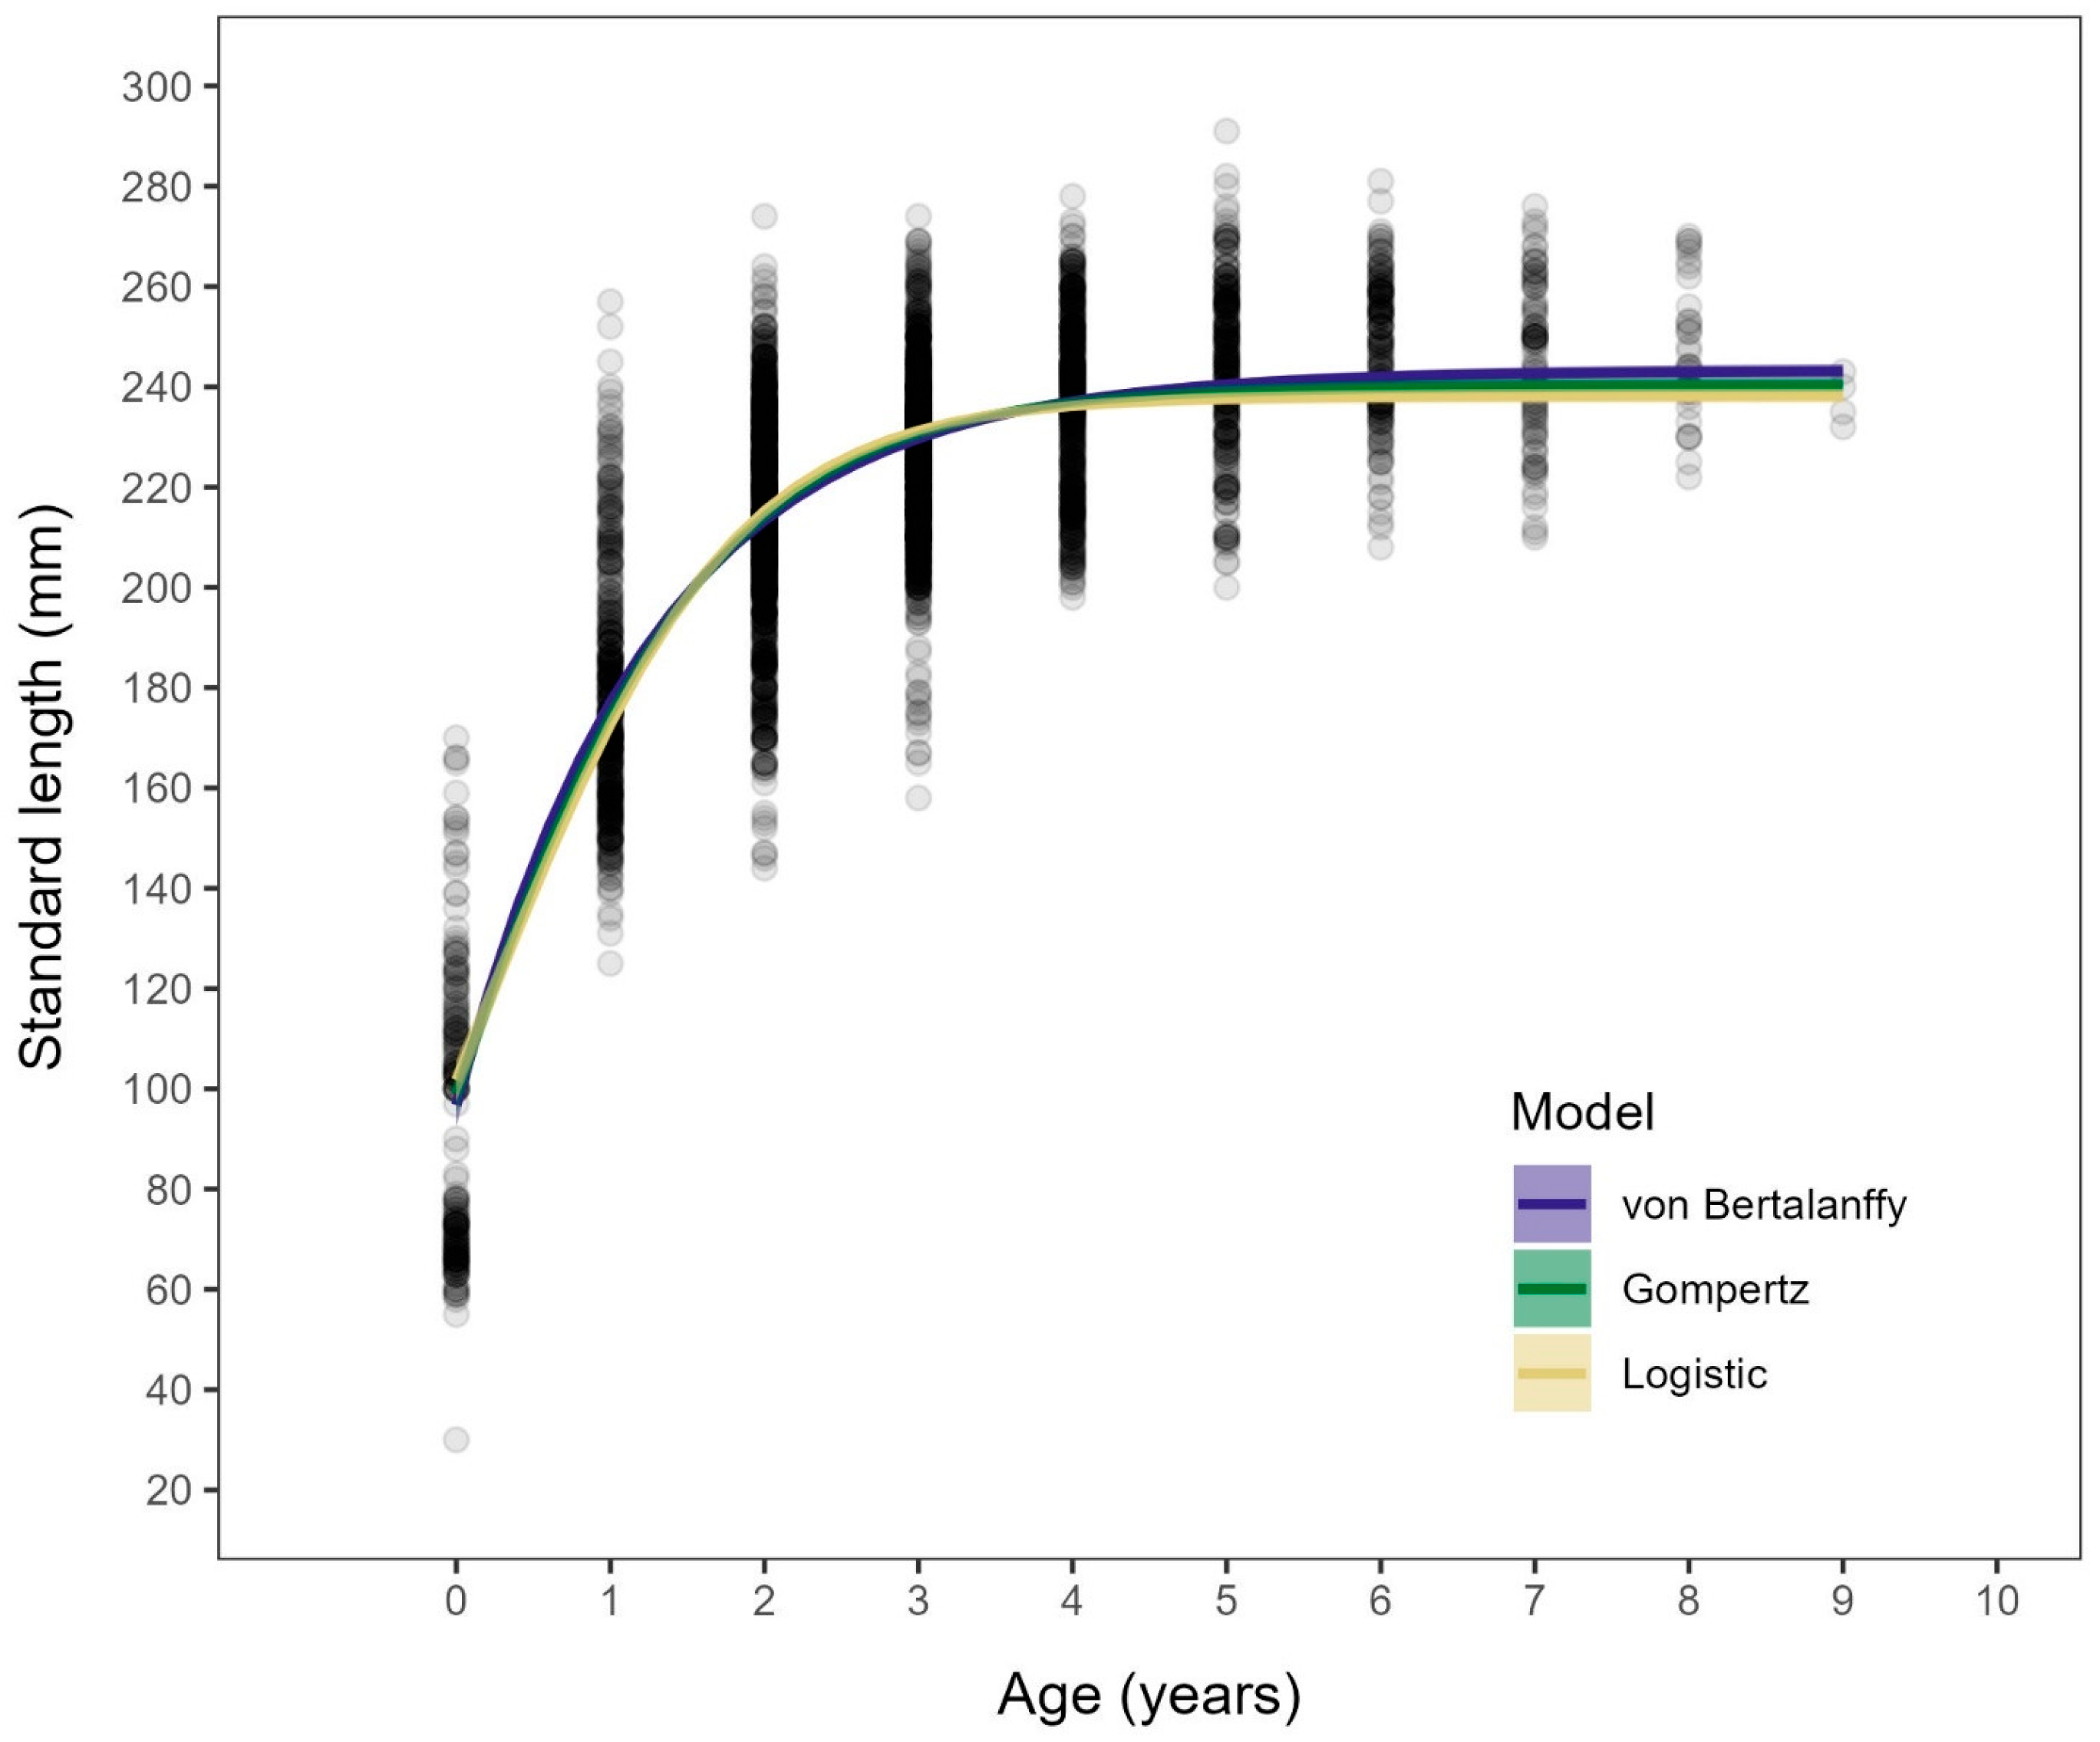
Length-at-age was highly variable, as can be seen by the range of lengths within each age class (i.e., their vertical spread; Figure 4). Even after growth plateaued around age-4, the range of lengths was high. For example, age-5 sardine ranged in length from 200 to 291 mm SL. Length-at-age differed among age classes (Kruskal–Wallis test: χ2 = 1666.8, df = 8, p < 0.001). Pairwise comparisons among age classes showed that age classes 0–3 were all different from each other; however, 5–9 were not (Table A1). Age-4 was different from 0–6, but not 7, 8, or 9 (Table A1). Age-9 was different from 0 and 1 but not different from 2–8 (Table A1). There was a high overlap of length distributions across age classes as well (horizontal overlap; Figure 4). For example, a 235 mm SL sardine could belong to age classes 1–9.

3.2. Sampling Distribution Simulations

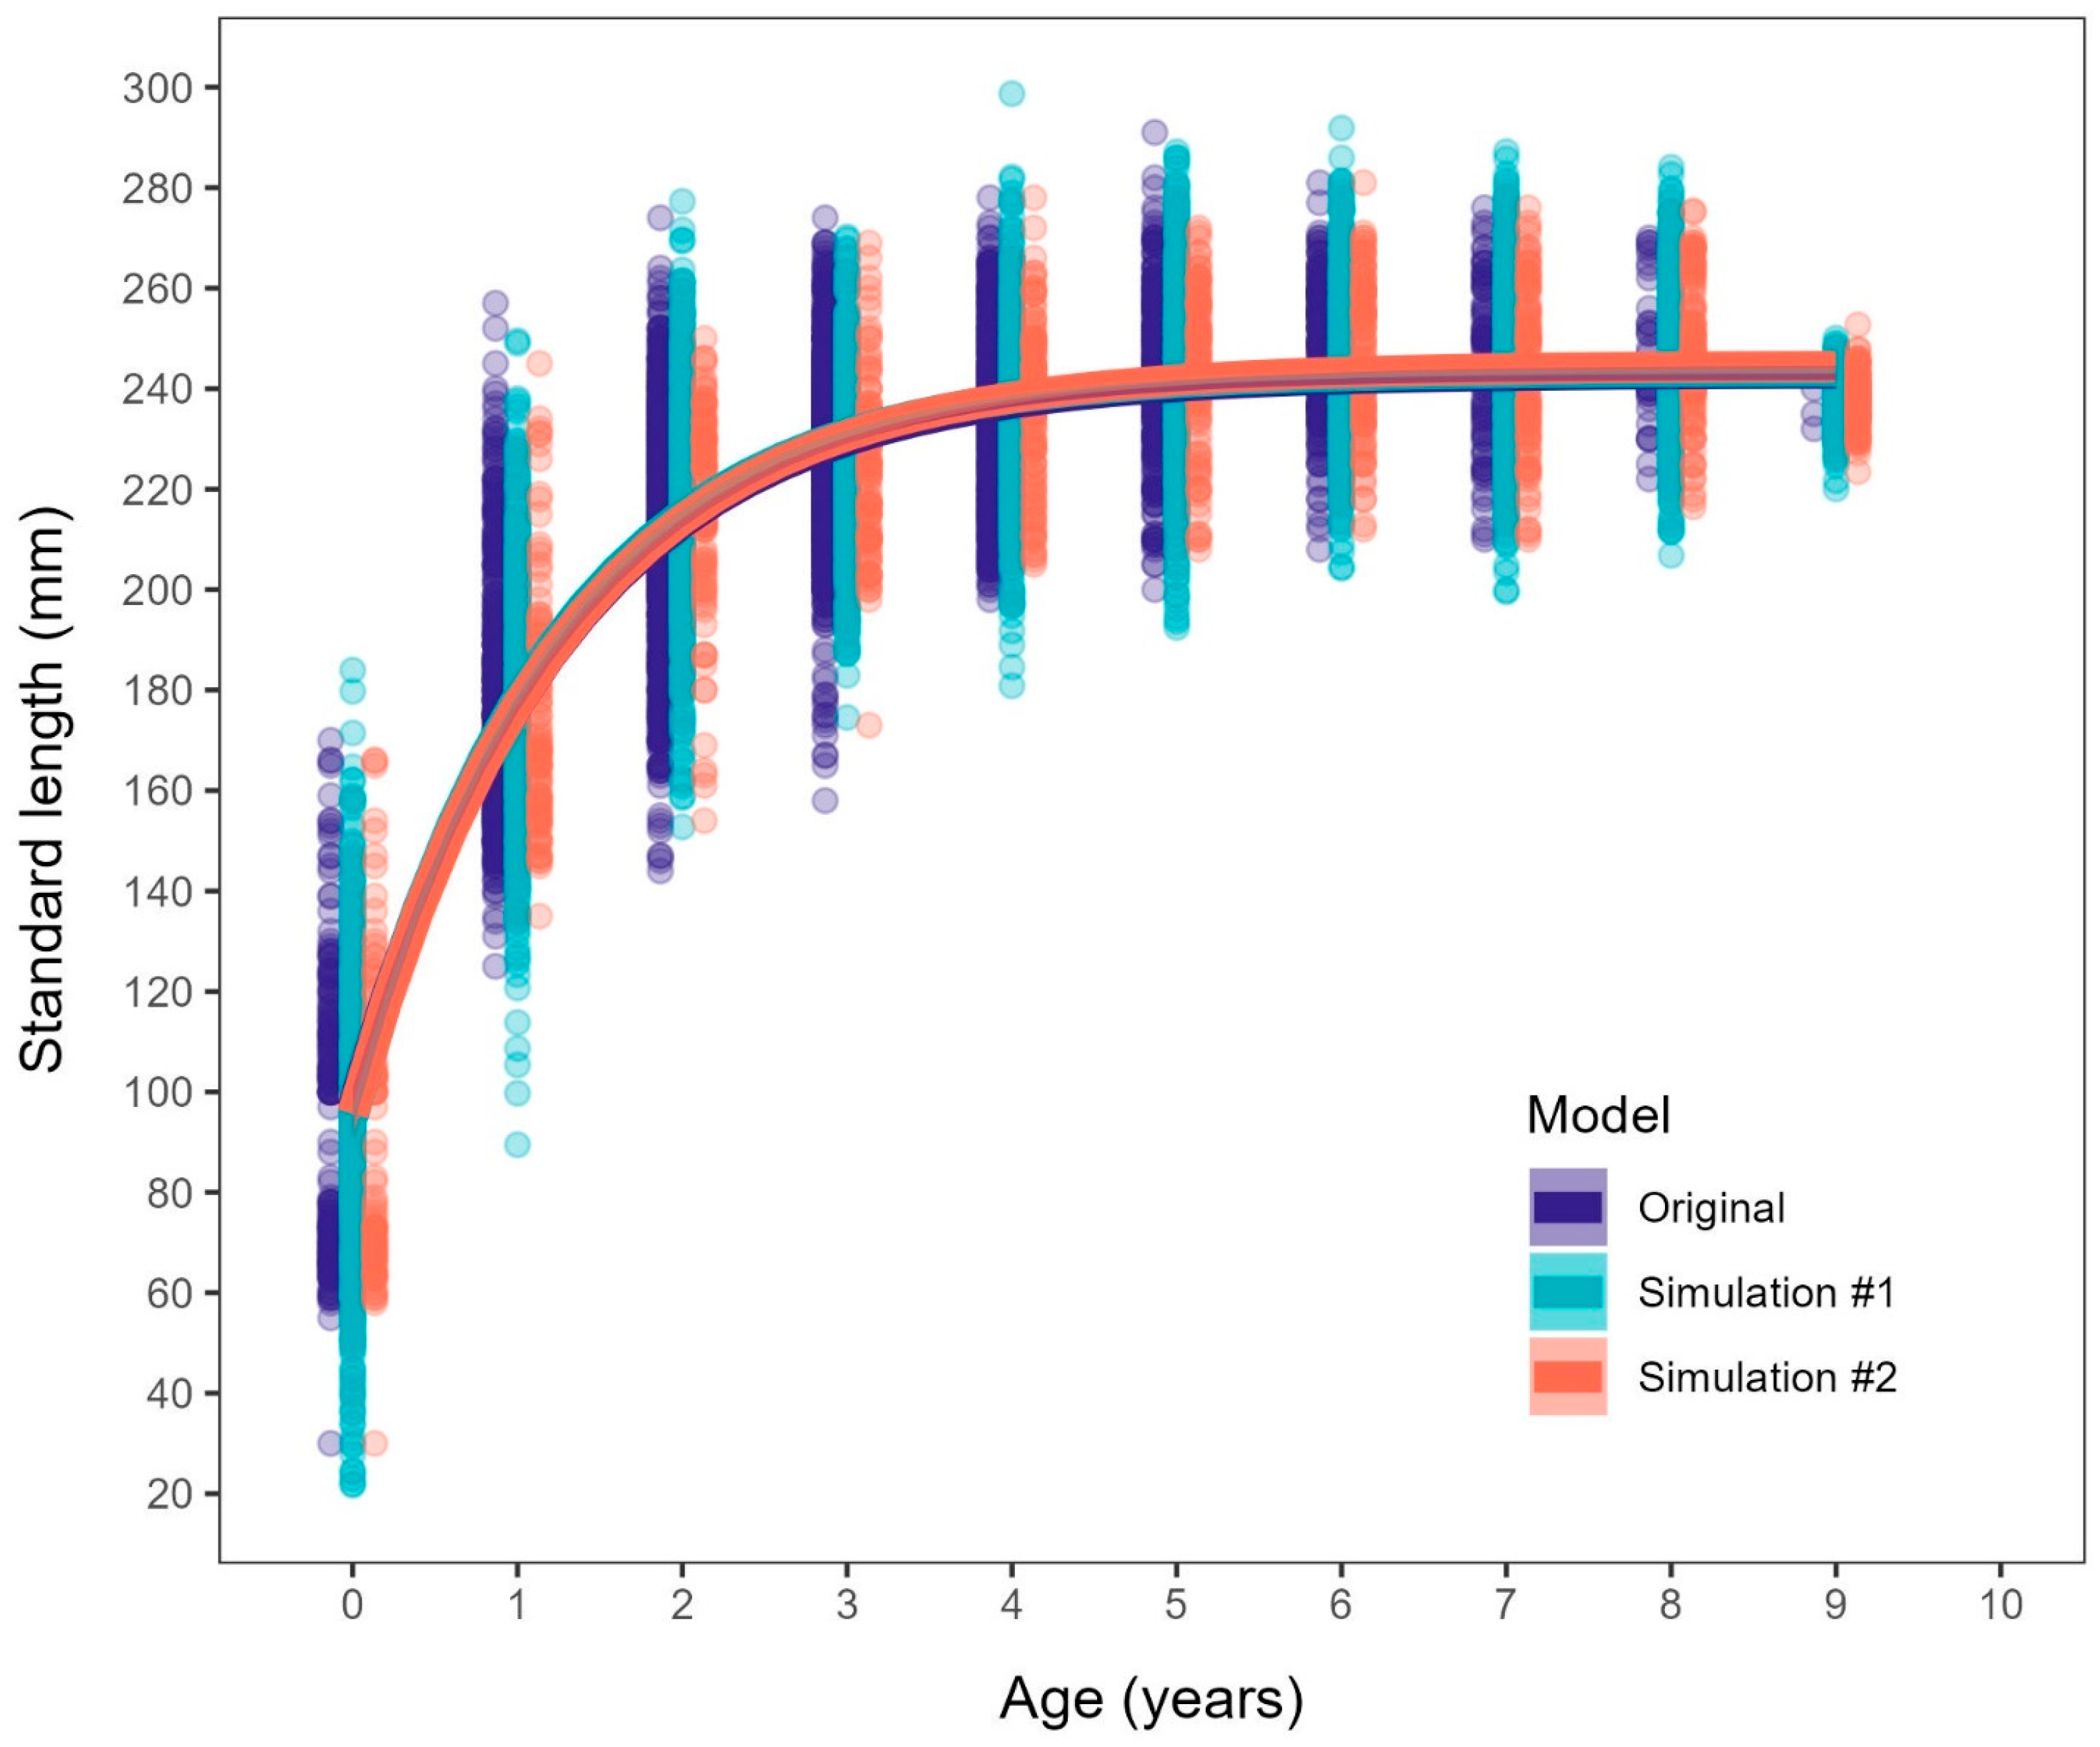
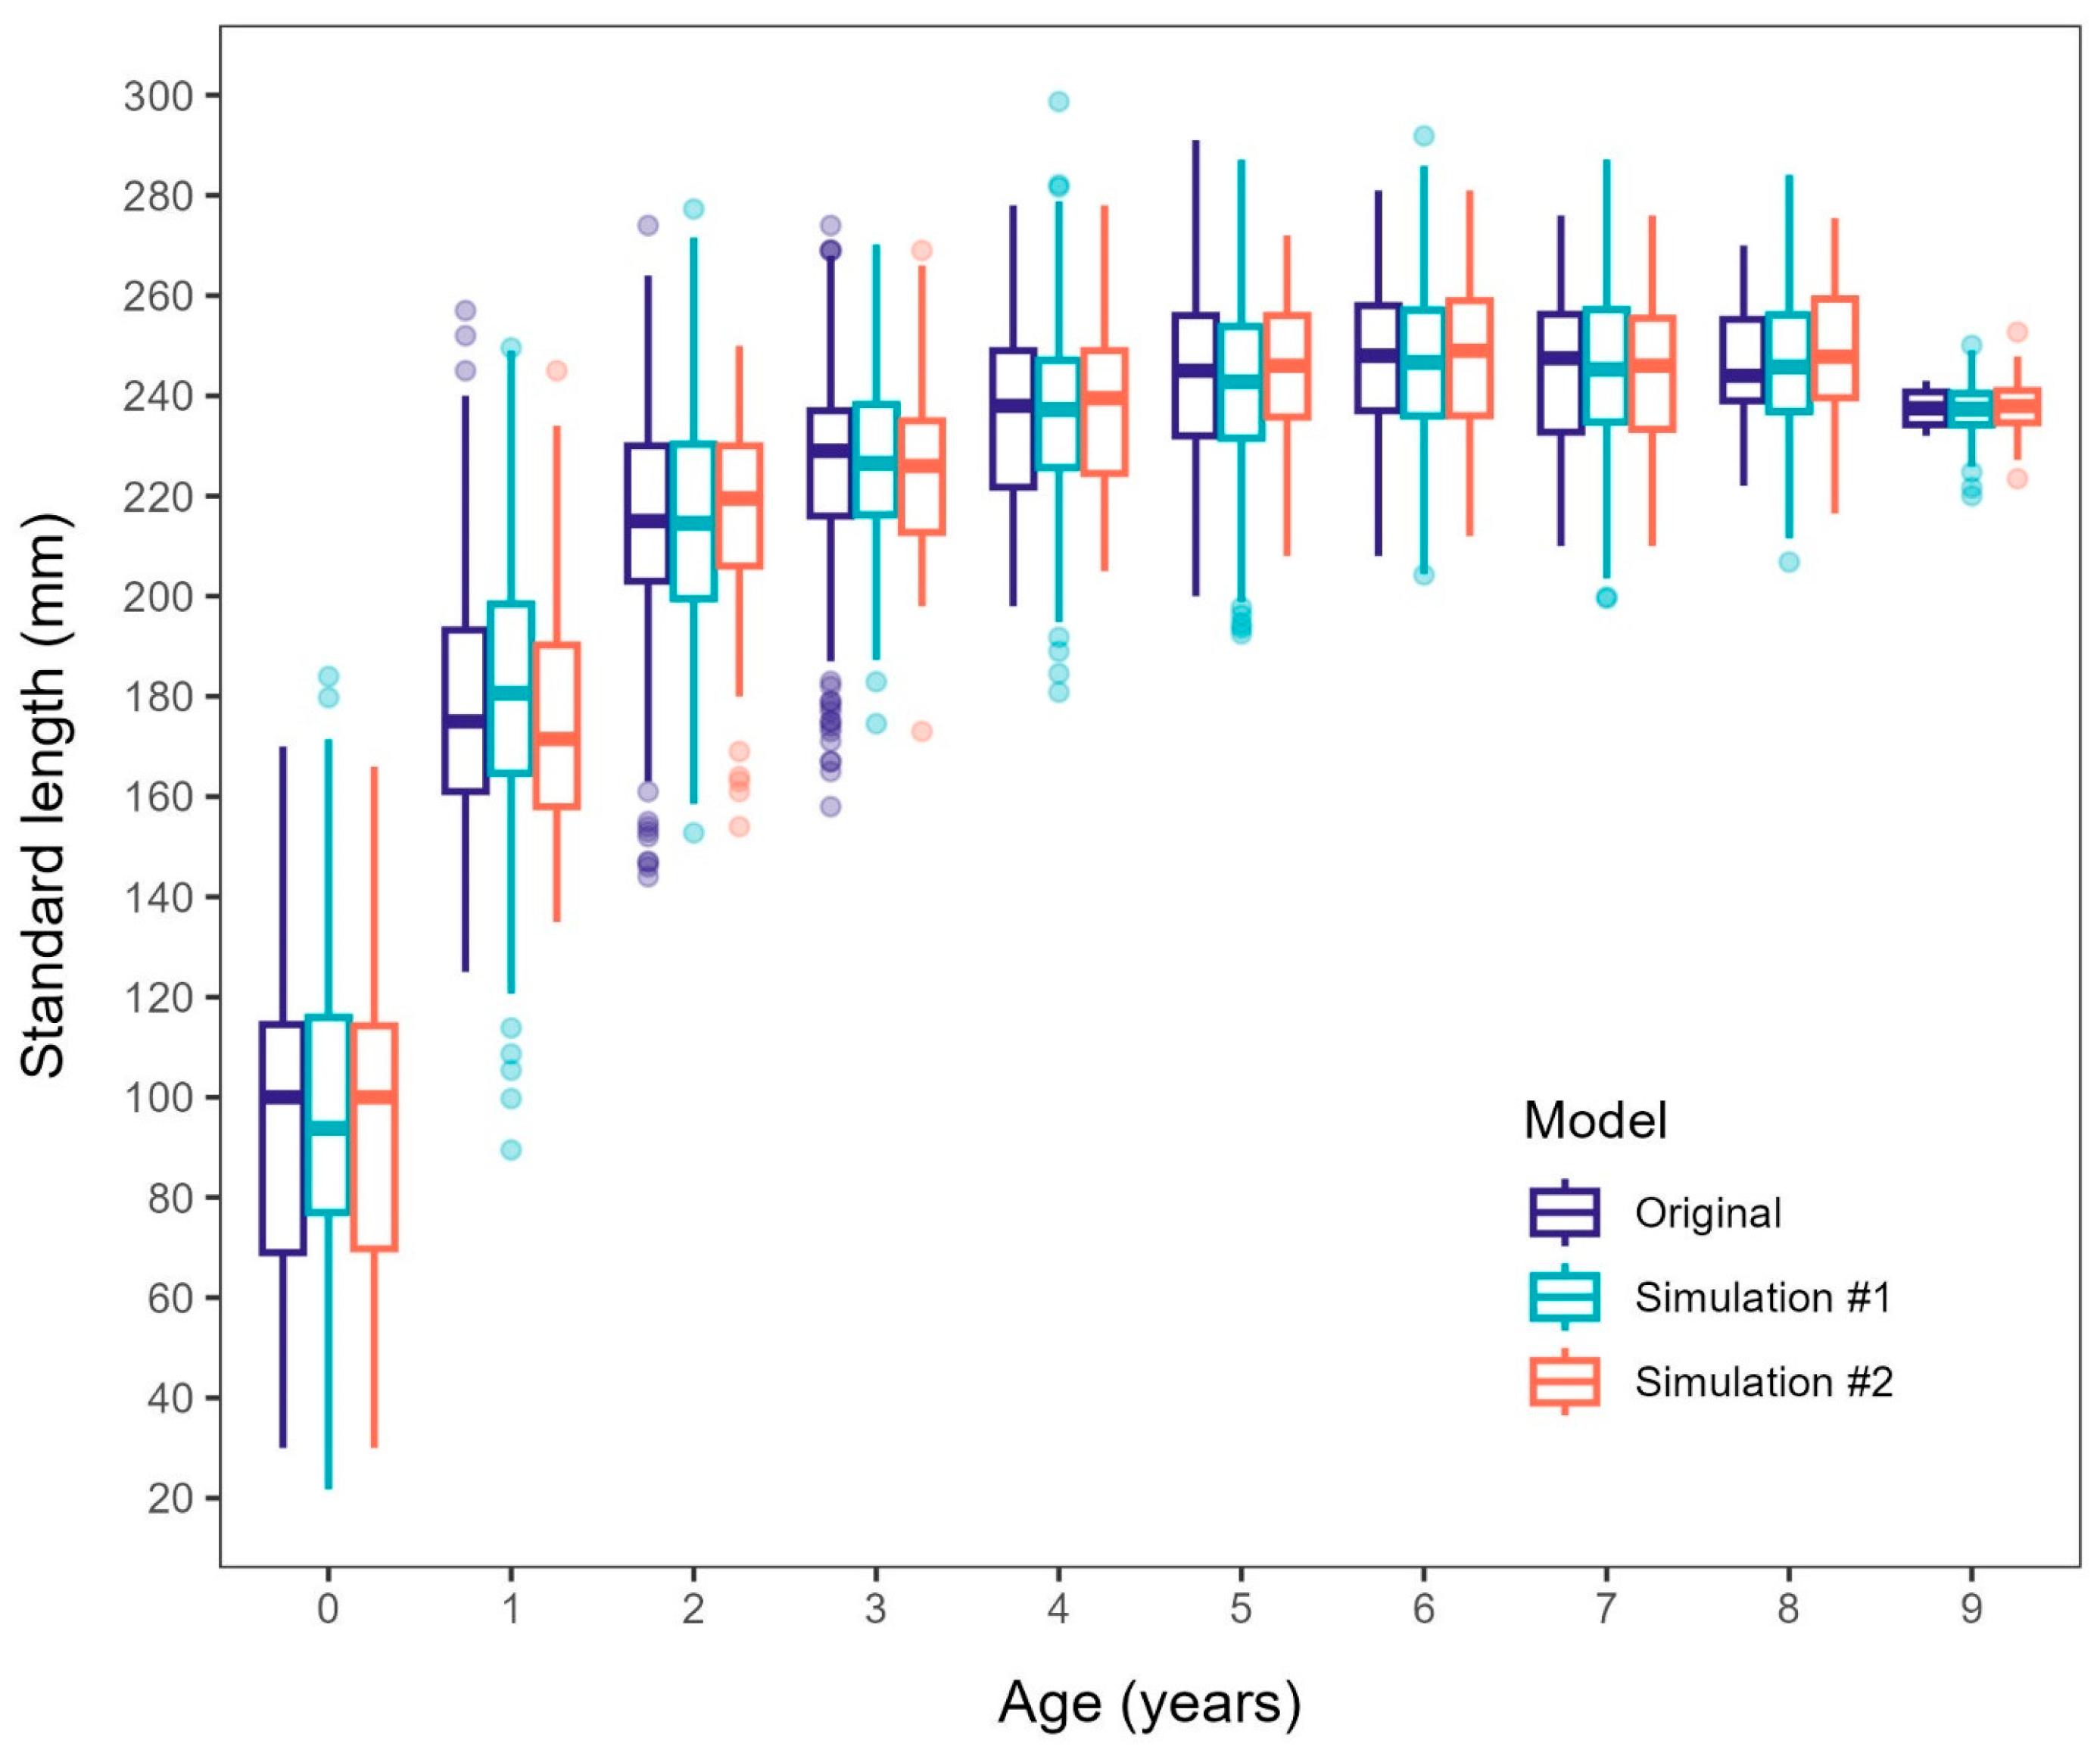
The mean length, standard deviation, and count for each age class (Table 1) were used for Simulations #1 and #2. For Simulation #2, both n = 100 and n = 250 had similar mean lengths-at-age and standard deviations that both accurately captured the length distribution at age (Table A2). For comparison across simulations, n = 100 was used, as more data (i.e., n = 250) did not capture the length distribution at age more accurately. The sample distributions among the original dataset and the two simulations were similar (Figure A1). The VBM and the 95% CIs of the parameter estimates overlapped between the original dataset, Simulation #1, and Simulation #2 (Figure 5; Table A3).

3.3. Growth Models

Parameters estimated from the VBM, Gompertz, and logistic growth models were generally similar (Table 2; Figure 4). The highest asymptotic length (L) was estimated with the VBM, followed by the Gompertz growth model. Estimates of growth rate (K, g*, g−∞), were highest in the logistic growth model, and lowest in the VBM. All three growth models showed rapid growth during the first 2 years and very little growth after age-4. According to the model selection criteria, the VBM had the best fit, while the Gompertz and logistic growth models had no support (Table 2).

3.4. Growth Parameter Comparisons

Study and growth parameters from Butler et al. [43], Dorval et al. [9], Nevárez-Martínez et al. [34], Enciso-Enciso et al. [35], and the current study are presented in Table 3. These studies had a large range of VBM parameters both within and between regions (Table 3). The estimated growth rate (K) differed greatly between the studies from the U.S. Pacific Coast (NSP). Dorval et al. [9] had the lowest K value of 0.264, while Butler et al. [43] had the highest K value of 1.19, and the current study had an intermediate value of 0.795. The studies off Baja California and in the Gulf of California (SSP and GOCSP, respectively) both had lower estimates of K compared to this study, with the sardine from Baja California having the lowest at 0.372 [35]. In general, estimates of L off the U.S. Pacific Coast were higher than estimates of L from Baja California and the Gulf of California (Table 3).
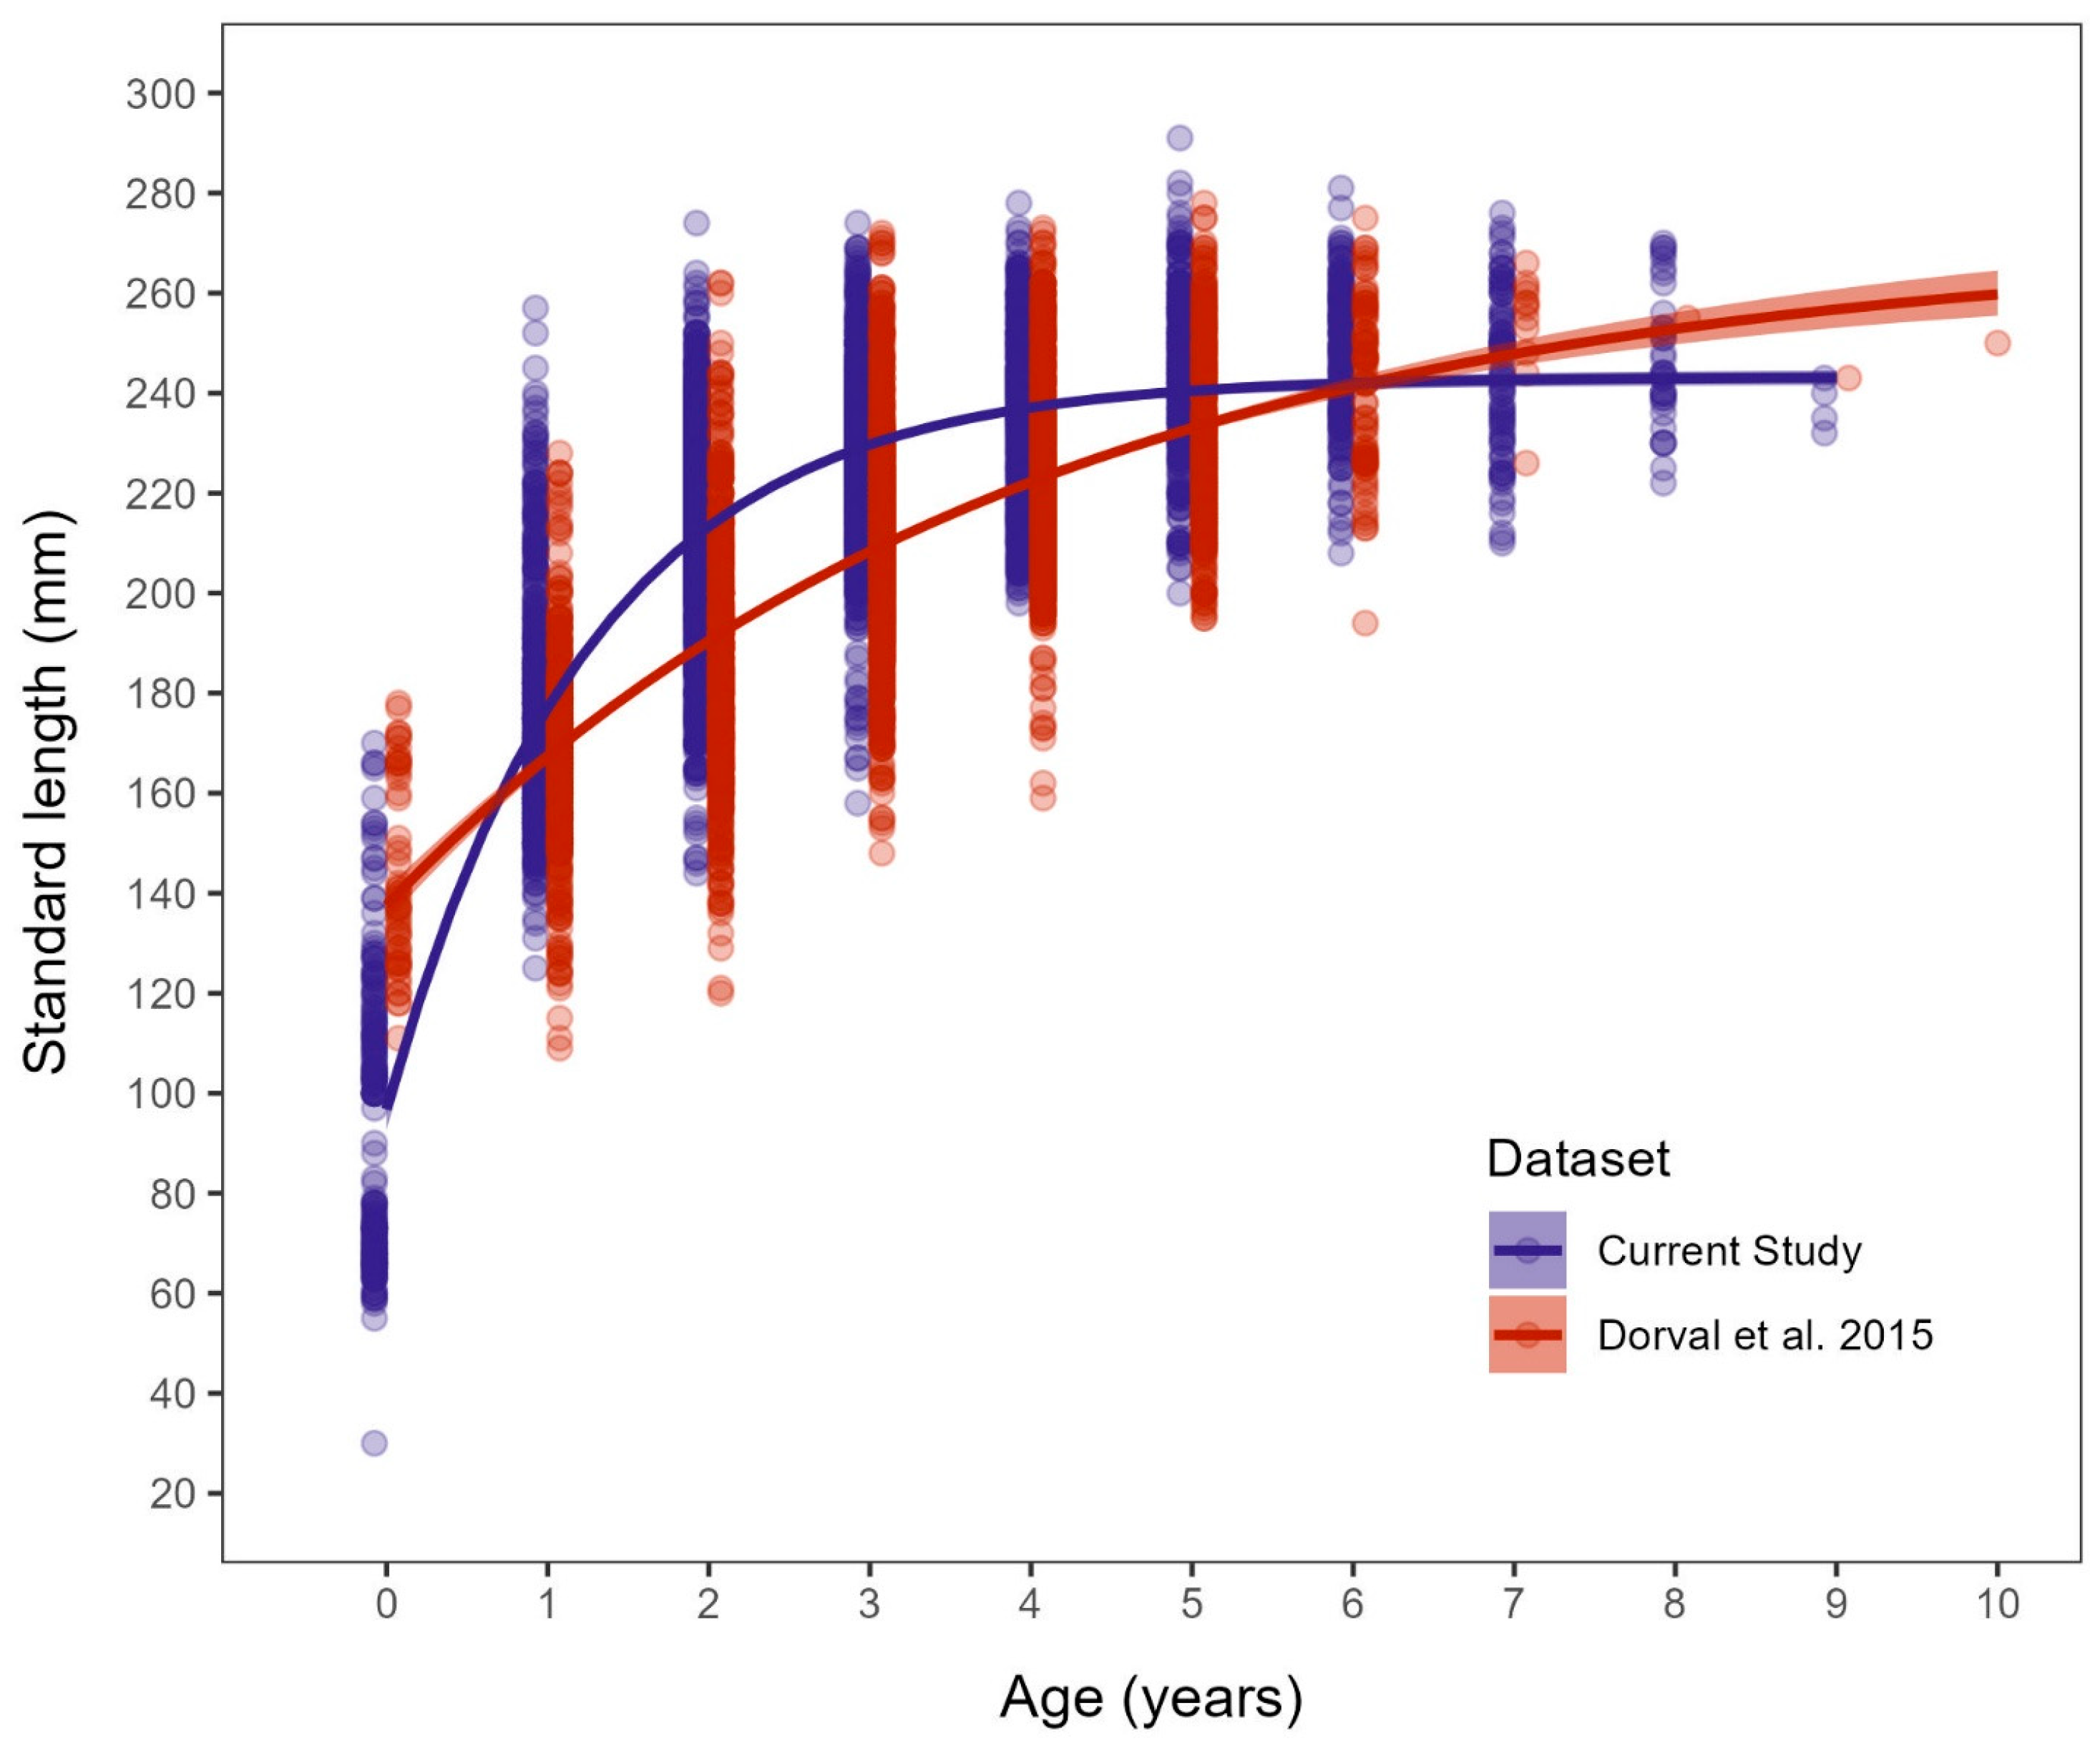
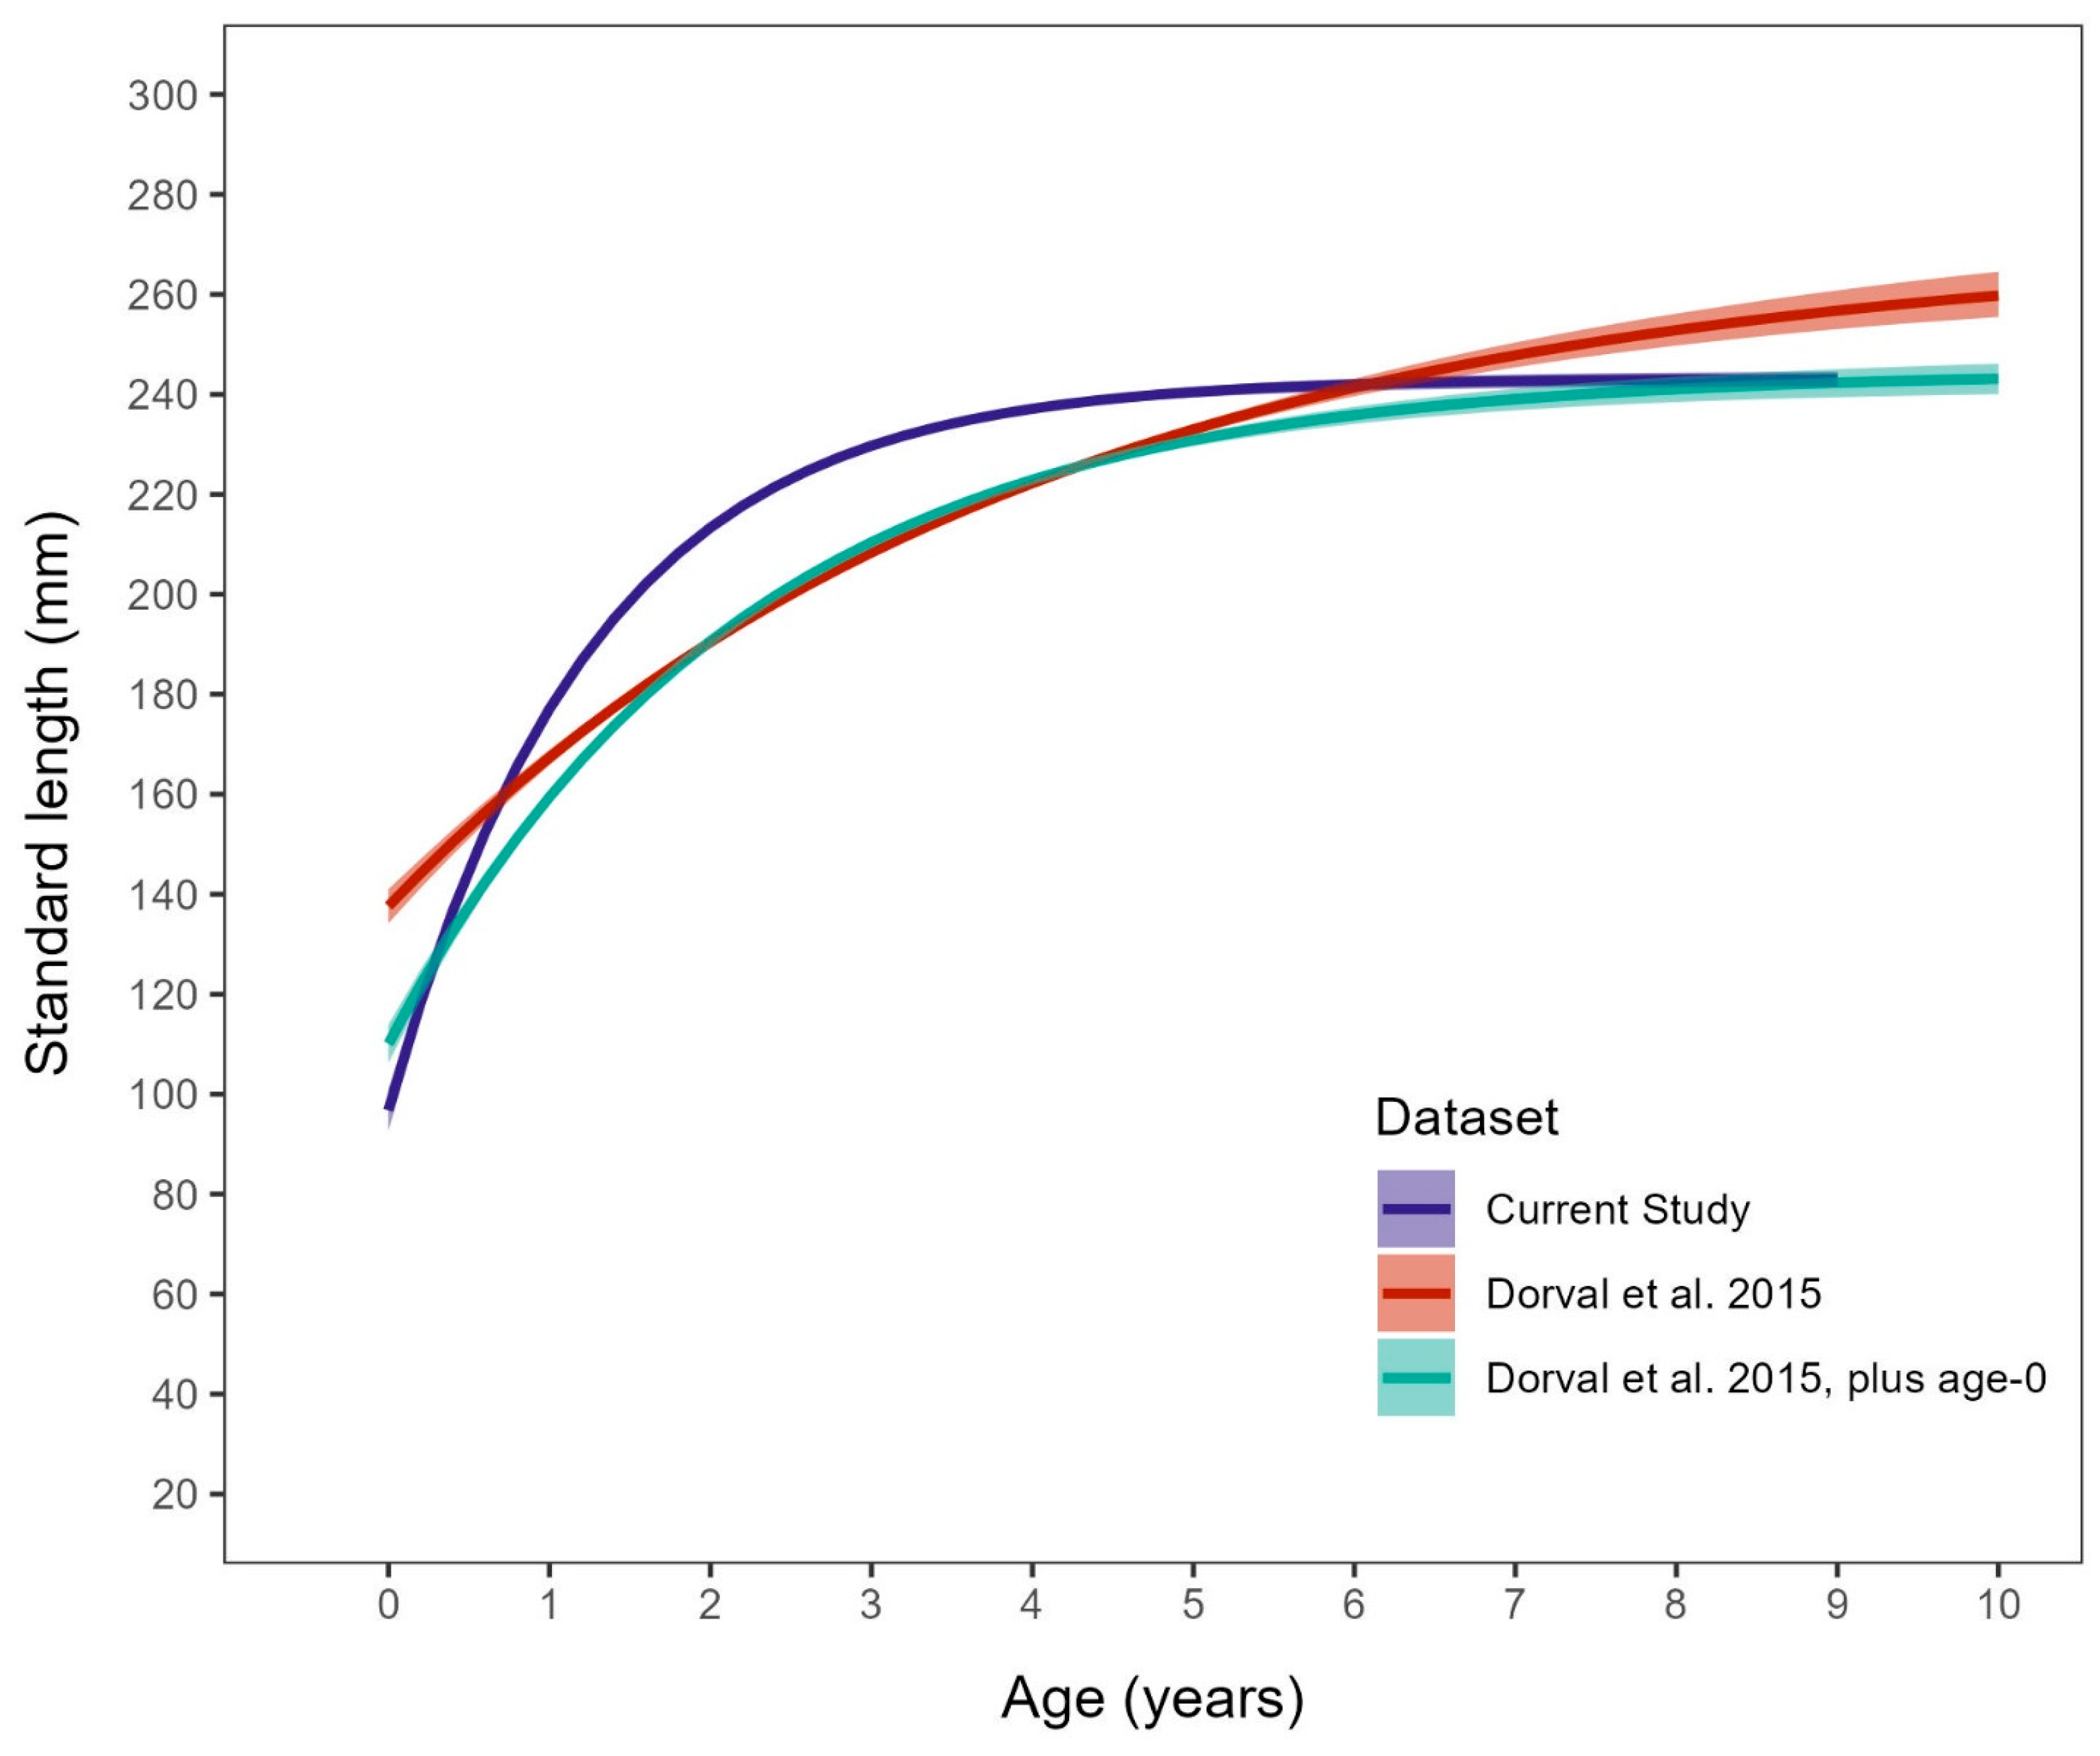
Mean length-at-age for Dorval et al. [9] was different from the current study for each age class tested (Table 1). The current study had a smaller mean length-at-age for age-0 and age-7 and a larger mean length-at-age for 1–6 (Table 1). Age classes 8–10 did not have a sufficient sample size to statistically compare the length-at-age. The VBM generated from the subset of data from 2004 to 2010 in Dorval et al. [9] differed considerably from that in the present study (Figure 6; L = 270.21 [CI 262.23–279.51], K = 0.254 [CI 0.221–0.288], t0 = −2.801 [CI = −3.157–−2.490]), and the two VBM curves did not have overlapping 95% CIs (Figure 6).

4. Discussion

The present study provides an improved understanding of somatic growth of sardine off the Pacific Coast of the U.S. Growth of sardine was best explained by the VBM, which facilitated comparisons of the results of this study with those from previous studies that also used the VBM. The observed growth pattern fits that predicted for small, pelagic marine fishes that follow an opportunistic life history strategy (i.e., r-selected) and that flourish in variable environmental conditions with frequent disturbances [10,11,64]. It also reflects how sardine grow fast during their first few years as non-migratory juveniles but grow slower as adults when more energy becomes allocated towards reproduction and migration, which is an evolutionary strategy observed in many fishes to increase survivorship during the juvenile phase and maximize lifetime fitness [65].
Individual variation in sardine growth rate is high; in the current study the length-at-age varied by 150 mm SL within a given age class, and a 235 mm SL individual could occupy any of up to nine age classes. This pattern indicates that growth in sardine is phenotypically plastic at the level of an individual fish and varies spatially and temporally in response to the environmental conditions experienced during its lifetime [12,66]. Phenotypic plasticity in somatic growth is predicted for species and populations with large geographic ranges that span large environmental gradients [67]. In sardine, each individual experiences large differences in environmental conditions in both time and space due to their broad geographic distribution, ontogenetic shifts in habitat and behavior, long-range seasonal migrations, protracted spawning seasons over a large spawning area, and other aspects of their life history [12]. This is also true on small spatiotemporal scales; for example, sardine exhibit diel vertical movements from deeper waters to the surface, and an individual may experience temperatures from 5.6 to 18.0 °C [68]. Phenotypic plasticity in growth was first suggested for sardine by Phillips [69] and is still supported, particularly in light of the lack of heritable (genotypic) differences among hypothesized subpopulations [12,40,41]. Large variations in individual length-at-age at seasonal, annual, and interannual time scales both within and among regions and fishing ports [9,13,69,70] may dampen any true signals of growth variation, either temporal or spatial [12].
When modeling somatic growth in fishes, it is important to sample fish from each age and length class in sufficient quantities regardless of their relative abundance in order to generate robust growth models and avoid invalid conclusions about growth [71,72,73]. This is because length and age data used to model somatic growth in marine fishes are highly susceptible to sample distribution bias, particularly for short-lived, fast-growing species [50,74]. For example, Bolser et al. [50] demonstrated that a biased sample distribution can result in an underestimated L and an overestimated K, stressing the importance of sufficiently sampling each size and age class. For this study, we analyzed 9 years of paired age and length data (2012–2021) that represented the full length (30–292 mm SL) and age (0–9 years) distribution of the species to generate a growth model of sardine during the recent period of low abundance. The results comparing the sample distributions and parameter estimates between the original dataset and the two simulations confirmed that the VBM was robust, and the dataset contained a sufficiently large sample size, length distribution, and age distribution to accurately represent the growth of the population.
The growth parameters described among the studies we compared varied considerably. This variation could be derived from individual variation, actual differences in growth, or artifacts of sampling bias. All of the comparison studies lacked young, small fish (<100 mm SL), which led to the underestimation of K [50,71]. With the length-at-age of the current study and Dorval et al. [9] plotted side-by-side (Figure 6), the effect that having fish < 100 mm SL has on the VBM parameters is apparent. To illustrate this, we added the small age-0s from the current study to the Dorval et al. [9] data (Figure 7). The addition of these small age-0s made the shape of the VBM more similar to the current study, and the resulting K would be larger than the original in Dorval et al. [9]. Instead of underestimating K, Butler et al. [43] chose to fix t0 at 0 due to a lack of young, small fish, which resulted in the overestimation of K and the underestimation of L [71]. Given the fixed t0 and low accuracy and precision in age estimates, the authors concluded that it was uncertain whether their resulting growth parameters were valid [43]. Nevárez-Martínez et al. [34] and Enciso-Enciso et al. [35] reported smaller estimates of L than the current study and Dorval et al. [9], which was likely driven by the lack of large (>226 mm SL) fish in the studies from Mexico. This discrepancy in sample distributions across studies presented challenges when comparing growth patterns among studies.
Sampling in different regions can contribute to differences in sample distributions across studies. The studies compared here generally had abutting geographic ranges but little overlap. The movement patterns of sardine are understudied, but Clark and Janssen [15] recovered tagged sardine that had traveled both north and south between fish reduction plants from Bahía Sebastián Vizcaíno, Baja California Sur, Mexico, to Vancouver Island, British Columbia, Canada, and demonstrated that larger fish move more extensively. McDaniel et al. [16] examined the age-at-length distribution of the NSP of sardine along the Pacific Coast of the U.S. and concluded that sardine aged 2 and older conduct seasonal northward and offshore movements. In U.S. waters, juvenile fish are most common in the nearshore south of Pt. Conception [17,18,19]. Dorval et al. [9] focused on the sardine core spawning area in offshore California waters; thus, they did not sample nearshore juvenile habitats, leading to a lack of small and immature age-0 fish. Therefore, size- or age-based movement patterns of sardine throughout their range may affect the availability of specific age classes in some regions during the times when sampling occurs (e.g., the Southern California Bight or Baja California and the Pacific Northwest). For example, the CPS Survey is conducted during the summer and fall when larger and older sardine that seasonally migrate are more abundant off the Pacific Northwest and less common off Southern California. This geographic separation of sizes could lead to erroneous conclusions about regional growth differences when the entire life history of sardine is not considered [12].
Another factor that may contribute to the differences in sample distribution is collection method. The current study and Dorval et al. [9] collected sardine via a fishery-independent survey that used a surface trawl at night with an 8 mm mesh codend [46]. The lack of small sardine collected for Dorval et al. [9] likely has more to do with season (see below) and location (see above) than with collection method. Both studies from Mexico relied on samples from fishery-dependent sources that used purse seines with a 25 mm mesh size [34,35]. The small mesh size of the fishery-independent collection would allow smaller sardine to be collected than those collected by the mesh used to collect fishery-dependent samples in Mexico. Additionally, Enciso-Enciso et al. [35] recognized that fishery-dependent collection may not sample the entire size range of the population, as small fish may not be recruited to the fishery and larger fish may be less abundant due to exploitation.
An often-overlooked factor that directly influences estimates of length-at-age is the aging protocol, which differed between the U.S. and Mexican studies. For the present study and that of Dorval et al. [9], a July 1 birthdate and the catch date are used to assign a final age and allow their allocation to a respective year class [32]. In contrast, no birthdate is assumed for fish collected off Baja California, and all ages are assigned based on a calendar year [32,35]. Additionally, there was a difference in the precision of final ages between the U.S. and Mexican studies. The Mexican studies used decimal ages at 0.5-year intervals, whereas the present study and Dorval et al. [9] aged sardine using annual increments. These differences in aging protocols could lead to small deviations in final age assignments (e.g., ±1 year), and given the short lifespan of sardine, these could produce very different modeled growth patterns and parameter estimates [75,76].
Season may also contribute to the differences in sample distribution among studies. Collections for each study were performed over different seasons, and this may have affected what sardine were available for collection. Dorval et al. [9] collected samples during spring between San Diego, CA, and San Francisco, CA, targeting adult sardine to assess the spawning stock biomass of the NSP. The historic fishery off Monterey, CA, did not collect fish smaller than 180 mm SL, and spring is the only time fish larger than 180 mm SL were found off San Diego, CA, within 15 miles of the coast [77]. Spawning is constrained by temperature [78,79,80] and other oceanographic factors [81] and while it can occur year-round it often has a peak in the Southern California Bight in spring and early summer (reviewed in [40]). Following the growth of sardine from hatch during peak spawning to the next spring when collection for Dorval et al. [9] was occurring, the available sardine would almost be 1 year old, which would correspond to fish greater than 100 mm SL. This combination of season, region, and target (adult sardine) would explain why there are no sardine < 120 mm SL in Dorval et al. [9]. In contrast, the current study collected sardine from June through September in most years, when fish a few months old and less than 100 mm SL were available to the net.
There has been a longstanding debate on whether density-dependent processes influence population dynamics (e.g., stock–recruitment relationships) in sardine, but findings have been inconsistent, ranging from a strong relationship to no relationship at all [20,82,83,84,85,86]. Between the current study and Dorval et al. [9] there are data on sardine growth across 17 years during both high- and low-abundance regimes. Dorval et al. [9] collected sardine during a time of high sardine abundance and reported that growth rate (K) and patterns in length-at-age of sardine cohorts born between 1986 and 2008 showed strong density-dependent effects, which they attributed to competition for resources (i.e., food availability). Given that our data were collected during a time of low sardine abundance, the higher growth rate and larger length-at-age for age classes 1–6 reported in the present study during a period of low abundance are consistent with these conclusions. The difference in stock abundance of sardine between Dorval et al. [9] and this study is striking. Sardine age-1+ biomass in 1994 and from 2004 to 2010 ranged from 817,419 to 3,017,338, with an average of 1,757,353 across years [21,22]. In comparison, the sardine age-1+ biomass from 2012–2021 ranged from 73,147 to 468,607 mt with an average of 144,635 mt [28]. While this correlation is compelling, we do not conclude that density dependence is the only plausible explanation (see other discussion points) for differences between the growth patterns reported in the current study and Dorval et al. [9].
Evidence of regional differences in growth patterns is also equivocal. The differences in reported growth parameters between studies in different regions can be explained by numerous factors related to sampling and methodological approaches. Moreover, the migratory behavior, broad spawning season and other aspects of the life history of sardine mean that individuals experience and respond to the environmental conditions of multiple regions. The seasonal and annual conditions of the entire species distribution itself are incredibly variable and dynamic, which is reflected in their high growth variation and large fluctuations in abundance. Therefore, while regional variations in growth are a plausible explanation for the differences in growth parameters between the current study, Nevárez-Martínez et al. [34], and Enciso-Enciso et al. [35], they are not the only plausible explanation.
Challenges in attempting to separate the drivers and relative influence of spatial and temporal variations in growth patterns are not unique to sardine. For example, age and growth studies on the European sardine (Sardina pilchardus) also show large variations in growth parameters which have been explained by differences in sample distribution, environmental conditions, exploitation, and population structure [87,88,89]. Density-dependent growth has also been proposed for the Japanese sardine (Sardinops melanosticta) in relation to food availability [90,91]; however, the published results are conflicting [92]. Additionally, Ohshimo et al. [93] found no relationship between larval and juvenile growth and stock size and a recent review by Sakuramoto [94] concluded that growth is determined by environmental conditions at the time of birth rather than density-dependent processes. Based on our results and our evaluations of other existing studies on sardine, we reached the same conclusion as authors studying sardine in other regions: without a method to control for these different explanations, we cannot conclude with any certainty which set—or, more likely, combination—of explanations (e.g., phenotypic plasticity, density dependence, sample distributions) best explains the reported differences in growth parameters between time periods, regions, and individual studies.


Author Contributions

Conceptualization, K.C.J., J.M.W. and B.E.E.; methodology, K.C.J., J.M.W., B.D.S. and E.D.; formal analysis, K.C.J. and B.D.S.; writing—original draft preparation, K.C.J. and J.M.W.; writing—review and editing, B.D.S., E.D. and B.E.E.; visualization, K.C.J. and B.D.S.; supervision, B.E.E. All authors have read and agreed to the published version of the manuscript.

Funding

This research received no external funding.

Institutional Review Board Statement

Fish were not directly collected for this research, therefore there was no ethical review and approval for this research. The fish were collected as part of the ongoing NOAA Coastal Pelagic Species Survey which has the appropriate scientific collection permits. NOAA is a federal agency and the survey is not subject to USDA/OLAW IACUC committee purview for fishes. NOAA’s policy is based on the USDA-Animal Welfare Act, which excludes fishes. While the survey is not covered under NOAA’s IACUC policy as per U.S. law, the survey nonetheless followed all relevant laws in the United States as well as all recommended procedures of the American Fisheries Society’s ‘Guidelines for the Use of Fishes in Research’. https://fisheries.org/policy-media/science-guidelines/guidelines-for-the-use-of-fishes-in-research/ (accessed on 23 April 2026).

Data Availability Statement

Data and analyses are available on GitHub. https://github.com/SWFSC/sardine_age_growth_2012-2021 (accessed on 10 May 2026).

Acknowledgments

We thank the SWFSC age readers. We also thank the participants in the SWFSC CPS Survey, which include individuals from the Life History, Fisheries Oceanography, and Advanced Survey Technologies Programs at SWFSC along with volunteers from other programs at SWFSC, other NOAA centers, and outside institutions. We also thank the NOAA Corps officers and crews of NOAA Ships Reuben Lasker and Bell M. Shimada. We thank M. Craig, and A. Yau of SWFSC for their internal review.

Conflicts of Interest

Author E. D. was employed by the company Ocean Associates, Inc. The remaining authors declare that the research was conducted in the absence of any commercial or financial relationships that could be construed as a potential conflict of interest.

Abbreviations

The following abbreviations are used in this manuscript:
NSPNorthern subpopulation
SSPSouthern subpopulation
GOCSPGulf of California subpopulation
CPSCoastal Pelagic Species
NOAANational Oceanic and Atmospheric Administration
SLStandard length
VBMVon Bertalanffy growth model

Appendix A

Table A1. p-values from the pairwise comparisons of mean lengths at each age class (0–9) from the present study using Dunn’s test with a Hochberg correction. p < 0.05 is significant and shown in bold.
012345678
1<0.001--------
2<0.001<0.001-------
3<0.001<0.001<0.001------
4<0.001<0.001<0.001<0.001-----
5<0.001<0.001<0.001<0.0010.004----
6<0.001<0.001<0.001<0.001<0.0011.000---
7<0.001<0.001<0.001<0.0010.0531.0001.000--
8<0.001<0.001<0.001<0.0010.0961.0000.9341.000-
9<0.0010.0030.4551.0001.0001.0001.0001.0001.000
Table A2. Mean length-at-age of Simulation #2 at n = 250 and 100.
AgeMean Length (mm)Standard DeviationCount
n = 250094.6728.076250
 1178.9724.687250
 2213.8920.203250
 3225.9516.036250
 4235.9517.975250
 5243.8516.661250
 6247.2014.749250
 7245.4316.568250
 8247.2213.789250
 9237.024.642250
n = 100095.4329.112100
 1177.3623.960100
 2216.5719.984100
 3225.7916.934100
 4236.8116.663100
 5243.9715.447100
 6247.1914.977100
 7244.3815.708100
 8248.0413.848100
 9237.755.204100
Table A3. Parameter estimates (and 95% confidence intervals) from fitting the von Bertalanffy growth model to sardine length-at-age from 3 datasets: (1) data collected between 2012 and 2021 (current study), (2) Simulation #1 (500 simulated lengths for each age class), and (3) Simulation #2 (100 lengths for each age class, mixed between real [subsampled] and simulated data). L is the asymptotic mean length, K is the growth rate coefficient, and t0 is the theoretical age at length 0. The degrees of freedom were n minus 3 for each dataset.
DatasetnL (mm)K (year-1)t0 (year)
Current Study3228243.22 (241.80, 244.73)0.795 (0.764, 0.827)−0.638 (−0.682, −0.601)
Simulation #15000243.65 (242.85, 244.41)0.823 (0.801, 0.848)−0.601 (−0.624, −0.575)
Simulation #21000244.54 (242.89, 246.15)0.792 (0.745, 0.843)−0.626 (−0.689, −0.575)
Figure A1. Boxplot comparing the sample distributions among the original dataset (2012–2021), Simulation #1 (n = 500 per age class), and Simulation #2 (n = 100 per age class). The horizontal line within each boxplot is the median, the box represents the interquartile range, the whiskers represent 1.5 times the interquartile range, and the points represent data outside 1.5 times the interquartile range.
Fishes 11 00290 g0a1

References

  1. Robertson, D.R.; Allen, G.R. Shorefishes of the Tropical Eastern Pacific: Online Information System, Version 3.0; Smithsonian Tropical Research Institute: Balboa, Panama, 2024. [Google Scholar]
  2. Szoboszlai, A.I.; Thayer, J.A.; Wood, S.A.; Sydeman, W.J.; Koehn, L.E. Forage species in predator diets: Synthesis of data from the California Current. Ecol. Inform. 2015, 29, 45–56. [Google Scholar] [CrossRef] [Scilit]
  3. Koehn, L.E.; Essington, T.E.; Marshall, K.N.; Sydeman, W.J.; Szoboszlai, A.I.; Thayer, J.A. Trade-offs between forage fish fisheries and their predators in the California Current. ICES J. Mar. Sci. 2017, 74, 2448–2458. [Google Scholar] [CrossRef] [Scilit]
  4. Wolf, P. Recovery of the sardine and the California sardine fishery. Calif. Coop. Ocean. Fish. Investig. Rep. 1992, 33, 76–86. [Google Scholar]
  5. Arreguín-Sánchez, F.; del Monte-Luna, P.; Zetina-Rejón, M.J.; Albáñez-Lucero, M.O. The Gulf of California Large Marine Ecosystem: Fisheries and other natural resources. Environ. Dev. 2017, 22, 71–77. [Google Scholar] [CrossRef] [Scilit]
  6. Parrish, R.H.; Serra, R.; Grant, W.S. The monotypic sardines, Sardinia and Sardinops: Their taxonomy, distribution, stock structure, and zoogeography. Can. J. Fish. Aquat. Sci. 1989, 46, 2019–2036. [Google Scholar] [CrossRef] [Scilit]
  7. Baumgartner, T.; Soutar, A.; Ferreira-Bartrina, V. Reconstruction of the history of sardine and northern anchovy populations over the past two millennia from sediments of the Santa Barbara Basin, California. Calif. Coop. Ocean. Fish. Investig. Rep. 1992, 33, 24–40. [Google Scholar]
  8. McClatchie, S.; Hendy, I.L.; Thompson, A.R.; Watson, W. Collapse and recovery of forage fish populations prior to commercial exploitation. Geophys. Res. Lett. 2017, 44, 1877–1885. [Google Scholar] [CrossRef] [Scilit]
  9. Dorval, E.; McDaniel, J.D.; Macewicz, B.J.; Porzio, D.L. Changes in growth and maturation parameters of sardine Sardinops sagax collected off California during a period of stock recovery from 1994 to 2010. J. Fish. Biol. 2015, 87, 286–310. [Google Scholar] [CrossRef] [Scilit]
  10. Blaxter, J.H.S.; Hunter, J.R. The biology of clupeoid fishes. In Advances in Marine Biology; Academic Press: Cambridge, MA, USA, 1982; Volume 20, pp. 1–223. [Google Scholar]
  11. King, J.R.; McFarlane, G.A. Marine fish life history strategies: Applications to fishery management. Fish. Manag. Ecol. 2003, 10, 249–264. [Google Scholar] [CrossRef] [Scilit]
  12. Erisman, B.; Craig, M.; James, K.; Schwartzkopf, B.; Dorval, E. Systematic review of somatic growth patterns in relation to population structure for sardine (Sardinops sagax) along the Pacific coast of North America. In NOAA Technical Memorandum; NMFS-SWFSC-708; NOAA’s National Marine Fisheries Service Scientific Publications Office: Silver Spring, MD, USA, 2005. [Google Scholar]
  13. Marr, J.C. The causes of major variations in the catch of the sardine, Sardinops caerulea (Girard). In Proceedings of the World Scientific Meeting on the Biology of Sardines and Related Species; Rosa, H., Murphy, G.I., Eds.; Food and Agriculture Organization of the United Nations III: Rome, Italy, 1960; pp. 667–791. [Google Scholar]
  14. McFarlane, G.A.; Smith, P.E.; Baumgartner, T.R.; Hunter, J.R. Climate variability and Pacific sardine populations and fisheries. Am. Fish. Soc. Symp. 2002, 32, 195–214. [Google Scholar]
  15. Clark, F.N.; Janssen, J.F., Jr. Movements and abundance of the sardine as measured by tag returns. Fish Bull. 1945, 61, 7–42. [Google Scholar]
  16. McDaniel, J.; Piner, K.; Lee, H.H.; Hill, K. Evidence that the migration of the northern subpopulation of sardine (Sardinops sagax) off the West Coast of the United States is age-based. PLoS ONE 2016, 11, e0166780. [Google Scholar] [CrossRef] [Scilit] [PubMed]
  17. Godsil, H.C. A discussion of the localities in which the California sardine (Sardina caerulea) was taken in the San Diego region, 1928–1929. In Division of Fish and Game of California Fish Bulletin; UC San Diego: Library—Scripps Digital Collection: San Diego, CA, USA, 1930; Volume 25, pp. 40–44. [Google Scholar]
  18. Scofield, E.C. Early life-history of the California sardine (Sardinia caerulea) with special reference to distribution of eggs and larvae. In Division of Fish and Game of California Bureau of Commercial Fisheries Fish Bulletin; UC San Diego: Library—Scripps Digital Collection: San Diego, CA, USA, 1934; Volume 41, pp. 1–51. [Google Scholar]
  19. Weber, E.D.; Chao, Y.; Chai, F.; McClatchie, S. Transport patterns of Pacific sardine Sardinops sagax eggs and larvae in the California Current System. Deep Sea Res. 2015, 100, 127–139. [Google Scholar]
  20. Murphy, G.I. Population biology of the sardine (Sardinops caerulea). In Proceedings of the California Academy of Sciences; 4th series; San Francisco California Academy of Sciences: San Francisco, CA, USA, 1966; Volume 34, pp. 1–84. [Google Scholar]
  21. Hill, K.T.; Crone, P.R.; Dorval, E.; Macewicz, B.J. Assessment of the Sardine Resource in 2016 for U.S.A. Management in 2016-17; NOAA Institutional Repository: Silver Spring, MD, USA, 2016.
  22. Kuriyama, P.T.; Zwolinski, J.P.; Hill, K.T.; Crone, P.R. Assessment of the sardine Resource in 2020 for U.S. Management in 2020-2021. In NOAA Technical Memorandum; NMFS-SWFSC-628; NOAA’s National Marine Fisheries Service Scientific Publications Office: Silver Spring, MD, USA, 2020. [Google Scholar]
  23. Hargreaves, N.B.; Ware, D.M.; McFarlane, G.A. Return of Pacific sardine (Sardinops sagax) to the British Columbia Coast in 1992. Can. J. Fish. Aquat. Sci. 1994, 51, 460–463. [Google Scholar] [CrossRef] [Scilit]
  24. Hill, K.T.; Dorval, E.; Lo, N.C.H.; Macewicz, B.J.; Show, C.; Félix-Uraga, R. Assessment of the Sardine Resource in 2007 for U.S. Management in 2008; NOAA Institutional Repository: Silver Spring, MD, USA, 2007.
  25. Clark, F.N. Dominant size-groups and their influence in the fishery for the California sardine (Sardina caerulea). In Division of Fish and Game of California Fish Bulletin; UC San Diego: Library—Scripps Digital Collection: San Diego, CA, USA, 1931; Volume 31, pp. 1–44. [Google Scholar]
  26. McClatchie, S. Regional Fisheries Oceanography of the California Current System: The CalCOFI Program; Springer: Dordrecht, The Netherlands, 2014. [Google Scholar]
  27. Nevárez-Martínez, M.O.; Morales-Bojórquez, E.; Martínez-Zavala, M.d.l.Á.; Villalobos, H.; Luquin-Covarrubias, M.; González-Máynez, V.E.; López-Martínez, J.; Santos-Molina, J.P.; Ornelas-Vargas, A.; Delgado-Vences, F. An integrated catch-at-age model for analyzing the variability in biomass of sardine (Sardinops sagax) from the Gulf of California, Mexico. Front. Mar. Sci. 2023, 10, 940083. [Google Scholar] [CrossRef] [Scilit]
  28. Kuriyama, P.T.; Allen Akselrud, C.; Zwolinski, J.P.; Hill, K.T. Assessment of the sardine resource (Sardinops sagax) in 2024 for U.S. management in 2024-2025. In NOAA Technical Memorandum; NMFS-SWFSC-698; NOAA’s National Marine Fisheries Service Scientific Publications Office: Silver Spring, MD, USA, 2024. [Google Scholar]
  29. Walford, L.A.; Mosher, K.H. Determination of the age of juveniles by scales and otoliths. In Studies on the Pacific Pilchard or Sardine (Sardinops caerulea); No. 15; U.S. Fish and Wildlife Series Special Scientific Report—Fisheries; NOAA’s National Marine Fisheries Service Scientific Publications Office: Silver Spring, MD, USA, 1943; pp. 31–95. [Google Scholar]
  30. Felin, F.E.; Phillips, J.B. Age and length composition of the sardine catch off the Pacific coast of the United States and Canada, 1941–1942 through 1946-47. In State of California Department of Natural Resources Division of Fish and Game Bureau of Marine Fisheries Fish Bulletin; UC San Diego: Library–Scripps Digital Collection: San Diego, CA, USA, 1948. [Google Scholar]
  31. Yaremko, M. Age determination in sardine, Sardinops sagax. In NOAA Technical Memorandum; NMFS-SWFSC-223; NOAA’s National Marine Fisheries Service Scientific Publications Office: Silver Spring, MD, USA, 1996. [Google Scholar]
  32. Dorval, E.; James, K.; Porzio, D.; Schwartzkopf, B.; Claiborne, A.; Topping, A.; Schultz, M. Age determination for managed and assessed coastal pelagic species in the northeast Pacific. In NOAA Technical Memorandum; NMFS-SWFSC-726; NOAA’s National Marine Fisheries Service Scientific Publications Office: Silver Spring, MD, USA, 2025. [Google Scholar]
  33. Fisheries and Oceans Canada. Pacific Region Integrated Fisheries Management Plan, Pacific Sardine. September 30, 2024 to May 31, 2029; 23-2365; Fisheries and Oceans Canada: Ottawa, ON, USA, 2024. [Google Scholar]
  34. Nevárez-Martínez, M.O.; Arzola-Sotelo, E.A.; López-Martínez, J.; Santos-Molina, J.P.; Martínez-Zavala, M.d.l.Á. Modeling growth of the sardine Sardinops caeruleus in the Gulf of California, Mexico, using the multimodel inference approach. Calif. Coop. Ocean. Fish. Investig. Rep. 2019, 60, 66–78. [Google Scholar]
  35. Enciso-Enciso, C.; Nevárez-Martínez, M.O.; Sánchez-Cárdenas, R.; Marín-Enríquez, E.; Salcido-Guevara, L.A.; Minte-Vera, C. Allometry and individual growth of the temperate sardine (Sardinops sagax) stock in the Southern California current system. Fishes 2022, 7, 226. [Google Scholar] [CrossRef] [Scilit]
  36. Zwolinski, J.P.; Demer, D.A. An updated model of potential habitat for northern stock sardine (Sardinops sagax) and its use for attributing survey observations and fishery landings. Fish. Oceanogr. 2024, 33, e12664. [Google Scholar] [CrossRef] [Scilit]
  37. PFMC (Pacific Fishery Management Council). Coastal Pelagic Fishery Management Plan as Amended Through Amendment 21. 2024. Available online: https://www.pcouncil.org/fishery-management-plan-and-amendments/ (accessed on 10 April 2026).
  38. Félix-Uraga, R.; Gómez-Muñoz, V.M.; Quiñónez-Velázquez, C.; Melo-Barrera, F.N.; García-Franco, W. On the existence of Sardine groups off the west coast of Baja California and southern California. Calif. Coop. Ocean. Fish. Investig. Rep. 2004, 45, 146–151. [Google Scholar]
  39. Smith, P.E. A history of proposals for subpopulation structure in the Pacific sardine (Sardinops sagax) population off western North America. Calif. Coop. Ocean. Fish. Investig. Rep. 2005, 46, 75–82. [Google Scholar]
  40. Craig, M.T.; Erisman, B.E.; Adams-Herrmann, E.S.; James, K.C.; Thompson, A.R. The subpopulation problem in sardine, revisited. In NOAA Technical Memorandum; NMFS-SWFSC-713; NOAA’s National Marine Fisheries Service Scientific Publications Office: Silver Spring, MD, USA, 2025. [Google Scholar]
  41. Longo, G.; D’Amelio, K.; Larson, W.; Enciso Enciso, C.; Torre, J.; Minich, J.; Michael, T.; Craig, M. Population genomics reveals panmixia in Pacific sardine (Sardinops sagax) of the North Pacific. Evol. Appl. 2025, 18, e70154. [Google Scholar] [CrossRef] [Scilit]
  42. PFMC (Pacific Fishery Management Council). November 2025 Decision Summary Document. 2025. Available online: https://www.pcouncil.org/november-2025-decision-summary-document/ (accessed on 10 April 2026).
  43. Butler, J.L.; Granados, G.M.L.; Barnes, J.T.; Yaremko, M.; Macewicz, B.J. Age composition, growth, and maturation of the sardine (Sardinops sagax) during 1994. Calif. Coop. Ocean. Fish. Investig. Rep. 1996, 37, 152–159. [Google Scholar]
  44. Zwolinski, J.P.; Emmett, R.L.; Demer, D.A. Predicting habitat to optimize sampling of sardine (Sardinops sagax). ICES J. Mar. Sci. 2011, 68, 867–879. [Google Scholar] [CrossRef] [Scilit]
  45. Demer, D.A.; Zwolinski, J.P. Corroboration and refinement of a method for differentiating landings from two stocks of Pacific sardine (Sardinops sagax) in the California Current. ICES J. Mar. Sci. 2014, 71, 328–335. [Google Scholar] [CrossRef] [Scilit]
  46. Dorval, E.; Porzio, D.; Schwartzkopf, B.D.; James, K.C.; Vasquez, L.; Erisman, B. Sampling methodology for estimating life history parameters of coastal pelagic species along the U.S. Pacific coast. In NOAA Technical Memorandum; NMFS-SWFSC-660; NOAA’s National Marine Fisheries Service Scientific Publications Office: Silver Spring, MD, USA, 2022. [Google Scholar]
  47. Hochberg, Y. A sharper Bonferroni procedure for multiple tests of significance. Biometrika 1988, 75, 800–802. [Google Scholar] [CrossRef]
  48. Ogle, D.H.; Doll, J.C.; Wheeler, P.; Dinno, A. FSA: Fisheries Stock Analysis, R Package, version 0.9.3; R Foundation for Statistical Computing: Vienna, Austria, 2022. Available online: https://CRAN.R-project.org/package=FSA (accessed on 15 March 2026).
  49. R Core Team. R: A Language and Environment for Statistical Computing; R Foundation for Statistical Computing: Vienna, Austria, 2025; Available online: https://www.R-project.org/ (accessed on 15 March 2026).
  50. Bolser, D.G.; Grüss, A.; Lopez, M.A.; Reed, E.M.; Mascareñas-Osorio, I.; Erisman, B.E. The influence of sample distribution on growth model output for highly-exploited marine fish, the Gulf Corvina (Cynoscion othonopterus). PeerJ 2018, 6, e5582. [Google Scholar] [CrossRef] [Scilit]
  51. von Bertalanffy, L. A quantitative theory of organic growth (inquiries on growth laws II). Hum. Biol. 1938, 10, 181–213. [Google Scholar]
  52. Beverton, R.; Holt, S.J. On the dynamics of exploited fish populations, Fishery Investigations Series II, Vol. XIX, Ministry of Agriculture. Fish. Food 1957, 1, 957. [Google Scholar]
  53. Gompertz, B. On the nature of the function expressive of the law of human mortality, and on a new mode of determining the value of life contingencies. Philos. Trans. R. Soc. Lond. 1825, 115, 513–583. [Google Scholar] [CrossRef] [Scilit]
  54. Ogle, D.H.; Brenden, T.O.; McCormick, J.K. Growth estimation: Growth models and statistical inference. In Age and Growth of Fishes: Principles and Techniques; Quist, M.C., Isermann, D.A., Eds.; American Fisheries Society: Bethesda, MD, USA, 2017; pp. 265–359. [Google Scholar]
  55. Ricker, W.E. Computation and Interpretation of Biological Statistics of Fish Populations; Bulletin of the Fisheries Research Board of Canada; Fisheries and Oceans Canada: Ottawa, ON, USA, 1975; Volume 191, pp. 1–382. [Google Scholar]
  56. Campana, S.E.; Jones, C.M. Analysis of otolith microstructure data. Can. Spec. Publ. Fish. Aquat. Sci. 1992, 117, 73–100. [Google Scholar]
  57. Baty, F.; Ritz, C.; Charles, S.; Brutsche, M.; Flandrois, J.P.; Delignette-Muller, M.L. A toolbox for nonlinear regression in R: The package nlstools. J. Stat. Softw. 2015, 66, 1–21. [Google Scholar] [CrossRef] [Scilit]
  58. Akaike, H. Information theory as an extension of the maximum likelihood principle. In Second International Symposium on Information Theory; Petrov, B.N., Csaki, F., Eds.; Akademiai Kiado: Budapest, Hungary, 1973. [Google Scholar]
  59. Schwarz, G. Estimating the dimension of a model. Ann. Stat. 1978, 6, 461–464. [Google Scholar] [CrossRef] [Scilit]
  60. Mazerolle, M.J. AICcmodavg: Model Selection and Multimodel Inference Based on (Q)AIC(c), R Package, version 2.3.3; R Foundation for Statistical Computing: Vienna, Austria, 2023. Available online: https://cran.r-project.org/package=AICcmodavg (accessed on 15 March 2026).
  61. Kass, R.E.; Raftery, A.E. Bayes Factors. J. Am. Stat. Assoc. 1995, 90, 773–795. [Google Scholar] [CrossRef]
  62. Burnham, K.P.; Anderson, D.R. Model Selection and Multi-Modal Inference: A Practical Information-Theoretical Approach; Springer: New York, NY, USA, 2002. [Google Scholar]
  63. Burnham, K.P.; Anderson, D.R.; Huyvaert, K.P. AIC model selection and multimodal inference in behavior ecology: Some background, observations, and comparisons. Behav. Ecol. Sociobiol. 2011, 65, 23–35. [Google Scholar] [CrossRef] [Scilit]
  64. Winemiller, K.O.; Rose, K.A. Patterns of life-history diversification in North American fishes: Implications for population regulation. Can. J. Fish. Aquat. Sci. 1992, 49, 2196–2218. [Google Scholar] [CrossRef] [Scilit]
  65. Quinn, T.J.; Deriso, R.B. Quantitative Fish Dynamics; Oxford University Press: Oxford, UK, 1999. [Google Scholar]
  66. Lorenzen, K. Toward a new paradigm for growth modeling in fisheries stock assessments: Embracing plasticity and its consequences. Fish. Res. 2016, 180, 4–22. [Google Scholar] [CrossRef] [Scilit]
  67. Enbody, E.D.; Pettersson, M.E.; Sprehn, C.G.; Andersson, L. Ecological adaptation in European eels is based on phenotypic plasticity. Proc. Natl. Acad. Sci. USA 2021, 118, e2022620118. [Google Scholar] [CrossRef] [Scilit] [PubMed]
  68. Inagake, D.; Hirano, T. Vertical distribution of the Japanese sardine in relation to temperature an thermocline at the purse seine fishing grounds east of Japan. Bull. Jap. Soc. Sci. Fish. 1983, 49, 1533–1539. [Google Scholar] [CrossRef] [Scilit]
  69. Phillips, J.B. Growth of the sardine, Sardinops caerulea, 1941–1942 through 1946-47. In State of California Department of Natural Resources Division of Fish and Game Bureau of Marine Fishes Fish Bulletin; UC San Diego: Library—Scripps Digital Collection: San Diego, CA, USA, 1948; Volume 71, pp. 1–33. [Google Scholar]
  70. Wolf, R.S. Age Composition of the Sardine 1932-1960; Research Report 53; Fish and Wildlife Service, United States Department of Interior: Washington, DC, USA, 1961.
  71. Gwinn, D.C.; Allen, M.S.; Rogers, M.W. Evaluation of procedures to reduce bias in fish growth parameter estimates resulting from size-selective sampling. Fish. Res. 2010, 105, 75–79. [Google Scholar] [CrossRef] [Scilit]
  72. Coggins, L.G., Jr.; Gwinn, D.C.; Allen, M.S. Evaluation of age–length key sample sizes required to estimate fish total mortality and growth. Trans. Am. Fish. Soc. 2013, 142, 832–840. [Google Scholar] [CrossRef] [Scilit]
  73. Miranda, L.E.; Colvin, M.E. Sampling for age and growth estimation. In Age and Growth of Fishes: Principles and Techniques; Quist, M.C., Isermann, D.A., Eds.; American Fisheries Society: Bethesda, MD, USA, 2017; pp. 107–126. [Google Scholar]
  74. Schemmel, E.; Bohaboy, E.C.; Kinney, M.J.; O’Malley, J.M. An assessment of sampling approaches for estimating growth from fishery-dependent biological samples. ICES J. Mar. Sci. 2022, 79, 1497–1514. [Google Scholar] [CrossRef] [Scilit]
  75. Liu, Y.; Zhang, C.; Xu, B.; Xue, Y.; Ren, Y.; Chen, Y. Accounting for seasonal growth in per-recruit analyses: A case study of four commercial fish in coastal China Seas. Front. Mar. Sci. 2021, 8, 567240. [Google Scholar] [CrossRef] [Scilit]
  76. Schwartzkopf, B.D.; Dorval, E.; Porzio, D.L.; Walker, J.M.; James, K.C.; Erisman, B.E. Modeling somatic and otolith growth of the central subpopulation of northern anchovy (Engraulis mordax) by incorporating seasonality. Fish Bull. 2023, 121, 172–187. [Google Scholar] [CrossRef] [Scilit]
  77. Godsil, H.C. The commercial catch of adult California sardines (Sardina caerulea) at San Diego. In California Division of Fish and Game Fish Bulletin; UC San Diego: Library—Scripps Digital Collection: San Diego, CA, USA, 1931; Volume 31, pp. 45–55. [Google Scholar]
  78. Tibby, R.B. The relation between surface water temperature and the distribution of spawn of the California sardine. Calif. Fish. Game 1937, 23, 132–137. [Google Scholar]
  79. Ahlstrom, E.H. A Review of the Effects of the Environment on the Pacific Sardine; ICNAF Special Publication: Dartmouth, NS, Canada, 1965; Volume 6, pp. 53–74. [Google Scholar]
  80. Lluch-Belda, D.; Lluch-Cota, D.B.; Hernandez-Vazquez, S.; Salinas-Zavala, C.A.; Schwartzlose, R.A. Sardine and anchovy spawning as related to temperature and upwelling in the California Current system. Calif. Coop. Ocean. Fish. Investig. Rep. 1991, 32, 105–111. [Google Scholar]
  81. Lluch-Belda, D.; Lluch-Cota, D.B.; Lluch-Cota, S.E. Baja California’s biological transition zones: Refuges for the California sardine. J. Oceanogr. 2003, 59, 503–513. [Google Scholar] [CrossRef] [Scilit]
  82. Clark, F.N.; Marr, J.C. Population dynamics of the sardine. Calif. Coop. Ocean. Fish. Investig. Rep. 1955, 1, 11–48. [Google Scholar]
  83. MacCall, A.D. Population estimates for the waning years of the Pacific sardine fishery. Calif. Coop. Ocean. Fish. Investig. Rep. 1979, 20, 72–82. [Google Scholar]
  84. Cisneros-Mata, M.A.; Nevárez-Martínez, M.O.; Hammann, G. The rise and fall of the Pacific sardine, Sardinops sagax caeruleus Girard, in the Gulf of California, Mexico. Calif. Coop. Ocean. Fish. Investig. Rep. 1995, 36, 136–143. [Google Scholar]
  85. Jacobson, L.D.; MacCall, A.D. Stock-recruitment models for Pacific sardine (Sardinops sagax). Can. J. Fish. Aquat. Sci. 1995, 52, 566–577. [Google Scholar] [CrossRef] [Scilit]
  86. Lindegren, M.; Checkley, D.M., Jr.; Rouyer, T.; MacCall, A.D.; Stenseth, N.C. Climate, fishing, and fluctuations of sardine and anchovy in the California Current. Proc. Natl. Acad. Sci. USA 2013, 110, 13672–13677. [Google Scholar] [CrossRef] [Scilit]
  87. Alemany, F.; Álvarez, F. Growth differences among sardine (Sardina pilchardus Walb.) population in Western Mediterranean. Sci. Mar. 1993, 57, 229–234. [Google Scholar]
  88. Baldé, B.S.; Brehmer, P.; Faye, S.; Diop, P. Population structure, age, and growth of sardine (Sardina pilchardus, Walbaum, 1792) in an upwelling environment. Fishes 2022, 7, 178. [Google Scholar] [CrossRef] [Scilit]
  89. Basilone, G.; Ferreri, R.; Bonanno, A.; Genovese, S.; Barra, M.; Aronica, S. Age and growth of European sardine (Sardina pilchardus) in the Central Mediterranean Sea: Implication of Stock Assessment. Fishes 2023, 8, 202. [Google Scholar] [CrossRef] [Scilit]
  90. Morimoto, H. Age and growth of Japanese sardine Sardinops melanostictus in Tosa Bay, south-western Japan during a period of declining stock size. Fish. Sci. 2003, 69, 745–754. [Google Scholar] [CrossRef] [Scilit]
  91. Kamimura, Y.; Tadokoro, K.; Furuichi, S.; Yukami, R. Stronger density-dependent growth of Japanese sardine with lower food availability: Comparison of growth and zooplankton biomass between a historical and current stock-increase period in the western North Pacific. Fish. Res. 2022, 255, 106461. [Google Scholar]
  92. Wada, T.; Kashiwai, M. Feeding ground selection of Japanese sardine with stock fluctuation. Bull. Hokkaido Natl. Fish. Res. Inst. 1991, 55, 197–204. [Google Scholar]
  93. Ohshimo, S.; Nagatani, H.; Ichimaru, T. Growth of 0-age Japanese sardine Sardinops melanostictus in the waters off the western coast of Kyushu. Fish. Sci. 1997, 63, 659–663. [Google Scholar] [CrossRef] [Scilit]
  94. Sakuramoto, K. Does the density-dependent growth of sardine truly exist? Open Access Libr. J. 2023, 10, e9514. [Google Scholar] [CrossRef]
Figure 1. Map of collection locations of aged northern subpopulation sardine for the present study (n = 3228). Collections were made during the Coastal Pelagic Species Survey of the NOAA Southwest Fisheries Science Center from 2012 to 2021. Bubble size indicates the number of sardine aged from that trawl.
Fishes 11 00290 g001
Figure 2. Distal view of whole sardine otoliths under a dissecting microscope with reflected light at 25× magnification. From the focus (black arrow) towards the posterior edge, opaque and translucent increments are counted together to represent 1 annulus. This individual has 3 fully formed annuli and a partial 4th (opaque increment only) and is assigned an age of 3 years. Red lines indicate the different annuli present on the left otolith. White and black lines indicate opaque and translucent increments, respectively, on the right otolith.
Fishes 11 00290 g002
Figure 3. Histogram of (A) standard lengths (mm) and (B) otolith age distribution of sardine sampled from the Coastal Pelagic Species Survey of the NOAA Southwest Fisheries Science Center from 2012 to 2021 (n = 3228).
Fishes 11 00290 g003
Figure 4. Growth curves of sardine collected from 2012 to 2021 based on the von Bertalanffy, Gompertz, and logistic growth models fitted to length-at-age data. Solid lines indicate model predictions, and shaded areas indicate the 95% confidence interval. Shaded points represent length-at-age of individual sardine.
Fishes 11 00290 g004
Figure 5. Comparison of growth curves from von Bertalanffy growth models between the original dataset (n = 3228), Simulation #1 (n = 5000 (500 per age class)), and Simulation #2 (n = 1000 (100 per age class)). Solid lines indicate model predictions, and shaded areas indicate the 95% confidence interval. Shaded points represent length-at-age of individual sardine (true or simulated). Shaded points for each model are offset along the x-axis to allow for visual distinction. The 3 growth curves overlap completely, making them visually indistinguishable.
Fishes 11 00290 g005
Figure 6. Comparison of growth curves from von Bertalanffy growth models of the current study (n = 3228) and Dorval et al. [9] (n = 3616) with length-at-age data of individual sardine as shaded points. Solid lines indicate model predictions, and shaded areas indicate the 95% confidence interval. Shaded points for each dataset are offset along the x-axis to allow for visual distinction.
Fishes 11 00290 g006
Figure 7. Comparison of the von Bertalanffy growth models of the current study, Dorval et al. (2015) [9], and Dorval et al. (2015) [9] supplemented with the age-0s from the current study (Dorval et al. 2015 [9], plus age-0). Solid lines indicate model predictions, and shaded areas indicate the 95% confidence interval.
Fishes 11 00290 g007
Table 1. Mean standard length, standard deviation (S.D.), and count of each age class for current data (2012–2021) and Dorval et al.’s [9] data (2004–2010). Wilcoxon rank sum test results for each age class. W is the Wilcoxon test statistic. p < 0.05 is significant. NA is Not Applicable, where the value was either not present or unable to be calculated.
Current StudyDorval et al. (2015) [9]Wilcoxon Rank Sum Test
AgeMean Length (mm)S.D.CountMean Length (mm)S.D.CountWp
095.1328.990179143.4918.8353801.5<0.001
1179.4324.501356167.7919.7736781,608<0.001
2214.1620.655877186.2922.23671484,633<0.001
3226.9016.350920211.1117.851157810,209<0.001
4236.1117.198400222.1916.85870250,214<0.001
5243.5616.989225230.6917.2940063,358<0.001
6246.7214.542149241.4016.668373780.018
7244.6716.1358425410.69123230.045
8247.2113.58934255NA1NANA
9237.504.9334243NA1NANA
10NANANA250NA1NANA
Table 2. Parameters estimated from the von Bertalanffy (VBM), Gompertz (GM), and logistic (LM) growth models fitted to length-at-age for sardine collected from 2012 to 2021 and comparison of model fits. L is the asymptotic mean length, K is the growth rate coefficient, t0 is the theoretical age at length 0, g* is the instantaneous growth rate at the inflection point, t*, and g−∞ is the positive instantaneous growth rate as age approaches negative infinity. UCI and LCI are the upper and lower 95% confidence intervals. The Akaike Information Criterion (AIC) and the difference in AIC from the minimum AIC for models fit to the same data (ΔAIC) are shown. The Bayesian Information Criterion (BIC) and the difference in BIC from the minimum BIC for models fit to the same data (ΔBIC) are also shown. The degree of freedom for each growth model was 3225 and the number of parameters for each growth model was 4.
ModelParameterValueLCIUCIAICΔAICBICΔBIC
VBML (mm)243.22241.80244.7328,379.15028,403.50
 K (year-1)0.7950.7640.827    
 t0 (year)−0.638−0.682−0.601    
GML (mm)240.36239.09241.6528,433.9754.8328,458.354.83
 g*1.0210.9851.058    
 t* (year)−0.118−0.150−0.089    
LML (mm)238.24236.95239.5028,506.82127.6728,531.1127.67
 g−∞1.2641.2161.313    
 t* (year)0.2330.2050.263    
Table 3. Comparison of study and growth parameters estimated by the von Bertalanffy model between studies for sardine from the time period 1994–2021. SL is standard length, L is the asymptotic mean length, K is the growth rate coefficient, and t0 is the theoretical age at length 0. Asterisk (*) denotes that t0 was fixed at 0 due to lack of data. Hypothesized subpopulations are as follows: NSP is the northern subpopulation, SSP is the southern subpopulation, and GOCSP is the subpopulation in the Gulf of California, MX.
SourceCurrent StudyButler et al. 1996 [43]Dorval et al. 2015 [9]Enciso-Enciso et al. 2022 [35]Nevárez-Martínez et al. 2019 [34]
SampleYears2012–202119941994, 2004–20102005–20142010–2013
SeasonSummerSpringSpringAll YearOctober–July/August
RegionPacific Coast, U.S.Pacific Coast, U.S. and MXCalifornia Coast, U.S.Baja California, MXGulf of California, MX
SubpopulationNSPNSPNSPSSPGOCSP
Number of Samples32281079444035091195
Size Range SL (mm)30–291~115–290120–290114–22698–208
Age Range0–91–70–100.5–60.5–6
L (mm)243205273216201
K (year-1)0.7951.190.2640.3720.581
t0 (year)−0.6380 *−2.884−1.845−0.839
Disclaimer/Publisher’s Note: The statements, opinions and data contained in all publications are solely those of the individual author(s) and contributor(s) and not of MDPI and/or the editor(s). MDPI and/or the editor(s) disclaim responsibility for any injury to people or property resulting from any ideas, methods, instructions or products referred to in the content.