Article

Habitat Use, Residency, and Connectivity of Bull Sharks (Carcharhinus leucas) in the Bazaruto Seascape, Mozambique


1
Marine Megafauna Foundation, Centro de Investigação Científica Megafauna Marinha, Praia do Tofo, Inhambane 1300, Mozambique
2
Ocean Wildlife Project e.V., 45239 Essen, Germany
3
Coastal and Marine Systems Group, Van Hall Larenstein University of Applied Sciences, Agora 1, 8934 CJ Leeuwarden, The Netherlands
4
South African Institute for Aquatic Biodiversity (SAIAB), Makhanda 6140, South Africa
5
Oceanographic Research Institute, Durban 4056, South Africa
*
Author to whom correspondence should be addressed.
Fishes 2026, 11(5), 291; https://doi.org/10.3390/fishes11050291
Submission received: 31 March 2026 / Revised: 5 May 2026 / Accepted: 7 May 2026 / Published: 14 May 2026
(This article belongs to the Special Issue Habitat as a Template for Life Histories of Fish)

Abstract

Bull sharks (Carcharhinus leucas) are highly mobile coastal predators, whose broad movements complicate conservation planning, particularly in the Western Indian Ocean, where key habitats remain poorly understood. Using passive acoustic telemetry, this study assessed the habitat use, residency, and regional connectivity of adult bull sharks within the Bazaruto Seascape, Mozambique, evaluating the area’s ecological role within a wider movement network. Sharks tagged around Bazaruto exhibited high residency (overall Rmax = 0.45) and year-round presence, with core habitat concentrated along seaward reef systems and inshore areas off the San Sebastian Peninsula. Although most core habitat areas (82%) overlapped with existing marine protected areas, important habitats extended beyond protected area boundaries. In addition to supporting resident individuals, the seascape functioned as a seasonal waypoint within a regional movement corridor, with transient sharks exhibiting short periods (<5 days) of seasonal residency (primarily between May and November). Movement patterns revealed strong connectivity with other aggregation sites along the southeast African coast and occasional long-distance movements across the Mozambique Channel to Madagascar and beyond. These findings demonstrate that the Bazaruto Seascape provides both critical habitat and acts as a connectivity node for resident and transient bull sharks, highlighting the need for conservation strategies that combine local spatial protection with broader regional and transboundary management frameworks.
Key Contribution: Acoustic telemetry demonstrates that Mozambique’s Bazaruto Seascape supports both resident and transient bull sharks, functioning as a critical habitat and a key connectivity node within a broader southwest Indian Ocean movement corridor. These findings highlight the need for multi-scale conservation strategies that integrate local spatial protection with coordinated regional and transboundary management for this highly mobile species.

1. Introduction

Effective conservation of wide-ranging elasmobranchs remains a persistent challenge in marine spatial planning and species management [1,2,3]. Many highly mobile species exhibit broad home ranges and undertake large-scale movements, exposing individuals to anthropogenic threats, particularly fisheries, across nearshore and open ocean habitats [2,4,5]. These movements frequently cross political or management boundaries, complicating conservation efforts and underscoring the need for coordinated, transboundary management frameworks [6,7,8,9]. Globally, shark and ray populations are experiencing pronounced declines, driven largely by overexploitation [10,11], with the proportion of chondrichthyan species threatened with extinction rising from one-quarter in 2014 to one-third in 2021 [12,13]. These trends have intensified the need for ecological knowledge to inform conservation planning, particularly for mobile species, where defining spatial and temporal patterns of habitat use and movement is fundamental to designing effective management strategies that account for their broad distributions and dynamic behaviour [1,8,14,15].
Among coastal elasmobranchs, the bull shark (Carcharhinus leucas) exemplifies the conservation challenges associated with highly mobile, wide-ranging species. As a circumglobally distributed apex predator [16], it represents an ideal model species for examining how movement ecology can inform spatial conservation planning. Bull sharks are euryhaline, inhabiting a range of marine and freshwater habitats, including river systems, estuaries, and offshore reefs [17,18]. As apex predators, they play a critical ecological role across these different systems, contributing to trophic regulation and linking marine and freshwater food webs. The species is currently listed as Vulnerable on the IUCN red list, primarily due to habitat degradation, incidental capture, and targeted fishing for fins and meat [19]. Bull sharks exhibit substantial individual variability in movement behaviour. Telemetry studies have revealed high residency and local site fidelity in some individuals, while others undertake extensive coastal movements spanning up to ~3000 km [15,20,21,22], and return oceanic crossings exceeding 4000 km [23,24]. Most recently, an adult female bull shark travelled over 7290 km from Mozambique to Nigeria, crossing from the Indian Ocean into the Atlantic, representing the first documented transoceanic and longest recorded movement for the species [25].
Within the Western Indian Ocean, bull shark movements and habitat use have been most intensively studied along the southern African coastline. South Africa represents the southern distribution limit of the Western Indian Ocean population [26,27], with the species occurring along the southeast coast as far as the Breede River Estuary in the Western Cape [28,29]. Regional understanding of bull shark movement ecology is largely derived from sharks tagged in South Africa and Ponta do Ouro in southern Mozambique, where acoustic telemetry has revealed diverse movement patterns and evidence of site fidelity to coastal aggregation sites. Tagged sharks exhibited variable levels of residency at a nearshore reef system in Ponta do Ouro, with some individuals undertaking seasonal coastal migrations of 400–700 km, predominantly northward into Mozambique’s Inhambane Province, likely in response to seasonal temperature variations [20]. Expanding on these findings, Lubitz et al. [22] applied a context-focused approach to examine the drivers of these movements, demonstrating that, along with sex and seasonal environmental changes, bull shark aggregations were linked to annual teleost spawning events in Ponta do Ouro. Satellite telemetry provided further evidence that sharks tagged in South Africa travelled as far north as Zambezia Province in central Mozambique [22]. Acoustic tracking confirmed transboundary connectivity, documenting regular and repeated movements between Mozambique and South Africa and highlighting the need for coordinated, cross-border management strategies for bull sharks and other mobile carcharhinids [6]. Although these studies have documented northward movements from southern aggregation sites into the Mozambique Channel, the ecological role of coastal habitats further north in Mozambique remains poorly understood.
The Bazaruto Seascape encompasses the Bazaruto Archipelago and the San Sebastian Peninsula in the north of the Inhambane Province, Mozambique. The area includes a mosaic of marine and coastal ecosystems, and supports a diverse range of elasmobranchs, for which it is recognised as an IUCN Important Shark and Ray Area (ISRA) [30]. There are two established marine protected areas (MPAs) located within the region—the Bazaruto Archipelago National Park (BANP) and the Vilanculos Coastal Wildlife Sanctuary (VCWS), each with smaller protection zones situated within the larger MPAs. These smaller zones have varying fishing regulations, from total protection in some to gear restrictions (e.g., no netting) in others [31,32]. Additionally, CITES-listed species, including bull sharks, are afforded species-level protection within protected areas in Mozambique [33]. Outside of protected areas, however, bull sharks have no protection beyond a minimum size limit of 150 cm total length (TL), well below the size at maturity [34], highlighting the critical role of protected areas for bull sharks and other threatened elasmobranch species. Within the Bazaruto Seascape, bull sharks are primarily at risk from incidental capture in gill nets and line fishing, with landed individuals typically retained for sale.
Previous acoustic detections within the Bazaruto Seascape of bull sharks tagged elsewhere show that individuals make brief visits to the area, suggesting it may function as part of a broader movement corridor [20]. However, habitat use, residency, and fine-scale movements within the seascape remain poorly quantified. This study addresses these knowledge gaps by using passive acoustic telemetry to characterise bull shark habitat use, visitation patterns, and movements in and around the Bazaruto Seascape. Specifically, we aim to: (1) quantify site visitation and habitat use of bull sharks within and adjacent to BANP and VCWS, identifying areas of high residency and core habitat use; (2) assess how individuals tagged in other parts of Mozambique and South Africa use the Bazaruto Seascape, examining visitation patterns and regional connectivity to place this area within the broader biogeographic context of the Western Indian Ocean population; and (3) translate these findings into practical recommendations to inform and improve the conservation management of bull sharks and other large coastal predators in the Bazaruto Seascape.

2. Materials and Methods

2.1. Study Site

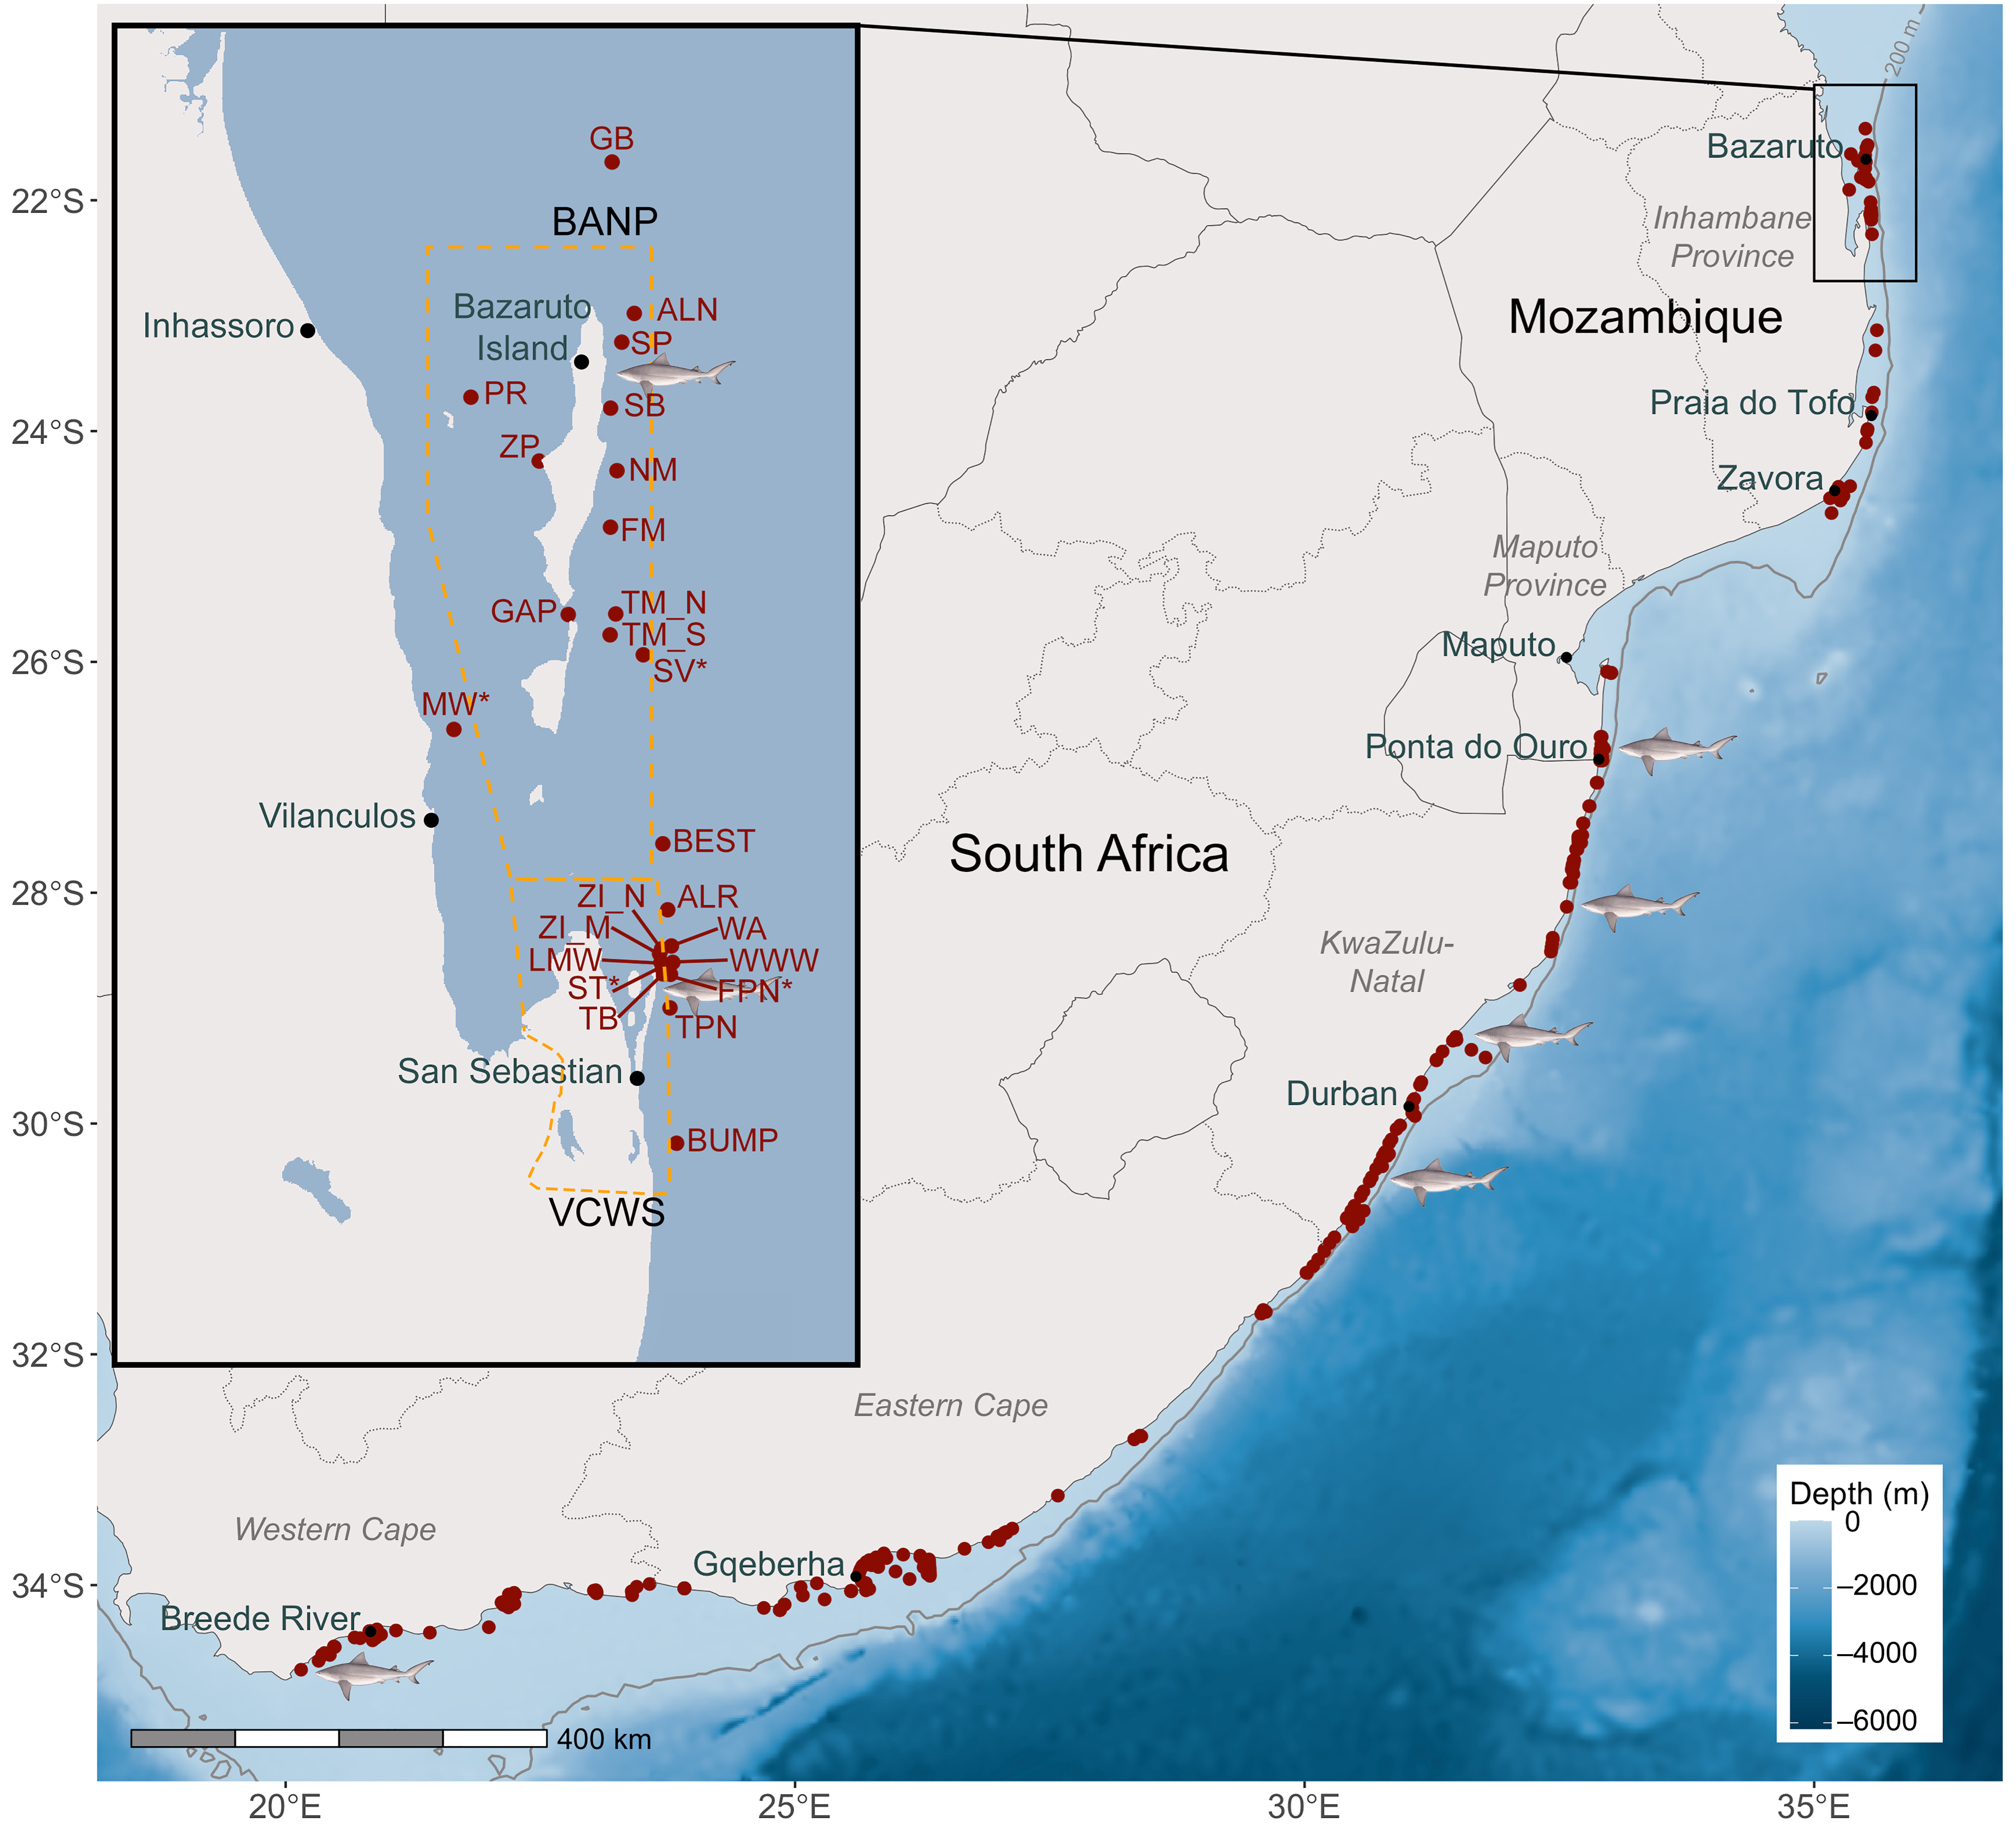
Bull sharks were tagged and tracked in southern Mozambique and along the east coast of South Africa in the Western Indian Ocean. The overall study area spanned approximately 2300 km of coastline, from the Breede River Estuary in the Western Cape, South Africa, to the Bazaruto Archipelago National Park in Inhambane Province, Mozambique (Figure 1). This region is dominated by the Agulhas Current that starts at the southern end of the Mozambique Channel and connects the subtropical waters of Mozambique with the temperate waters of South Africa [35,36]. Mozambique Channel waters between Bazaruto and Zavora are influenced by southward-propagating mesoscale eddies [37].
The primary focal area was the Bazaruto Seascape, a coastal area that spans ~150 km along the Inhambane Province in southern Mozambique from the Save River in the north to Mahangate in the south (21° S to 22.6° S, 35.5° E). The area encompasses the Bazaruto Archipelago, which comprises five islands enclosing a shallow bay (<25 m depth) of ~1500 km2, and the coastal waters off the San Sebastian peninsula—a system of shallow sand bank channels on the landward (west) side of the islands and peninsula, to submerged rocky reefs and the open ocean on the seaward (east) side [38]. A series of rocky patch reefs, fringing reefs, rocky massifs, and pinnacles, ranging from 15 to 40 m deep, run along the seaward side of the archipelago and peninsula. The deeper reefs have a relatively low hard coral diversity, and many serve as ‘cleaning stations’ for larger marine species, particularly bony fishes, sharks, and rays [38,39]. The seabed exhibits a steep drop off east of these reef systems, reaching depths of >200 m, approximately 10 km from the east coast of the islands and the San Sebastian shoreline. Oceanographic conditions are dynamic, with underwater horizontal visibility varying from 5 to 30 m, and water temperature varying seasonally from a high of 30 °C during austral summer (December–March) to a low of 19 °C during the winter (July–September; Marine Megafauna Foundation, unpublished data). Frequent cold-water intrusions lead to daily temperature amplitudes of up to 7.5 °C in the region [40]. Current strength and surface weather conditions are also variable, with occasional strong winds and large swells of >2.5–3 m.

2.2. Shark Tagging and Acoustic Receiver Network

Bull sharks were captured using single monitored drum lines with barbless circle hooks (14/0–18/0) baited with tuna (Scombridae). On capture, sharks were inverted and restrained submerged alongside a research vessel. Individuals were sexed based on the presence (males) and absence (females) of claspers [16], and total length (TL) was measured. A surgical incision was made into the coelomic cavity to insert the acoustic tag, which was then closed with multiple independent monofilament sutures. The tagging procedure took less than 10 min, and the sharks were released at the site of capture. All tags were Innovasea V16 (Halifax (NS), Canada) (16 mm diameter, 68 mm length, 10.3 g in water), programmed to transmit at 69 kHz randomly between 90 and 120 s, with an associated battery life of 2477–3650 days.
In the Bazaruto Seascape, 17 bull sharks were tagged between April 2019 and May 2022 northeast of Bazaruto Island around sites SP and ALN, or off the San Sebastian Peninsula between sites FPN and TPN (Figure 1). As part of a wider regional tagging initiative, an additional 54 bull sharks were tagged along the southeast African coast (from the Breede River, South Africa, to Ponta do Ouro, Mozambique) between November 2012 and February 2022 (for full tag metadata, see Table 1).
Tagged sharks were monitored by a network of acoustic receivers (VR2W and VRAR, 69 kHz, Innovasea, Halifax (NS), Canada) spanning approximately 2300 km between the Western Cape, South Africa, and the Bazaruto Archipelago, Mozambique (Figure 1). Acoustic receivers in the Bazaruto Seascape were deployed at 25 sites throughout the Bazaruto Archipelago and off the San Sebastian peninsula, covering a ~100 km stretch of coastline (see Figure 1 inset). The receiver array was established to monitor the movements of large elasmobranchs, including bull sharks; therefore, receiver placement prioritised seaward reef systems, as these represent the primary habitat for these species. Receivers were placed at depths of between 13 and 42 m on submerged rocky reefs on the seaward side of the archipelago. On the landward side of the archipelago, receivers were deployed at a 24 m rocky patch reef, at a depth of 23 m along a rocky slope, and on a small, shallow (~10 m deep) shipwreck. An initial array of 9 receivers was deployed between December 2018 and July 2019; the array was then expanded by an additional 12 receivers in 2020/2021 and 4 additional receivers in June 2023 (see Table S1 in Supplementary Materials for full receiver metadata). Receivers were also deployed throughout the Inhambane and Maputo Provinces of Mozambique, and the KwaZulu-Natal, Eastern Cape, and Western Cape provinces of South Africa (Figure 1; Table S1). While the number of receivers deployed varied annually, as receiver sites were either added or retired, tagged bull sharks were detectable at a possible 350 receivers throughout the study period. For more information on the ATAP receiver network, see [41,42].
Receivers were moored to the seabed using one of two designs; (1) receivers were attached to a 10 mm nylon rope suspended 2 m from the substrate by a 300 mm diameter trawl float anchored to a 50 kg piece of railway line using a rubber strop and rope, as described by Cowley et al. [41]; (2) receivers were attached to a 1.5 m length of steel reinforcing bar embedded in ~10–15 L cement blocks [39]. All data from receivers in Mozambique were collected and compiled in collaboration with the Marine Megafauna Foundation (MMF), Oceanographic Research Institute, South Africa (ORI), and Africa Foundation. All data from receivers in South Africa were compiled by the Acoustic Tracking Array Platform (ATAP), a marine platform managed by the South African Institute for Aquatic Biodiversity (SAIAB); see Cowley et al. [41] and Murray et al. [42] for further information on ATAP. In addition to detections on the receiver network spanning Mozambique and South Africa, occasional detections of tagged bull sharks were also recorded on a neighbouring acoustic array off the west coast of Madagascar, managed by the African Aquatic Conservation Fund. These data were shared via collaborator contributions to ATAP and included in the analysis where applicable.

2.3. Range Testing

Range tests were conducted on multiple receivers deployed on both reef and sand substrates within the study area. These tests confirmed that the detection range (more than 50% of recorded tag detections) at reef-dominated sites was limited to between 100 and 200 m; see [20]. Additional range tests on sand substrate-dominated sites confirmed that the detection range was at least 400 m, with 10% of tag detections recorded at 800 m. Sentinel tag deployment for a period of one year confirmed a consistent detection range of 200 m with slightly reduced (~4%) detection probability during crepuscular and evening periods; see [43]. Although the detection range seemed to be influenced by habitat type and reef noise, on average throughout the study area, the consistent detection range of receivers was between 100 and 400 m, with a reduced detection range between 600 and 800 m and no detections at distances of 1000 m.

2.4. Data Analysis—Data Processing

Acoustic detection data were combined into a single dataset in the Vemco User Environment (VUE) software (Version 2.7.0), and all further analyses were conducted in R Version 4.2.2 [44]. Data were screened for potential false detections using the ‘glatos’ R package [45], with minimum time intervals of 3, 6, and 12 h, and were then manually assessed to determine the likelihood of false detections. A shark was considered present near a receiver if a single detection was registered and if this was deemed realistic based on the location and time of previous detections. Given the layout of the receiver network, the swimming speed of our study species, and the noise of the reef, all detections were deemed reasonable and retained. Duplicate detections between two receiver sites (TB and ST) located in close proximity (~400 m) with an overlapping detection range were removed by filtering for subsequent detections at a different receiver <90 s apart (the upper limit of nominal tag delay) and deleting the latter of the duplicate detections, in order to reduce ‘false movements’. This resulted in the removal of 8869 detections from 11 tags. Only sharks with >1 day of detection data were included in analyses.
Two separate datasets were created: (1) ‘Bazaruto sharks’, which included detections from bull sharks tagged in the Bazaruto Seascape at any receiver within the wider study area (i.e., in Mozambique and South Africa). This dataset comprised 350,134 detections of 16 tagged sharks, with a date range of 12 April 2019 to 14 November 2024. (2) ‘All sharks’, which included detections from all bull sharks detected in the Bazaruto Seascape, irrespective of tagging location, at any receiver within the wider study area. This dataset comprised 994,687 detections from 38 tagged sharks, with a date range of 8 December 2012 to 29 November 2024. Tag and receiver summaries were extracted using the ‘VTrack’ R package [46], and individual detection histories were visualised using ‘ggplot2’ [47].
One tagged shark (a 2.42 m female; shark #03) accounted for 42.3% of detections in the seascape, and was primarily detected at one receiver (SP, 99% of its detections). The detection history was checked to rule out the possibility of mortality, as indicated by continuous detections at a single receiver, and it was deemed that detections were valid during the entire tag deployment. To avoid this shark biasing results, we report alternative metrics (i.e., mean and median) or removed the tag from particular analyses where this may have impacted the overall pattern observed.

2.5. Residency, Seasonality, and Diel Visitation Patterns

To assess residency in the Bazaruto Seascape, a maximum residency index (Rmax) was calculated for sharks tagged in Bazaruto. Rmax was the proportion of days a shark was detected at least once at receivers in the seascape, divided by the track duration—the number of days between tagging and last detection at any receiver throughout the wider network [48]. The overall Rmax across all sharks was calculated using the sum of detected days for each shark and dividing it by the sum of all track durations. Site-level residency (Rmaxsite) was quantified using a pooled residency index. For each receiver, the total number of days on which tagged bull sharks were detected was summed across all individuals and divided by the total number of monitored days when the receiver was active and when the sharks were present in the array. Only periods of confirmed receiver operation were included, with deployment gaps excluded from the monitoring effort. This approach accounts for variation in monitoring effort and individual detection histories, providing a robust site-level measure of habitat use.
The ‘RunResidenceExtraction’ function in the ‘VTrack’ R package was used to determine the amount of time bull sharks spent at a site during a single continuous visit, using a minimum visit time of 5 min and a time threshold between detections of 15 min. A residency event was therefore considered to occur when at least two detections were recorded at a receiver, with no more than 15 min between consecutive detections; longer gaps were interpreted as the shark having departed the site.
Seasonality in detections was examined by fitting a generalised additive mixed model (GAMM) using the ‘mgcv’ R package [49]. Models were run on detections of Bazaruto-tagged sharks (n = 16) detected at all receivers within Bazaruto (n = 25), then excluding shark #03 due to the potential for the high proportion of detections from this tag to influence the overall seasonal pattern. We report on the model excluding shark #03 and include the alternative model (including all tags) in the Supplementary Materials. Due to overdispersion in the data, we used a negative binomial distribution, with the number of detections per tag per day as the response variable, day of year fitted with a cubic spline (k = 12) as the predictor, and tag ID as a random effect to control for individual variation. Model residuals were visually inspected. Day of year and tag ID were both significant (p < 0.001; edf = 9.5 and 13.2, respectively), and the model explained 7.77% of the deviance.
To investigate patterns in diel visitation, detections of Bazaruto-tagged sharks were collated into hourly bins for receivers throughout the Bazaruto Seascape, and cumulative hourly detections were plotted in the ‘ggplot2’ R package [47] using the ‘suncalc’ R package to calculate day and night periods [50]. Seven sites were excluded due to low numbers of detections (<60 detections over the study period).

2.6. Activity Spaces

Detection data were pre-processed in the ‘actel’ R package [51] to validate detections for further analysis. Dynamic Brownian Bridge Movement Models (dBBMM) were calculated in the ‘RSP’ package [52]. This package was developed to generate utilisation distributions (UD) from the dBBMM calculated from acoustic tracking data of aquatic species, automatically excluding land barriers from the final UD contours [52]. Individual ‘core habitat’ (50% UD, i.e., the area containing 50% of the shark’s probability of use) and ‘extent habitat’ (95%) areas were calculated for each of the Bazaruto-tagged sharks for their whole track length (tagging date to last detection), as well as overall UDs for all Bazaruto-tagged sharks combined over the whole study period. The proportion of the combined overall ‘core habitat’ (50% UD) that fell inside and outside of formal MPA boundaries was calculated by overlaying the BANP and VCWS boundary shapefiles sourced from the World Database on Protected Areas [53] on the combined UD raster, and creating binary masks to extract and sum the UD values inside and outside of protected areas using R packages ‘sf’ [54], ‘raster’ [55], and ‘fasterize’ [56].

2.7. Movement Networks

A movement network was constructed from the ‘Bazaruto sharks’ dataset to analyse connectivity patterns among receivers for Bazaruto-tagged bull sharks (n = 16). First, movements between receivers were identified when consecutive detections occurred at different receivers within a 12 h time window. This step was to only include realistic movements between receivers and exclude consecutive detections over longer time gaps. Movement networks were then constructed using the ‘igraph’ R package [57]. Nodes represented acoustic receivers and directed edges represented movement pathways, weighted by the number of movements and coloured by the number of individual sharks using each pathway. Network centrality metrics, including degree, betweenness, and closeness centrality, were calculated to identify key receiver sites within the movement network. Receivers were classified as sources (net outflow > 5 movements), sinks (net inflow > 5 movements), or hubs (balanced flow) based on the difference between incoming and outgoing movements. The network was visualised both as a force-directed graph and geographically overlaid on receiver coordinates to examine spatial movement patterns within the Bazaruto Seascape.
A second movement network was constructed using the ‘All sharks’ dataset. Here, receivers were grouped into several ‘arrays’ based on their geographic region to better visualise large-scale movements to and from the Bazaruto Seascape, following the approach of Daly et al. [6]. A movement was defined as a subsequent detection of an individual at a different array from the preceding one. This movement network distinguished between movements with and without intermediate stops, where an intermediate stop was defined as a shark spending fewer than 15 days at an array before being detected at another array.

2.8. Transient Visitation Patterns

To assess visitation to the Bazaruto Seascape by individuals tagged elsewhere, detection data were filtered to include only sharks tagged outside the region (n = 22). Seasonal trends in presence were assessed using a GAMM fitted to all detections using the ‘mgcv’ package [49]. Due to overdispersion in the count data, a negative binomial distribution was used. The model structure included daily detection counts per individual as the response variable, day of year fitted with a cyclic cubic spline (k = 12) as the predictor, and tag ID as a random effect to control for individual variation in detection patterns. Model residuals were visually inspected to assess model fit. To examine the origin and temporal patterns of visiting sharks, individuals were grouped by their tagging region: Ponta do Ouro, Mozambique (n = 13 sharks), KwaZulu-Natal, South Africa (n = 3), and Breede River, South Africa (n = 6). Detection data were aggregated by month and tagging region to quantify the temporal patterns of regional connectivity. For each month, the number of unique individual sharks detected was calculated per tagging region.
To investigate the frequency and duration of visits, a ‘visit’ was defined as a period of detections at receivers deployed in the Bazaruto Seascape, without any detections at the receivers outside the region. Each visit began with the first detection in the seascape and ended either at the final detection in the region immediately preceding the next detection at a receiver outside the seascape, or after a period of >7 days without detections at Bazaruto receivers. Summary metrics were calculated for each visit, including the start and end dates, duration, number of detected days, total detections, and maximum gap between detection days.

3. Results

3.1. Tag Summary—Bazaruto Sharks

Seventeen bull sharks (1 male, 16 females) were tagged in the Bazaruto Seascape, ranging from 2.36 to 2.92 m TL; see Table 1 for the tag summary. All tagged individuals were classified as mature adults, as TLs exceeded the reported upper size at maturity for the species [16]. One tag (shark #05) was excluded from analysis as it only had a single detection; the remaining 16 tags transmitted a total of 350,134 detections recorded on 40 receivers between 12 April 2019 and 14 November 2024. Almost all detections (349,909; 99.9%) were recorded at 22 receivers deployed around the Bazaruto Seascape, with 225 detections (0.1%) recorded at 18 of the receivers deployed elsewhere throughout Mozambique and South Africa. Individual track duration ranged from 591 to 2029 d (mean ± SD = 1327 ± 479 d), and total detections per individual ranged from 179 to 148,090 (mean = 21,883 ± 35,375 detections). Tagged individuals were detected at 3–26 receiver sites (mean = 13.94 ± 5.45), throughout the entire network (Table 1). One tagged shark showed unusually high detections and residency (a 2.42 m female; shark #03), accounting for 42.3% of the detections in the seascape, and was primarily detected at one site (SP, 99% of its detections).

3.2. Tag Summary—All Sharks

Of the additional bull sharks that were tagged between the Breede River, South Africa, and Ponta do Ouro, Mozambique, 22 individuals (11 males, 11 females; ranging between 2.11 and 2.97 m TL) were detected on receivers in the Bazaruto Seascape. Of these individuals, 19 were classified as mature adults based on their body and/or clasper size, and three were immature males (<2.25 m TL; Table 1) [16]. For these additional sharks, individual track duration ranged from 358 to 3651 d (mean ± SD = 1863 ± 706 d), and total detections per individual ranged from 564 to 92,410 (mean = 29,298 ± 26,782 detections). Individuals were detected at 16–98 unique receiver sites (mean = 52 ± 22) throughout the entire array (Table 1). Most detections of these 22 individuals were recorded at receivers in the Ponta do Ouro (50.7%) and Breede River receiver arrays (43.2%), with 0.3% of detections (n = 2058) in the Bazaruto Seascape. Combined with the 16 sharks tagged in Bazaruto, the 38 individuals recorded a total of 994,687 detections on 218 acoustic receivers between 8 December 2012 and 29 November 2024 (Table 1).

3.3. Receiver Summary—Bazaruto Seascape

Twenty-five receivers were deployed throughout the Bazaruto Seascape between December 2018 and November 2024 (see Table S1 for summary). Bull sharks were not detected at two of these receivers (PR and MW, both located on the inshore side of the islands), and another recorded no detections due to technical issues and receiver loss (ZI_N). The most frequented receiver (SP), which was deployed at a 30–35 m deep rocky reef northeast of Bazaruto Island, recorded 165,994 detections over the study period from 14 of the 16 tagged sharks, equating to 47% of all detections. We note that 146,691 (~88%) of these detections were from shark #03, the highly resident female. The second most frequented site (TB, a 25–30 m deep, low-lying rocky reef off the San Sebastian peninsula) recorded 76,893 detections (22% of all detections) from all but one individual, indicating widespread use by tagged bull sharks (Table S1). High numbers of detections were also recorded at inshore receivers around the San Sebastian Peninsula (ST, LMW, ZI_M), a 40–45 m deep rocky ridge system off northern Bazaruto Island (ALN), and 25–35 m deep rocky reefs/pinnacles off San Sebastian (WA, ALR, BEST; Table S1).

3.4. Residency

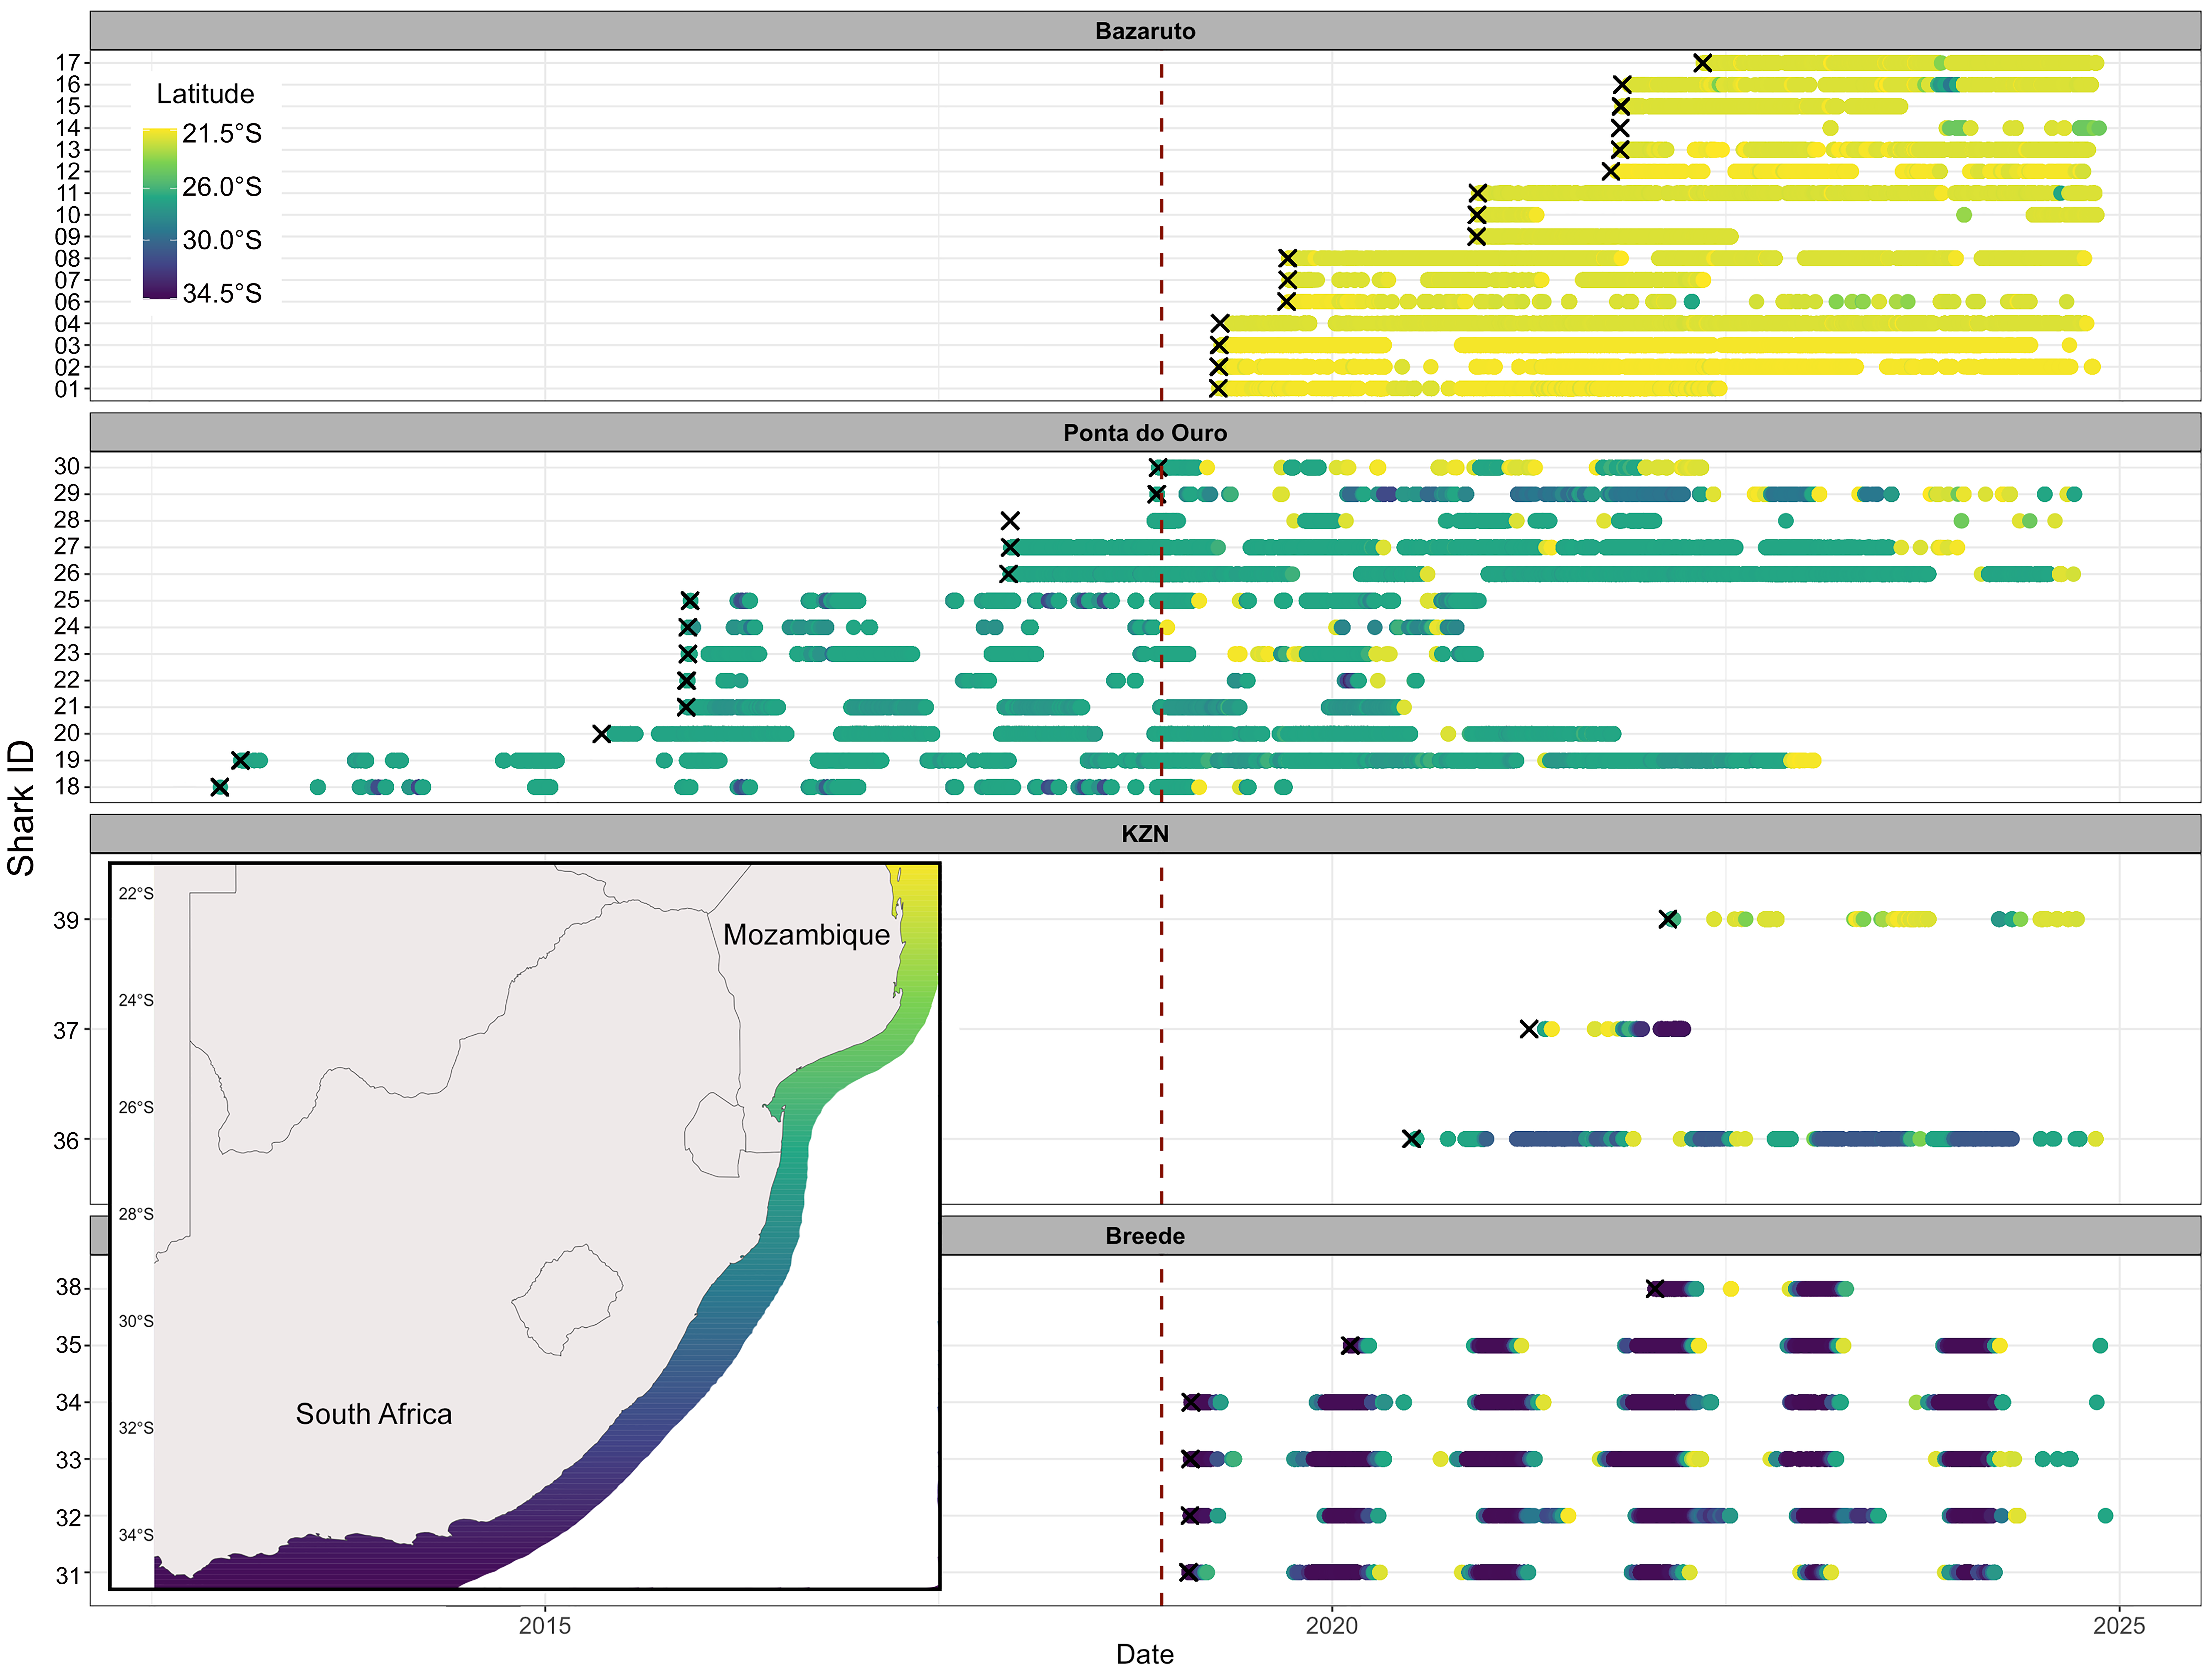
Bull sharks tagged in the Bazaruto Seascape exhibited high degrees of residency in this area. Rmax ranged from 0.01 to 0.84, with an overall Rmax of 0.45, indicating bull sharks were detected on almost half of the monitored days, and up to 84% of days, in the Bazaruto Seascape array. The only tagged male had the lowest Rmax (and fewest total detections), while 9 of the 15 females had an Rmax >0.40. Detection summaries show a pattern of consistent detections in the seascape, with short journeys to the south or outside the range of the receiver coverage for 10 tagged sharks (#01, #02, #03, #04, #08, #11, #12, #13, #16, and #17; Figure 2 and Figure S2), further highlighting the high residency. The shark that recorded the most detections in the seascape (#03, a 2.42 m female; 148,090 detections) was only detected at three receivers (60 km between the furthest receivers), with an Rmax of 0.72 over a 5.4 year track duration (Table 1).
Site-level residency (Rmaxsite) ranged from 0.002 to 0.241, with the highest values occurring at the inshore receivers off the San Sebastian peninsula (LMW = 0.241, TB = 0.226, ST = 0.197, and ZI_M = 0.159; Table S1). An Rmaxsite value of 0.241 indicates that sharks were detected at this receiver on ~24% of all monitored days, reflecting frequent and repeated use of this area and identifying it as a core habitat within the seascape. The highest Rmaxsite value in BANP was at SP (Rmaxsite = 0.129; Table S1).
The duration of residency events varied among individuals, with an average visit duration per shark ranging from 12.8 ± 9.3 min (shark #16) to 61.6 ± 107.3 min (shark #03). The longest residency event per individual ranged from 42 min (mature male, #14 at BEST) to 37 h 8 min (female #03 at SP) (Table 2). Six individuals spent >5 h at certain sites, with five of these individuals making extended visits on multiple occasions, highlighting the capacity for extended visits to specific sites.

3.5. Seasonality and Diel Patterns

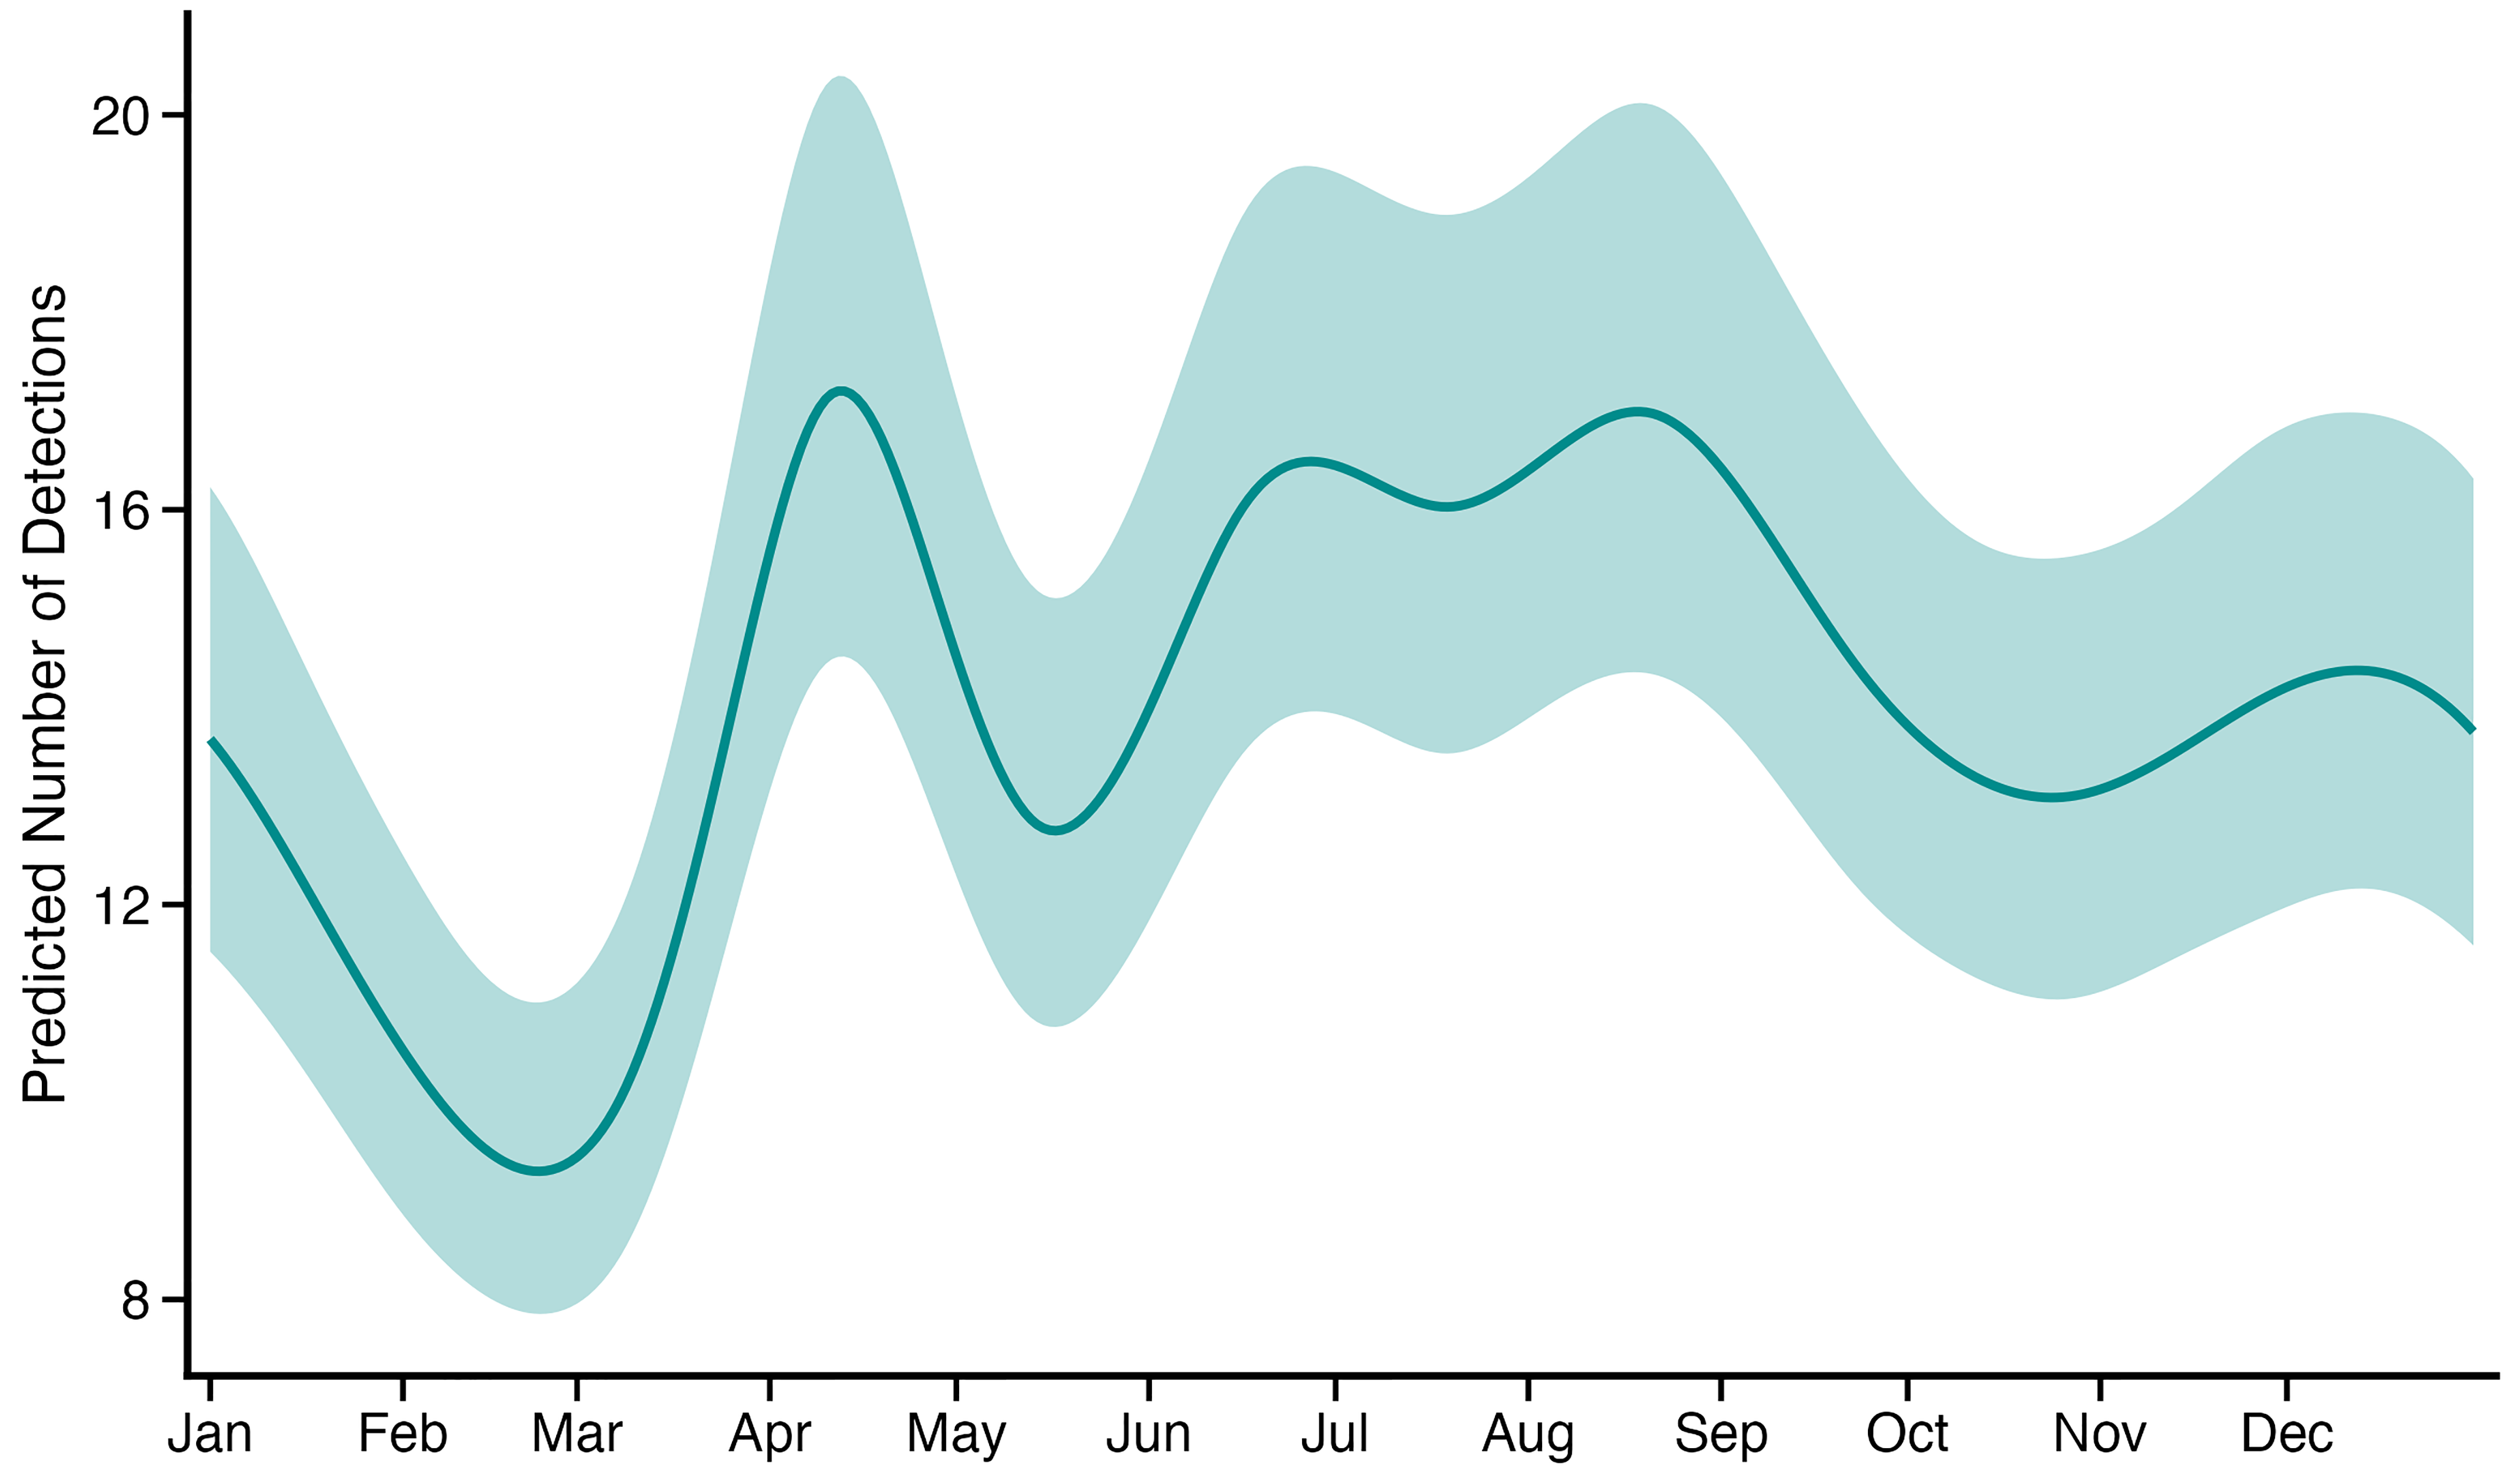
Bazaruto-tagged sharks were detected year-round in the Bazaruto Seascape array, with higher detections in April to September (austral autumn/winter), peaks in April and August, and low detections in February (Figure 3). When split by receiver, patterns of seasonality varied across the ten most-visited receivers throughout the seascape; however, detections generally increased during April to September (Figure S3). GAMM prediction plots, including all individual Bazaruto sharks, are available in Supplementary Materials (Figure S4).
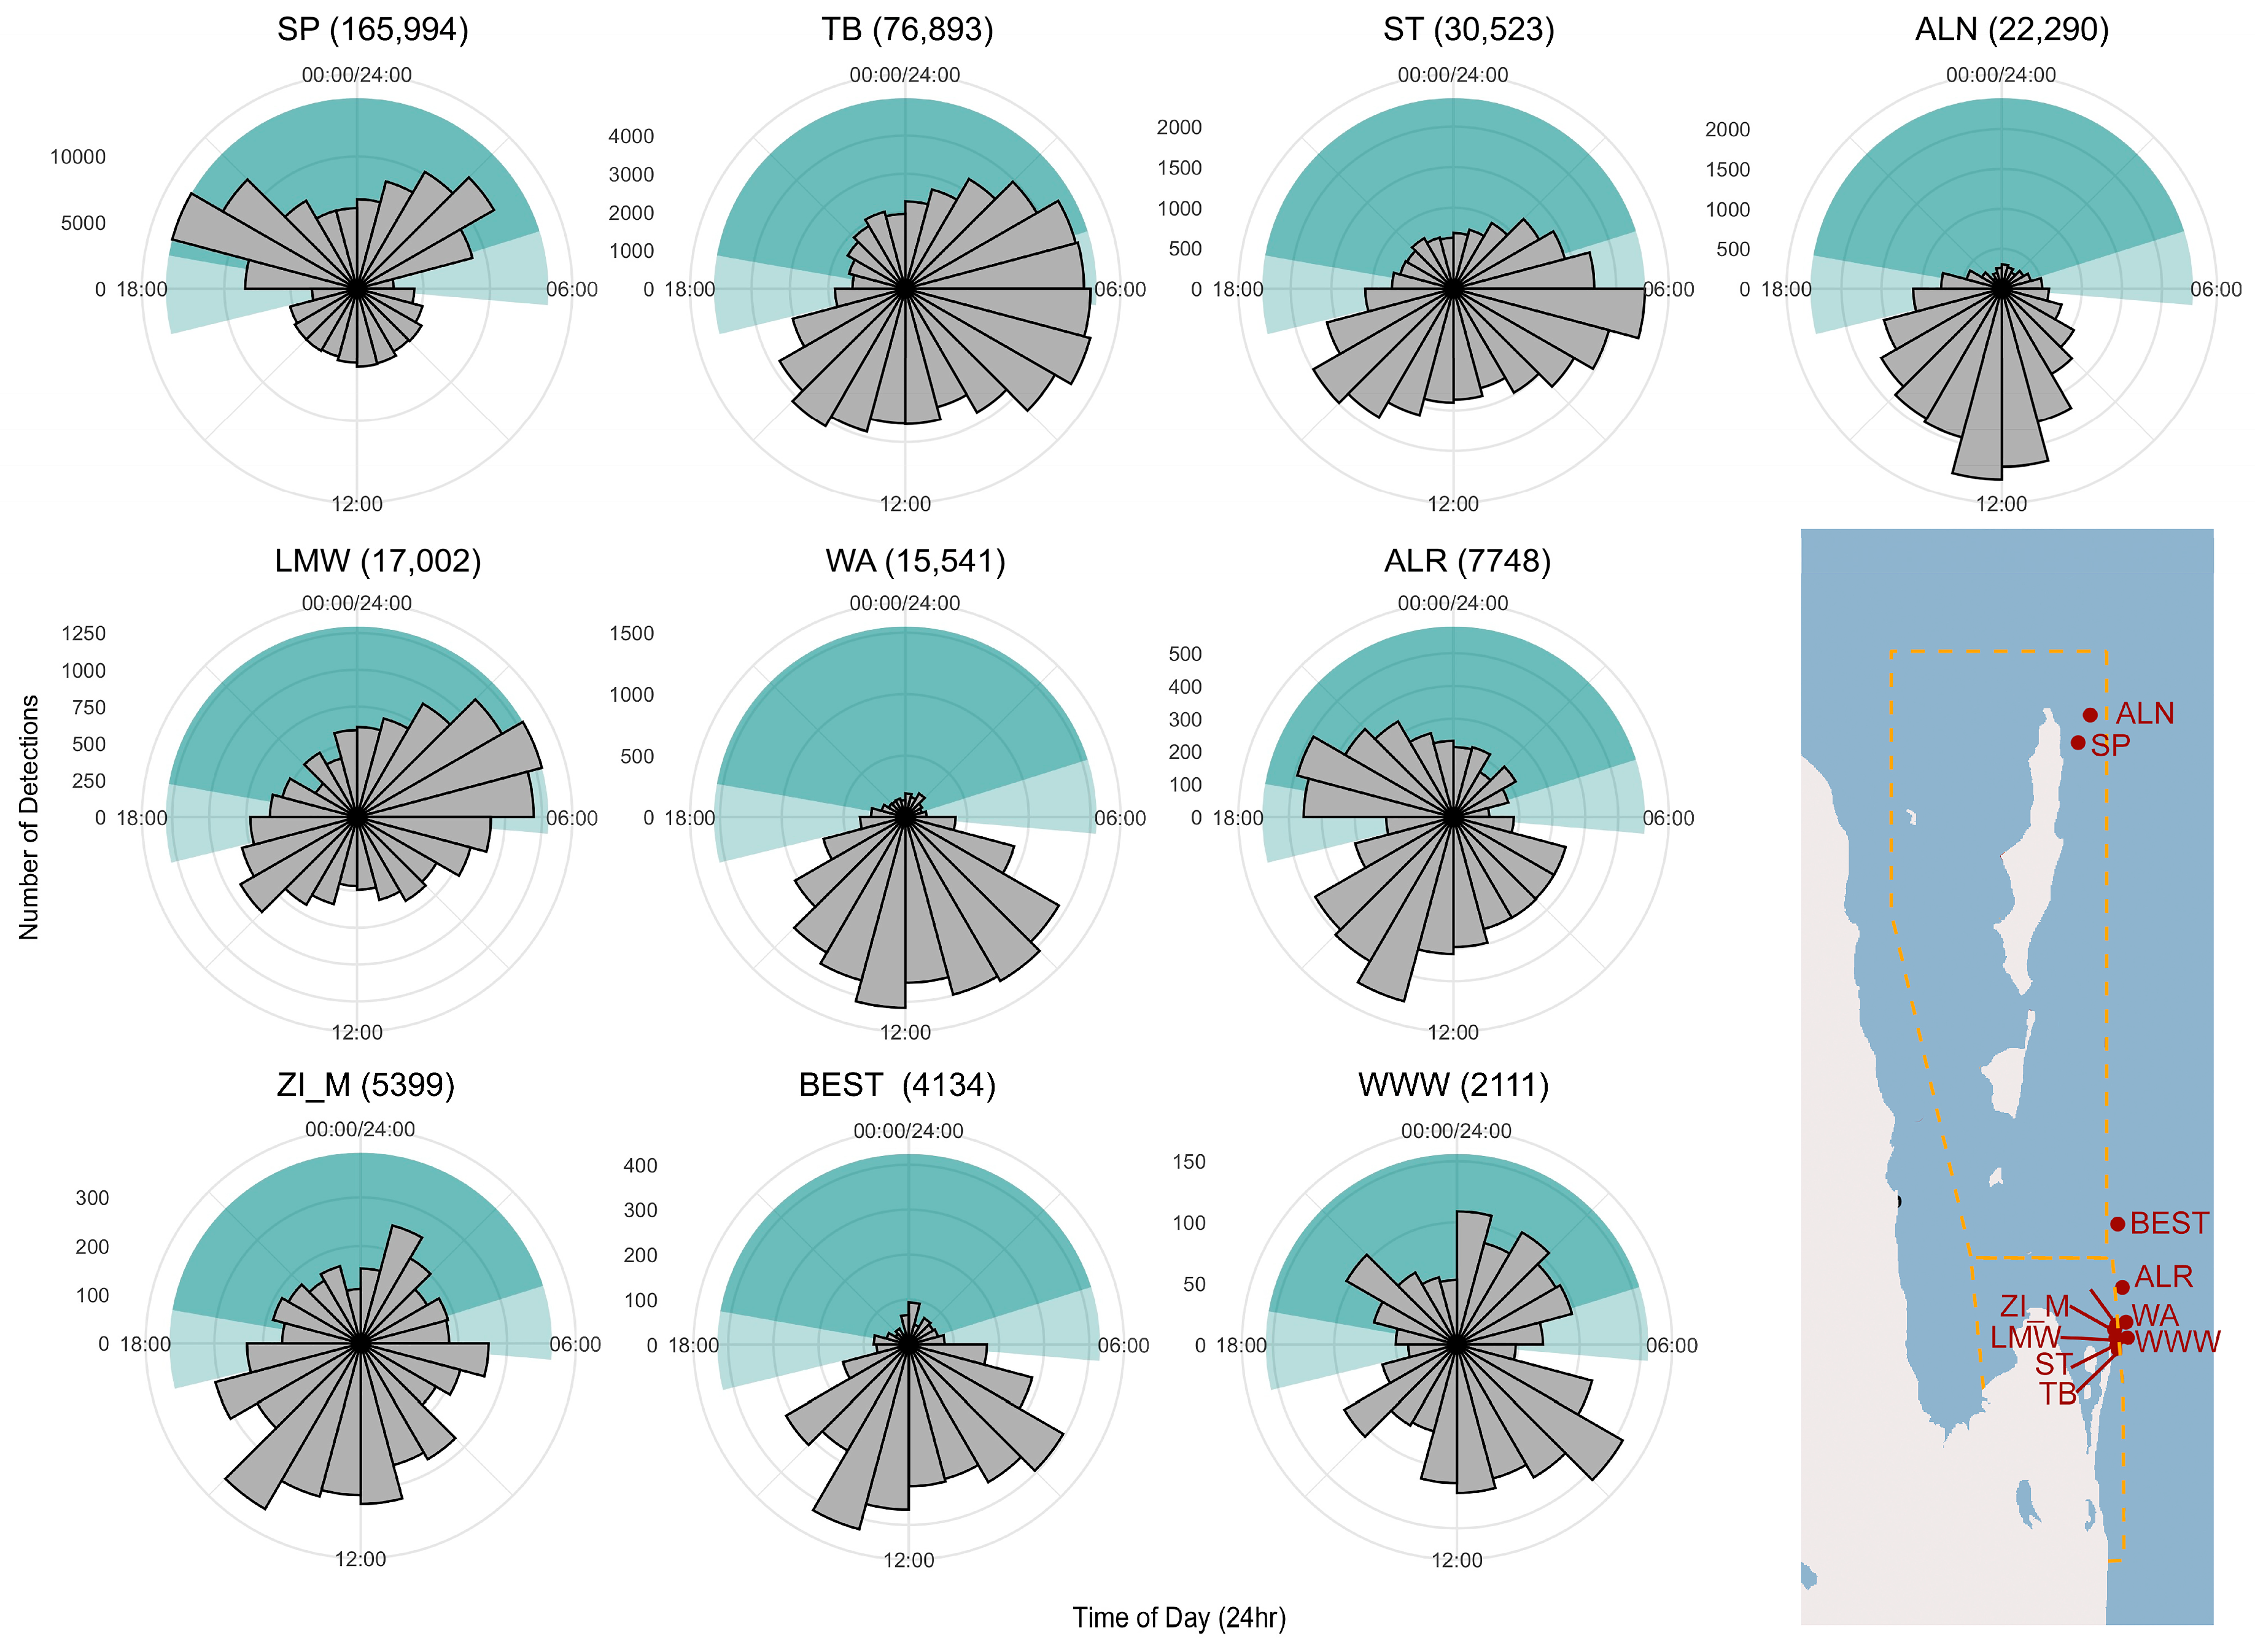
When combined across all receivers, overall detections were distributed relatively evenly between day and night, with 53.4% of the detections recorded during the day, and 46.6% at night. However, when examined by individual receiver, the proportions of detections were typically higher during daylight hours at most receiver sites (Figure 4). The receiver with the most detections (SP) had higher nighttime detections (day = 40.5%, night = 59.5%), yet showed a contrasting pattern with the closest neighbouring receiver ALN (~3.3 km away), which had higher detections during the day (day = 71.7%, night = 28.3%). The higher proportion of nighttime detections at SP was primarily due to tag #03, which showed high residency at this site. This shark accounted for 88% of the overall detections at SP, 64.9% of which were recorded at night; however, it was only detected at ALN 86 times, so it likely did not influence the higher daytime detections at this site. Receivers at two deep rocky pinnacles off San Sebastian (BEST and WA, located ~10.6 km apart) recorded the highest proportion of daytime detections (76.5% and 79.8%, respectively). Inshore receivers in San Sebastian (TB and LMW) showed a pattern of higher detections before dawn (around 03:00) and into the early hours of the morning (until 06:00 at LMW, and 08:00 at TB; Figure 4). Both receivers were located <1 km from shore and within the VCWS boundaries.

3.6. Activity Spaces

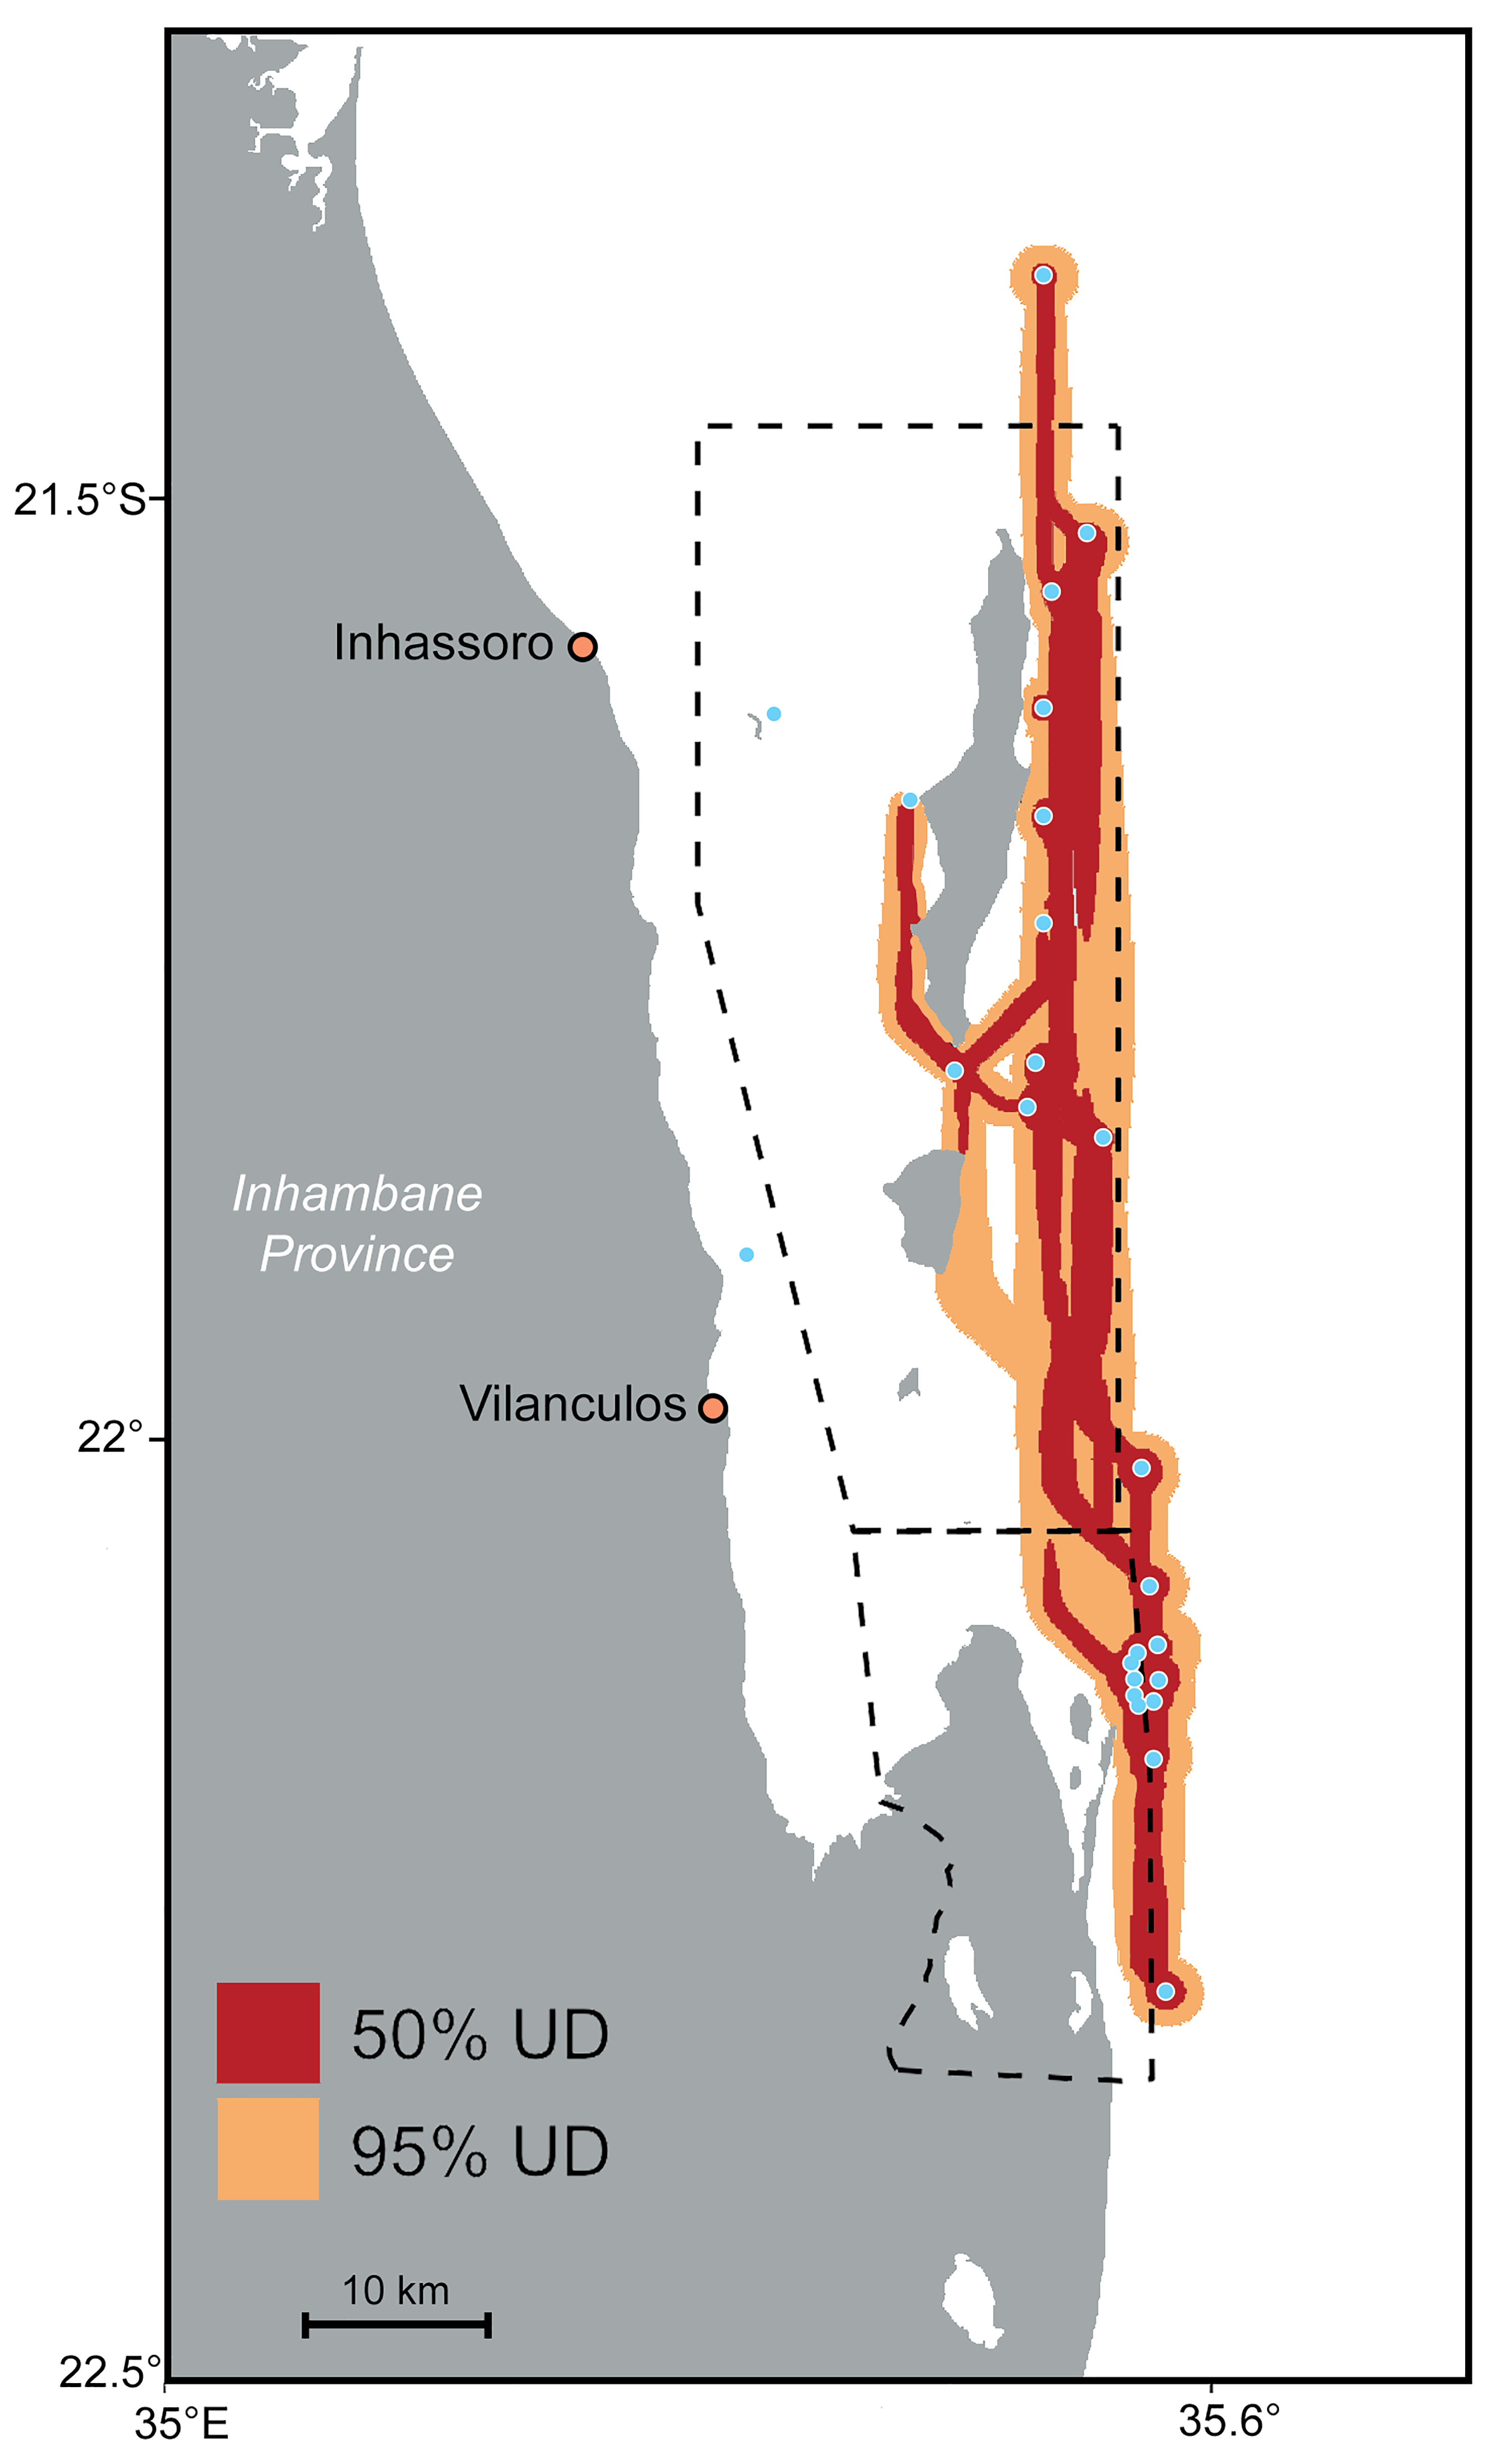
The individual utilisation distributions (UD) calculated from the dBBMMs showed high individual variability across the Bazaruto-tagged sharks. Core habitat (50% UD) ranged between 21–855 km2 (mean = 342 ± 221 km2), and extent habitat (95% UD) ranged from 127 to 4612 km2 (mean = 1791 ± 1109 km2; Table 3). Individual core habitats were located almost exclusively on the seaward side of the Bazaruto archipelago and inshore waters off the San Sebastian peninsula (Figure S5).
Combined across all sharks, the core and extent habitats spanned the seaward side of the Bazaruto archipelago, with the core habitats occurring to the northeast of Bazaruto Island (between sites ALN and NM), slightly offshore of the southern tip of Bazaruto (around sites TM_N, TM_S and GAP) and off the San Sebastian peninsula along a rocky ridge line of reefs (sites BEST to TPN), and around the most southerly site (BUMP) towards the south of the VCWS (Figure 5). Combined UDs showed that the landward side of the islands was not used frequently by bull sharks, aside from a stretch along the west coast of Bazaruto Island, from sites GAP to ZP (Figure 5). Of the combined core habitat (50% UD) for Bazaruto-tagged bull sharks, 82% was inside protected area boundaries (BANP and VCWS), and 18% outside. The main areas where core habitat fell outside of protected area boundaries were located seaward of the eastern boundary of VCWS and the southeast corner of BANP, and to the north of the BANP northern boundary (Figure 5). Raw detections were also heavily weighted to receivers inside MPAs (85%, when removing detections from #03), compared to detections at receivers outside of MPAs (15%; Table S1). It is also important to consider that receiver placement was somewhat biased, with 16 receivers located inside of protected area boundaries (11 in BANP, 5 in VCWS), and 9 outside of MPA boundaries (Figure 5).

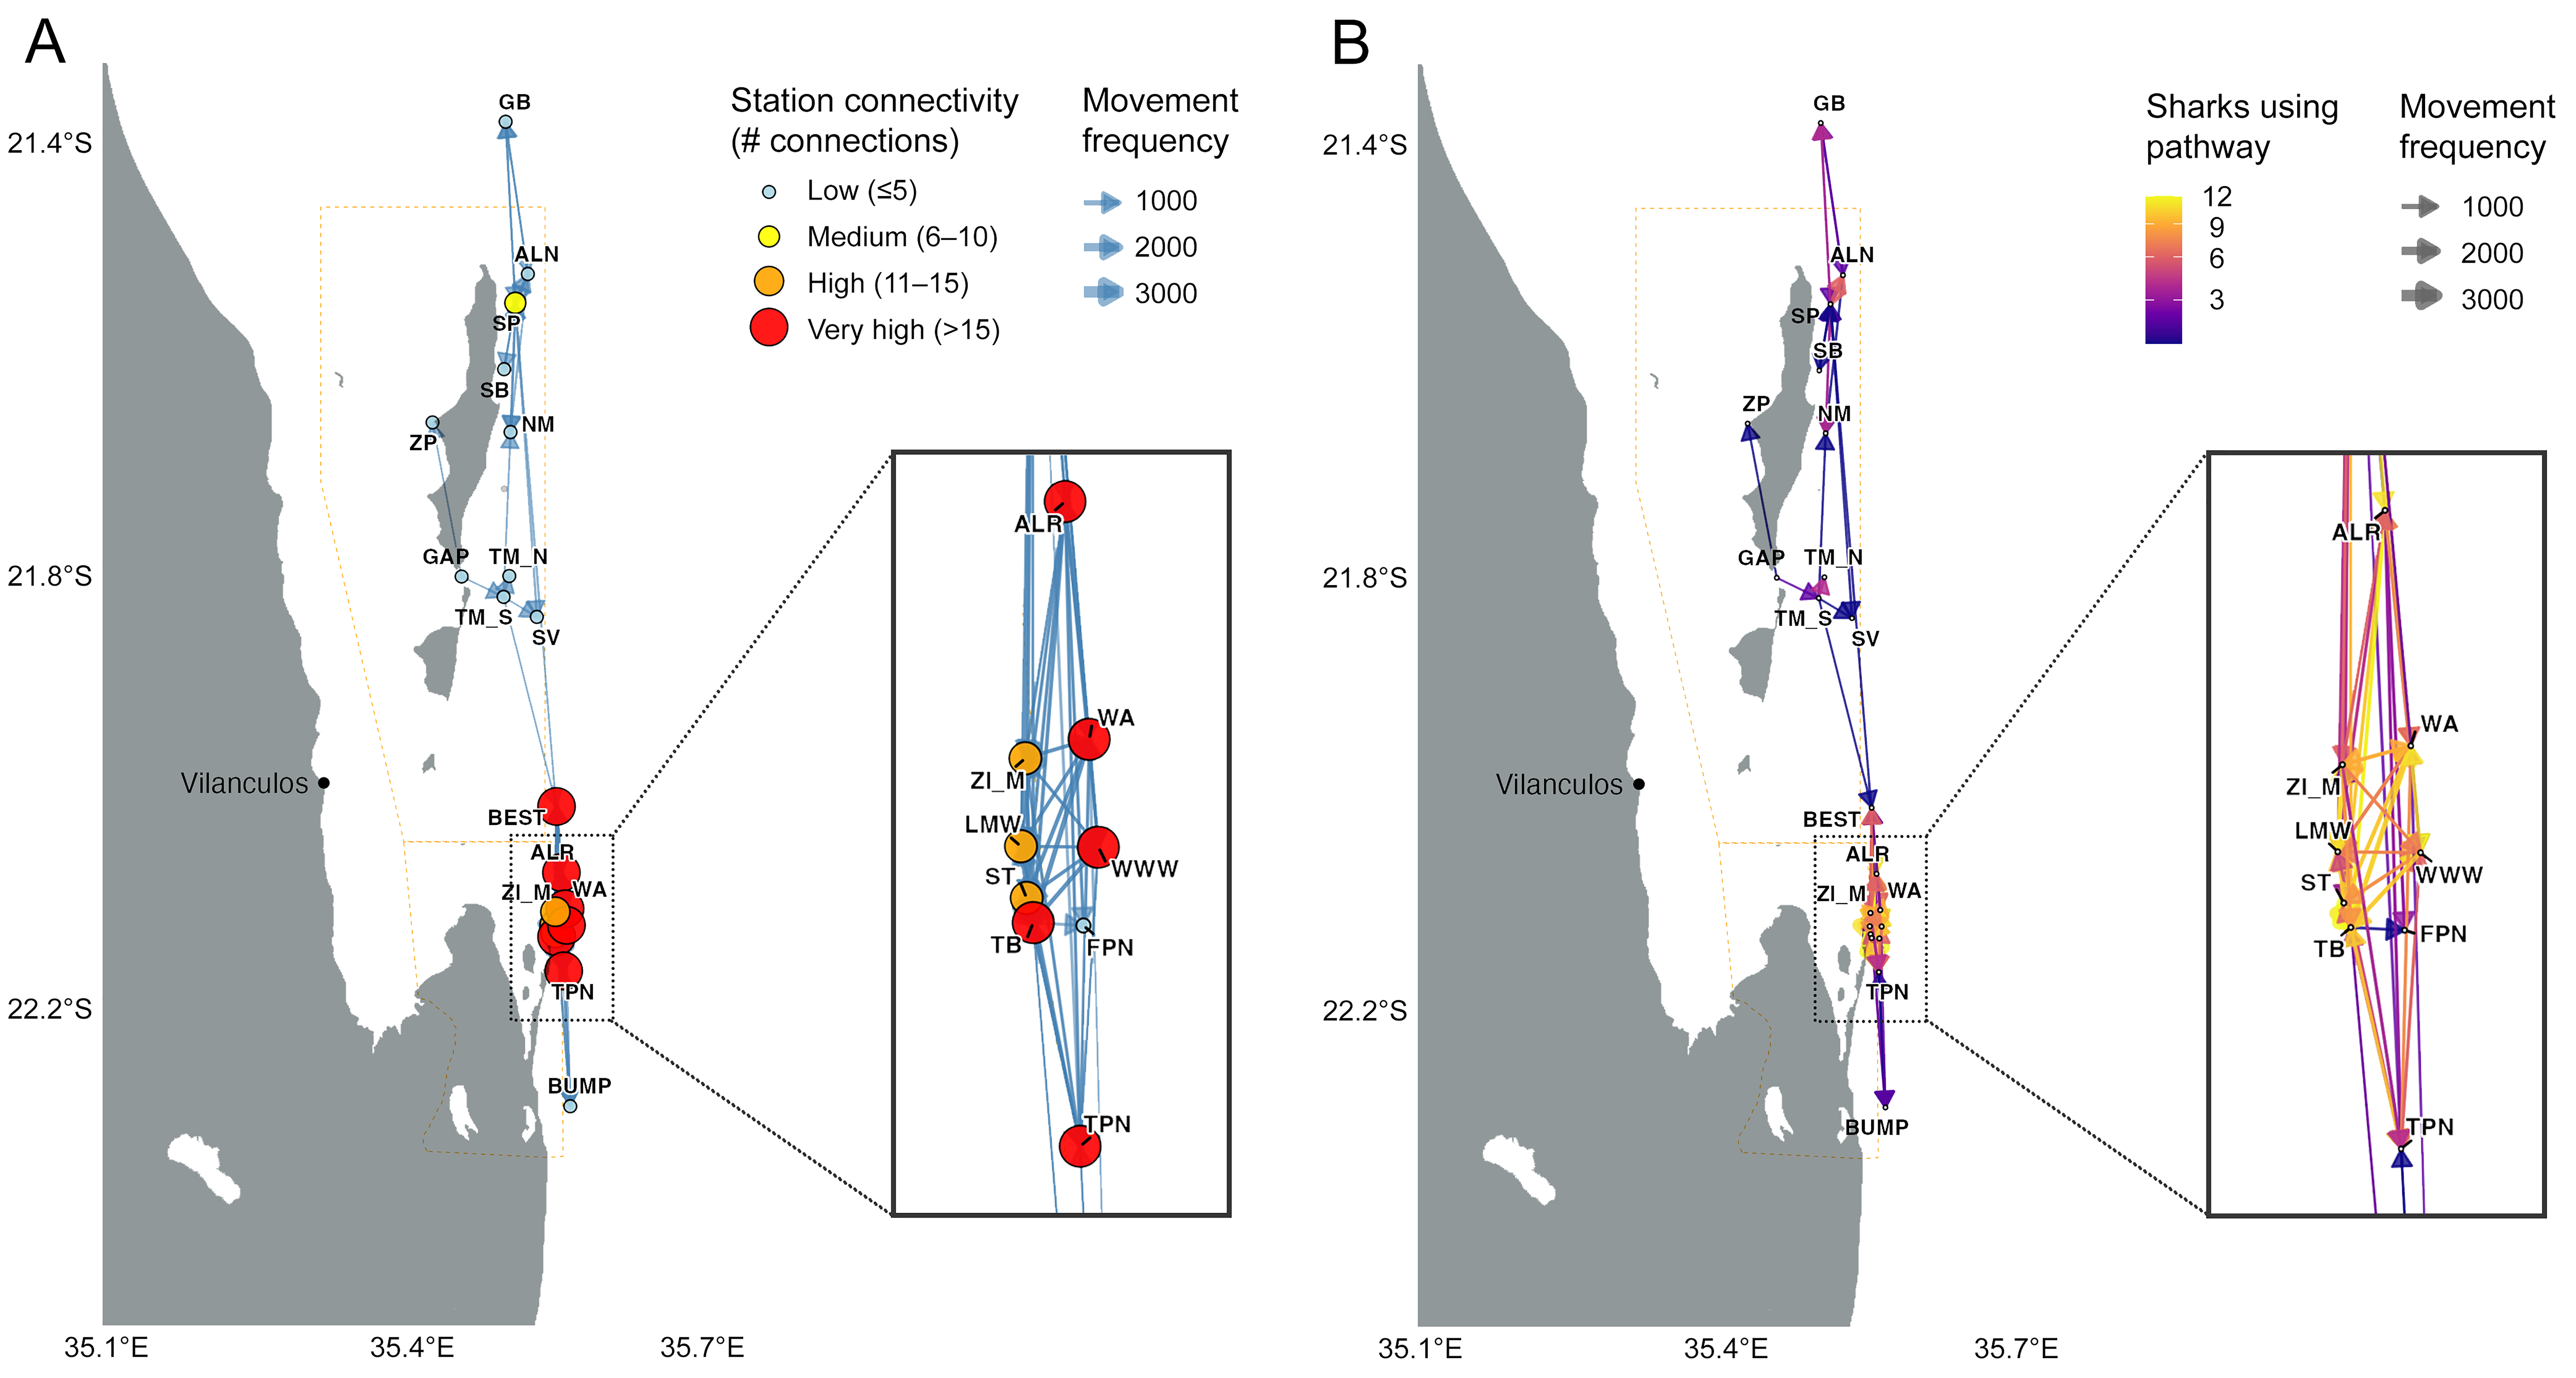
3.7. Movement Networks

The movement network for the Bazaruto Seascape (including only Bazaruto-tagged sharks) showed a high level of connectivity between sites, consisting of 21 nodes and 94 edges (total weight of edges = 15,845), with an edge density of 0.224 (Figure 6). The strongest edges were between closely located receiver sites off San Sebastian (edge weight TB > ST = 3491, ST > TB = 3473 ~0.4 km apart; edge weight TB > LMW = 925, LMW > TB = 972 ~1.2 km apart).
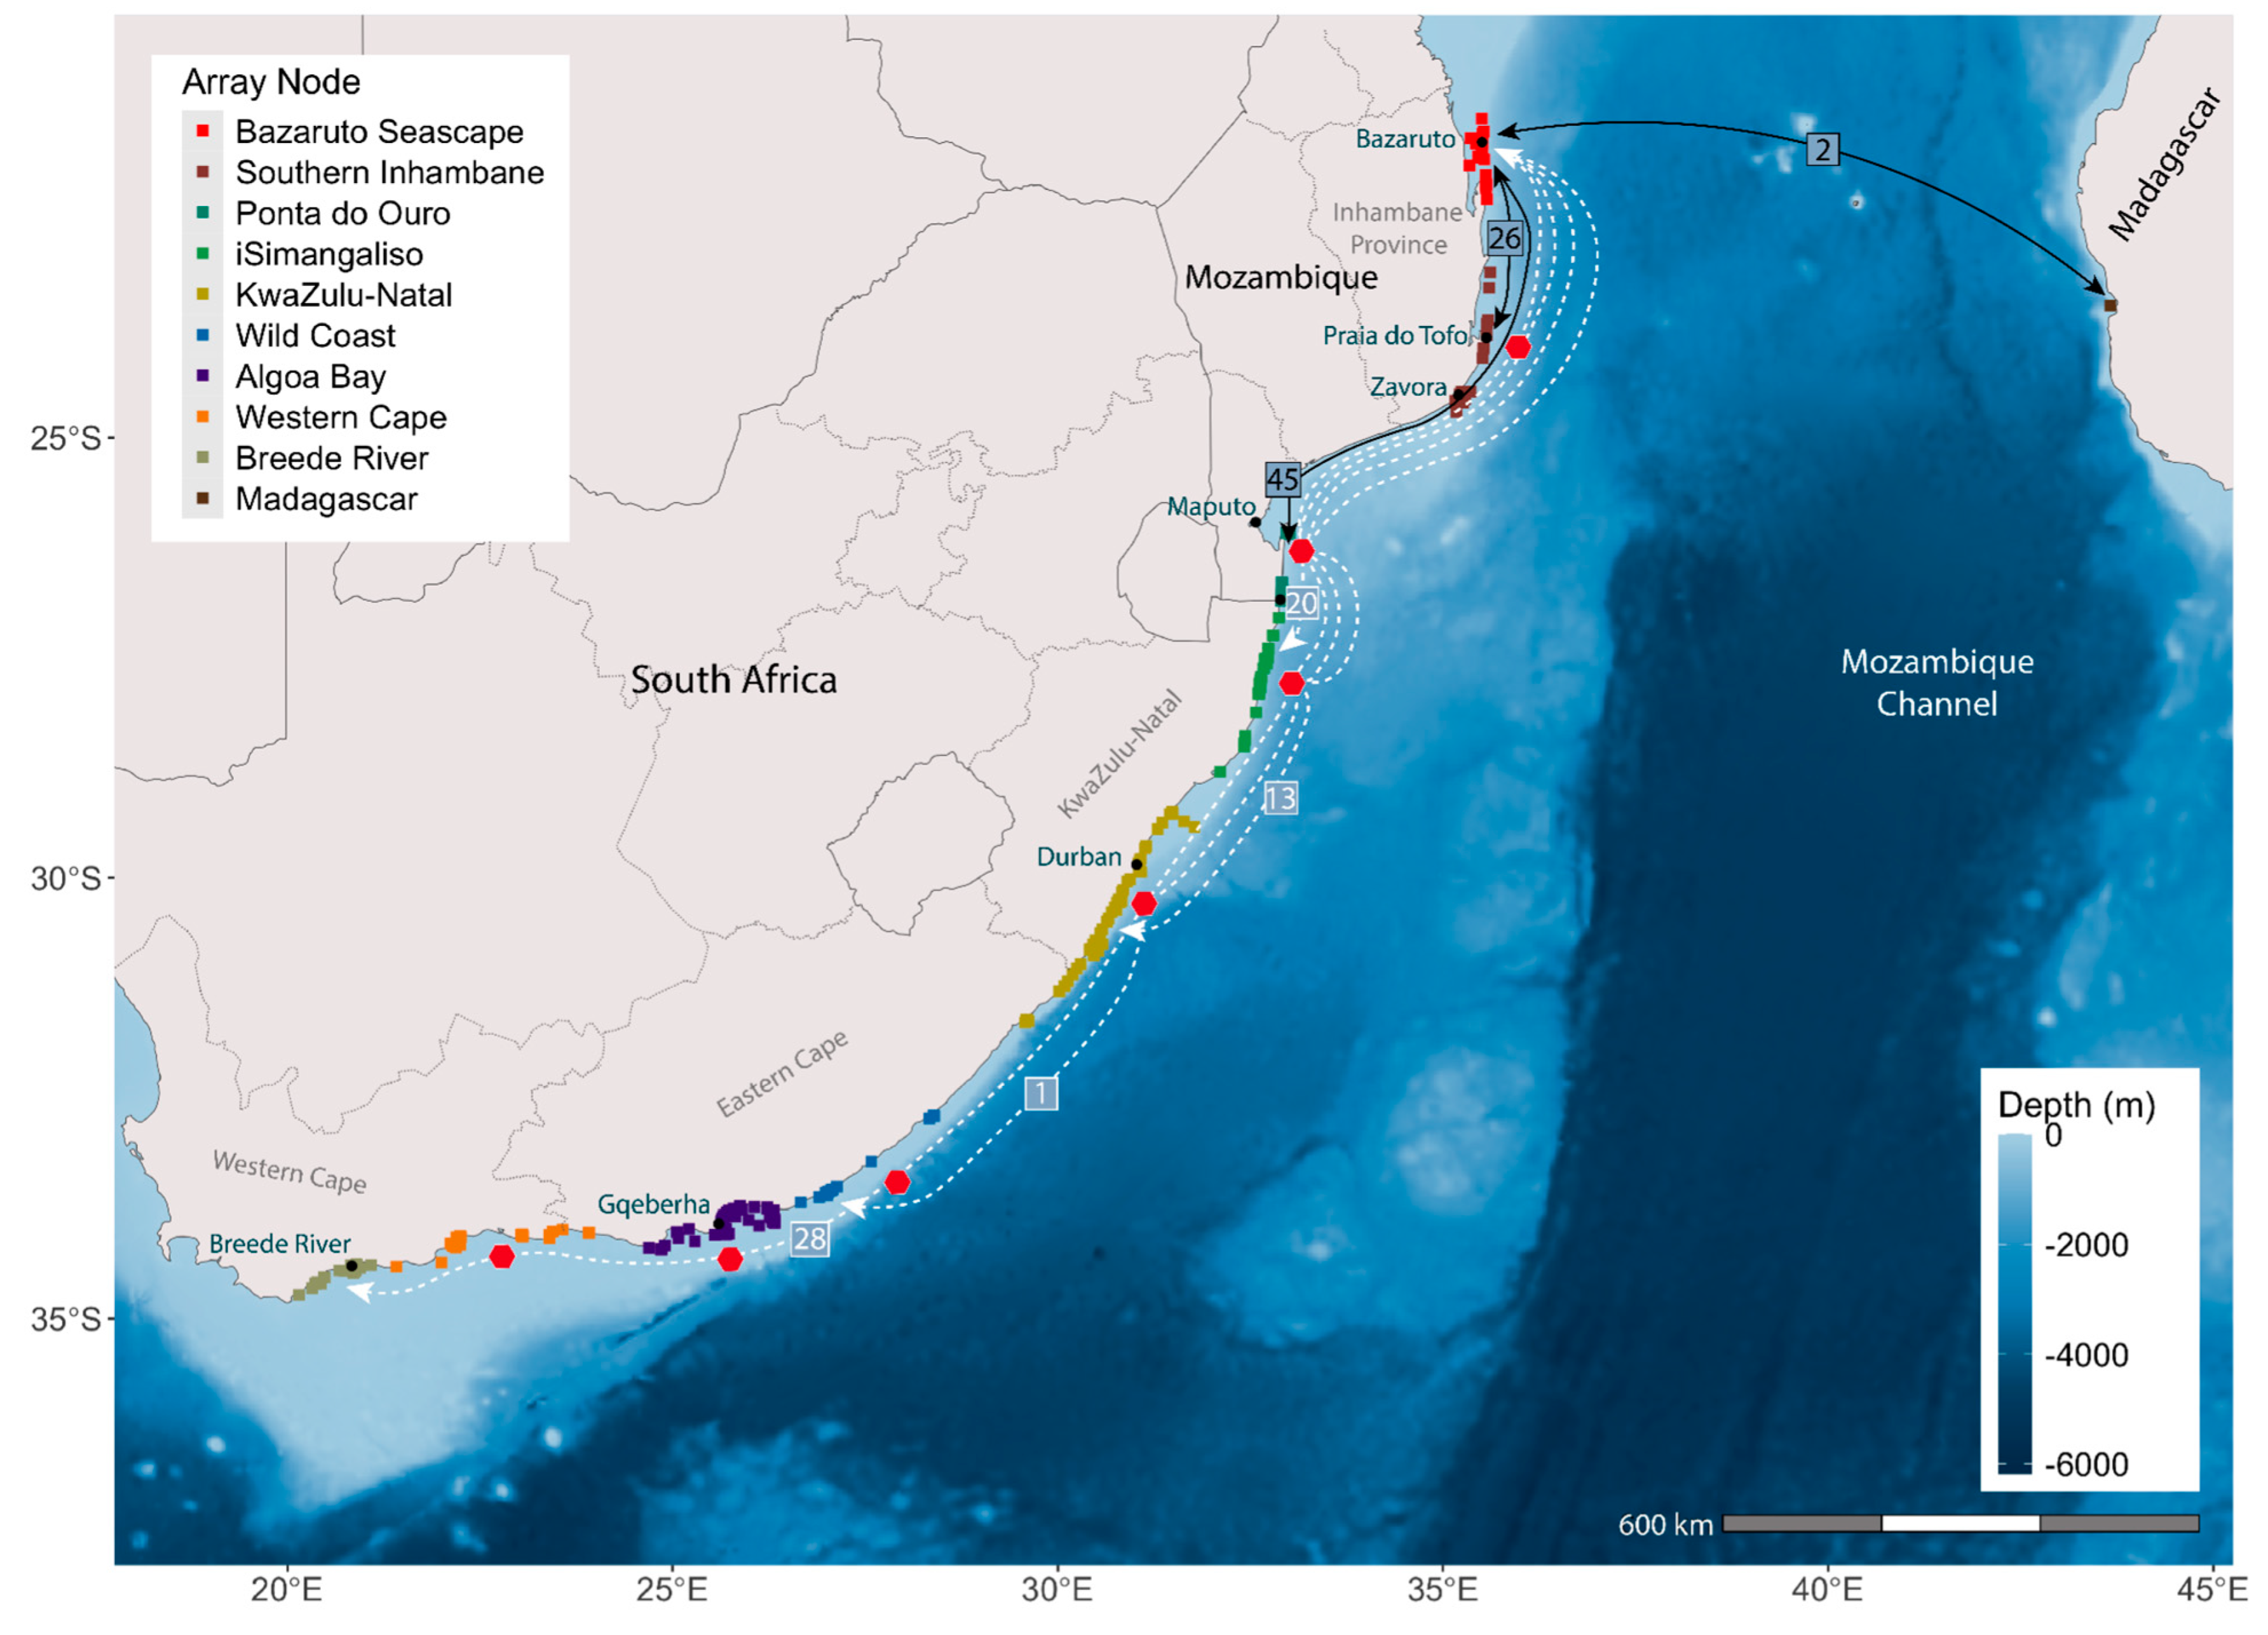
The broader regional movement network showed connectivity between the Bazaruto Seascape and other arrays throughout southern Mozambique, South Africa, and Madagascar. Tagged sharks moved between the Bazaruto Seascape and six distinct receiver arrays: Southern Inhambane, Ponta do Ouro, iSimangaliso, KwaZulu-Natal, Wild Coast, and Breede River. Movements included up to seven intermediate stops (Figure 7).
Movements without detections at intermediate arrays were recorded between the Bazaruto Seascape and both Southern Inhambane (16 movements by 7 individual sharks) and Ponta do Ouro (45 movements by 16 sharks). Movements between iSimangaliso and Bazaruto (20 movements by 11 sharks) included one or two intermediate stops at Ponta do Ouro and/or Southern Inhambane. Five sharks undertook 13 movements between KwaZulu-Natal and Bazaruto, stopping at iSimangaliso and/or Ponta do Ouro. One shark moved from the Wild Coast to Bazaruto, with intermediate stops at the KwaZulu-Natal, iSimangaliso, and Ponta do Ouro arrays. Finally, 28 movements between Breede River and Bazaruto were made by six individual sharks, each with two to seven intermediate stops at all possible arrays along the route (Figure 7).
Notably, a female bull shark (shark #10) tagged in the Bazaruto Seascape in 2020, completed a return movement to Toliara in southwest Madagascar, crossing the Mozambique Channel in 2023 and returning in 2024. The shark was consistently detected around Bazaruto until 19 April 2021, after which no detections were recorded until 6 January 2024, when six consecutive detections were logged on a deep water (~200 m) receiver deployed off Toliara—a minimum distance of 865 km from Bazaruto. The shark returned to the Bazaruto Seascape on 15 June 2024, 161 days later, indicating a minimum swim speed of 5.4 km per day. This shark continued to be detected in the Bazaruto Seascape through the end of the study period in November 2024 (see also Figure 2).

3.8. Transient Visitation Patterns

A total of 2058 detections were recorded in the Bazaruto Seascape from 22 bull sharks tagged in Ponta do Ouro and South Africa. These sharks visited the same receivers most frequented by Bazaruto-tagged individuals, particularly inshore rocky reefs and sand flats around San Sebastian (TB = 28.9%, LMW = 14.6%, ST = 11.0% of ‘other shark’ detections), as well as deeper rocky reefs and pinnacles such as SP, BEST, and ALR (Table S3). The highest number of individuals was recorded at BEST (16 individuals), followed by ALR, SP, and TB (15, 14, and 14 individuals, respectively). At the population level, no significant annual cycle was detected in transient-shark visits after accounting for individual variations; apparent monthly clustering (Figure S6) reflects visit timing of a small number of frequently detected individuals rather than a systematic seasonal pattern. Up to 14 individuals were detected in a single month, with higher monthly counts in April–May and August–November (Figure S6), aligning with seasonal detection patterns of Bazaruto-tagged sharks. Individuals tagged in South Africa were not detected in Bazaruto in January or February.
Sharks tagged outside of Bazaruto were generally transient visitors to the region. Individuals made between 1 and 17 ‘visits’ to Bazaruto (mean = 5.6 ± 4.7 visits per individual). Visit durations ranged from 1 to 47 days (mean = 3.8 ± 6.2 days), but the number of detected days was typically lower (mean = 2.4 ± 2.8 days, max = 20 days), with no more than five consecutive detection days recorded per visit. Mean total detections per visit was 16.7 ± 33.2, max = 222 detections.
Most visits were brief and episodic, with 81% lasting fewer than five days and recording between 1 and 86 detections. Visits were typically followed by either a detection at an array to the south (typically Ponta do Ouro or Southern Inhambane), suggesting a southerly departure from the region, or by a prolonged absence in detections before the shark was again recorded in Bazaruto and subsequently detected further south. This latter pattern indicates excursions northward or offshore movements beyond the coverage of the receiver network before the sharks moved south down the coast (Figure S2). Four mature females (sharks #39, #23, #19, and #30) spent >14 days in the Bazaruto Seascape, with longer visit durations up to 47 days (max = 20 detected days), and higher detection counts (up to 222 detections per visit; Table S2 and Figure S2).
Notably, male bull sharks tagged in the Breede River exhibited regular, seasonal return migrations between the Western Cape, South Africa, and the Bazaruto Seascape. These movements were typically separated by a detection gap between northerly and southerly legs, suggesting continued movement into central Mozambique or offshore, beyond the receiver network. Two males (#33 and #35) were detected in the seascape every year after they were tagged (in 2019 and 2020, respectively) through to the end of the study (Figure S2). Other Breede-tagged sharks showed similar patterns, though they were not detected in Bazaruto during every survey year. Abacus plots (Figure S2) revealed consistent north–south movements, with the most northerly detections at Ponta do Ouro prior to the full receiver array deployment in the Inhambane Province in 2019/2020. Detection gaps prior to this time likely reflect spatial gaps in network coverage, suggesting sharks were present but were undetected north of Ponta do Ouro during those periods.

4. Discussion

This study provides a detailed assessment of adult bull shark habitat use, residency, and movement ecology in the Bazaruto Seascape. Bull sharks exhibited generally high residency and site fidelity, year-round presence, and strong connectivity with regional aggregation sites throughout southern Mozambique and South Africa. While some individuals, particularly mature females, were highly resident within the Bazaruto Seascape, others made transient visits or large-scale movements, connecting Bazaruto with other key aggregation areas such as Ponta do Ouro in southern Mozambique and the Breede River in South Africa. The record of a bull shark undertaking a return migration from Bazaruto to Madagascar further highlights the regional, transoceanic and transboundary nature of bull shark movements in the Western Indian Ocean. Collectively, these findings indicate that the Bazaruto Seascape serves as both a site of prolonged use for resident female sharks and a waypoint for visiting sharks within a broader coastal movement corridor.

4.1. Residency and Habitat Use

High residency indices recorded for bull sharks tagged in the Bazaruto Seascape, together with the high proportion of detections within the local array, indicate prolonged occupancy and site fidelity for mature female sharks. These residency levels (overall Rmax = 0.45) are comparable to, or exceed, those reported for the species at other coastal aggregation sites globally. For example, mean Rmax values of 0.19 (maximum = 0.69) were reported for bull sharks tracked off Townsville in the central Great Barrier Reef, Australia [21], and 0.36 (maximum = 0.74) in Cabo Pulmo National Park in the Gulf of California [58]. At nearby aggregation sites along the southeast African coast, mean residency indices were lower, at 0.19 (maximum = 0.60) for sharks tagged at Ponta do Ouro and 0.26 (maximum = 0.39) for the Breede River [22]. In contrast, the single tagged male in Bazaruto exhibited the lowest residency and detection frequency within the seascape, aligning with patterns reported elsewhere in which male bull sharks exhibit more mobile or transient behaviour than females in coastal systems [22,58,59]. Collectively, the high residency of mature females suggests that the Bazaruto Seascape may serve an important reproductive role, perhaps aiding gestation, or functioning as a resting and/or foraging area that promotes repeated site use [60].
Residency within the Bazaruto Seascape varied among sites and individuals, with sharks tagged in Bazaruto showing higher residency than those tagged elsewhere along the southeast African coast. Bull sharks are known to exhibit natal philopatry [61], which may play an important role in determining the habitat associations of individuals that showed greater than average residency throughout the study period. Bull sharks typically use estuarine and riverine environments as nursery habitat due to reduced predation risk and interspecific competition [62,63]. Nearby potential nursery areas, such as the Save River delta, may therefore be important pupping areas for mature females that spend extended periods of time in the Bazaruto Seascape; however, more research is required to confirm the importance of potential nursery habitats in the region. Sharks also showed strong preferences and site fidelity for inshore areas off the San Sebastian Peninsula and rocky reefs off northern Bazaruto Island. In an open coastal system where bull sharks are capable of extensive movements, sustained detections on up to one-quarter of monitored days highlight the ecological importance of these areas, consistent with core habitat use supporting key functions such as foraging or resting. For resident sharks, targeted spatial management (e.g., protected area expansion or stricter fishing gear regulations) that prioritises protection of these core habitats could effectively support conservation objectives for bull sharks and other large elasmobranchs that rely on the same areas [64,65]. For transient sharks, a broader network of protected areas that includes important habitats used for reproduction and foraging may be critical for their conservation within the broader region. To understand the full scope of critical habitats throughout the range that these tagged sharks travelled (from the Western Cape Province in South Africa to northern Mozambique and Madagascar), further studies are required that focus on sharks in different locations and from a broader range of size classes to identify the most important habitats.

4.2. Seasonal and Diel Patterns

Year-round detections of bull sharks in the Bazaruto Seascape indicate that environmental conditions, particularly sea temperature, are suitable for year-round occupancy. Seasonal peaks in detections during the austral winter (April–September) coincided with cooler-water conditions and likely reflect responses to seasonal temperature shifts at aggregation sites further south in Mozambique and South Africa, and/or changes in prey availability along the southeast African coast [20,22]. Indeed, bull sharks are known to undertake seasonal migrations to higher latitudes during summer [66]. Diel patterns in detections varied among sites, indicating site-specific habitat use across the seascape. Bull sharks were detected more frequently during the daytime at deeper rocky reefs and pinnacles off the San Sebastian peninsula, suggesting these habitats may function as resting or aggregation sites between foraging periods. This is consistent with bull shark habitat use on the east coast of Australia, where bull sharks use nearshore sites more frequently in the afternoon and evening [66]. However, inshore sites within the VCWS recorded peak detections at dawn and dusk, consistent with crepuscular feeding behaviour typical of coastal carcharhinids [67,68]. Contrasting diel patterns were observed at two nearby sites off Bazaruto Island, where sharks were detected more during the day at a ~45 m deep rocky ridge (ALN), with higher nighttime detections at a slightly shallower reef site (SP), suggesting complementary habitat roles (e.g., feeding, resting, or refuge) despite their proximity. Similar diel shifts in habitat use have been reported for bull sharks in Sydney Harbour, Australia, and Ponta do Ouro, Mozambique, where day–night movements were likely driven by foraging behaviour [20,69]. From a management perspective, these patterns highlight the importance of protecting a diversity of habitats within the seascape to encompass the full range of ecological functions used by bull sharks.

4.3. Activity Spaces and Local Movement Networks

Bull sharks exhibited variable space use patterns, with individual habitat use ranging from highly resident to wide-ranging throughout the study area. Such inter-individual variability is common in bull sharks and may be driven by a combination of diverse foraging strategies, environmental preferences, learned behaviour, or other contextual factors that vary across space and time [21,59,60]. Individual activity space quantified using utilisation distributions (UDs) ranged between 21 and 855 km2 (50% UD, core habitat) and 127 to 4612 km2 (95% UD, extent habitat). Although the full extent of activity spaces was constrained by the coverage of the receiver array, particularly in offshore waters, these areas were generally consistent with large, highly mobile marine species [70,71], and are substantially larger than previously reported for juvenile bull sharks [72], likely reflecting ontogenetic differences in movement and habitat use. The broad range of activity spaces highlights the influence of multiple, interacting drivers of habitat use in bull sharks. Sites with the highest habitat use were typically associated with individuals that exhibited the most restricted activity spaces. Preferred sites were reef slopes and rocky reefs on the seaward side of Bazaruto and off the tip of the San Sebastian Peninsula, along a line of rocky reefs and a wider, shallow sandy-bottomed area that extends out from the peninsula. Typically, these sites were deeper (>25 m deep), productive (abundant and diverse marine life), and important areas for other species, such as cleaning stations for manta rays and other batoid species [30,39]. Bull sharks in the region exhibit periods of increased residency and restricted space use at fish aggregation sites [22], and foraging may be an important driver of restricted space use. However, for some sharks with particularly restricted activity spaces (e.g., shark #03), additional factors may influence such site-restricted behaviour. Movement networks showed strong local connectivity among reef sites around San Sebastian and the Bazaruto Archipelago, demonstrating the internal cohesiveness of the seascape. This highlights the importance of coordinated management between BANP and VCWS for bull sharks, among other mobile marine species that routinely move within and between these neighbouring protected areas.
While the majority (82%) of core habitat areas (50% UD) fell within existing MPAs, 18% occurred outside protected area boundaries, indicating only partial coverage of important habitats. The areas of core habitat that remain outside of protected area boundaries are located along the eastern boundary of VCWS and the southeast corner of BANP. These findings highlight the ecological importance of adjacent offshore reef systems and support the need for seaward boundary expansions to encompass these areas and improve protection for bull sharks and other threatened species.
Moreover, most MPA zones overlapping bull shark core habitat areas permit fishing activities (including netting and line fishing), offering limited protection to sharks and other marine species; see [73]. Although bull sharks are afforded legal protection within protected areas in Mozambique due to their CITES-listed status [33], they may still be incidentally captured by recreational and artisanal fisheries operating within both BANP and VCWS. Outside of protected area boundaries, bull sharks have limited protection beyond the 150 cm TL minimum size limit, and may be captured in commercial, artisanal, and recreational fisheries [34]. Based on modelling of movement data and MPA effectiveness, Dwyer et al. [3] suggest that no-take zones spanning over 50 km may be required to offer adequate protection for mobile reef-associated sharks, with this area likely to be far larger for highly mobile species like bull sharks. Global analyses further emphasise the importance of embedding such protected areas within broader complementary fisheries management frameworks operating at national or regional scales [1].
Nevertheless, inclusion of core habitat within managed areas provides an initial framework for practical conservation action, as it can facilitate the implementation of stricter spatial measures such as no-take zones or gear-specific restrictions in locations already under management jurisdiction. Establishing new protected areas is often a lengthy process involving regulatory, financial, and sociopolitical challenges, particularly in developing nations where competing resource use priorities and limited capacity can hinder progress. Working within existing frameworks, therefore, represents a pragmatic first step towards improved protection.
An important consideration is that our interpretation of space use patterns is constrained by the bias of receiver placement, with more receivers located inside of MPA boundaries (particularly BANP), as well as limited east–west array coverage, meaning offshore movements and deeper site use remain unknown. Future offshore expansion of this receiver array would refine estimates of core habitats and inform more effective MPA boundary adjustments. Collectively, these findings provide a strong basis for seaward MPA expansion to encompass the deeper, ecologically important reef systems adjacent to the current BANP and VCWS boundaries, which would extend the legal protection afforded to bull sharks and other CITES-listed species into these critical habitats.

4.4. Transient Visits and Regional Movements

In addition to supporting resident bull sharks, the Bazaruto Seascape appears to function as an intermittent waypoint within a broader regional movement corridor. Bull sharks tagged at aggregation sites in Mozambique and South Africa were detected in the seascape, typically for short periods, using the area as a stopover during broad-scale movements linking the seascape with southern Inhambane, Ponta do Ouro, KwaZulu-Natal, and as far south as the Breede River. This underscores the region’s role as a connective node along the southeast African coast. Most transient visits were brief (<5 days) and seasonal, occurring predominantly between May and November, consistent with previously documented north–south return movements along this coast [20,22]. Notably, male bull sharks tagged in the Breede River returned annually to the Bazaruto Seascape, suggesting predictable migratory behaviour potentially linked to seasonal temperature gradients, reproductive cycles, or foraging opportunities [22]. Gaps in detections between northerly and southerly movements further suggest that transient individuals continue northward or move offshore beyond receiver network coverage, consistent with satellite-tracked bull sharks that moved north along the Mozambican coast into Sofala and Zambezia Provinces, and beyond [22].
Regional connectivity extended beyond southern Africa, with evidence of a return movement by an adult female across the Mozambique Channel (minimum round-trip distance of 1730 km), after which the shark remained in the Bazaruto Seascape until the end of the study period. Comparable long-distance cross-channel movements by adult females have been documented elsewhere in the Western Indian Ocean (WIO), including movements between Ponta do Ouro and Nosy Be, northwest Madagascar (minimum round-trip distance of 4500 km) [23], and between Seychelles and southeast Madagascar, where a pregnant female likely visited a pupping ground before returning [24]. Additionally, one adult female included in this study (shark #37) travelled from Bazaruto around the southern tip of South Africa into the Atlantic Ocean before being landed in a fishery off Nigeria, representing the longest recorded (>7290 km) and first documented transoceanic movement for the species [25]. Together, these movements highlight rare but ecologically and genetically significant connectivity across oceanic scales; see [26], reinforcing the role of the Bazaruto Seascape as an important regional node for this bull shark population.
The regional connectivity documented here is consistent with genetic evidence suggesting that WIO bull sharks form part of a single, broadly connected breeding population [26,27]. Future integration of acoustic telemetry with complementary methods such as population genetics and stable isotope analysis would allow for ground-truthing of these connectivity patterns, better resolution of female philopatry, and a stronger evidence base for transboundary conservation management.
As with the Bazaruto Seascape array, interpretation of these movement patterns is constrained by the spatial extent of the acoustic array, which likely underrepresents offshore movements and northern coastal habitat use of bull sharks. Expanded receiver coverage along the central Mozambican coast, combined with additional satellite tagging, would improve our understanding of the spatial limits and drivers of these migrations. In particular, further investigation of putative aggregation sites such as Zavora in southern Inhambane Province, where bull sharks are frequently observed on deeper rocky reefs [74] and where individuals tagged in the Bazaruto Seascape were detected, may help clarify whether these areas function as additional stopover sites within the movement corridor or support distinct resident subpopulations. Identifying pupping and nursery habitats for bull sharks in Mozambique is also an important step towards better guiding conservation management priorities [63].

4.5. Conservation and Management Implications

The Bazaruto Seascape supports both resident and transient bull sharks, highlighting its dual importance as an area of core habitat and a connective node within a broader regional movement network, with direct implications for spatial planning and conservation management. Effective conservation of this vulnerable and highly mobile species requires management at multiple spatial scales, combining site-based protection of core habitats with coordinated regional strategies.
High residency and concentrated core habitat use within BANP and VCWS demonstrate the value of existing MPAs. However, the presence of bull shark core habitat within MPA boundaries does not necessarily equate to effective protection, as key habitats overlap with zones where fishing is permitted and, in some areas, extend beyond protected area boundaries, limiting the effectiveness of current protection. Our findings support consideration of the following local management actions:
Adjusting MPA boundaries through a seaward extension of BANP and VCWS, implementing associated buffer zones, to incorporate outer reef habitats and movement corridors that currently fall outside protected area boundaries, including reef systems located approximately 1.5–2 km offshore of the San Sebastian peninsula.
Implementing and enforcing gear restrictions, e.g., prohibiting gill netting around reef systems that overlap with bull shark core habitats. Such measures are actionable within existing management frameworks and would reduce incidental capture risk for bull sharks and other threatened species.
Strengthening coordinated co-management between BANP and VCWS, given the strong connectivity documented between these areas, to ensure management measures are aligned and consistently applied across the seascape.
Integrating bull sharks into coordinated multi-species management objectives, as protection of these habitats will also benefit other threatened taxa, including reef-associated sharks and rays, groupers, sea turtles, and other megafauna that use the same habitats.
While local spatial protection is a priority, it may be insufficient in isolation for a highly mobile species. Current national fisheries regulations for bull sharks in Mozambique set a minimum size of 150 cm TL under REPMAR 2020 [34]. Although this provides a baseline for individual protection, this limit is well below the size at maturity and does not fully safeguard juveniles nor account for the extensive movements of adults across unprotected areas. Integrating MPAs with complementary national and regional fisheries regulations is therefore essential to reduce fishing mortality and ensure the long-term conservation of bull sharks in the WIO. Our findings support consideration of the following regional-scale management actions:
Strengthening enforcement of existing national fisheries regulations, including the minimum size limit of 150 cm TL. Consideration should be given to increasing the minimum size limit or prohibiting bull shark capture outside of protected areas.
Developing coordinated, transboundary bull shark management plans between Mozambique and South Africa, with scope for broader WIO collaboration, as per [6], incorporating fisheries management measures, such as coordinated catch regulations, restrictions on high-risk gear types (e.g., gillnets and longlines), and seasonal protections aligned with known aggregation or migration periods.
Supporting Mozambique’s engagement with international conservation mechanisms, including consideration of accession to the Convention on Migratory Species (CMS) Sharks Memorandum of Understanding, alongside targeted capacity building for Mozambican fisheries and research institutions, and access to international funding mechanisms to ensure effective implementation of regional management commitments.
Strengthening regional scientific monitoring and data sharing through integrated, collaborative acoustic telemetry networks, expanded satellite tagging programmes, and shared reporting frameworks across jurisdictions.

5. Conclusions

Overall, our findings highlight the ecological and conservation significance of the Bazaruto Seascape to the WIO bull shark population, providing important habitats for resident sharks and an essential link between southern aggregation sites and northern habitats. Effective management will depend on maintaining habitat integrity within MPAs, improving protection of adjacent unprotected reefs, mitigating fisheries-related threats (unregulated coastal fishing and bycatch), and fostering collaborative, transboundary conservation strategies that reflect the scale of bull shark movements. Future research priorities include expanding acoustic receiver coverage along the Mozambican coast, identifying nursery habitats in the region, and broadening satellite tagging efforts to resolve the full extent of bull shark movements across the WIO region.

Supplementary Materials

The following supporting information can be downloaded at: https://www.mdpi.com/article/10.3390/fishes11050291/s1, Table S1. Receiver summary statistics, ordered by latitude (north to south) for the two acoustic detection datasets (A) bull sharks tagged in the Bazaruto Seascape (n = 16), and (B) all bull sharks tagged throughout Mozambique and South Africa, including Bazaruto-tagged sharks (n = 38). Table S2. Receiver summary statistics for detections of bull sharks tagged outside the Bazaruto Seascape (n = 22) on receivers in the Bazaruto Seascape, ordered by total number of detections. Table S3. Summary statistics of “visits” to the Bazaruto Seascape by individual bull sharks tagged outside the Bazaruto Seascape (n = 22). Figure S1. Map showing existing protected area boundaries (orange dashed lines) and current protection zones within each area (shaded red). Figure S2. Individual acoustic detection histories of all tagged bull sharks (n = 38) at all receivers between 2012 and 2024. Figure S3. Model predicted monthly detections of bull sharks tagged in the Bazaruto Seascape (excluding shark #03; n = 15) at the ten most-visited receivers in the Bazaruto Seascape from 2019 to 2024. Figure S4. Model predicted monthly detections of all bull sharks tagged in the Bazaruto Seascape (n = 16) from 2019 to 2024 (A) combined across all receivers in the Bazaruto Seascape. (B) at the ten most-visited receivers in the Bazaruto Seascape. Figure S5. Core and extent habitats—50% and 95% utilisation distributions (UD), respectively—derived from dynamic Brownian Bridge Movement Models (dBBMMs) for individual bull sharks tagged in the Bazaruto Seascape (n = 16). Figure S6. Monthly detections of bull sharks tagged outside of the Bazaruto Seascape (n = 22).

Author Contributions

Conceptualization, L.M., R.D. and A.D.M.; Methodology, L.M., R.D., A.D.M. and S.K.V.; Formal Analysis, S.K.V., C.A.R. and J.v.R.; Investigation, L.M., R.D., J.D.F. and S.K.V.; Data Curation, S.K.V., L.M. and R.D.; Writing—Original Draft Preparation, S.K.V., C.A.R. and R.D.; Writing—Review and Editing, S.K.V., L.M., C.A.R., J.v.R., N.d.C., J.D.F. and R.D.; Visualisation, S.K.V. and C.A.R.; Project Administration, L.M. and S.K.V.; Funding Acquisition, L.M., A.D.M. and R.D. All authors have read and agreed to the published version of the manuscript.

Funding

This research received funding support from the Blue Action Fund and the Shark Conservation Fund via the WILDTRUST, through its WILDOCEANS programme. This research received external funding from Ocean Wildlife Project e.V., SHARKPROJECT GERMANY e.V., ElasmOcean e.V., and Wageningen University’s department of Marine Animal Ecology (MAE).

Institutional Review Board Statement

The animal study protocol was approved by the Animal Ethics Committee of the South African Institute for Aquatic Biodiversity (REF#: 25/4/1/7/5_2019-04, approved 18 March 2019) and all research was conducted in accordance with the requirements of the Marine Megafauna Foundation Animal Ethics policy, approved April 2019. Permission to conduct research within the Vilanculos Coastal Wildlife Sanctuary was granted by the management of Santuario Bravio de Vilanculos Lda under permit number TPZSS_0621MMF. Permission to conduct research within the Bazaruto Archipelago National Park was granted by Parque Nacional do Arquipélago do Bazaruto and Administraçao Nacional das Areas de Conservaçao (ANAC) under permit number N/Ref.03/PNAB/mm/024.1/2019. Permission to conduct research in the Ponta do Ouro Partial Marine Reserve (now the Maputo National Park) was granted under permit number 0002/2010.

Data Availability Statement

The data presented in this study may be made available on reasonable request from the corresponding author due to ongoing studies using the acoustic detection data.

Acknowledgments

We are grateful to the Vilanculos Coastal Wildlife Sanctuary, the Bazaruto Archipelago National Park, African Parks, Administraçao Nacional das Areas de Conservaçao (ANAC), Mozambique, and Instituto Oceanografico de Mocambique (InOM) for permitting and supporting the acoustic receiver array in Mozambique. We thank Peri-Peri Divers, MAR Expeditions, A. Rooney and J. Artendale, the Barlow family, and Our Children’s Earth Foundation for supporting MMF’s work in Mozambique. We are grateful to Nicky and Max Bernhard, Taryn and Dave Gilroy, Clare Prebble, Janneman Conradie, Justin Blake, Uli Kunz, Jochen Reiter, Zito Nhamirre, and Orlando Zivane for their assistance in the field, and to Salvatore Cerchio for sharing the Madagascar detections. Furthermore, we want to thank Wageningen University, Ocean Wildlife Project e.V., Shark Project Germany e.V., ElasmOcean e.V., Rotary Club Düsseldorf-Süd, The Rockhopper Fund, Charter Haus AG, Digital Gravity GmbH, and the Mueller Family for steadfast support and funding of this project. We are grateful to the iSimangaliso Marine Protected Area and iSimangaliso Wetland Park management and Ezemvelo KZN Wildlife, together with the Maputo National Park and management, for their ongoing support of our research. Finally, The ATAP thanks the following organisations for equipment and running expenses: NRF-SAIAB, the Ocean Tracking Network, the Department of Science and Innovation−Shallow Marine and Coastal Research Infrastructure programme, and the NRF-South African Environmental Observation Network Elwandle Node.

Conflicts of Interest

The authors declare no conflicts of interest.

References

  1. Goetze, J.S.; Heithaus, M.R.; MacNeil, M.A.; Harvey, E.; Simpfendorfer, C.A.; Heupel, M.R.; Meekan, M.; Wilson, S.; Bond, M.E.; Speed, C.W.; et al. Directed Conservation of the World’s Reef Sharks and Rays. Nat. Ecol. Evol. 2024, 8, 1118–1128. [Google Scholar] [CrossRef] [Scilit]
  2. Queiroz, N.; Humphries, N.E.; Couto, A.; Vedor, M.; da Costa, I.; Sequeira, A.M.M.; Mucientes, G.; Santos, A.M.; Abascal, F.J.; Abercrombie, D.L.; et al. Global Spatial Risk Assessment of Sharks under the Footprint of Fisheries. Nature 2019, 572, 461–466. [Google Scholar] [CrossRef] [Scilit]
  3. Dwyer, R.G.; Krueck, N.C.; Udyawer, V.; Heupel, M.R.; Chapman, D.; Pratt, H.L., Jr.; Garla, R.; Simpfendorfer, C.A. Individual and Population Benefits of Marine Reserves for Reef Sharks. Curr. Biol. 2020, 30, 480–489. [Google Scholar] [CrossRef] [Scilit]
  4. Sequeira, A.M.M.; Rodríguez, J.P.; Eguíluz, V.M.; Harcourt, R.; Hindell, M.; Sims, D.W.; Duarte, C.M.; Costa, D.P.; Fernández-Gracia, J.; Ferreira, L.C.; et al. Convergence of Marine Megafauna Movement Patterns in Coastal and Open Oceans. Proc. Natl. Acad. Sci. USA 2018, 115, 3072–3077. [Google Scholar] [CrossRef] [Scilit]
  5. Womersley, F.C.; Rohner, C.A.; Abrantes, K.; Afonso, P.; Arunrugstichai, S.; Bach, S.S.; Bar, S.; Barash, A.; Barnes, P.; Barnett, A.; et al. Identifying Priority Sites for Whale Shark Ship Collision Management Globally. Sci. Total Environ. 2024, 934, 172776. [Google Scholar] [CrossRef] [Scilit] [PubMed]
  6. Daly, R.; Venables, S.K.; Rogers, T.D.; Filmalter, J.D.; Hempson, T.N.; Murray, T.; Hussey, N.E.; Silva, I.; Pereira, M.; Mann, B.Q.; et al. Persistent Transboundary Movements of Threatened Sharks Highlight the Importance of Cooperative Management for Effective Conservation. Mar. Ecol. Prog. Ser. 2023, 720, 117–131. [Google Scholar] [CrossRef] [Scilit]
  7. Lascelles, B.; Notarbartolo Di Sciara, G.; Agardy, T.; Cuttelod, A.; Eckert, S.; Glowka, L.; Hoyt, E.; Llewellyn, F.; Louzao, M.; Ridoux, V. Migratory Marine Species: Their Status, Threats and Conservation Management Needs. Aquat. Conserv. 2014, 24, 111–127. [Google Scholar] [CrossRef] [Scilit]
  8. Hays, G.C.; Bailey, H.; Bograd, S.J.; Bowen, W.D.; Campagna, C.; Carmichael, R.H.; Casale, P.; Chiaradia, A.; Costa, D.P.; Cuevas, E.; et al. Translating Marine Animal Tracking Data into Conservation Policy and Management. Trends Ecol. Evol. 2019, 34, 459–473. [Google Scholar] [CrossRef] [Scilit] [PubMed]
  9. Mason, N.; Ward, M.; Watson, J.E.M.; Venter, O.; Runting, R.K. Global Opportunities and Challenges for Transboundary Conservation. Nat. Ecol. Evol. 2020, 4, 694–701. [Google Scholar] [CrossRef] [Scilit]
  10. Pacoureau, N.; Rigby, C.L.; Kyne, P.M.; Sherley, R.B.; Winker, H.; Carlson, J.K.; Fordham, S.V.; Barreto, R.; Fernando, D.; Francis, M.P.; et al. Half a Century of Global Decline in Oceanic Sharks and Rays. Nature 2021, 589, 567–571. [Google Scholar] [CrossRef] [Scilit]
  11. Worm, B.; Orofino, S.; Burns, E.S.; D’Costa, N.G.; Manir Feitosa, L.; Palomares, M.L.D.; Schiller, L.; Bradley, D. Global Shark Fishing Mortality Still Rising despite Widespread Regulatory Change. Science 2024, 383, 225–230. [Google Scholar] [CrossRef] [Scilit] [PubMed]
  12. Dulvy, N.K.; Fowler, S.L.; Musick, J.A.; Cavanagh, R.D.; Kyne, P.M.; Harrison, L.R.; Carlson, J.K.; Davidson, L.N.; Fordham, S.V.; Francis, M.P.; et al. Extinction Risk and Conservation of the World’s Sharks and Rays. eLife 2014, 3, e00590. [Google Scholar] [CrossRef] [Scilit]
  13. Dulvy, N.K.; Pacoureau, N.; Rigby, C.L.; Pollom, R.A.; Jabado, R.W.; Ebert, D.A.; Finucci, B.; Pollock, C.M.; Cheok, J.; Derrick, D.H.; et al. Overfishing Drives over One-Third of All Sharks and Rays toward a Global Extinction Crisis. Curr. Biol. 2021, 31, 5118–5119. [Google Scholar] [CrossRef] [Scilit] [PubMed]
  14. Santos, C.P.; Pegado, M.R.; Frazão Santos, C.; Rosa, R. Studying Sharks in the Anthropocene: An Overview of Research Efforts Targeting Human-Related Threats over Elasmobranchs. Rev. Fish Biol. Fish. 2025, 35, 1503–1523. [Google Scholar] [CrossRef] [Scilit]
  15. Heupel, M.R.; Simpfendorfer, C.A.; Espinoza, M.; Smoothey, A.F.; Tobin, A.; Peddemors, V. Conservation Challenges of Sharks with Continental Scale Migrations. Front. Mar. Sci. 2015, 2, 12. [Google Scholar] [CrossRef] [Scilit]
  16. Ebert, D.A.; Dando, M.; Fowler, S. Sharks of the World: A Complete Guide; Princeton University Press: Princeton, NJ, USA, 2021. [Google Scholar]
  17. Pillans, R.D.; Good, J.P.; Anderson, W.G.; Hazon, N.; Franklin, C.E. Rectal Gland Morphology of Freshwater and Seawater Acclimated Bull Sharks Carcharhinus leucas. J. Fish Biol. 2008, 72, 1559–1571. [Google Scholar] [CrossRef] [Scilit]
  18. Lubitz, N.; Abrantes, K.; Crook, K.; Currey-Randall, L.M.; Chin, A.; Sheaves, M.; Fitzpatrick, R.; Barbosa Martins, A.; Bierwagen, S.; Miller, I.B.; et al. Trophic Ecology Shapes Spatial Ecology of Two Sympatric Predators, the Great Hammerhead Shark (Sphyrna mokarran) and Bull Shark (Carcharhinus leucas). Front. Mar. Sci. 2023, 10, 1274275. [Google Scholar] [CrossRef] [Scilit]
  19. Rigby, C.L.; Espinoza, M.; Derrick, D.; Pacoureau, N.; Dicken, M. Carcharhinus leucas. Available online: https://www.iucnredlist.org/species/39372/2910670 (accessed on 10 October 2025).
  20. Daly, R.; Smale, M.J.; Cowley, P.D.; Froneman, P.W. Residency Patterns and Migration Dynamics of Adult Bull Sharks (Carcharhinus leucas) on the East Coast of Southern Africa. PLoS ONE 2014, 9, e109357. [Google Scholar] [CrossRef] [Scilit]
  21. Espinoza, M.; Heupel, M.R.; Tobin, A.J.; Simpfendorfer, C.A. Evidence of Partial Migration in a Large Coastal Predator: Opportunistic Foraging and Reproduction as Key Drivers? PLoS ONE 2016, 11, e0147608. [Google Scholar] [CrossRef] [Scilit] [PubMed]
  22. Lubitz, N.; Daly, R.; Filmalter, J.D.; Sheaves, M.; Cowley, P.D.; Naesje, T.F.; Barnett, A. Context Drives Movement Patterns in a Mobile Marine Predator. Mov. Ecol. 2023, 11, 28. [Google Scholar] [CrossRef] [Scilit]
  23. Lennox, R.J.; Whoriskey, F.G.; Verhelst, P.; Vandergoot, C.S.; Soria, M.; Reubens, J.; Rechisky, E.L.; Power, M.; Murray, T.; Mulder, I.; et al. Globally Coordinated Acoustic Aquatic Animal Tracking Reveals Unexpected, Ecologically Important Movements across Oceans, Lakes and Rivers. Ecography 2023, 2024, e06801. [Google Scholar] [CrossRef] [Scilit]
  24. Lea, J.S.E.; Humphries, N.E.; Clarke, C.R.; Sims, D.W. To Madagascar and Back: Long-Distance, Return Migration across Open Ocean by a Pregnant Female Bull Shark Carcharhinus leucas. J. Fish Biol. 2015, 87, 1313–1321. [Google Scholar] [CrossRef] [Scilit]
  25. Daly, R.; Murray, T.S.; Roberts, M.J.; Schoeman, D.S.; Lubitz, N.; Barnett, A.; Cedras, R.; Bolaji, D.A.; Brokensha, G.M.; Le Noury, P.M.; et al. Breaking Barriers: Transoceanic Movement by a Bull Shark. Ecology 2025, 106, e70096. [Google Scholar] [CrossRef] [Scilit]
  26. Devloo-Delva, F.; Burridge, C.P.; Kyne, P.M.; Brunnschweiler, J.M.; Chapman, D.D.; Charvet, P.; Chen, X.; Cliff, G.; Daly, R.; Drymon, J.M.; et al. From Rivers to Ocean Basins: The Role of Ocean Barriers and Philopatry in the Genetic Structuring of a Cosmopolitan Coastal Predator. Ecol. Evol. 2023, 13, e9837. [Google Scholar] [CrossRef] [Scilit]
  27. Pirog, A.; Ravigné, V.; Fontaine, M.C.; Rieux, A.; Gilabert, A.; Cliff, G.; Clua, E.; Daly, R.; Heithaus, M.R.; Kiszka, J.J.; et al. Population Structure, Connectivity, and Demographic History of an Apex Marine Predator, the Bull Shark Carcharhinus leucas. Ecol. Evol. 2019, 9, 12980–13000. [Google Scholar] [CrossRef] [Scilit]
  28. McCord, M.E.; Lamberth, S.J. Catching and Tracking the World’s Largest Zambezi (bull) Shark Carcharhinus leucas in the Breede Estuary, South Africa: The First 43 Hours. Afr. J. Mar. Sci. 2009, 31, 107–111. [Google Scholar] [CrossRef] [Scilit]
  29. Lubitz, N.; Daly, R.; Smoothey, A.F.; Vianello, P.; Roberts, M.J.; Schoeman, D.S.; Sheaves, M.; Cowley, P.D.; Dagorn, L.; Forget, F.G.; et al. Climate Change-Driven Cooling Can Kill Marine Megafauna at Their Distributional Limits. Nat. Clim. Change 2024, 14, 526–535. [Google Scholar] [CrossRef] [Scilit]
  30. Jabado, R.W.; Kyne, P.M.; García-Rodríguez, E.; Charles, R.; Armstrong, A.O.; Mouton, T.L.; Gonzalez-Pestana, A.; Battle-Morera, A.; Rohner, C.A. Western Indian Ocean: A Regional Compendium of Important Shark and Ray Areas; IUCN SSC Shark Specialist Group and IUCN Ocean Team: Dubai, United Arab Emirates, 2024. [Google Scholar]
  31. Parque Nacional do Arquipélago de Bazaruto (PNAB). Plano de Maneio 2016–2025 de uma Área de Conservação Marinha Província de Inhambane, Moçambique; Ministério da Terra e Ambiente: Maputo, Mozambique, 2016.
  32. Américo, H.; Gilroy, T.; Gilroy, D.; Kyle, R. 2020–2025 Management Plan for the Sustainable Use Conservation Area: Sanctuary Bravio de Vilanculos; Ministério da Terra e Ambiente: Maputo, Mozambique, 2020.
  33. Imprensa Nacional de Moçambique. Boletim da República Decreto No. 73/2017. In Lei de Protecção, Conservação e Uso sustentável da Diversidade Biológica; Imprensa Nacional de Moçambique: Maputo, Mozambique, 2017. [Google Scholar]
  34. Imprensa Nacional de Moçambique. Boletim da República; Decreto No. 89 Série Número 192 Decreto No. 89/2020. Aprovado O Regulamento Da Pesca Marítimo (REPMAR); Imprensa Nacional de Moçambique: Maputo, Mozambique, 2020.
  35. Lutjeharms, J.R.E. The Agulhas Current; Springer: Berlin, Germany, 2006. [Google Scholar]
  36. Lutjeharms, J.R.E.; Biastoch, A.; Van der Werf, P.M.; Ridderinkhof, H.; De Ruijter, W.P.M. On the Discontinuous Nature of the Mozambique Current. S. Afr. J. Sci. 2012, 108, 1–5. [Google Scholar] [CrossRef] [Scilit]
  37. Malauene, B.S.; Moloney, C.L.; Lett, C.; Roberts, M.J.; Marsac, F.; Penven, P. Impact of Offshore Eddies on Shelf Circulation and River Plumes of the Sofala Bank, Mozambique Channel. J. Mar. Syst. 2018, 185, 1–12. [Google Scholar] [CrossRef] [Scilit]
  38. Schleyer, M.H.; Celliers, L. The Coral Reefs of Bazaruto Island, Mozambique, with Recommendations for Their Management. West. Indian Ocean J. Mar. Sci. 2007, 4, 227–236. [Google Scholar] [CrossRef] [Scilit]
  39. Venables, S.K.; van Duinkerken, D.I.; Rohner, C.A.; Marshall, A.D. Habitat Use and Movement Patterns of Reef Manta Rays Mobula alfredi in Southern Mozambique. Mar. Ecol. Prog. Ser. 2020, 634, 99–114. [Google Scholar] [CrossRef] [Scilit]
  40. Rohner, C.A. A Global Whale Shark Hotspot in Southern Mozambique: Population Structure, Feeding Ecology, Movements and Environmental Drivers. Ph.D. Thesis, University of Queensland, Brisbane, Australia, 2013. [Google Scholar]
  41. Cowley, P.D.; Bennett, R.H.; Childs, A.-R.; Murray, T.S. Reflection on the First Five Years of South Africa’s Acoustic Tracking Array Platform (ATAP): Status, Challenges and Opportunities. Afr. J. Mar. Sci. 2017, 39, 363–372. [Google Scholar] [CrossRef] [Scilit]
  42. Murray, T.S.; Elston, C.; Parkinson, M.C.; Filmalter, J.D.; Cowley, P.D. A Decade of South Africa’s Acoustic Tracking Array Platform: An Example of a Successful Ocean Stewardship Programme. Front. Mar. Sci. 2022, 9, 886554. [Google Scholar] [CrossRef] [Scilit]
  43. Daly, R.; Filmalter, J.D.; Daly, C.A.; Bennett, R.H.; Pereira, M.A.; Mann, B.Q. Acoustic Telemetry Reveals Multi-Seasonal Spatiotemporal Dynamics of a Giant Trevally Caranx ignobilis Aggregation. Mar. Ecol. Prog. Ser. 2019, 621, 185–197. [Google Scholar] [CrossRef] [Scilit]
  44. R Core Team. R: A Language and Environment for Statistical Computing; R Foundation for Statistical Computing: Vienna, Austria, 2022; Available online: https://www.R-project.org (accessed on 15 March 2025).
  45. Holbrook, C.; Hayden, T.; Binder, T.; Pye, J.; Nunes, A. Glatos: A Package for the Great Lakes Acoustic Telemetry Observation System; R Package Version 0.8.0; Ocean Tracking Network: Halifax, NS, Canada, 2024. [Google Scholar]
  46. Campbell, H.A.; Watts, M.E.; Dwyer, R.G.; Franklin, C.E. V-Track: Software for Analysing and Visualising Animal Movement from Acoustic Telemetry Detections. Mar. Freshw. Res. 2012, 63, 815–820. [Google Scholar] [CrossRef] [Scilit]
  47. Wickham, H. ggplot2: Elegant Graphics for Data Analysis; Springer: New York, NY, USA, 2016. [Google Scholar]
  48. Cochran, J.E.M.; Braun, C.D.; Cagua, E.F.; Campbell, M.F., Jr.; Hardenstine, R.S.; Kattan, A.; Priest, M.A.; Sinclair-Taylor, T.H.; Skomal, G.B.; Sultan, S.; et al. Multi-Method Assessment of Whale Shark (Rhincodon typus) Residency, Distribution, and Dispersal Behavior at an Aggregation Site in the Red Sea. PLoS ONE 2019, 14, e0222285. [Google Scholar] [CrossRef] [Scilit]
  49. Wood, S.N. Generalized Additive Models: An Introduction with R; Chapman and Hall/CRC: Boca Raton, FL, USA, 2017. [Google Scholar]
  50. Agafonkin, V.; Thieurmel, B. Suncalc: Compute Sun Position, Sunlight Phases, Moon Position and Lunar Phase; R Package Version 0.4; Datastorm: Sofia, Bulgaria, 2018; Available online: https://CRAN.R-Project.org/package=suncalc (accessed on 1 April 2025).
  51. Flávio, H.; Baktoft, H. Actel: Standardised Analysis of Acoustic Telemetry Data from Animals Moving through Receiver Arrays. Methods Ecol. Evol. 2021, 12, 196–203. [Google Scholar] [CrossRef] [Scilit]
  52. Niella, Y.; Flávio, H.; Smoothey, A.F.; Aarestrup, K.; Taylor, M.D.; Peddemors, V.M.; Harcourt, R. Refined Shortest Paths (RSP): Incorporation of Topography in Space Use Estimation from Node-based Telemetry Data. Methods Ecol. Evol. 2020, 11, 1733–1742. [Google Scholar] [CrossRef] [Scilit]
  53. UNEP-WCMC & IUCN Protected Planet: The World Database on Protected Areas (WDPA) and World Database on Other Effective Area-Based Conservation Measures (WD-OECM) [Online]. Available online: www.protectedplanet.net (accessed on 15 March 2025).
  54. Pebesma, E.; Bivand, R. Spatial Data Science: With Applications in R; Chapman and Hall/CRC: Boca Raton, FL, USA, 2023. [Google Scholar] [CrossRef] [Scilit]
  55. Hijmans, R.J. Raster: Geographic Data Analysis and Modeling; R Package Version 3.6-26; R Archive Network: Vienna, Austria, 2023; Available online: https://CRAN.R-Project.org/package=raster (accessed on 10 April 2025).
  56. Ross, N. fasterize: Fast Polygon to Raster Conversion; R Package Version 1.0.3; Comprehensive R Archive Network: Vienna, Austria, 2021. [Google Scholar]
  57. Csardi, G.; Nepusz, T. The Igraph Software Package for Complex Network Research. Complex Syst. 2006, 1695, 1–9. [Google Scholar]
  58. Lara-Lizardi, F.; Hoyos-Padilla, E.M.; Klimley, A.P.; Grau, M.; Ketchum, J.T. Movement Patterns and Residency of Bull Sharks, Carcharhinus leucas, in a Marine Protected Area of the Gulf of California. Environ. Biol. Fishes 2022, 105, 1765–1779. [Google Scholar] [CrossRef] [Scilit]
  59. Soria, M.; Heithaus, M.R.; Blaison, A.; Crochelet, E.; Forget, F.; Chabanet, P. Residency and Spatial Distribution of Bull Sharks Carcharhinus leucas in and around Reunion Island Marine Protected Area. Mar. Ecol. Prog. Ser. 2019, 630, 101–113. [Google Scholar] [CrossRef] [Scilit]
  60. Lubitz, N.; Bradley, M.; Sheaves, M.; Hammerschlag, N.; Daly, R.; Barnett, A. The Role of Context in Elucidating Drivers of Animal Movement. Ecol. Evol. 2022, 12, e9128. [Google Scholar] [CrossRef] [Scilit]
  61. Tillett, B.J.; Meekan, M.G.; Field, I.C.; Thorburn, D.C.; Ovenden, J.R. Evidence for Reproductive Philopatry in the Bull Shark Carcharhinus leucas. J. Fish Biol. 2012, 80, 2140–2158. [Google Scholar] [CrossRef] [Scilit]
  62. Heupel, M.; Simpfendorfer, C. Estuarine nursery areas provide a low-mortality environment for young bull sharks Carcharhinus leucas. Mar. Ecol. Prog. Ser. 2011, 433, 237–244. [Google Scholar] [CrossRef] [Scilit]
  63. Daly, R.; Le Noury, P.; Hempson, T.N.; Ziembicki, M.; Olbers, J.M.; Brokensha, G.M.; Mann, B.Q. Bull Shark Carcharhinus Leucas Recruitment into the St Lucia Estuary, South Africa, after Prolonged Mouth Closure, and the First Observation of a Neonate Bull Shark Preyed on by a Nile Crocodile Crocodylus niloticus. Afr. J. Mar. Sci. 2021, 43, 417–421. [Google Scholar] [CrossRef] [Scilit]
  64. Hyde, C.A.; Notarbartolo di Sciara, G.; Sorrentino, L.; Boyd, C.; Finucci, B.; Fowler, S.L.; Kyne, P.M.; Leurs, G.; Simpfendorfer, C.A.; Tetley, M.J.; et al. Putting Sharks on the Map: A Global Standard for Improving Shark Area-Based Conservation. Front. Mar. Sci. 2022, 9, 968853. [Google Scholar] [CrossRef] [Scilit]
  65. Cochran, J.E.M.; Charles, R.; Temple, A.J.; Kyne, P.M.; García-Rodríguez, E.; Gonzalez-Pestana, A.; Batlle-Morera, A.; Mouton, T.L.; Armstrong, A.O.; Rohner, C.A.; et al. Only One Percent of Important Shark and Ray Areas in the Western Indian Ocean Are Fully Protected from Fishing Pressure. Ecol. Evol. 2026, 16, e72690. [Google Scholar] [CrossRef] [Scilit]
  66. Smoothey, A.F.; Niella, Y.; Brand, C.; Peddemors, V.M.; Butcher, P.A. Bull Shark (Carcharhinus leucas) Occurrence along Beaches of South-Eastern Australia: Understanding Where, When and Why. Biology 2023, 12, 1189. [Google Scholar] [CrossRef] [Scilit] [PubMed]
  67. Hammerschlag, N.; Skubel, R.A.; Calich, H.; Nelson, E.R.; Shiffman, D.S.; Wester, J.; Macdonald, C.C.; Cain, S.; Jennings, L.; Enchelmaier, A.; et al. Nocturnal and Crepuscular Behavior in Elasmobranchs: A Review of Movement, Habitat Use, Foraging, and Reproduction in the Dark. Bull. Mar. Sci. 2016, 93, 355–374. [Google Scholar]
  68. Driggers, W.B.; Campbell, M.D.; Hoffmayer, E.R.; Ingram, G.W., Jr. Feeding Chronology of Six Species of Carcharhinid Sharks in the Western North Atlantic Ocean as Inferred from Longline Capture Data. Mar. Ecol. Prog. Ser. 2012, 465, 185–192. [Google Scholar] [CrossRef] [Scilit]
  69. Smoothey, A.F.; Lee, K.A.; Peddemors, V.M. Long-Term Patterns of Abundance, Residency and Movements of Bull Sharks (Carcharhinus leucas) in Sydney Harbour, Australia. Sci. Rep. 2019, 9, 18864. [Google Scholar] [CrossRef] [Scilit]
  70. Sequeira, A.M.M.; Rodríguez, J.P.; Marley, S.A.; Calich, H.J.; van der Mheen, M.; VanCompernolle, M.; Arrowsmith, L.M.; Peel, L.R.; Queiroz, N.; Vedor, M.; et al. Global Tracking of Marine Megafauna Space Use Reveals How to Achieve Conservation Targets. Science 2025, 388, 1086–1097. [Google Scholar] [CrossRef] [Scilit]
  71. Udyawer, V.; Huveneers, C.; Jaine, F.; Babcock, R.C.; Brodie, S.; Buscot, M.-J.; Campbell, H.A.; Harcourt, R.G.; Hoenner, X.; Lédée, E.J.I.; et al. Scaling of Activity Space in Marine Organisms across Latitudinal Gradients. Am. Nat. 2023, 201, 586–602. [Google Scholar] [CrossRef] [Scilit] [PubMed]
  72. Edwards, M.L.; McCallister, M.; Brewster, L.R.; Bangley, C.W.; Curtis, T.H.; Ogburn, M.B.; Ajemian, M.J. Multi-Year Assessment of Immature Bull Shark Carcharhinus leucas Residency and Activity Spaces in an Expansive Estuarine Nursery. Mar. Ecol. Prog. Ser. 2022, 695, 125–138. [Google Scholar] [CrossRef] [Scilit]
  73. Grorud-Colvert, K.; Sullivan-Stack, J.; Roberts, C.; Constant, V.; Horta E Costa, B.; Pike, E.P.; Kingston, N.; Laffoley, D.; Sala, E.; Claudet, J.; et al. The MPA Guide: A Framework to Achieve Global Goals for the Ocean. Science 2021, 373, eabf0861. [Google Scholar] [CrossRef] [Scilit] [PubMed]
  74. O’Connor, B.; Cullain, N. Distribution and Community Structure of at-Risk and Data Deficient Elasmobranchs in Zavora Bay, Mozambique. Afr. J. Mar. Sci. 2021, 43, 521–532. [Google Scholar] [CrossRef] [Scilit]
Figure 1. Map showing the acoustic receiver network throughout Mozambique and South Africa. Red circles indicate acoustic receiver locations, and shark icons indicate approximate tagging locations. The inset shows receivers deployed in the Bazaruto Seascape with site name abbreviations in red, the orange dashed lines indicate protected area boundaries, and * indicates receivers that were not deployed for the full study period. BANP = Bazaruto Archipelago National Park; VCWS = Vilanculos Coastal Wildlife Sanctuary. For details of protection zones, including total protection and gear restriction zones within BANP and VCWS, see Figure S1.
Fishes 11 00291 g001
Figure 2. Individual acoustic detection histories of all tagged bull sharks (n = 38) from 2012 to 2024, grouped by tagging location in each panel. Points are coloured by latitude, black symbols indicate tagging dates, and the red dashed line indicates initial deployment of receivers in the Bazaruto Seascape.
Fishes 11 00291 g002
Figure 3. Model-predicted seasonal pattern of detections of bull sharks tagged in the Bazaruto Seascape (excluding shark #03; n = 15) across all receivers in the Bazaruto Seascape from 2019 to 2024. The solid line shows the predicted number of detections from a negative binomial GAMM, and the shaded area represents the 95% confidence interval.
Fishes 11 00291 g003
Figure 4. Detections of all bull sharks tagged in the Bazaruto Seascape (n = 16) by hour of day at the ten most-visited receivers in the seascape. The dark shading indicates nighttime hours and the light shading indicates the seasonal range of sunrise and sunset times across the study period. Note the variable y-axis scales. n = total number of detections recorded between 2019 and 2024.
Fishes 11 00291 g004
Figure 5. Core and extent habitats (50% and 95% utilisation distributions, respectively) combined across bull sharks tagged in the Bazaruto Seascape (n = 16) for the entire study period. Black dashed lines indicate protected area boundaries, and blue circles indicate receiver locations.
Fishes 11 00291 g005
Figure 6. Bazaruto Seascape movement networks for bull sharks tagged in the Bazaruto Seascape (n = 16). (A) Receivers are coded by size and colour, highlighting hubs with the most connections (large, red). (B) Pathways are coded by size and colour to show the relative importance of different edges (i.e., pathways). Yellow dashed lines represent protected area boundaries.
Fishes 11 00291 g006
Figure 7. Movements of all tagged bull sharks (n = 38) between the Bazaruto Seascape and acoustic arrays throughout Mozambique, South Africa and Madagascar. Solid black lines indicate movements without intermediate stops, white dashed lines represent movements with one or more intermediate stops (an intermediate stop was defined as a shark spending <15 days at an array before being detected at a different array), red hexagons indicate the locations of intermediate stops made during longer movements, boxed numbers show the total number of movements combined across all individuals, regardless of direction. Both dashed and solid lines depict connections between arrays, not actual travel routes.
Fishes 11 00291 g007
Table 1. Summary of bull sharks acoustically tagged in Mozambique (MZ) and South Africa (SA). Shark #05 was removed from analysis. Track duration = number of days from tagging to last detection; TL = total length; Rmax = maximum residency index in the Bazaruto Seascape.
Shark IDTagging DateTagging Location (Country)SexTL (cm)First DetectionLast DetectionTotal DetectionsNumber of ReceiversTrack DurationDetected DaysDetected Days
(Bazaruto only)
Rmax% of Detections
(Bazaruto Seascape)
0112/4/2019Bazaruto (MZ)F27912/4/201917/6/202296521511635285280.45100
0213/4/2019Bazaruto (MZ)F27521/4/201931/10/202425,6201220298168160.40100
0314/4/2019Bazaruto (MZ)F24218/4/20196/9/2024148,09031973141214120.72100
0416/4/2019San Sebastian (MZ)F27113/5/201916/10/202421,351152011116811680.58100
0516/9/2019Bazaruto (MZ)F25916/9/201916/9/201911111--
0617/9/2019Bazaruto (MZ)F25521/9/201931/8/202415372318111531460.0898.57
0720/9/2019San Sebastian (MZ)F25522/9/201911/5/20228997139653463460.36100
0820/9/2019San Sebastian (MZ)F28421/9/201911/10/202442,856141849124812480.67100
091/12/2020San Sebastian (MZ)F2823/12/202014/7/202217,42175914944940.84100
102/12/2020San Sebastian (MZ)F2364/12/20208/11/20242819914381981970.1499.79
114/12/2020San Sebastian (MZ)F2806/12/20203/11/202491121414317037020.4999.99
129/10/2021Bazaruto (MZ)F25721/10/20219/10/202457551411263513510.32100
1330/10/2021San Sebastian (MZ)F29231/10/202120/10/202412,0961810875845840.54100
1430/10/2021San Sebastian (MZ)M2782/3/202314/11/20241791311123690.0140.78
151/11/2021San Sebastian (MZ)F2772/11/202111/8/202320,089136485465460.84100
164/11/2021San Sebastian (MZ)F27120/11/202126/10/202452682610883423310.3098.31
1710/5/2022San Sebastian (MZ)F27911/5/20228/11/202419,292149146536520.7299.99
187/12/2012Ponta do Ouro (MZ)F2538/12/201212/9/201919,1156024713512-0.03
1924/1/2013Ponta do Ouro (MZ)F25024/1/201322/1/202337,448533651146021-0.25
2012/5/2015Ponta do Ouro (MZ)M26210/6/201514/10/202129,05337234810051-0.01
2124/11/2015Ponta do Ouro (MZ)M26625/11/201515/6/202024,2735116666071-0.01
2225/11/2015Ponta do Ouro (MZ)M21126/11/201514/7/20203284461694761-0.06
2328/11/2015Ponta do Ouro (MZ)F25428/11/201529/11/202063,4424518296824-0.17
2428/11/2015Ponta do Ouro (MZ)F24728/11/201515/10/202033605317841466-0.6
253/12/2015Ponta do Ouro (MZ)F2653/12/20156/12/202036,5226318315094-0.05
2611/12/2017Ponta do Ouro (MZ)F27615/12/201715/9/202436,933332471130313-0.19
2715/12/2017Ponta do Ouro (MZ)F28516/12/201721/12/202373,45425219813107-0.04
2815/12/2017Ponta do Ouro (MZ)M25314/11/20183/8/202456431624242806-0.18
2920/11/2018Ponta do Ouro (MZ)M22020/11/201817/9/2024316363212924227-6.89
3023/11/2018Ponta do Ouro (MZ)F26324/11/20186/5/202210,21830126124564-4.21
312/2/2019Breede River (SA)M2562/2/201917/3/202457,6269218713776-0.06
325/2/2019Breede River (SA)M2865/2/201929/11/202433,2669621254235-0.07
336/2/2019Breede River (SA)M2226/2/20199/9/202492,41098204361819-0.15
347/2/2019Breede River (SA)M2787/2/20198/11/202468,0815921025491-0.01
3512/2/2020Breede River (SA)M29712/2/202017/11/202424,6927517413815-0.07
363/7/2020KwaZulu-Natal (SA)F27312/7/20206/11/202413,9164315884048-0.38
372/4/2021KwaZulu-Natal (SA)F2558/5/202125/3/202256443358537-4.08
3819/1/2022Breede River (SA)M27719/1/20227/4/20237270414441544-0.19
3918/2/2022KwaZulu-Natal (SA)F24026/2/202224/9/2024820319507964-90.24
Table 2. Summary of residency events (i.e., a single continuous visit) per individual for bull sharks tagged in the Bazaruto Seascape (n = 16). A residency event was defined as at least two detections at a receiver, with a minimum duration of 5 min and no more than 15 min between consecutive detections. SD = standard deviation.
All Residency EventsMaximum Residency Event
Shark IDNo. EventsMean (±SD) Event DurationDurationSite (Detections)Start TimeEnd Time
03491661.6 (±107.3) min37 h 8 minSP (1546)6/4/2023 22:368/4/2023 11:44
02172528.7 (±47.6) min19 h 26 minSP (807)19/8/2022 21:2520/8/2022 16:51
13106618.4 (±27.4) min10 h 20 minALN (396)10/6/2023 11:2010/6/2023 21:40
08412116.7 (±18.8) min6 h 55 minZI_M (209)11/11/2023 9:1511/11/2023 16:10
04195418.4 (±26.6) min6 h 40 minWA (152)3/12/2021 9:003/12/2021 15:40
0168923.9 (±37.0) min6 h 39 minSP (245)22/4/2020 17:0322/4/2020 23:42
1185516.5 (±18.8) min4 h 33 minTB (82)9/7/2022 8:529/7/2022 13:25
15209314.9 (±13.9) min3 h 54 minTB (72)9/7/2022 9:379/7/2022 13:31
1253220.6 (±25.2) min3 h 51 minALN (87)29/9/2022 10:4629/9/2022 14:37
0611721.4 (±30.7) min3 h 15 minSP (91)31/12/2019 8:2031/12/2019 11:35
09169514.6 (±13.5) min3 h 9 minTB (108)19/12/2020 4:3619/12/2020 07:45
17181916.5 (±16.3) min3 h 1 minWA (87)15/12/2022 5:3715/12/2022 08:38
0788416.1 (±13.9) min2 h 22 minTB (43)29/10/2020 9:3029/10/2020 11:52
1651712.8 (±9.3) min1 h 50 minTB (58)25/9/2023 13:1125/9/2023 15:01
1030014.7 (±11.2) min1 h 11 minBEST (17)10/7/2024 12:2110/7/2024 13:32
141914.6 (±10.4) min42 minBEST (10)2/3/2023 00:522/3/2023 1:34
Table 3. Sizes of individual utilisation distributions (UDs) calculated from Dynamic Brownian Bridge Movement Models (dBBMMs) for bull sharks tagged in the Bazaruto Seascape (n = 16).
Shark IDCore Habitat
50% UD (km2)
Extent Habitat
95% UD (km2)
014592398
024132207
032411395
048554612
06193872
072591355
083652142
09108683
102321253
117353397
122201267
133952189
1421127
15135828
163391560
174992379
Mean (±SD) 342 (±221)1791 (±1109)
All combined548628,529
Disclaimer/Publisher’s Note: The statements, opinions and data contained in all publications are solely those of the individual author(s) and contributor(s) and not of MDPI and/or the editor(s). MDPI and/or the editor(s) disclaim responsibility for any injury to people or property resulting from any ideas, methods, instructions or products referred to in the content.