

Rapid and Automated Approach for Early Crop Mapping Using Sentinel-1 and Sentinel-2 on Google Earth Engine; A Case of a Highly Heterogeneous and Fragmented Agricultural Region

 ,
,  ,
,  , ,
, ,  and
and
Abstract
1. Introduction
- (1)
- To evaluate the high spatiotemporal resolution of Sentinel-1, Sentinel-2, and RF machine learning algorithms for accurate and early crop type mapping in a heterogeneous and fragmented agricultural region on the GEE platform by analysing the contribution of the various bands in improving the classification accuracy.
- (2)
- To assess the individual monthly temporal windows and the entire monthly time series on classification accuracy.

| Author | Year | Problem Definition | Targeted Crop | Dataset | Model | Accuracy |
|---|---|---|---|---|---|---|
| Tufail et al. [28] | 2022 | Crop type mapping | Wheat, strawberry, fodder, and rice | Sentinel-1, Sentinel-2 | RF | 97% |
| He et al. [23] | 2021 | Rice | Sentinel-1, Sentinel-2 | RF | 81% | |
| Rao et al. [29] | 2021 | Maize, mustard, tobacco, and wheat) | Sentinel-1, Sentinel-2, and PlanetScope | SVM | 85% | |
| Schulz et al. [30] | 2021 | Rice, cropland, and sparse vegetation | Sentinel-1, Sentinel-2 | RF | 73.3% | |
| SVM | 60.8% | |||||
| ML | 31.7% |
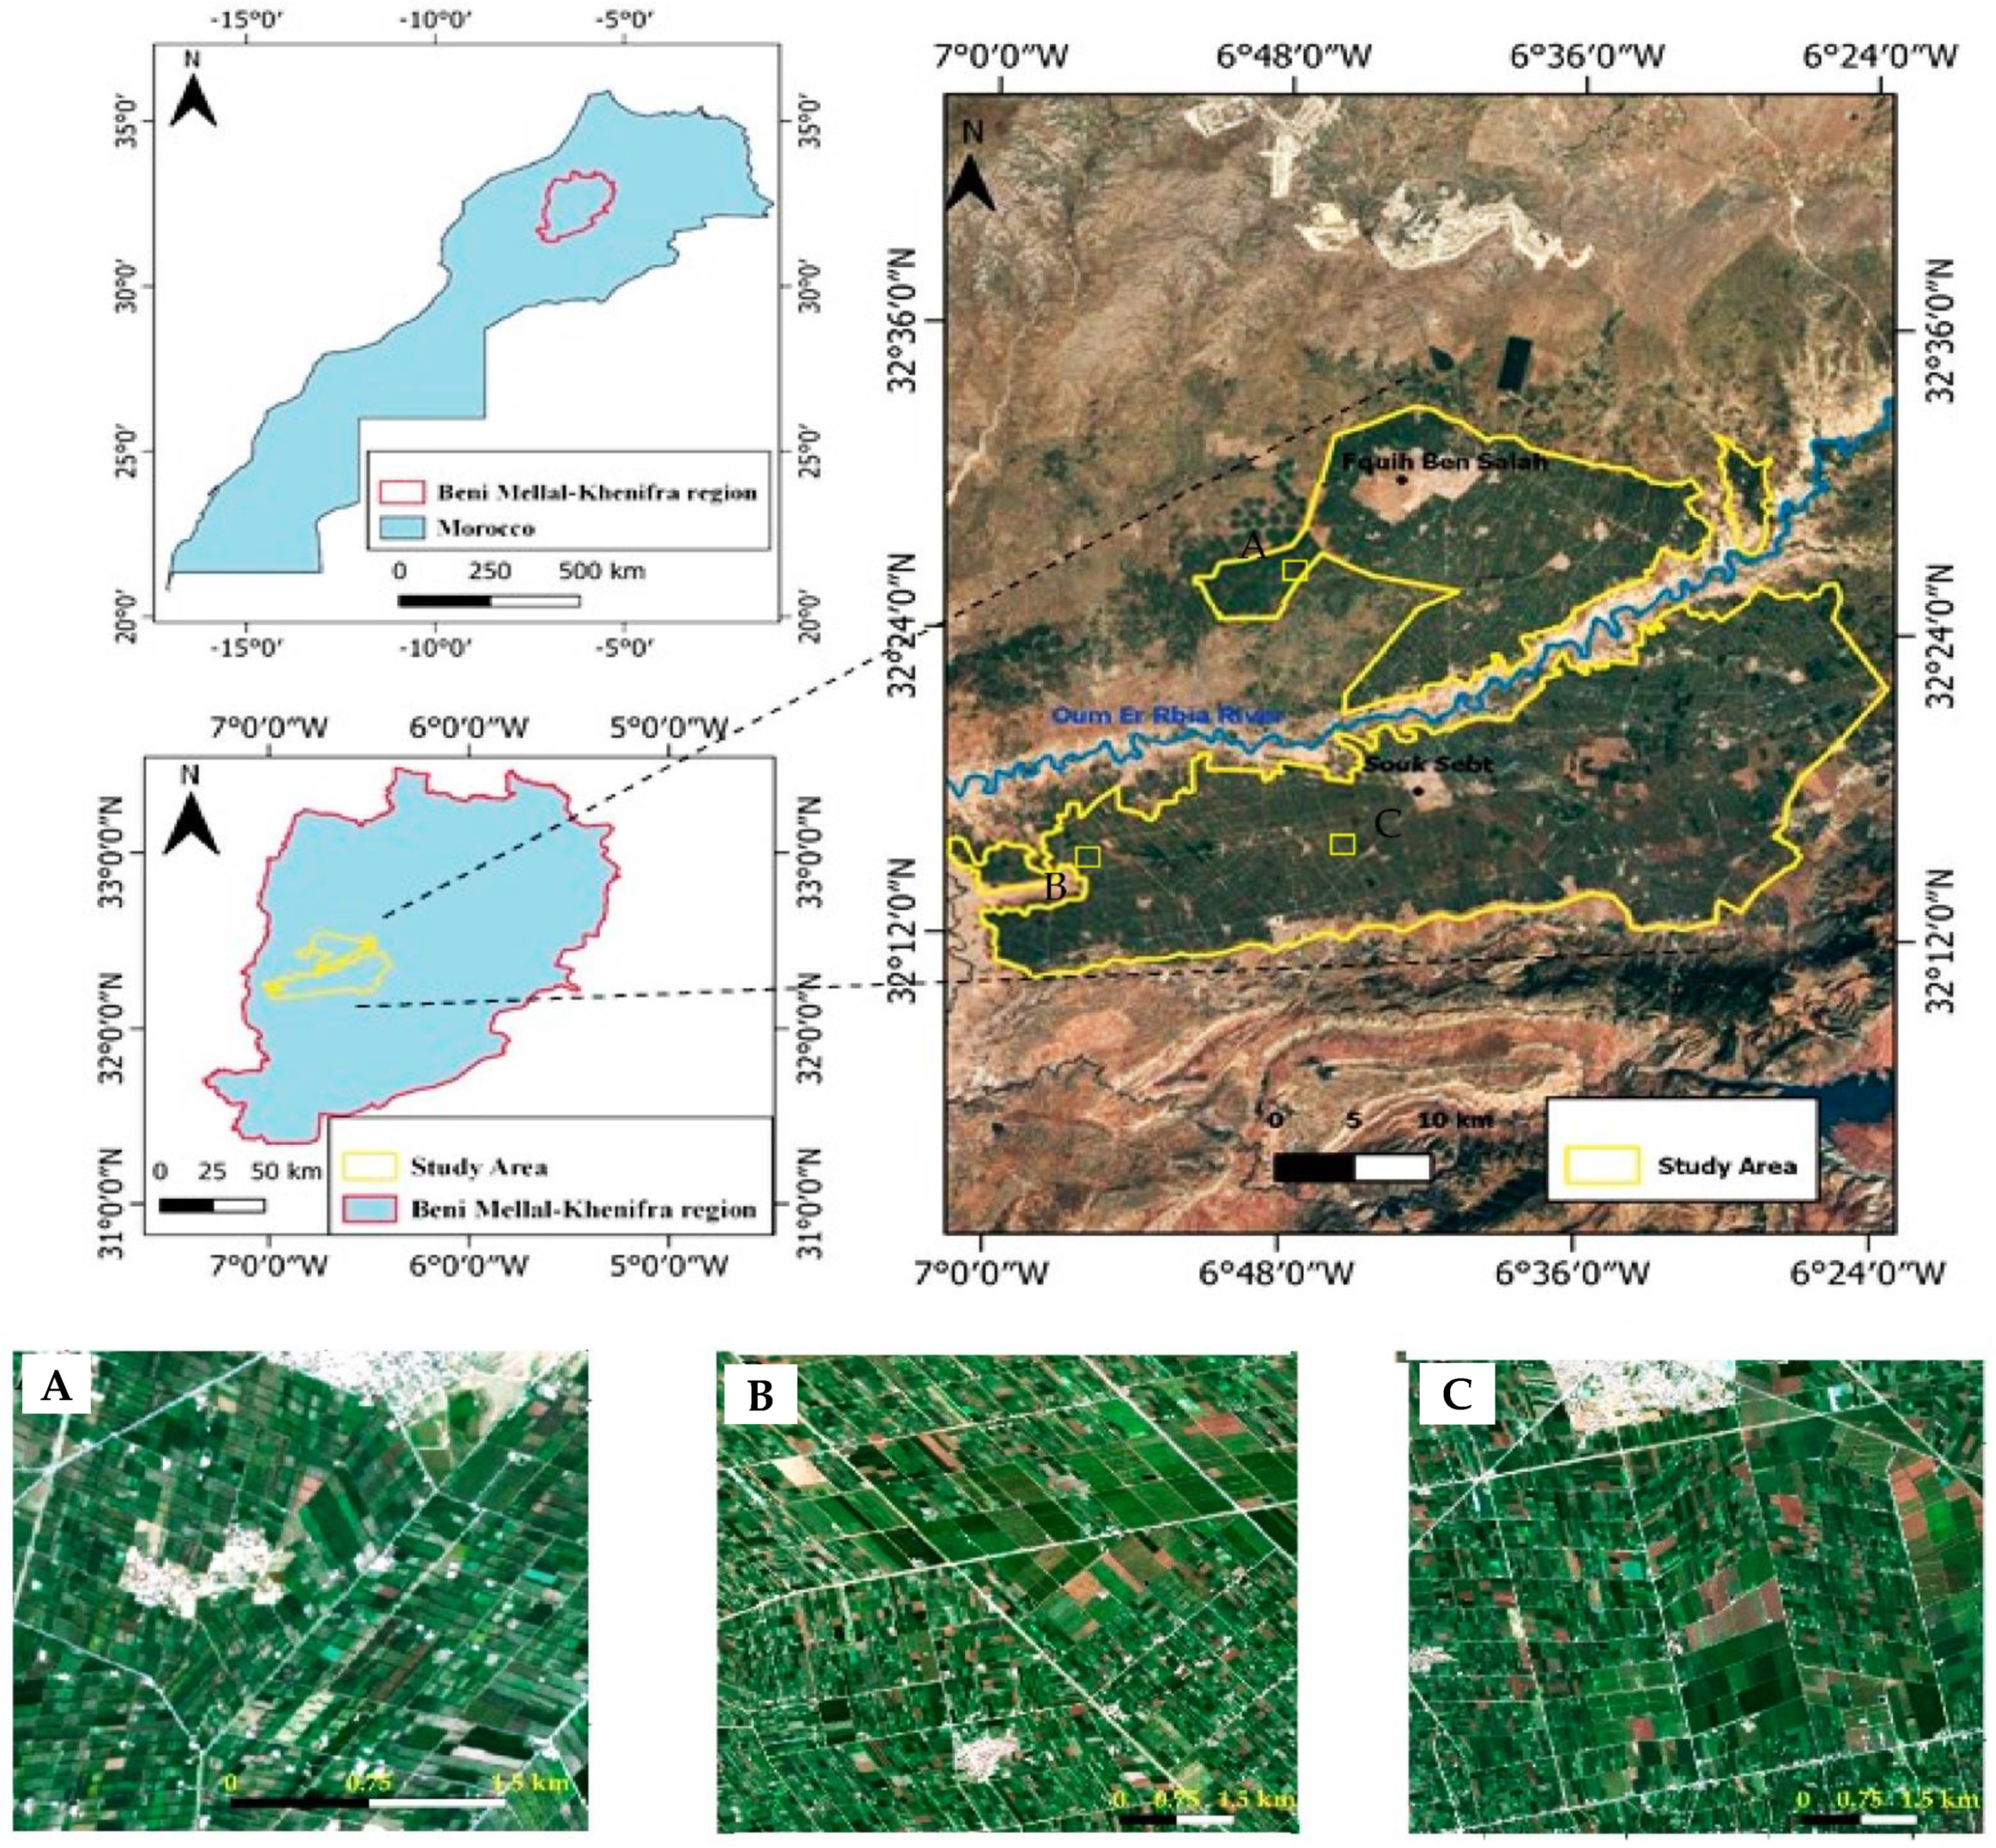
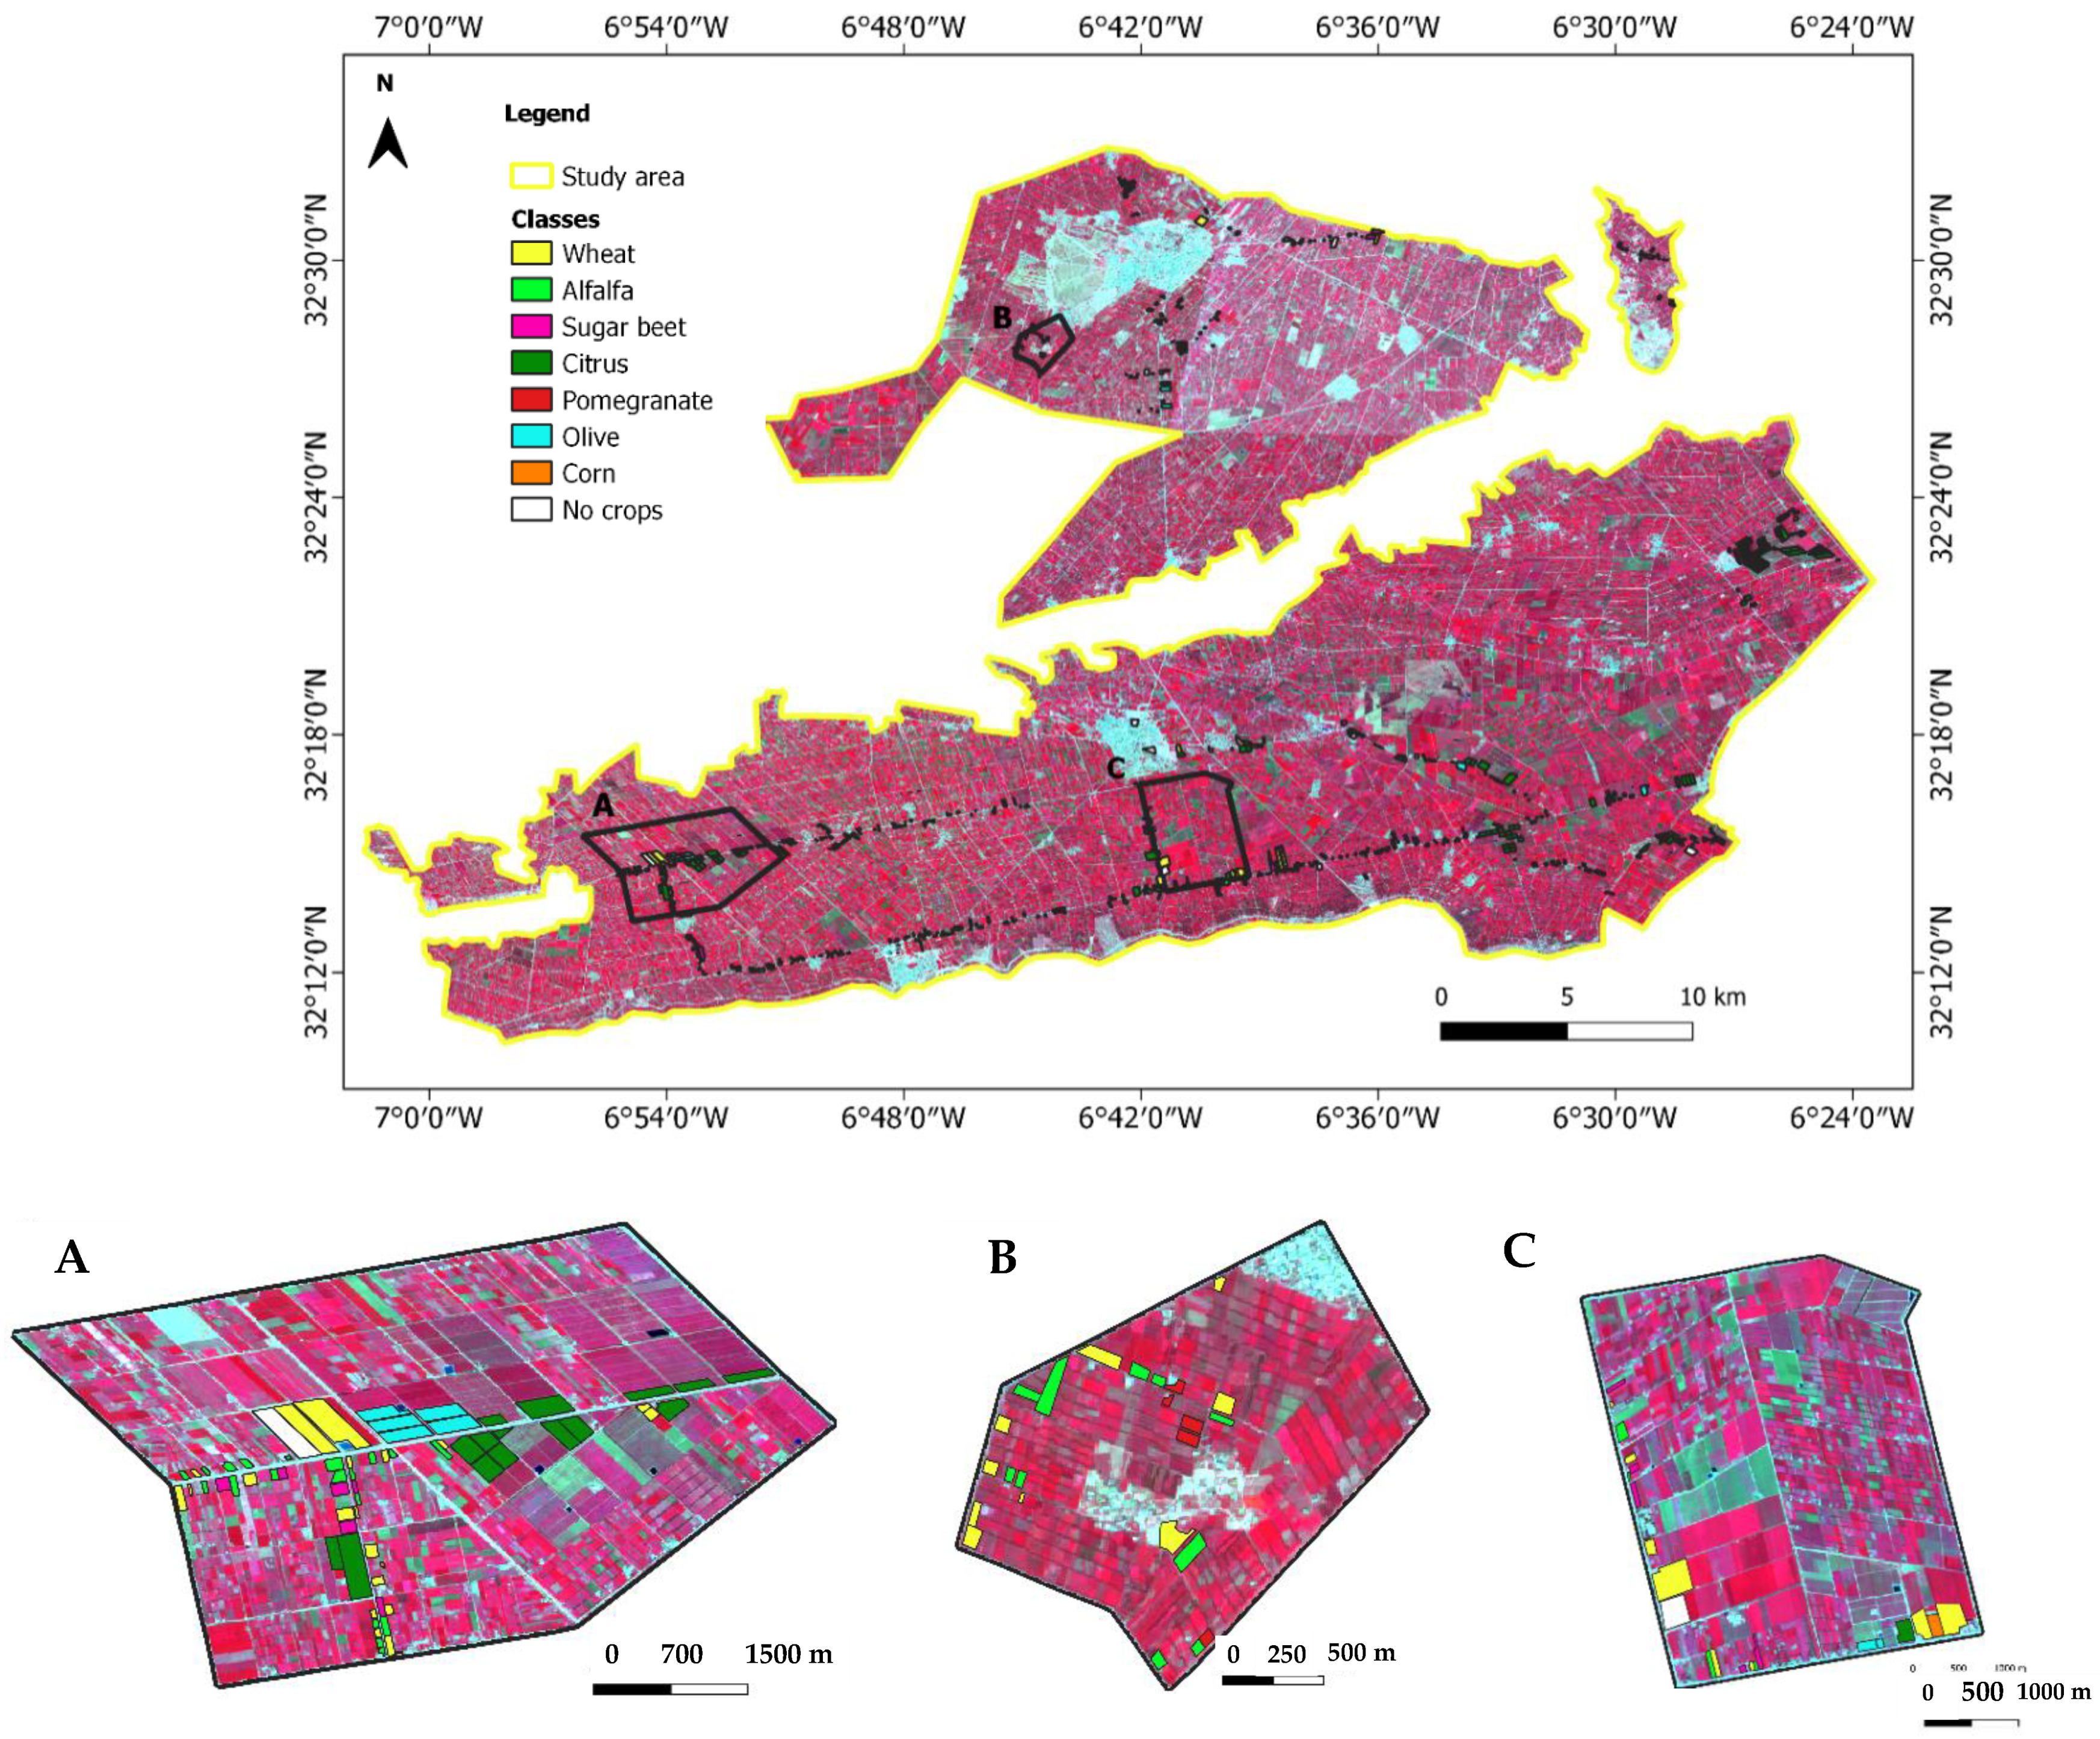
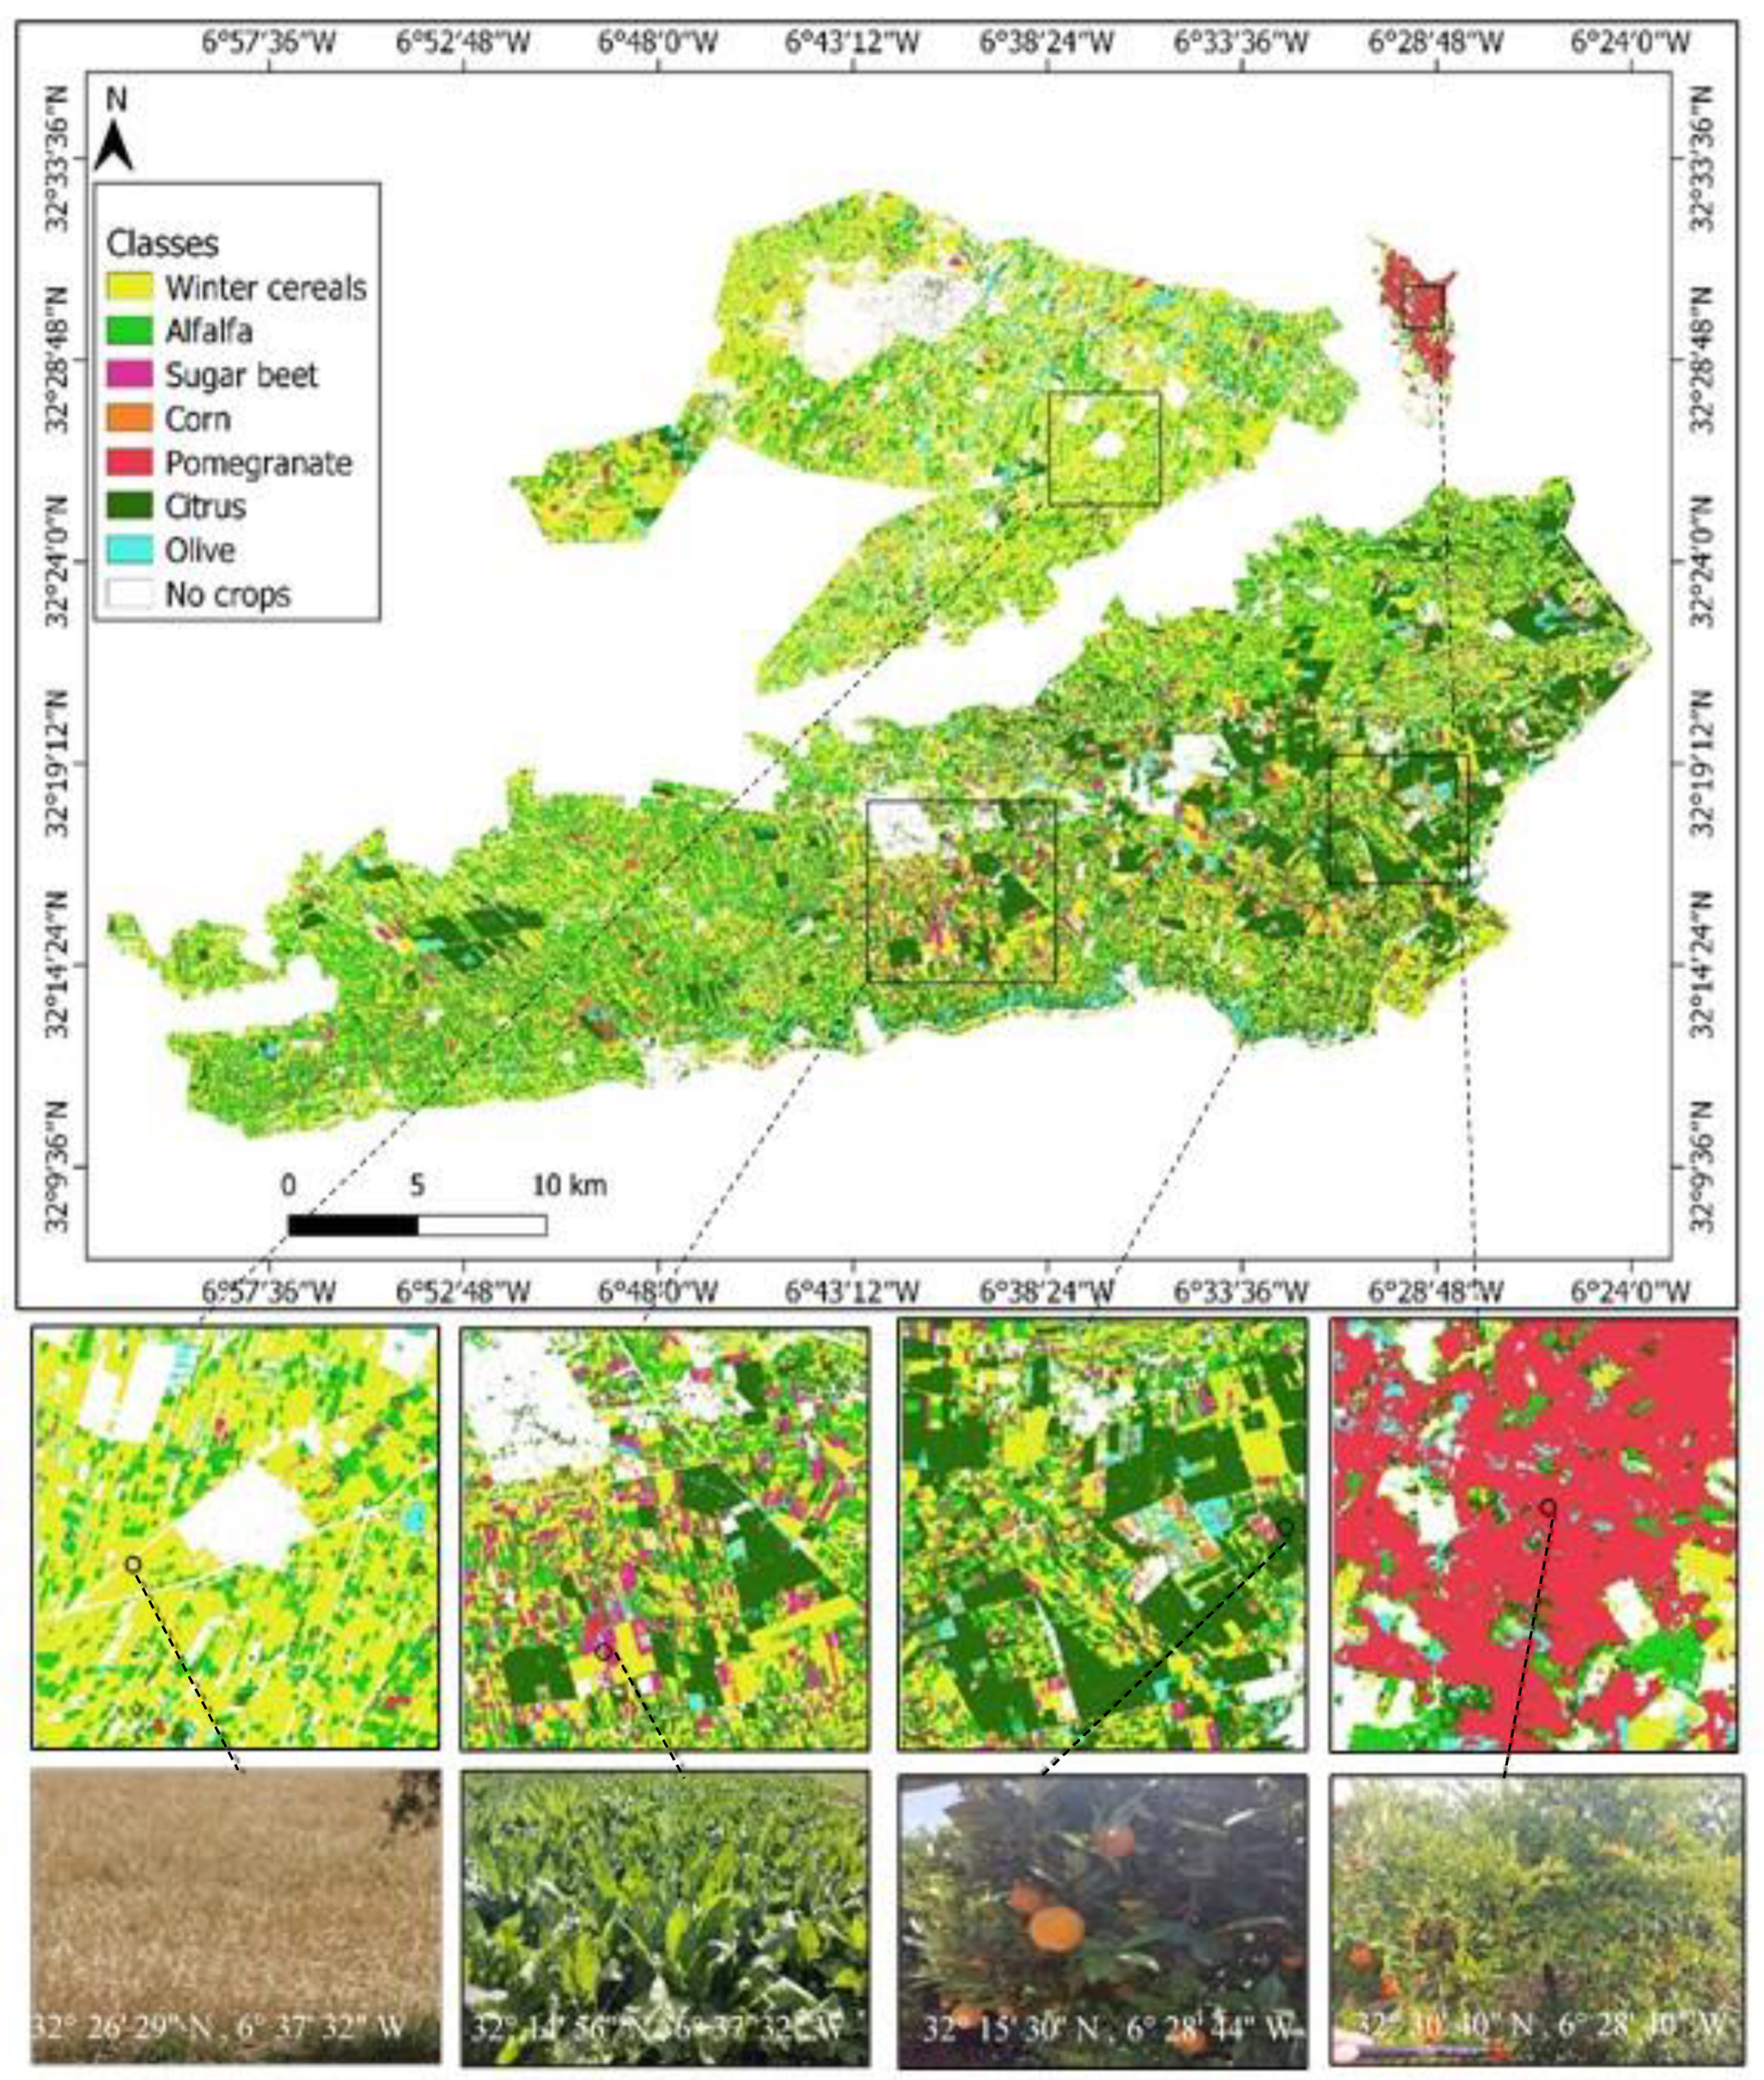
2. Study Area
3. Materials and Methods
3.1. Ground Data
3.2. Satellite Data
3.2.1. Sentinel-2
3.2.2. Sentinel-1
3.3. Tools Used
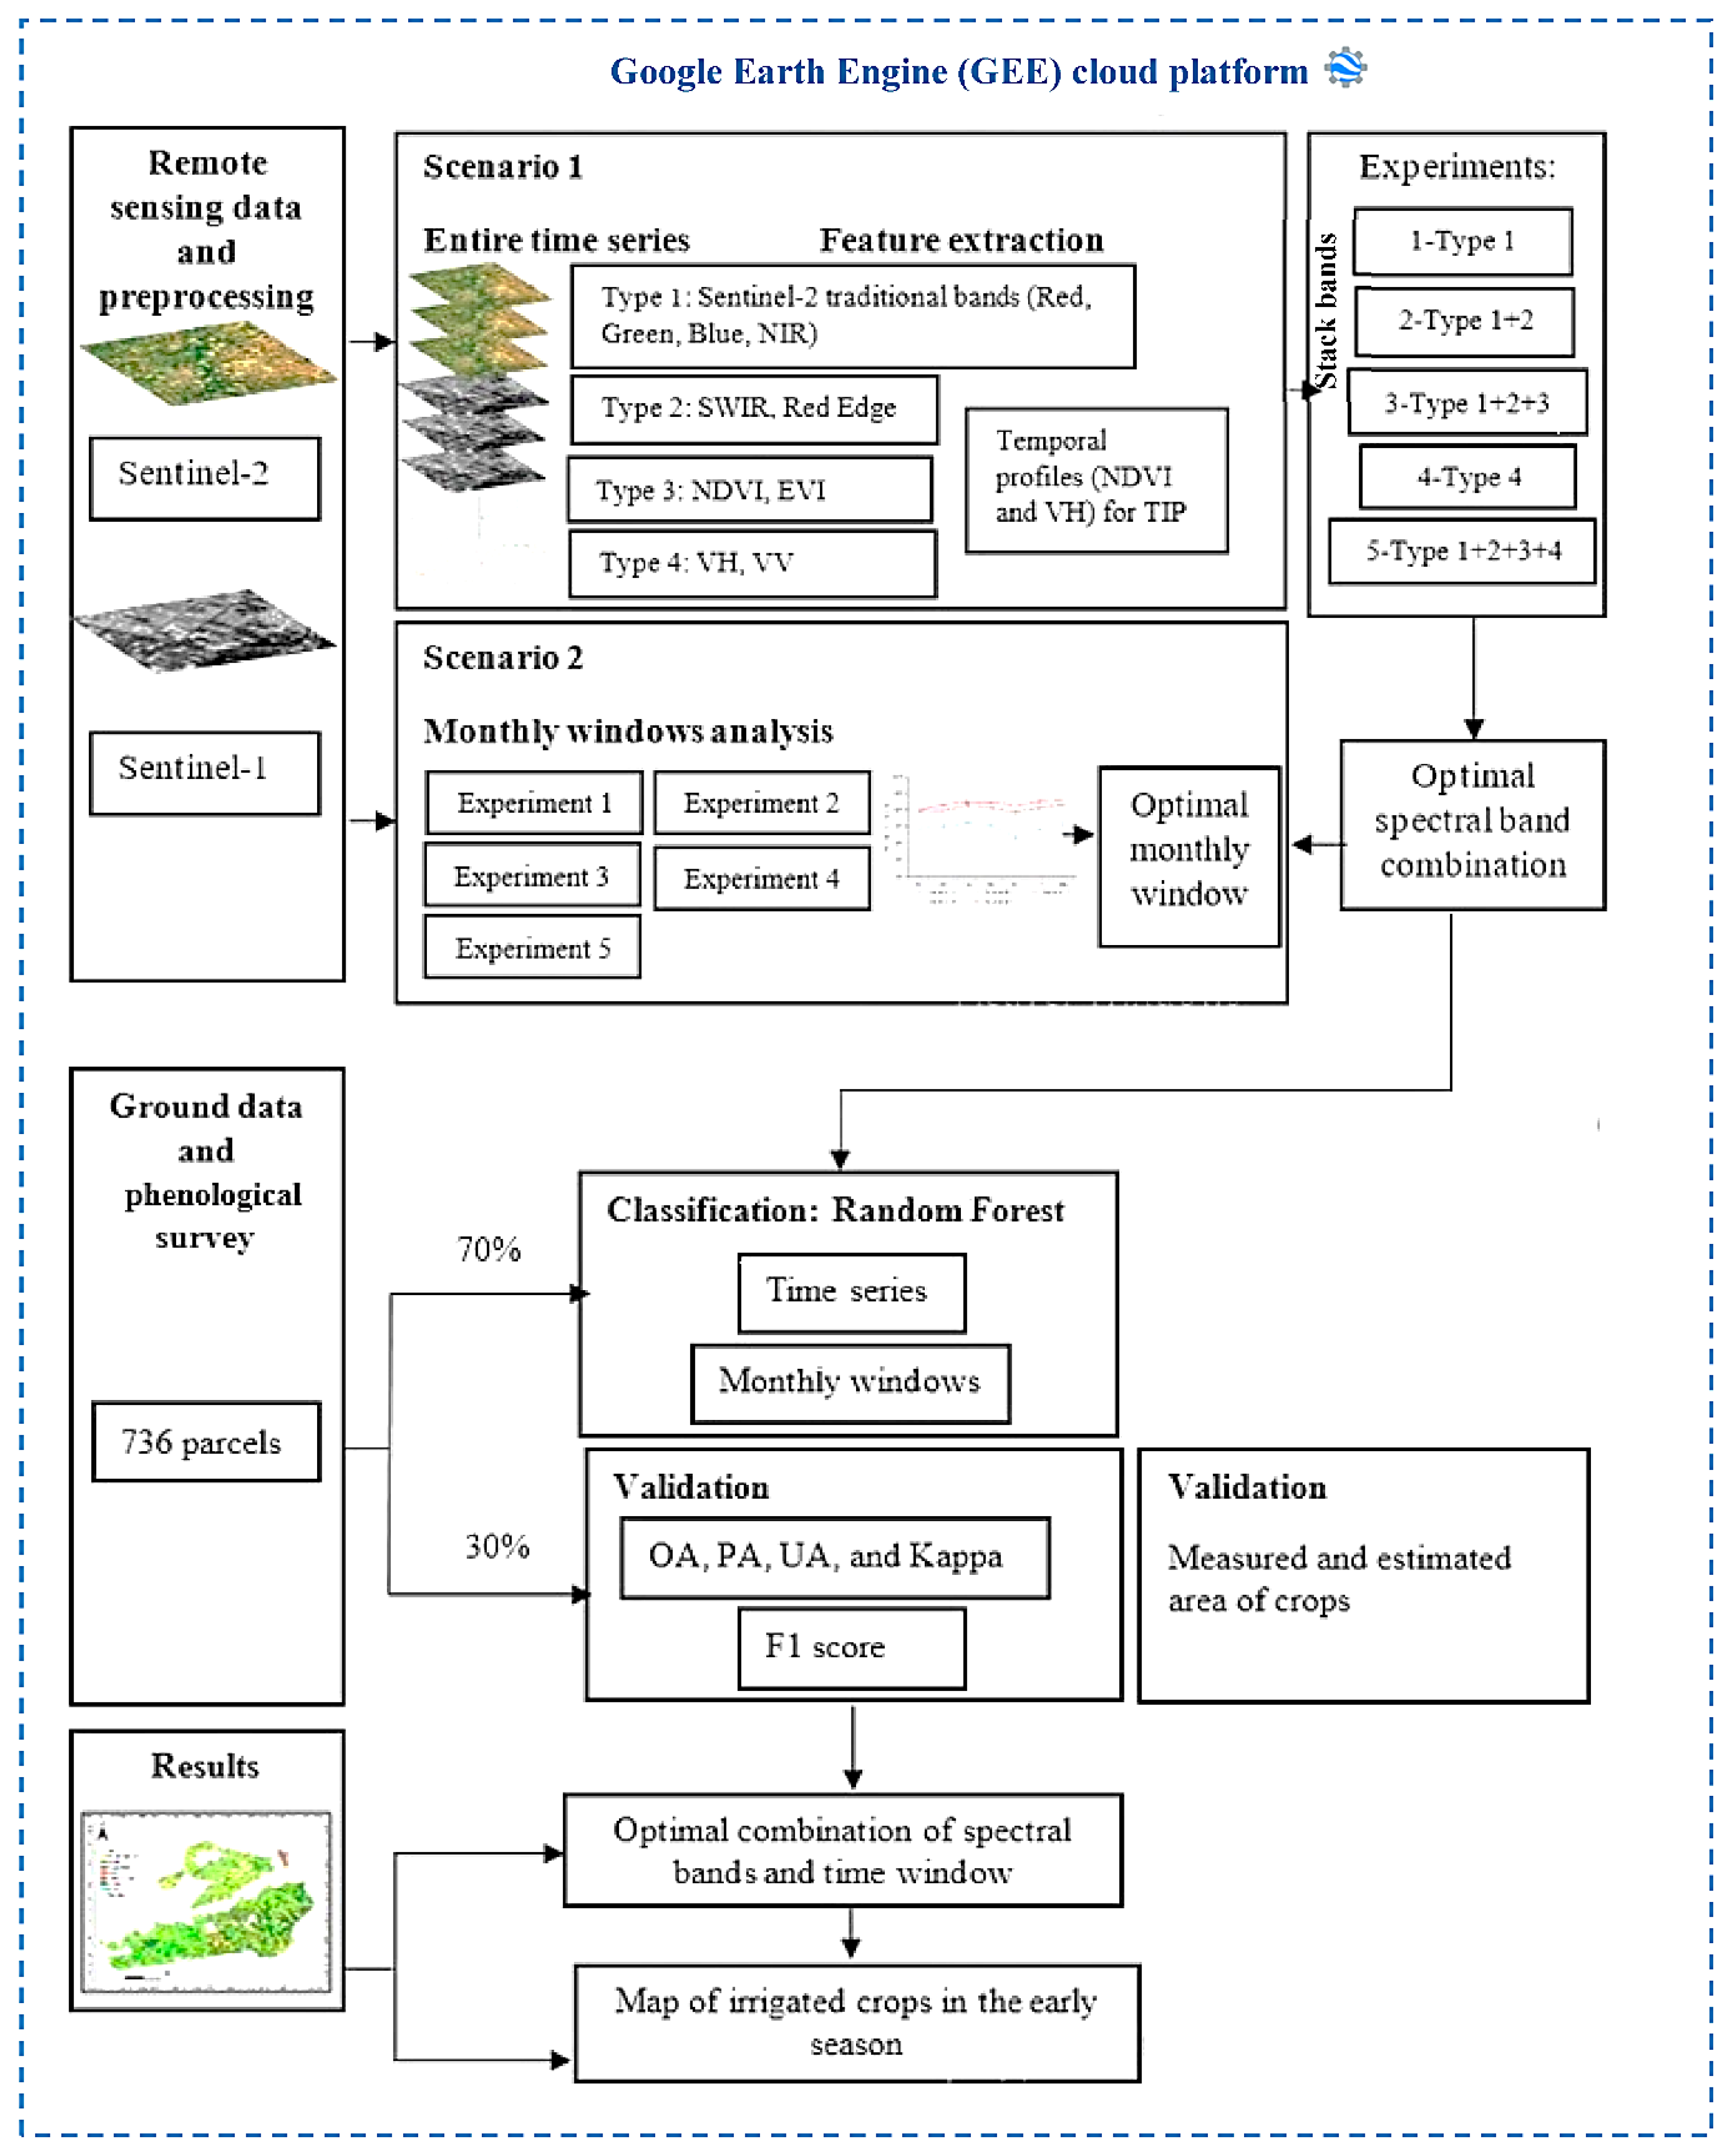
4. Methodology
4.1. Pre-Processing
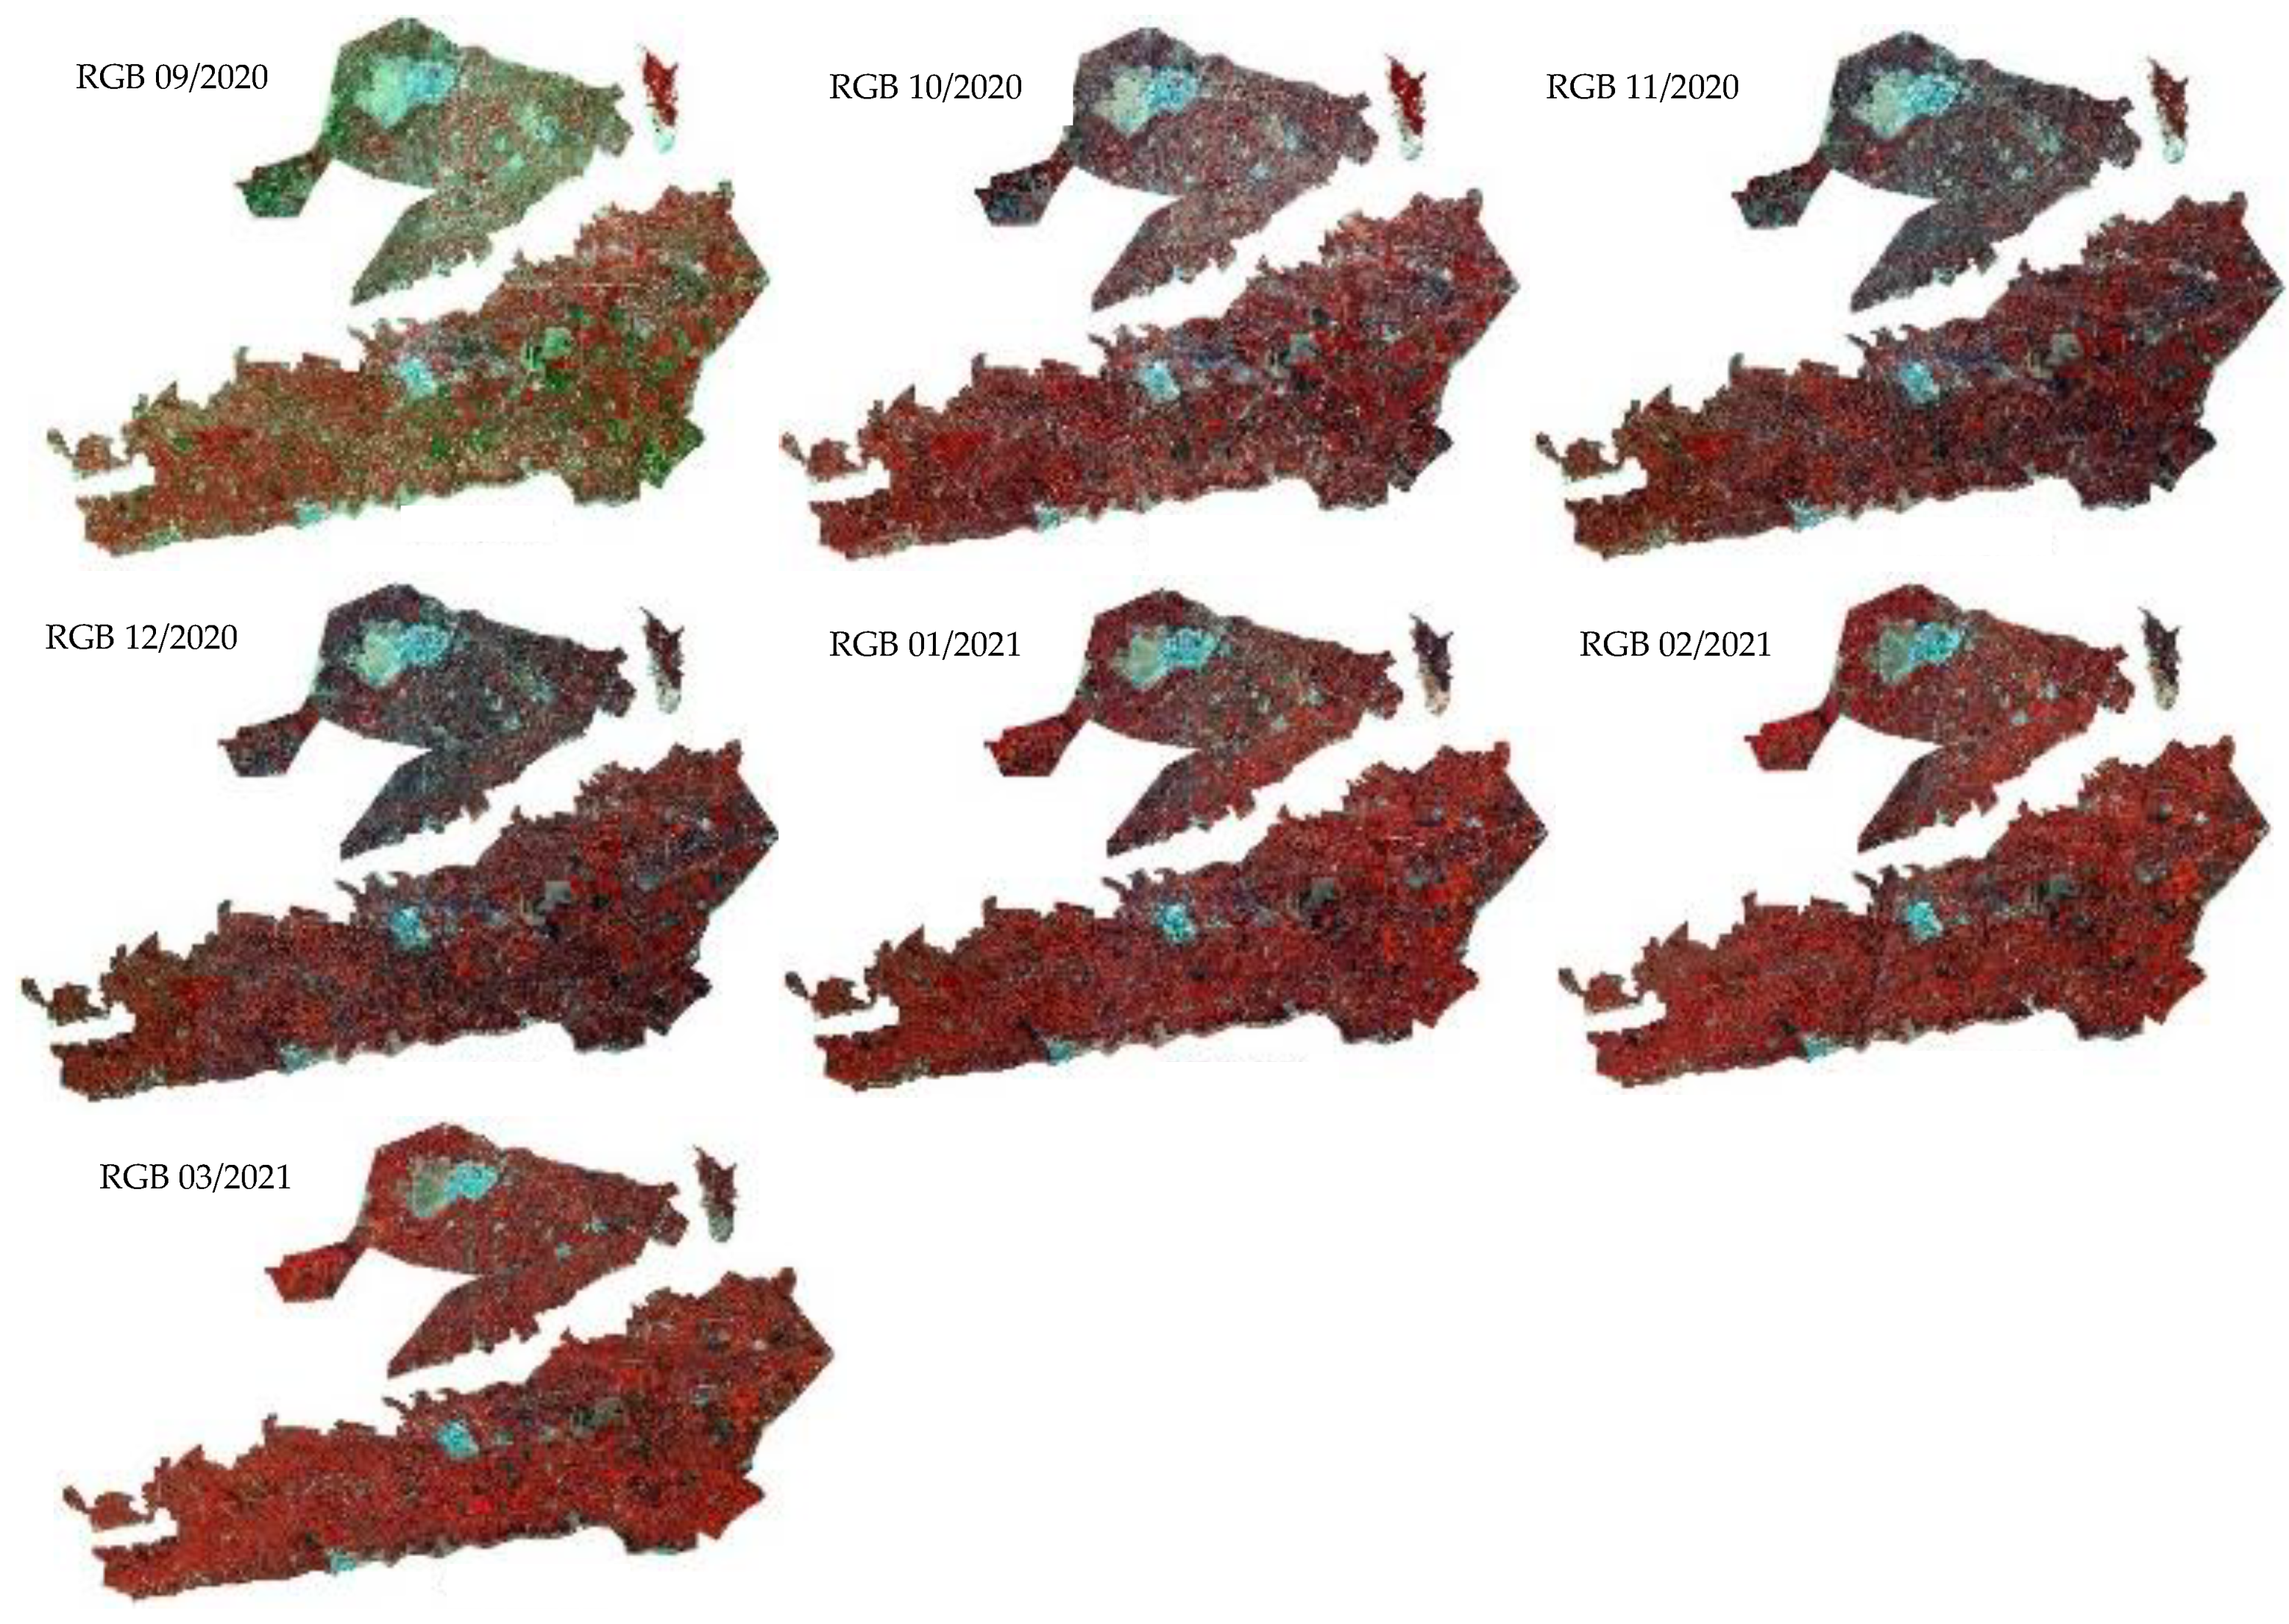
4.2. Image Compositing
4.3. Scenario 1
4.4. Scenario 2
4.5. Classification Process
4.6. Validation
5. Results
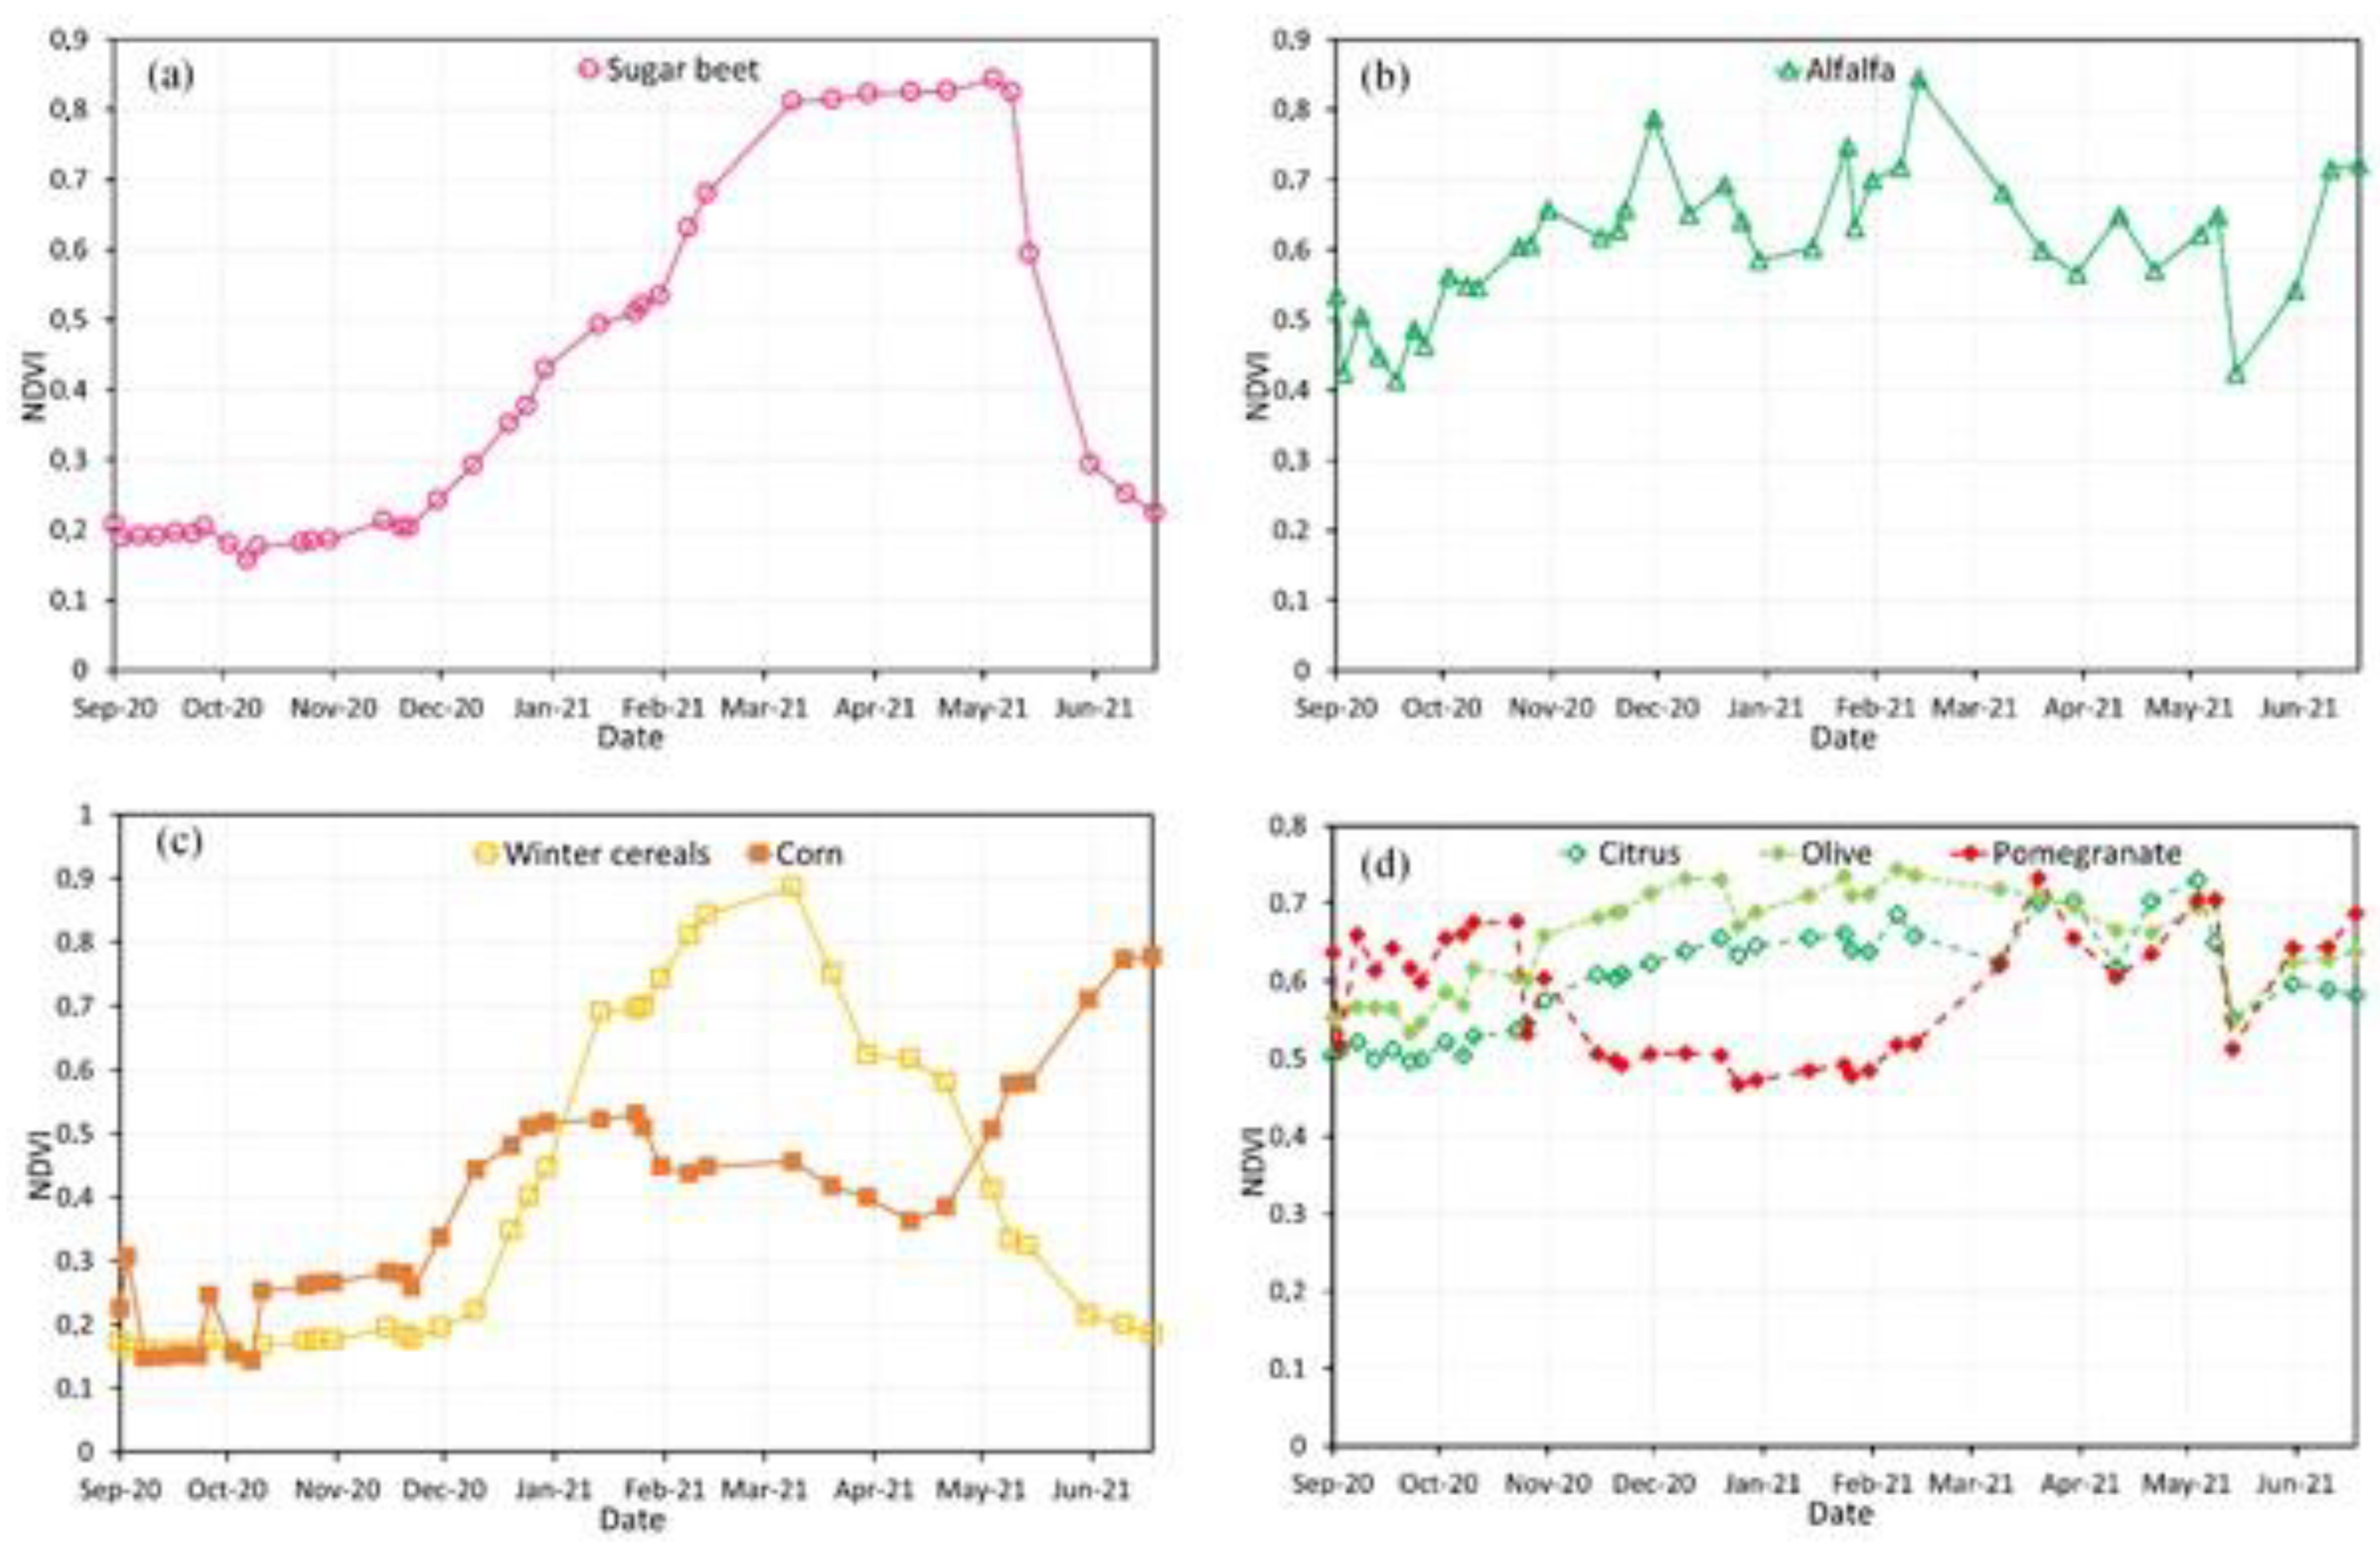
5.1. Temporal Profiles of Normalized Difference Vegetation Index (NDVI)
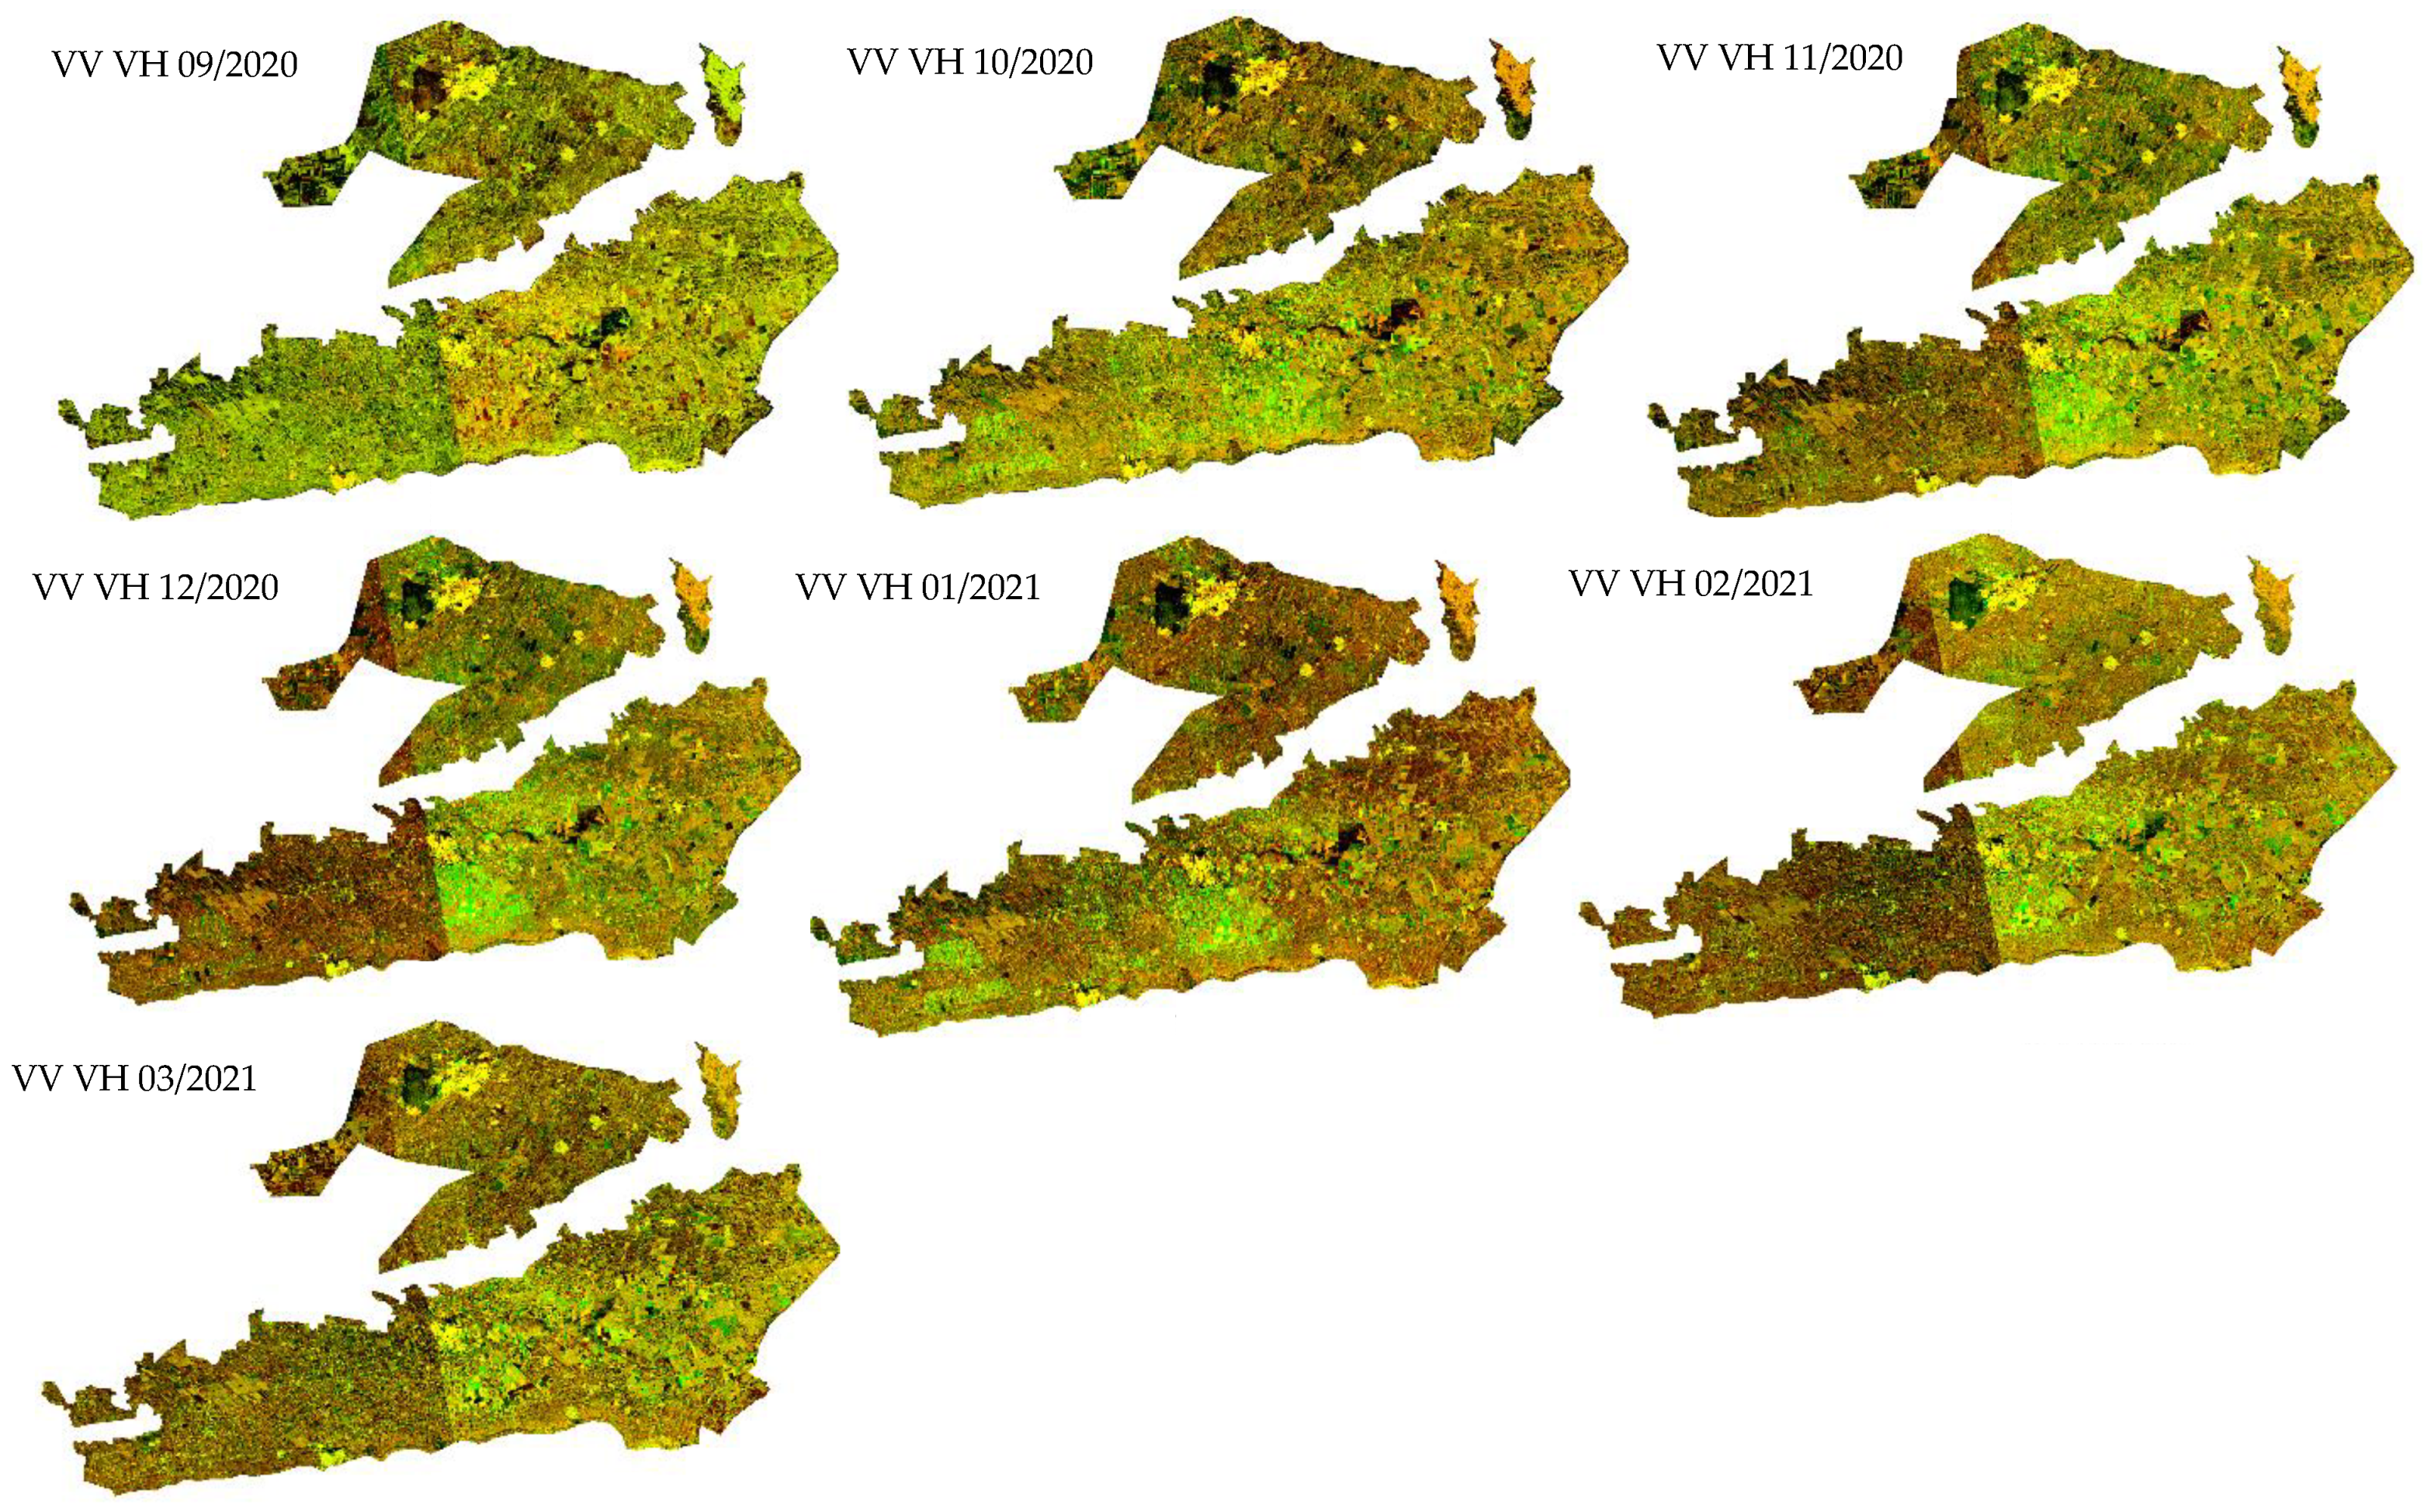
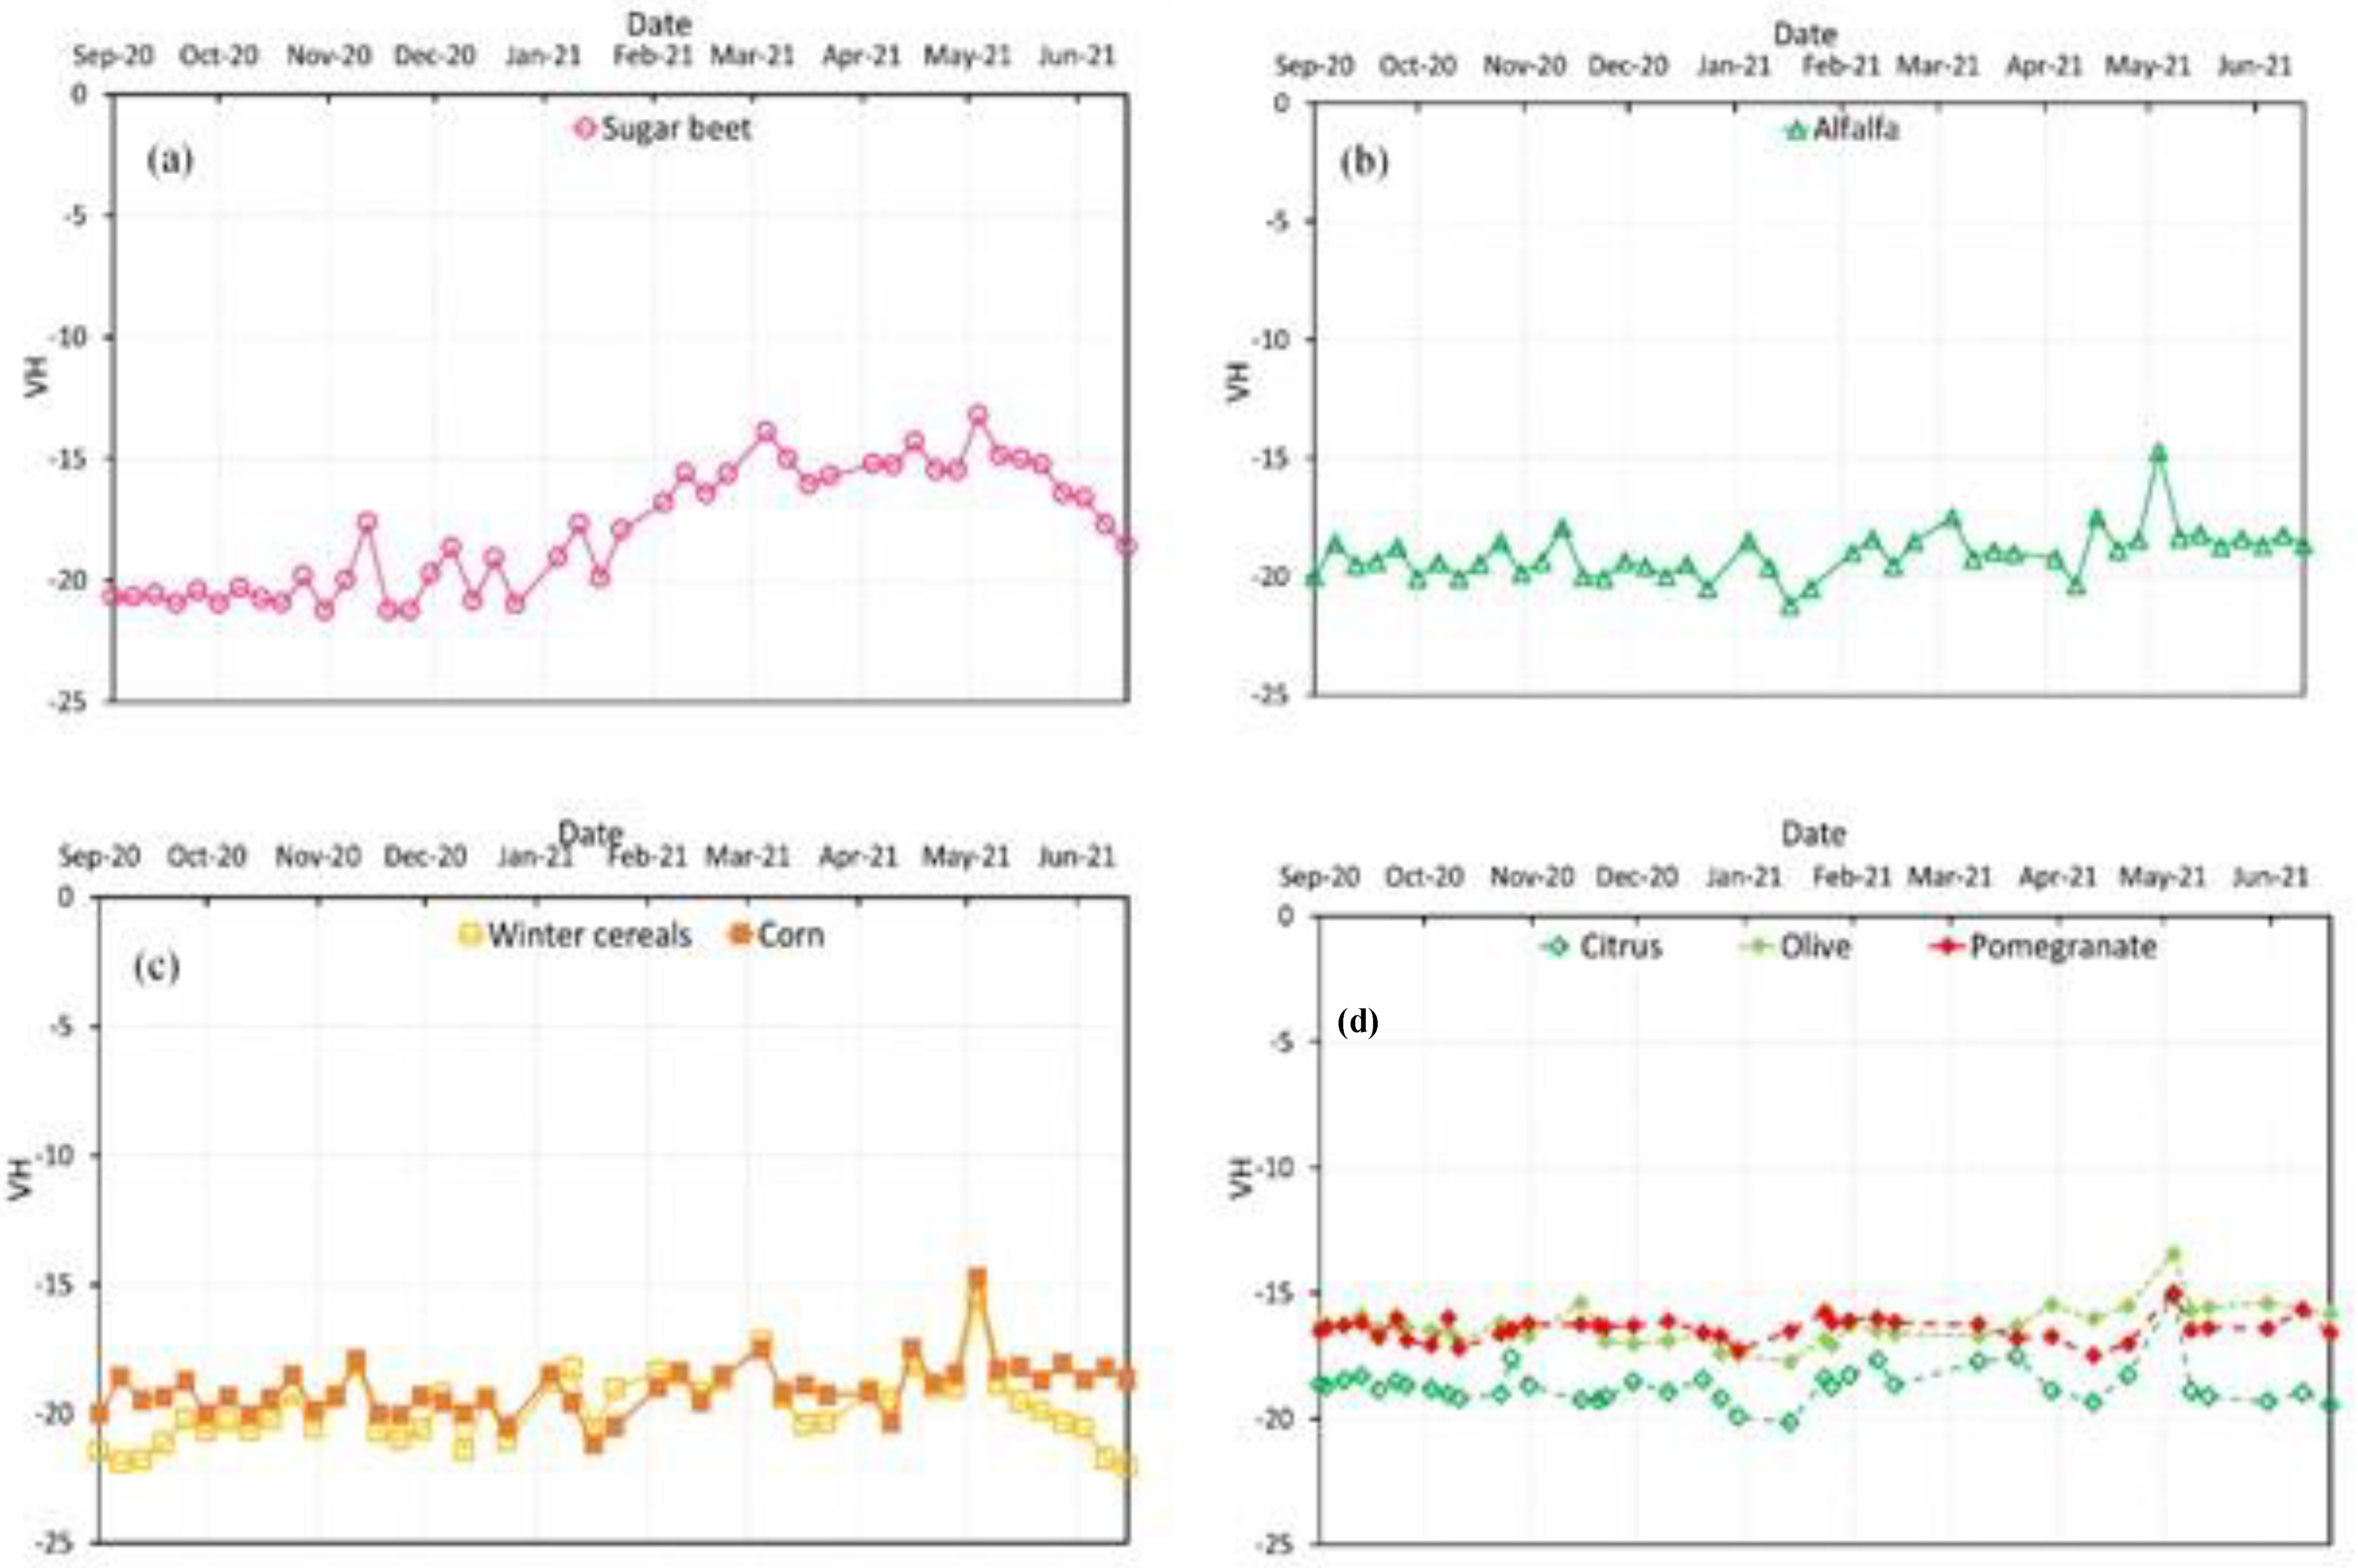
5.2. Temporal Profiles of Backscattering in VH Polarization
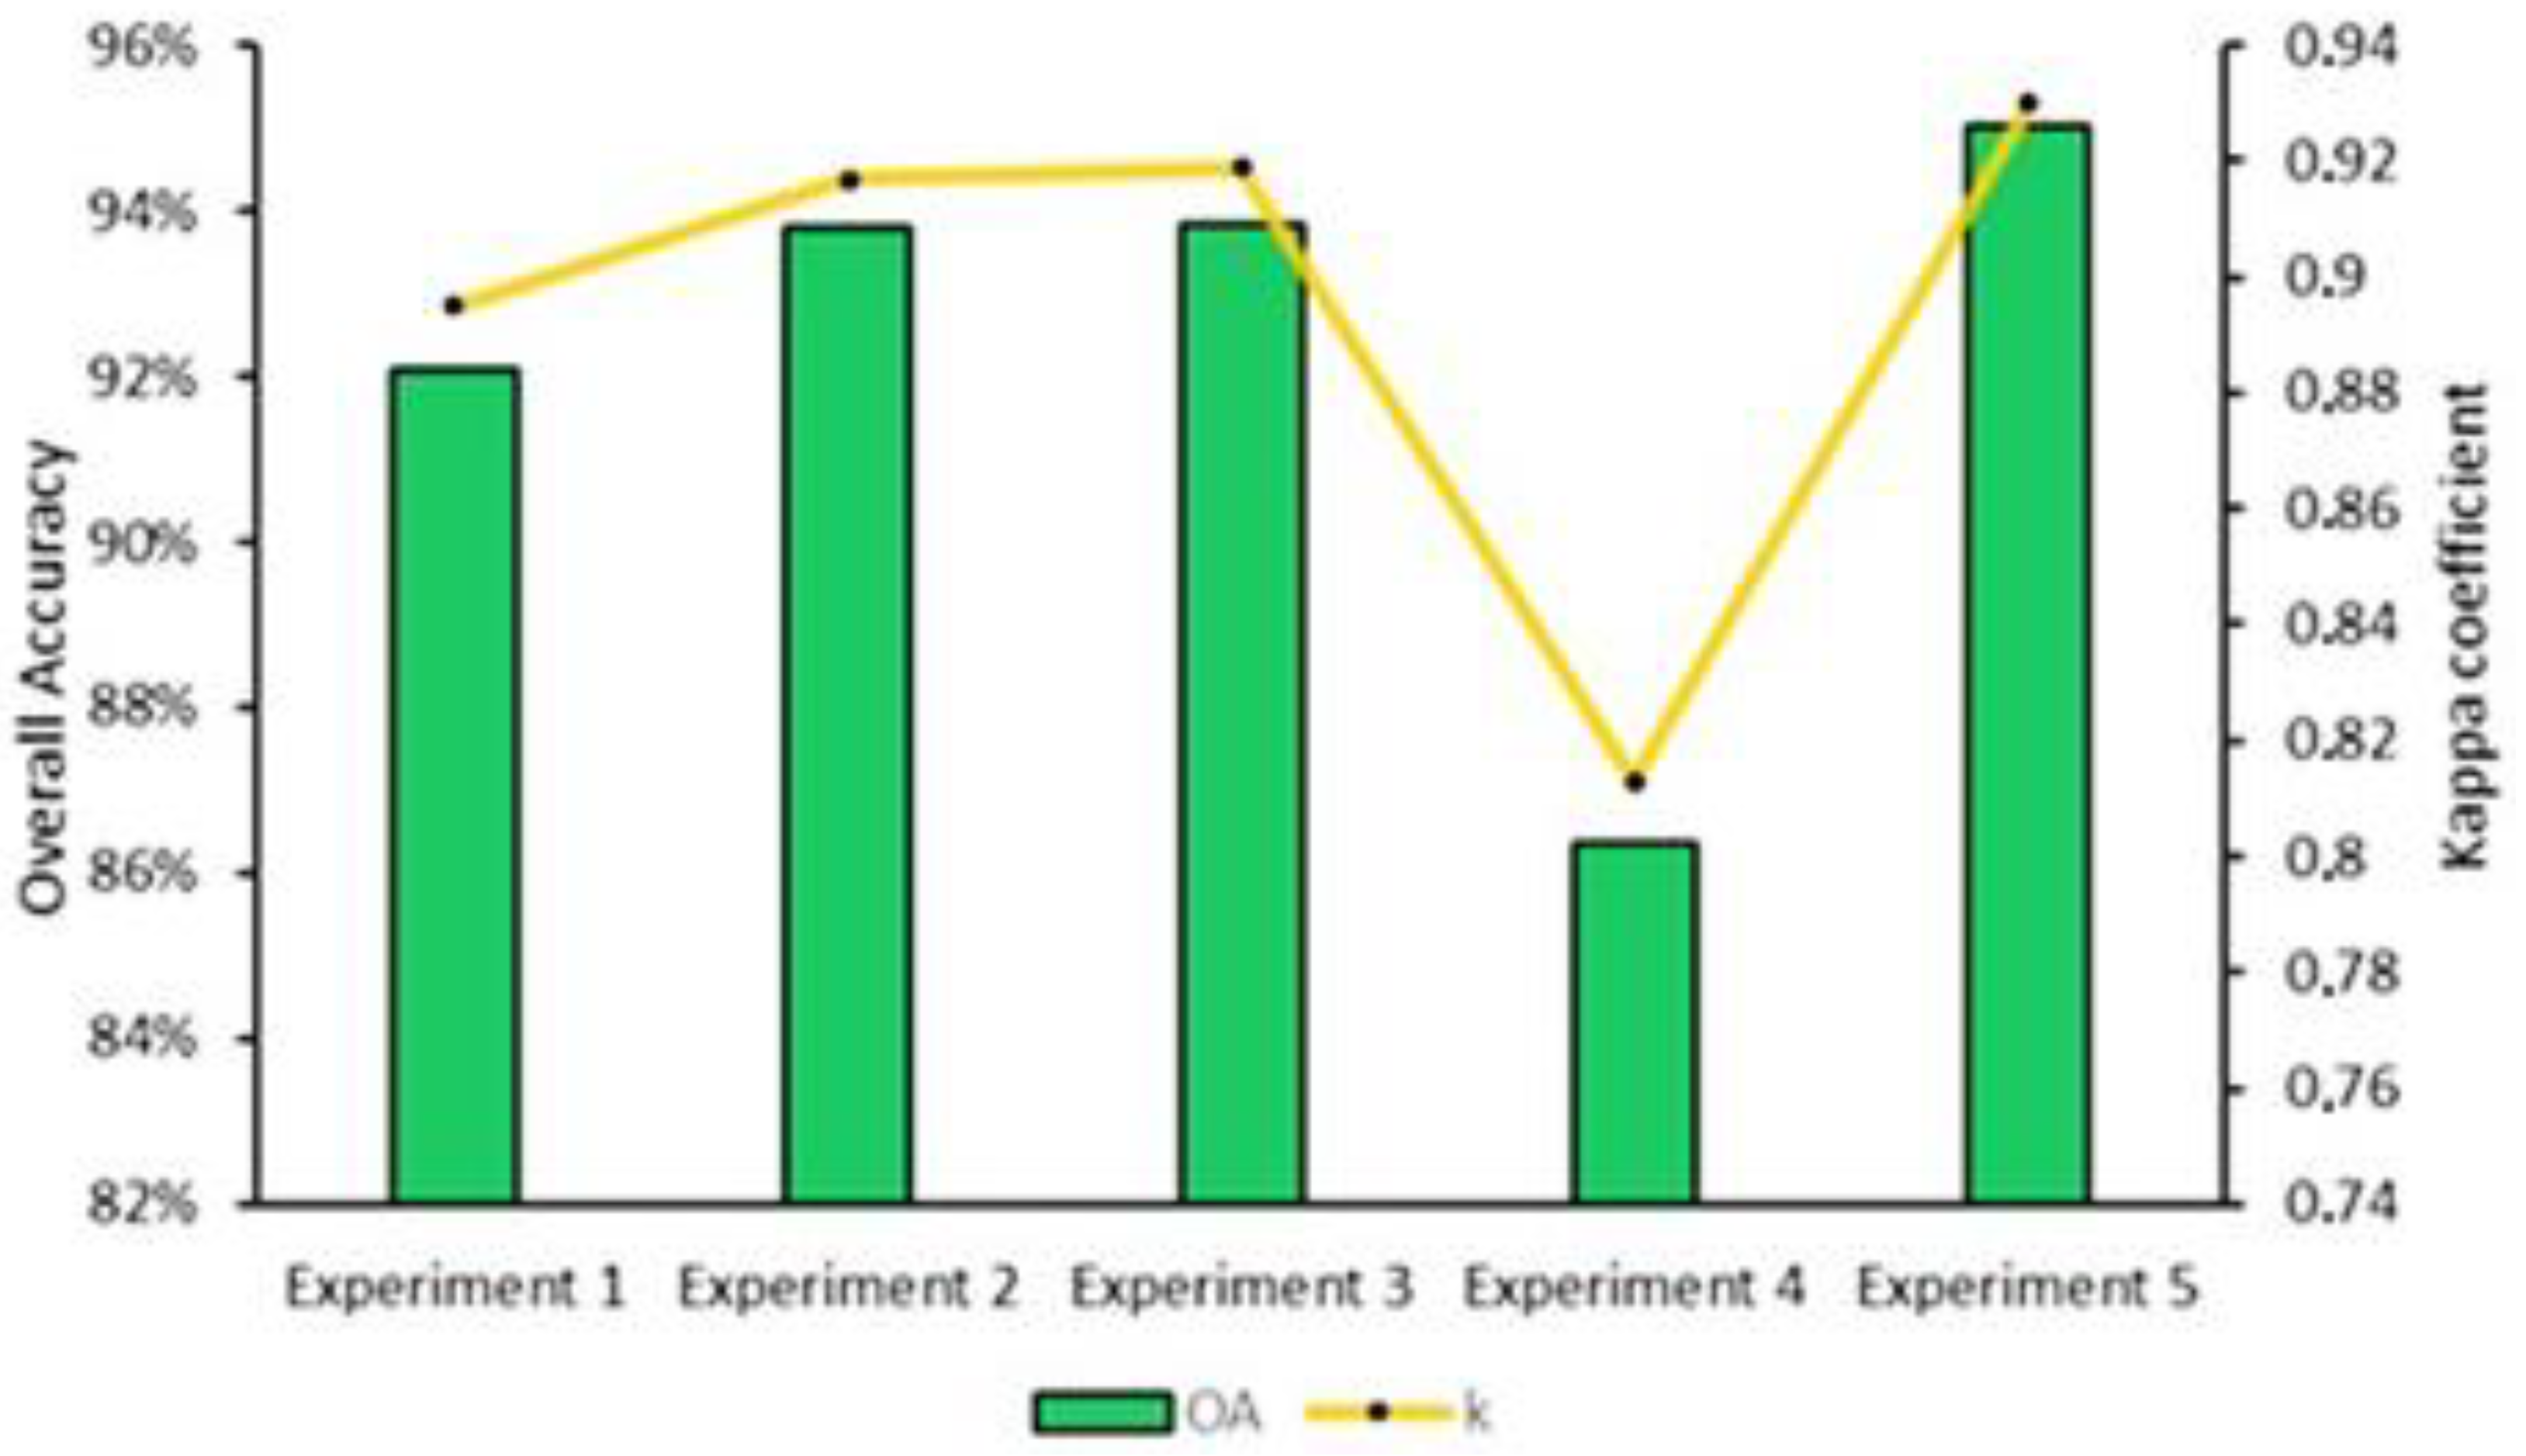
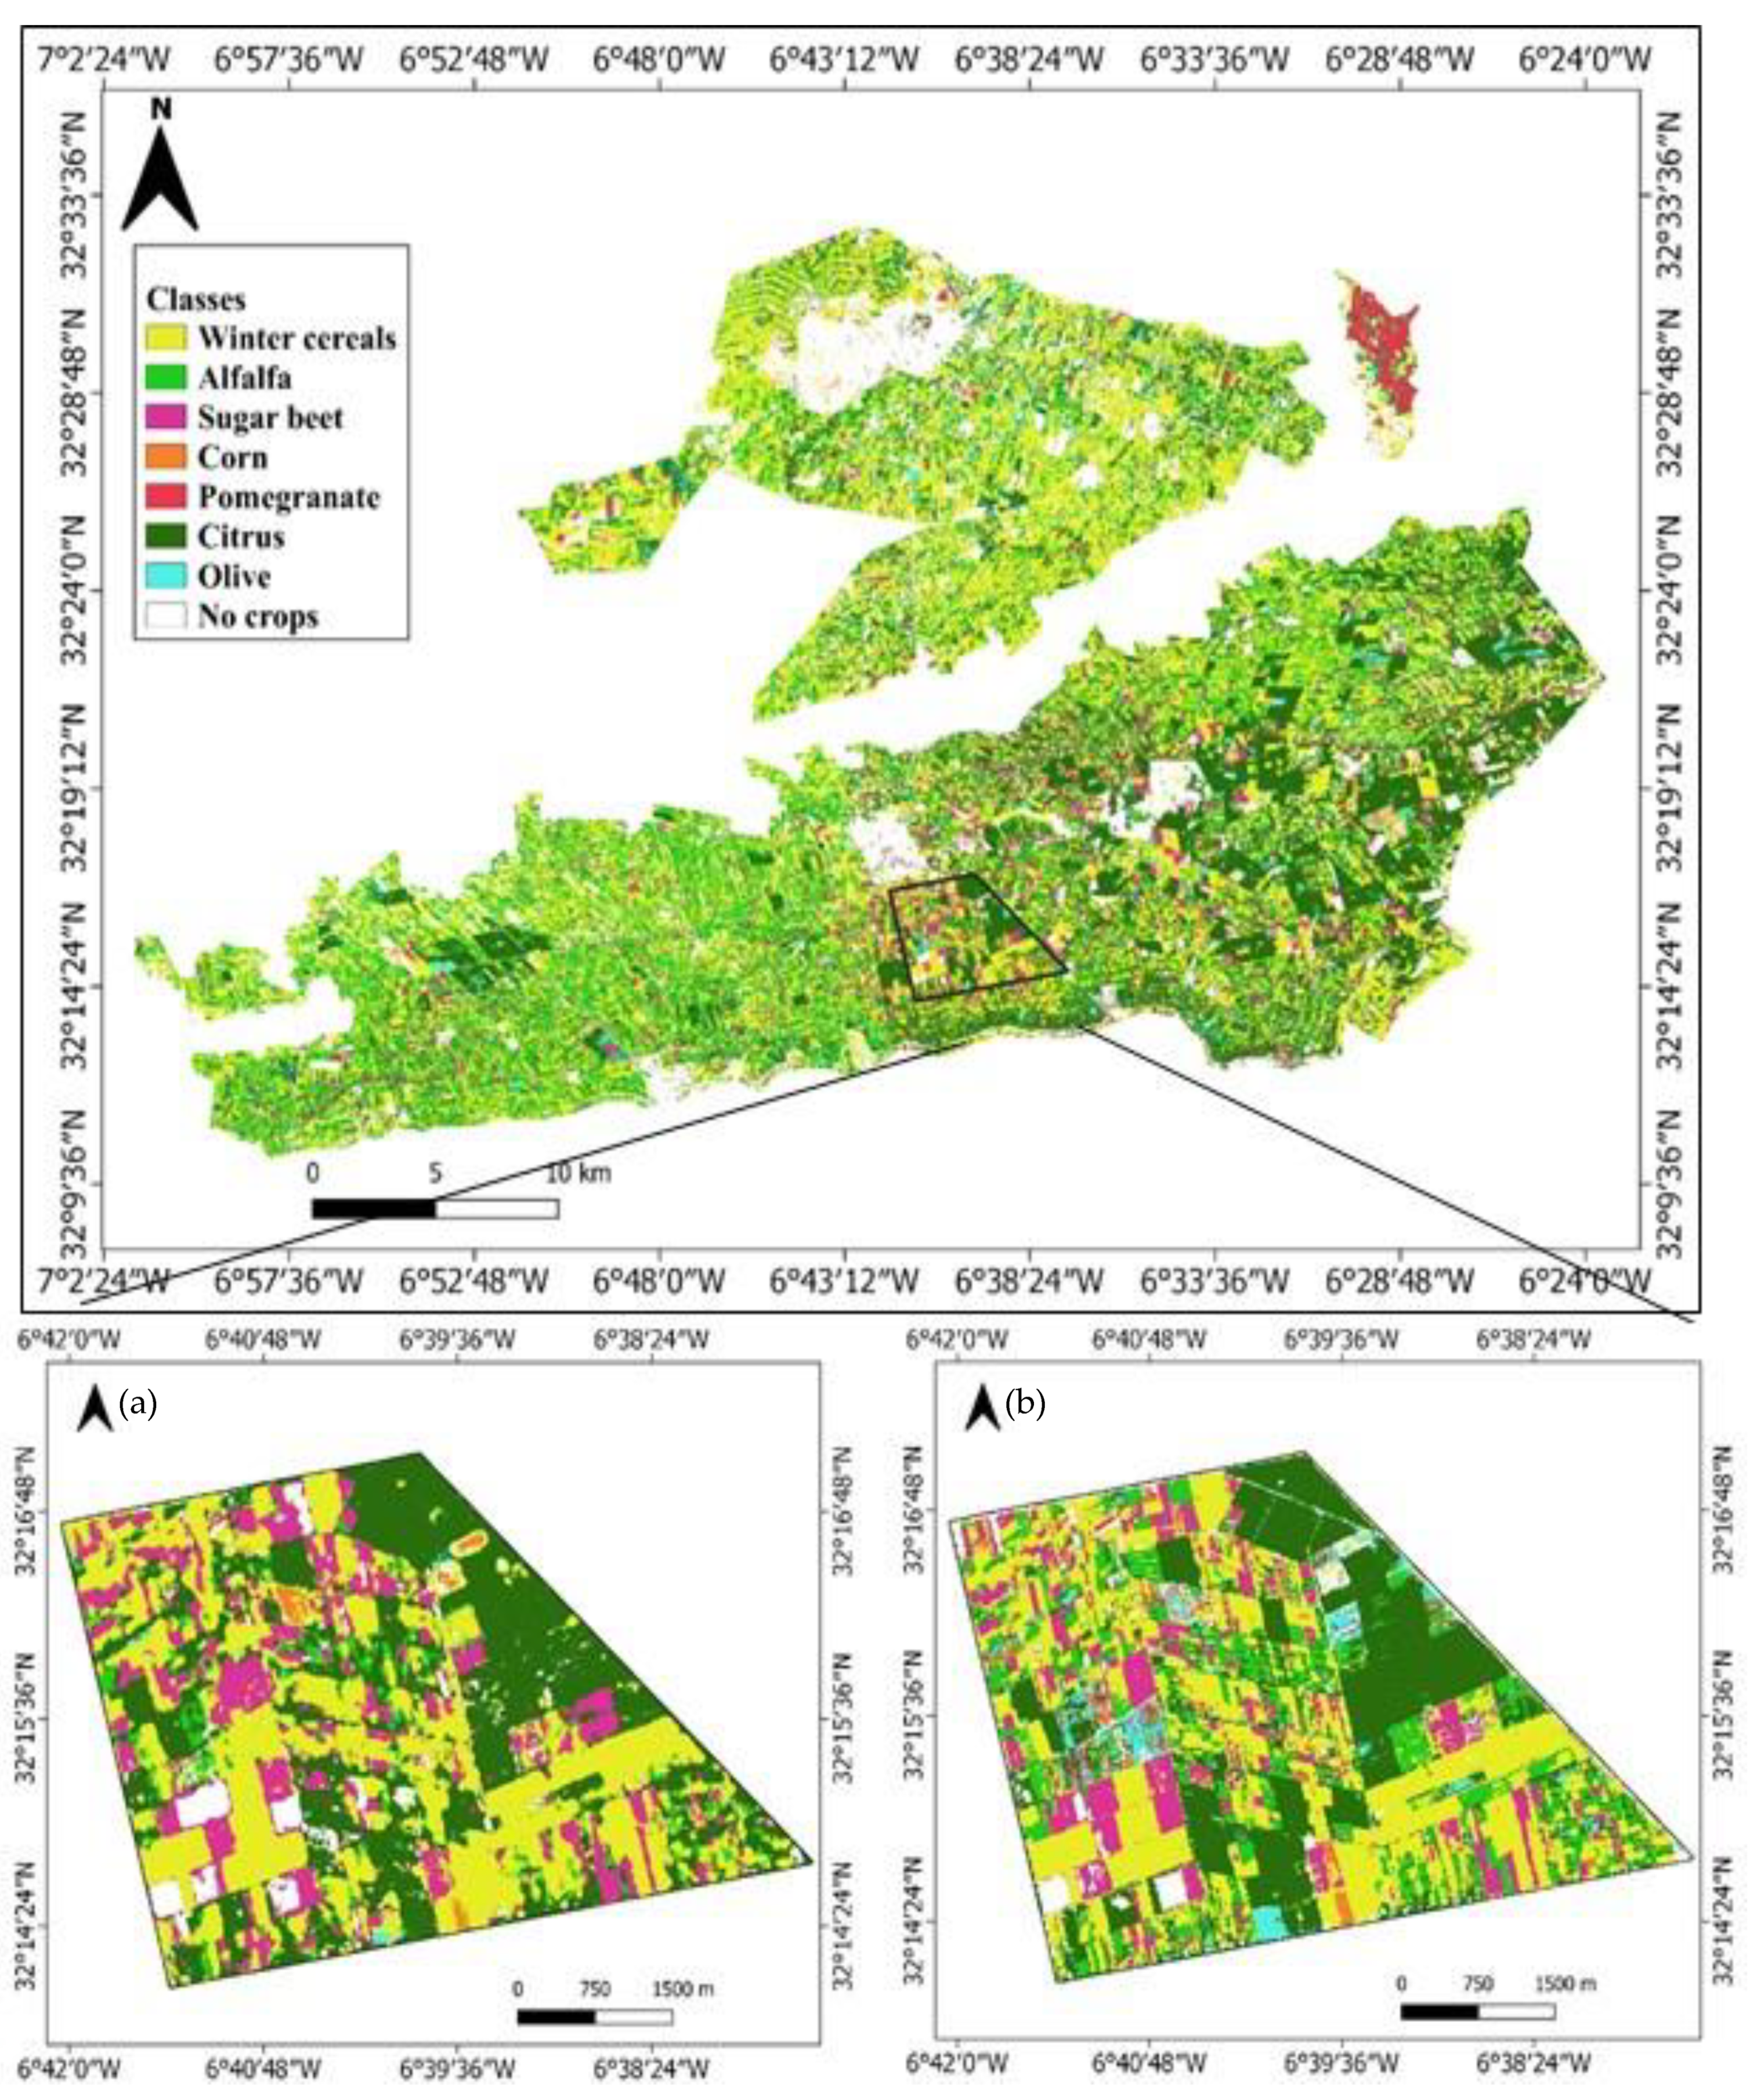
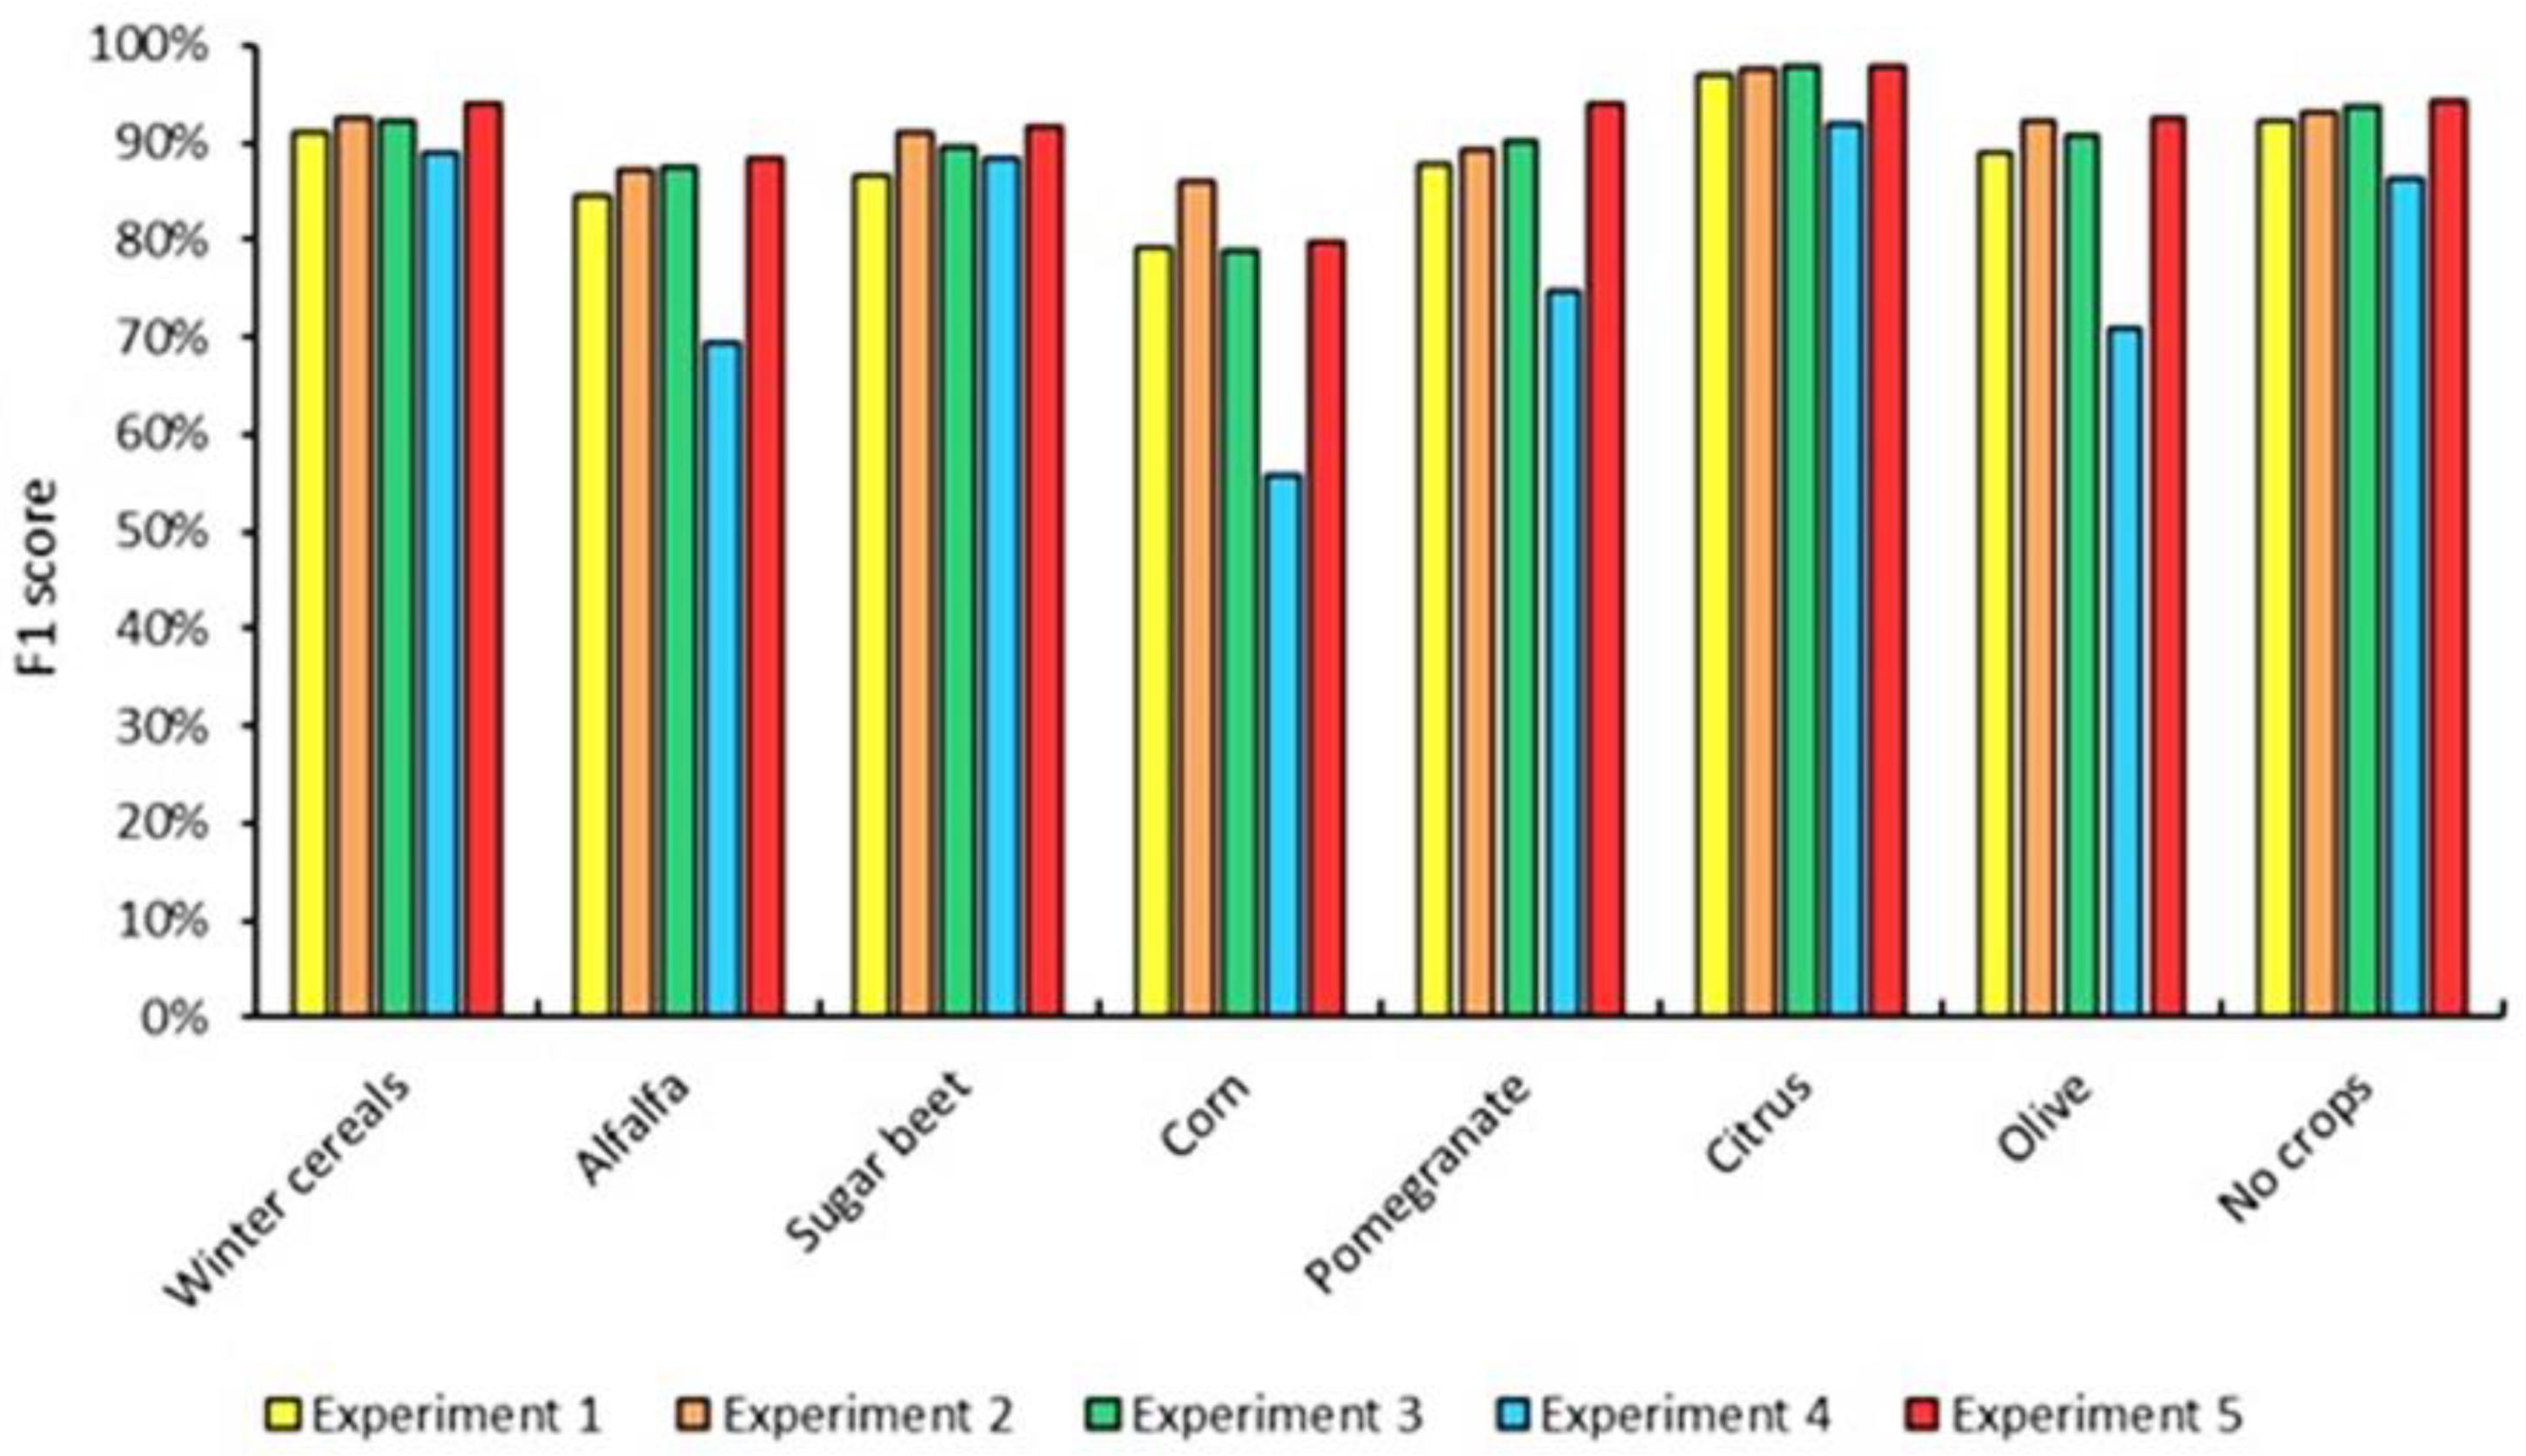
5.3. Crop Mapping in the Early Season with the Entire Time Series (Scenario 1)
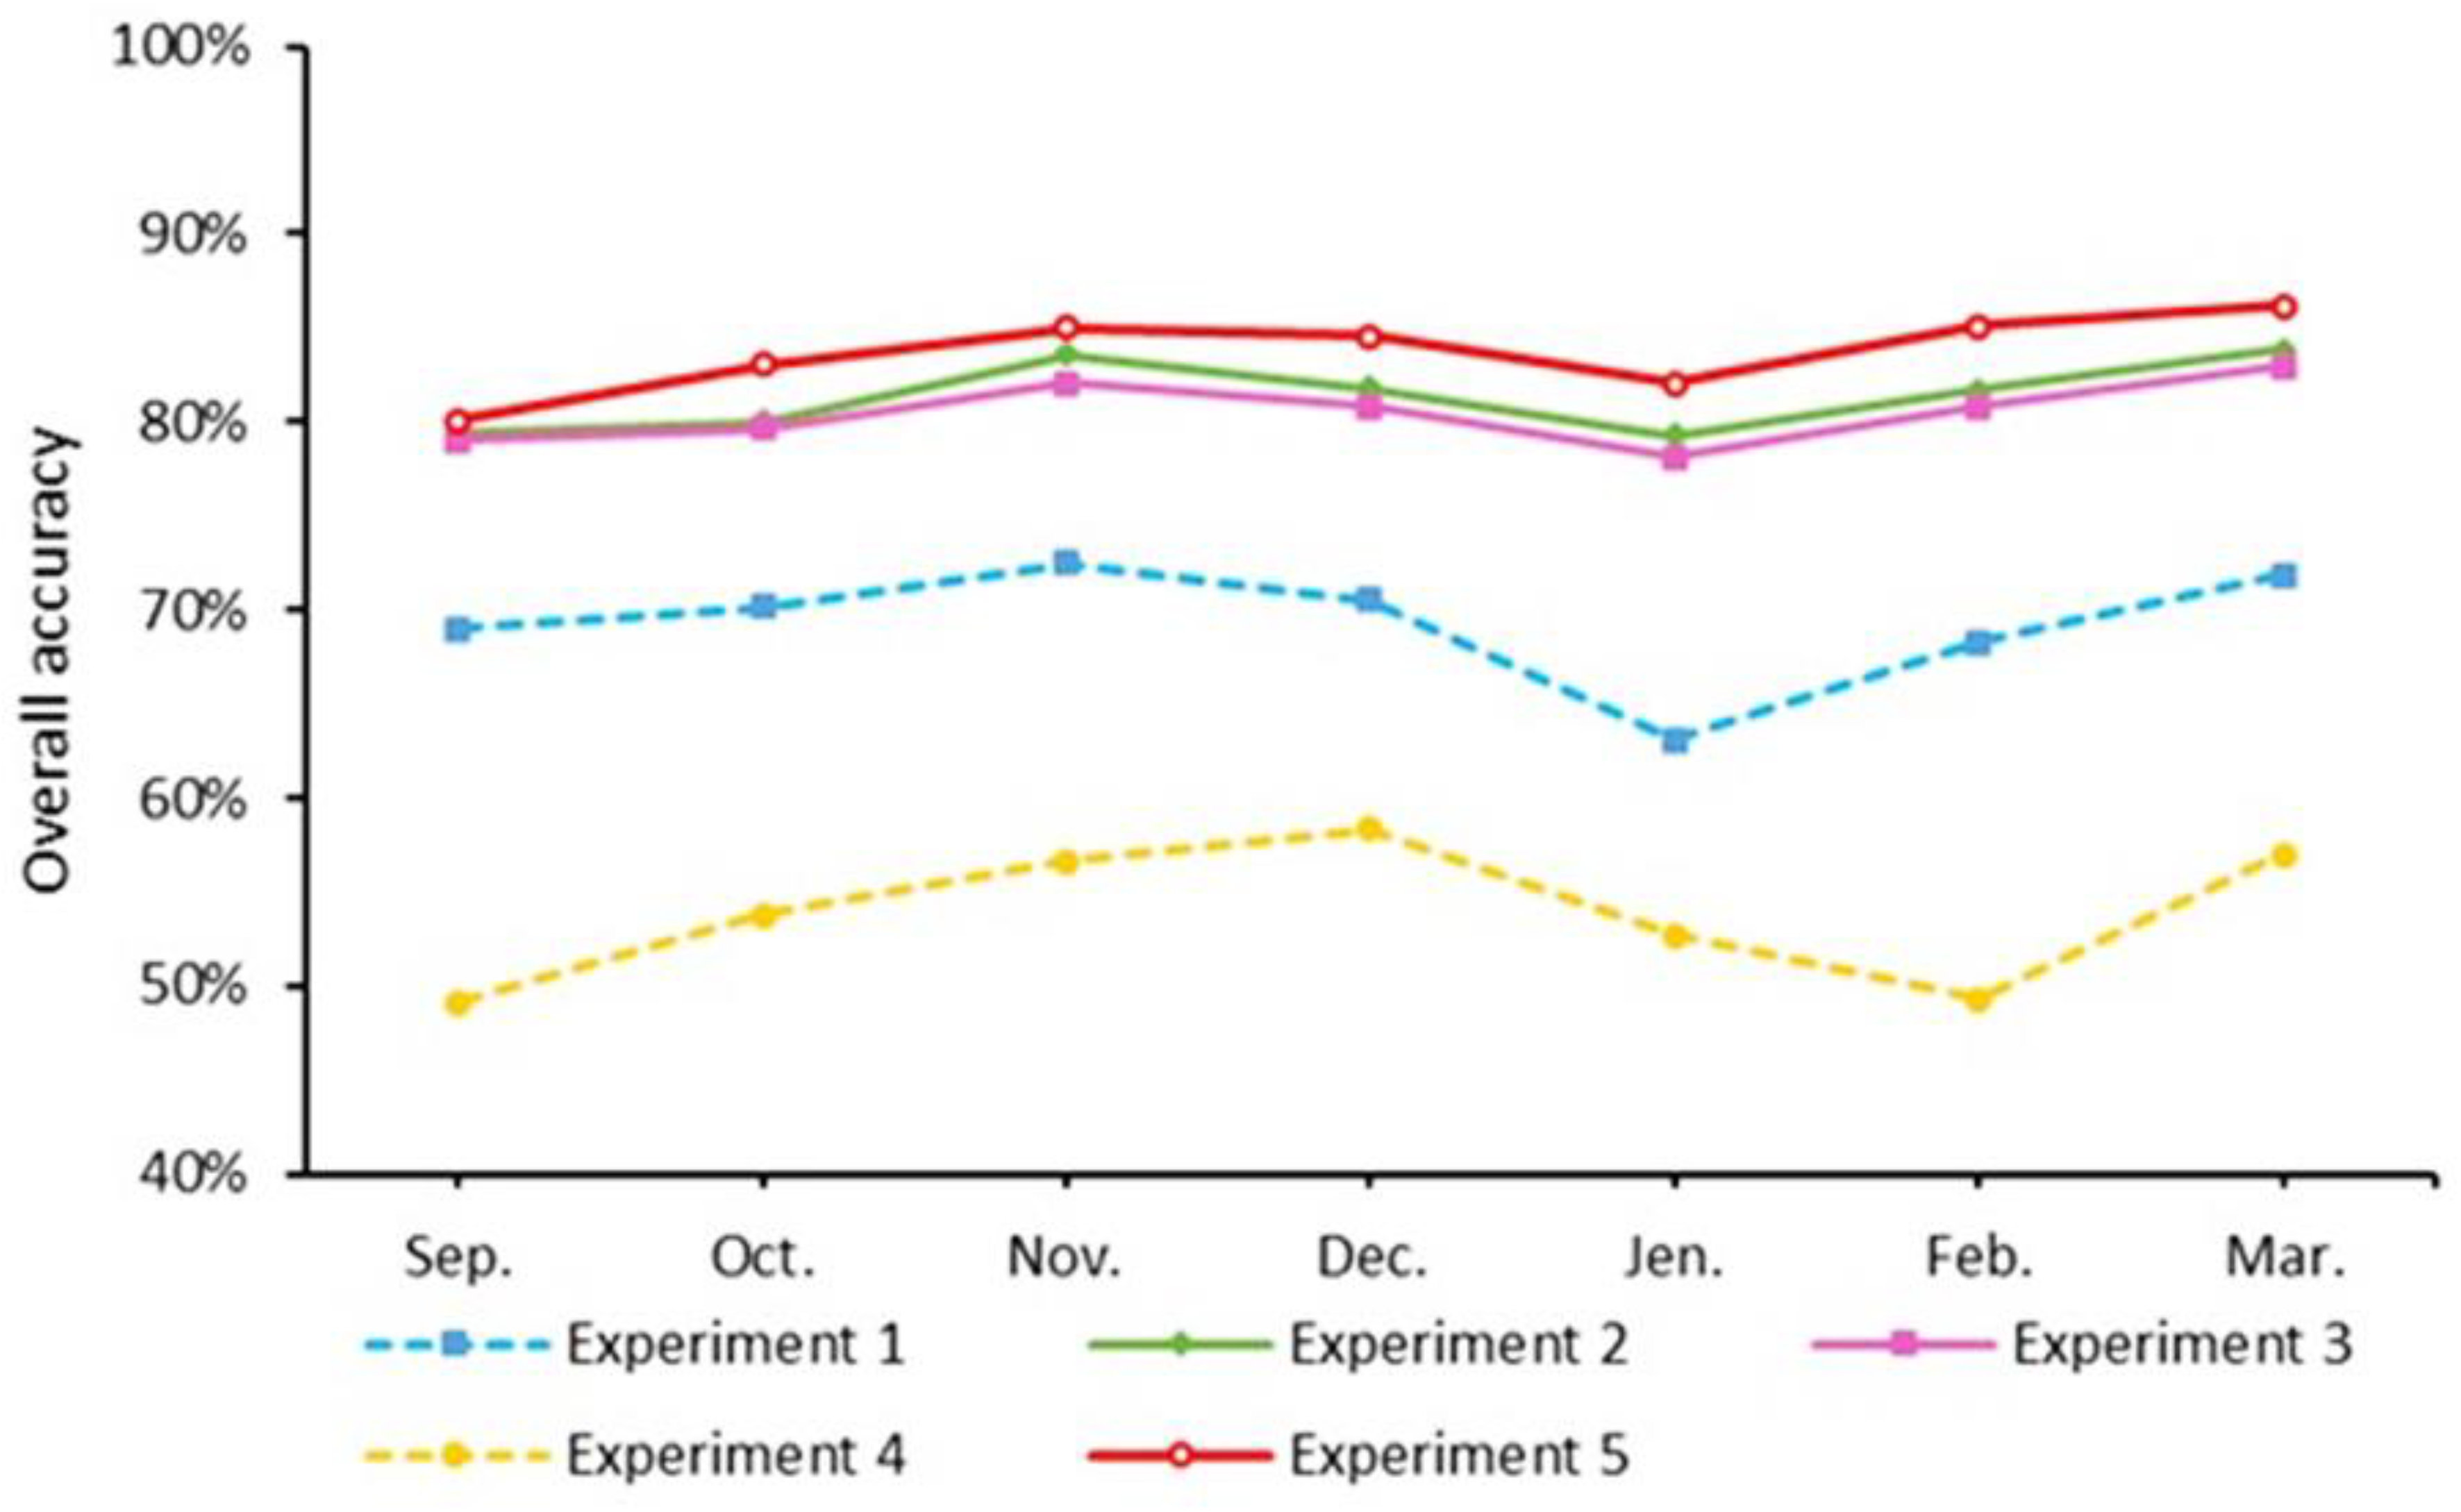
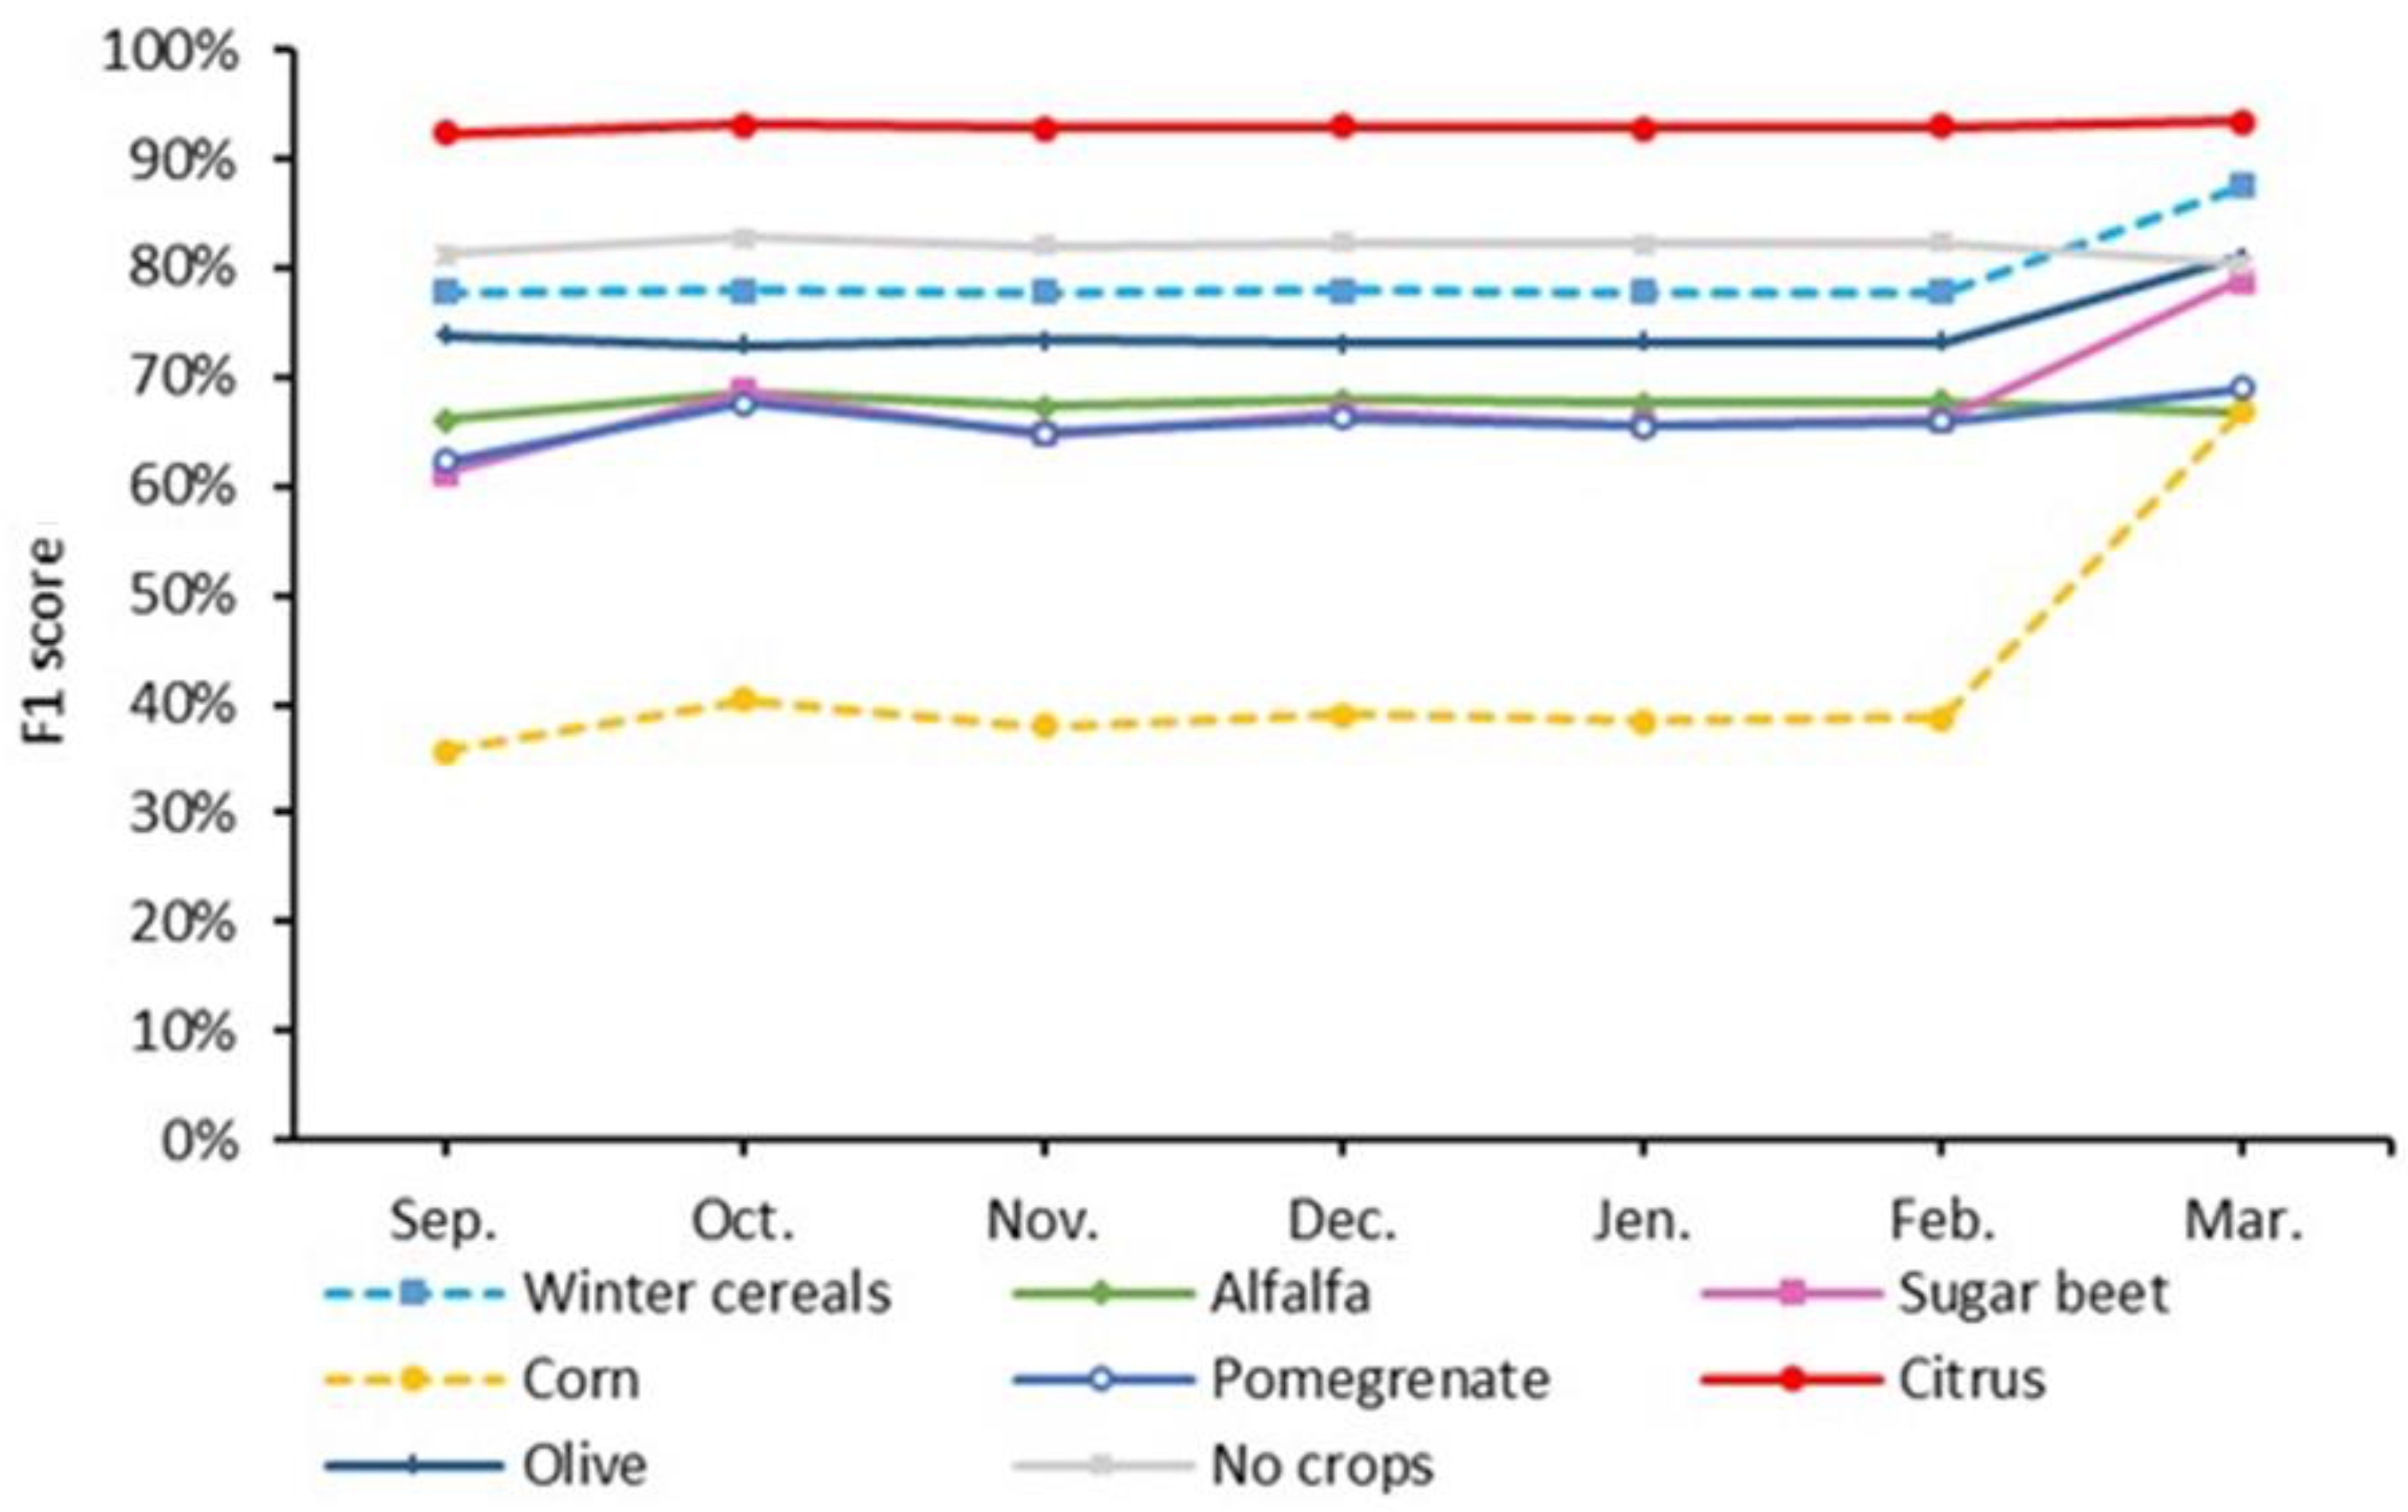
5.4. Crop Mapping in the Early Season with Monthly Windows (Scenario 2)
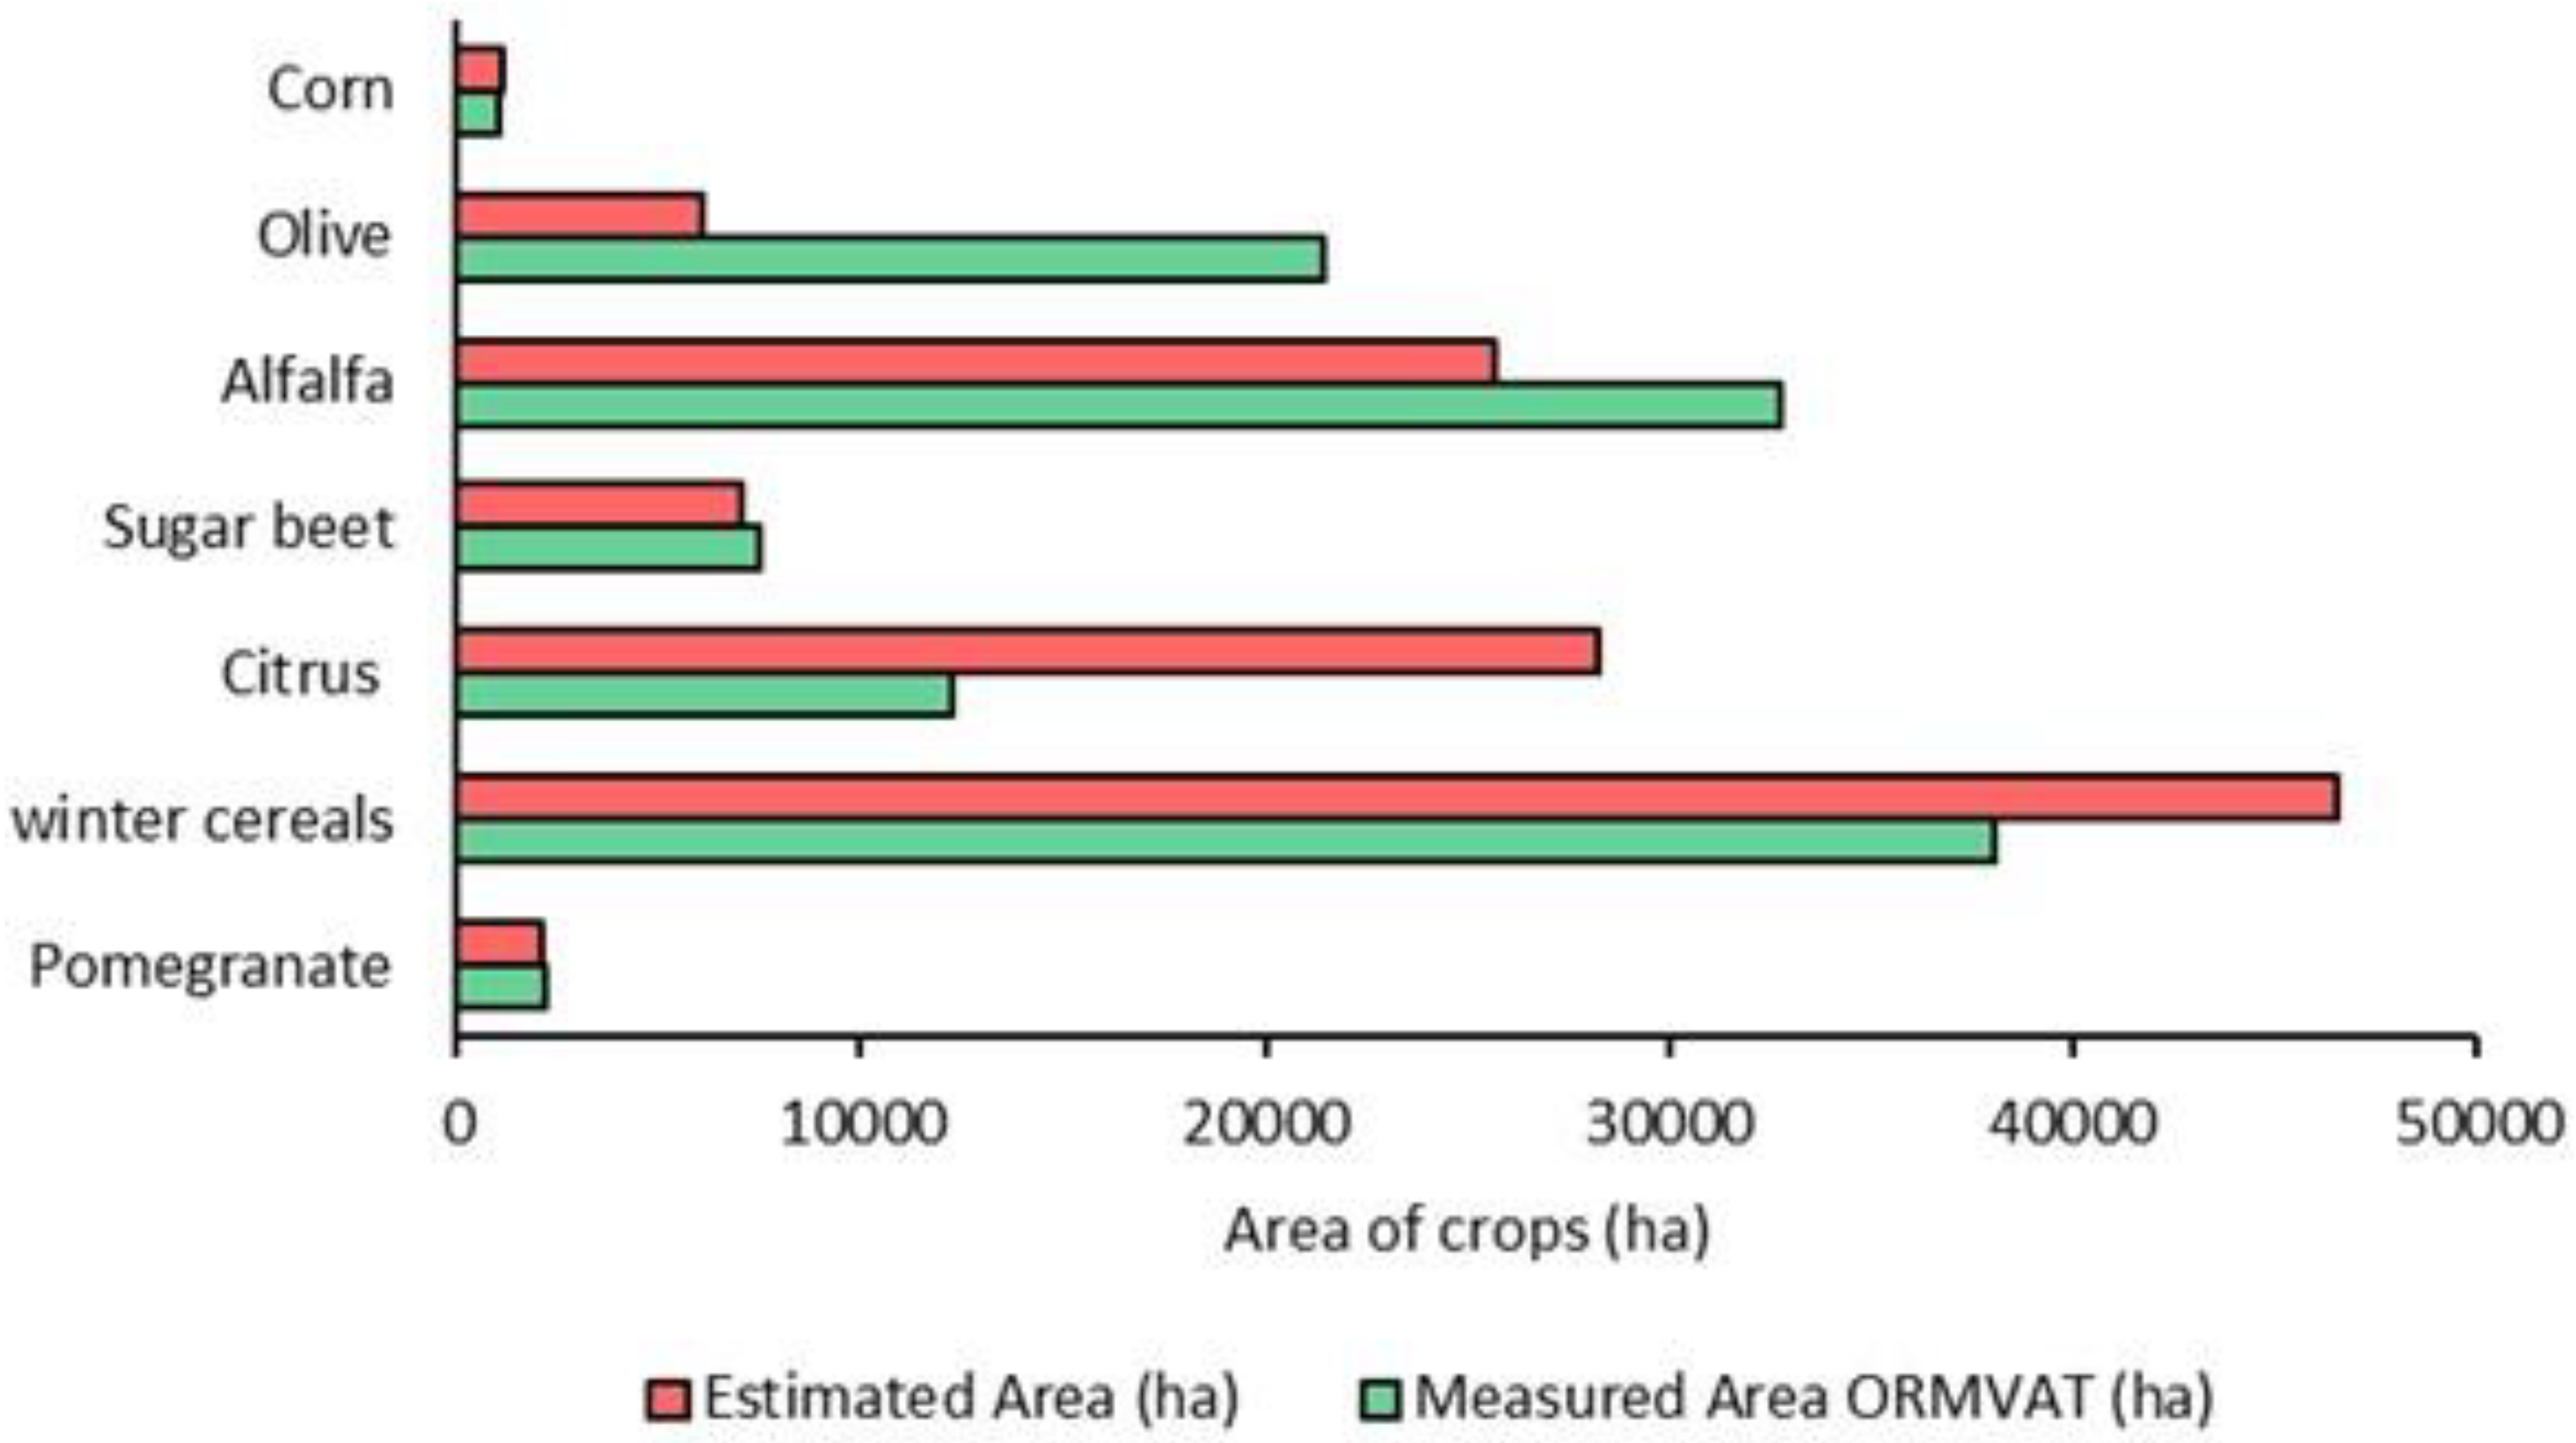
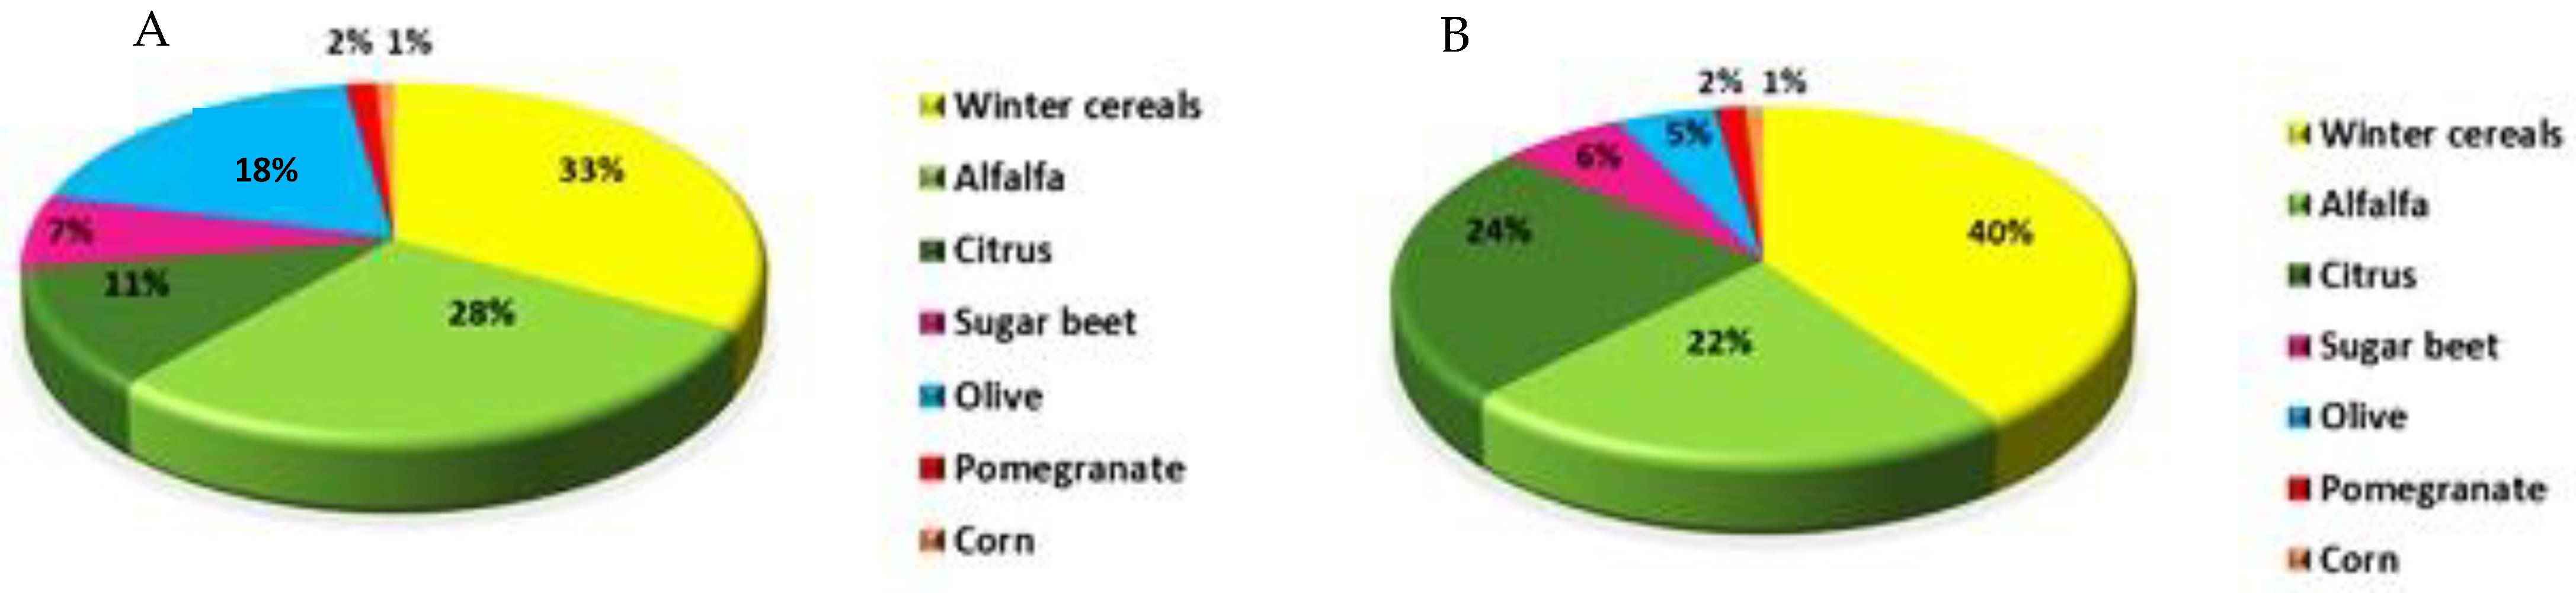
5.5. Crop Area Forecasting in the Early Season
6. Discussion
7. Conclusions
Author Contributions
Funding
Institutional Review Board Statement
Informed Consent Statement
Data Availability Statement
Acknowledgments
Conflicts of Interest
References
- Lebrini, Y.; Boudhar, A.; Hadria, R.; Lionboui, H.; Elmansouri, L.; Arrach, R.; Ceccato, P.; Benabdelouahab, T. Identifying Agricultural Systems Using SVM Classification Approach Based on Phenological Metrics in a Semi-arid Region of Morocco. Earth Syst. Environ. 2019, 3, 277–288. [Google Scholar] [CrossRef]
- Rochdane, S.; Bounoua, L.; Zhang, P.; Imhoff, M.L.; Messouli, M.; Yacoubi-Khebiza, M. Combining satellite data and models to assess vulnerability to climate change and its impact on food security in Morocco. Sustainability 2014, 6, 1729–1746. [Google Scholar] [CrossRef]
- Mancosu, N.; Snyder, R.L.; Kyriakakis, G.; Spano, D. Water scarcity and future challenges for food production. Water 2015, 7, 975–992. [Google Scholar] [CrossRef]
- Ouzemou, J.E.; El Harti, A.; Lhissou, R.; El Moujahid, A.; Bouch, N.; El Ouazzani, R.; Bachaoui, E.M.; El Ghmari, A. Crop type mapping from pansharpened Landsat 8 NDVI data: A case of a highly fragmented and intensive agricultural system. Remote Sens. Appl. Soc. Environ. 2018, 11, 94–103. [Google Scholar] [CrossRef]
- Abdelaziz, H.; Abdelghani, B.; Youssef, L.; Rachid, H.; Hayat, L.; Tarik, B. A comparative analysis of different phenological information retrieved from Sentinel-2 time series images to improve crop classification: A machine learning approach. Geocarto Int. 2020, 37, 1426–1449. [Google Scholar] [CrossRef]
- Amani, M.; Ghorbanian, A.; Ahmadi, S.A.; Kakooei, M.; Moghimi, A.; Mirmazloumi, S.M.; Moghaddam, S.H.A.; Mahdavi, S.; Ghahremanloo, M.; Parsian, S.; et al. Google Earth Engine Cloud Computing Platform for Remote Sensing Big Data Applications: A Comprehensive Review. IEEE J. Sel. Top. Appl. Earth Obs. Remote Sens. 2020, 13, 5326–5350. [Google Scholar] [CrossRef]
- Chaaou, A.; Chikhaoui, M.; Naimi, M.; Kerkour, A.; Miad, E.; Achemrk, A.; Seif-ennasr, M.; Harche, S. El Mapping soil salinity risk using the approach of soil salinity index and land cover: A case study from Tadla plain, Morocco. Arab. J. Geosci. 2022, 15, 722. [Google Scholar] [CrossRef]
- Kussul, N.; Lemoine, G.; Gallego, F.J.; Skakun, S.V.; Lavreniuk, M.; Shelestov, A.Y. Parcel-Based Crop Classification in Ukraine Using Landsat-8 Data and Sentinel-1A Data. IEEE J. Sel. Top. Appl. Earth Obs. Remote Sens. 2016, 9, 2500–2508. [Google Scholar] [CrossRef]
- Xu, L.; Zhang, H.; Wang, C.; Zhang, B.; Liu, M. Crop classification based on temporal information using Sentinel-1 SAR time-series data. Remote Sens. 2019, 11, 53. [Google Scholar] [CrossRef]
- Luo, C.; Liu, H.; Lu, L.; Liu, Z.; Kong, F.; Zhang, X. Monthly composites from Sentinel-1 and Sentinel-2 images for regional major crop mapping with Google Earth Engine. J. Integr. Agric. 2021, 20, 1944–1957. [Google Scholar] [CrossRef]
- Hernandez, I.; Benevides, P.; Costa, H.; Caetano, M. Exploring sentinel-2 for land cover and crop mapping in portugal. Int. Arch. Photogramm. Remote Sens. Spat. Inf. Sci. -ISPRS Arch. 2020, 43, 83–89. [Google Scholar] [CrossRef]
- Luo, C.; Qi, B.; Liu, H.; Guo, D.; Lu, L.; Fu, Q.; Shao, Y. Using time series sentinel-1 images for object-oriented crop classification in google earth engine. Remote Sens. 2021, 13, 561. [Google Scholar] [CrossRef]
- Xiong, J.; Thenkabail, P.S.; Gumma, M.K.; Teluguntla, P.; Poehnelt, J.; Congalton, R.G.; Yadav, K.; Thau, D. Automated cropland mapping of continental Africa using Google Earth Engine cloud computing. ISPRS J. Photogramm. Remote Sens. 2017, 126, 225–244. [Google Scholar] [CrossRef]
- Shelestov, A.; Lavreniuk, M.; Kussul, N.; Novikov, A.; Skakun, S. Exploring Google earth engine platform for big data processing: Classification of multi-temporal satellite imagery for crop mapping. Front. Earth Sci. 2017, 5, 17. [Google Scholar] [CrossRef]
- Kolli, M.K.; Pham, Q.B.; Thi, N.; Linh, T.; Hoai, P.N.; Costache, R.; Anh, D.T. spectral indices in Google Earth Engine based on random forest model Assessment of change in the extent of mangrove ecosystems using different spectral indices in Google Earth Engine based on random forest model. Arab. J. Geosci. 2022, 15, 889. [Google Scholar] [CrossRef]
- Amani, M.; Kakooei, M.; Moghimi, A.; Ghorbanian, A.; Ranjgar, B.; Mahdavi, S.; Davidson, A.; Fisette, T.; Rollin, P.; Brisco, B.; et al. Application of google earth engine cloud computing platform, sentinel imagery, and neural networks for crop mapping in Canada. Remote Sens. 2020, 12, 3561. [Google Scholar] [CrossRef]
- Van Tricht, K.; Gobin, A.; Gilliams, S.; Piccard, I. Synergistic use of radar sentinel-1 and optical sentinel-2 imagery for crop mapping: A case study for Belgium. Remote Sens. 2018, 10, 1642. [Google Scholar] [CrossRef]
- Miettinen, J.; Shi, C.; Liew, S.C. Towards automated 10–30 m resolution land cover mapping in insular South-East Asia. Geocarto Int. 2019, 34, 443–457. [Google Scholar] [CrossRef]
- Inglada, J.; Arias, M.; Sicre, C.M. Improved Early Crop Type Identification By Joint Use of High Temporal Improved Early Crop Type Identification By Joint Use of High Temporal Resolution SAR And Optical Image Time Series. Remote Sens. 2016, 8, 362. [Google Scholar] [CrossRef]
- Son, N.T.; Chen, C.F.; Chen, C.R.; Guo, H.Y. Classification of multitemporal Sentinel-2 data for field-level monitoring of rice cropping practices in Taiwan. Adv. Sp. Res. 2020, 65, 1910–1921. [Google Scholar] [CrossRef]
- Saad El Imanni, H.; El Harti, A.; El Iysaouy, L. Wheat Yield Estimation Using Remote Sensing Indices Derived from Sentinel-2 Time Series and Google Earth Engine in a Highly Fragmented and Heterogeneous Agricultural Region. Agronomy 2022, 12, 2853. [Google Scholar] [CrossRef]
- Datta, D.; Paul, M.; Murshed, M.; Teng, S.W.; Schmidtke, L. Soil Moisture, Organic Carbon, and Nitrogen Content Prediction with Hyperspectral Data Using Regression Models. Sensors 2022, 22, 7998. [Google Scholar] [CrossRef] [PubMed]
- He, Y.; Dong, J.; Liao, X.; Sun, L.; Wang, Z.; You, N.; Li, Z.; Fu, P. Examining rice distribution and cropping intensity in a mixed single- and double-cropping region in South China using all available Sentinel 1/2 images. Int. J. Appl. Earth Obs. Geoinf. 2021, 101, 102351. [Google Scholar] [CrossRef]
- Mehdaoui, R.; Anane, M. Exploitation of the red-edge bands of Sentinel 2 to improve the estimation of durum wheat yield in Grombalia region (Northeastern Tunisia). Int. J. Remote Sens. 2020, 41, 8984–9006. [Google Scholar] [CrossRef]
- Liu, Y.; Qian, J.; Yue, H. Comprehensive Evaluation of Sentinel-2 Red Edge and Shortwave-Infrared Bands to Estimate Soil Moisture. IEEE J. Sel. Top. Appl. Earth Obs. Remote Sens. 2021, 14, 7448–7465. [Google Scholar] [CrossRef]
- Swathandran, S.; Aslam, M.A.M. Assessing the role of SWIR band in detecting agricultural crop stress: A case study of Raichur district, Karnataka, India. Environ. Monit. Assess. 2019, 191, 442. [Google Scholar] [CrossRef] [PubMed]
- Azar, R.; Villa, P.; Stroppiana, D.; Crema, A.; Boschetti, M.; Brivio, P.A. Assessing in-season crop classification performance using satellite data: A test case in Northern Italy. Eur. J. Remote Sens. 2016, 49, 361–380. [Google Scholar] [CrossRef]
- Tufail, R.; Ahmad, A.; Javed, M.A.; Ahmad, S.R. A machine learning approach for accurate crop type mapping using combined SAR and optical time series data. Adv. Sp. Res. 2022, 69, 331–346. [Google Scholar] [CrossRef]
- Rao, P.; Zhou, W.; Bhattarai, N.; Srivastava, A.K.; Singh, B.; Poonia, S. Using Sentinel-1, Sentinel-2, and Planet Imagery to Map Crop Type of Smallholder Farms. Remote Sens. 2021, 13, 1870. [Google Scholar] [CrossRef]
- Schulz, D.; Yin, H.; Tischbein, B.; Verleysdonk, S.; Adamou, R.; Kumar, N. ISPRS Journal of Photogrammetry and Remote Sensing Land use mapping using Sentinel-1 and Sentinel-2 time series in a heterogeneous landscape in Niger, Sahel. ISPRS J. Photogramm. Remote Sens. 2021, 178, 97–111. [Google Scholar] [CrossRef]
- El Harti, A.; Lhissou, R.; Chokmani, K.; Ouzemou, J.E.; Hassouna, M.; Bachaoui, E.M.; El Ghmari, A. Spatiotemporal monitoring of soil salinization in irrigated Tadla Plain (Morocco) using satellite spectral indices. Int. J. Appl. Earth Obs. Geoinf. 2016, 50, 64–73. [Google Scholar] [CrossRef]
- Spoto, F.; Martimort, P.; Drusch, M. Sentinel-2: ESA’s Optical High-Resolution Mission for GMES Operational Services. Remote Sens. Environ. 2012, 120, 25–36. [Google Scholar]
- Rouse, J.H. Monitoring Vegetation Systems in the Great Plains with ERTS; NASA: Washington, DC, USA, 1973; pp. 309–317.
- Huete, A.D. Overview of the radiometric and biophysical performance of the MODIS vegetation indices. Remote Sens. Environ. 2002, 83, 195–213. [Google Scholar] [CrossRef]
- Kouadio, L.; Newlands, N.K.; Davidson, A.; Zhang, Y.; Chipanshi, A. Assessing the performance of MODIS NDVI and EVI for seasonal crop yield forecasting at the ecodistrict scale. Remote Sens. 2014, 6, 10193–10214. [Google Scholar] [CrossRef]
- Liu, H.Q.; Huete, A. Feedback based modification of the NDVI to minimize canopy background and atmospheric noise. IEEE Trans. Geosci. Remote Sens. 1995, 33, 457–465. [Google Scholar] [CrossRef]
- Mullissa, A.; Vollrath, A.; Odongo-Braun, C.; Slagter, B.; Balling, J.; Gou, Y.; Gorelick, N.; Reiche, J. Sentinel-1 SAR Backscatter Analysis Ready Data Preparation in Google Earth Engine. Remote Sens. 2021, 13, 1954. [Google Scholar] [CrossRef]
- Adam, E.; Mutanga, O.; Odindi, J.; Abdel-Rahman, E.M. Land-use/cover classification in a heterogeneous coastal landscape using RapidEye imagery: Evaluating the performance of random forest and support vector machines classifiers. Int. J. Remote Sens. 2014, 35, 3440–3458. [Google Scholar] [CrossRef]
- Breiman, L. Statistical modeling: The two cultures. Stat. Sci. 2001, 16, 199–215. [Google Scholar] [CrossRef]
- Saad El Imanni, H.; El Harti, A.; Panimboza, J. Investigating Optical and SAR data efficiency in studying the temporal behavior of wheat phenological stages using Google Earth Engine. Agriculture 2022, 40, 24–30. [Google Scholar]
- Aduvukha, G.R.; Abdel-Rahman, E.M.; Sichangi, A.W.; Makokha, G.O.; Landmann, T.; Mudereri, B.T.; Tonnang, H.E.Z.; Dubois, T. Cropping pattern mapping in an agro-natural heterogeneous landscape using sentinel-2 and sentinel-1 satellite datasets. Agriculture 2021, 11, 530. [Google Scholar] [CrossRef]
- Qadir, A.; Mondal, P. Synergistic use of radar and optical satellite data for improved monsoon cropland mapping in India. Remote Sens. 2020, 12, 522. [Google Scholar] [CrossRef]


| Classes | Number of ROIs | Area (ha) |
|---|---|---|
| Winter cereals | 229 | 336 |
| Alfalfa | 184 | 146 |
| Sugar beet | 78 | 123 |
| Corn | 22 | 195 |
| Citrus | 146 | 596 |
| Pomegranate | 27 | 248 |
| Olive | 32 | 113 |
| No crops | 18 | 979 |
| Month | Date of Acquisition Sentinel-2 (MSI) | Date of Acquisition Sentinel-1 (SAR) |
|---|---|---|
| September | 3, 5, 10, 15, 20, 25, 28 | 2, 8, 14, 20, 26 |
| October | 5, 10, 13, 25, 28 | 2, 8, 14, 20, 26 |
| November | 2, 17, 22, 24 | 1, 7, 13, 19, 25 |
| December | 2, 12, 22, 27 | 1, 7, 13, 19, 25 |
| January | 1, 16, 26, 28 | 6, 12, 18, 24 |
| February | 2, 10, 15 | 5, 11, 17, 23 |
| March | 11, 22 | 6, 12, 18, 24 |
| April | 1, 13, 23 | 5, 11, 17, 23, 29 |
| May | 6, 11, 16 | 5, 11, 17, 23, 29 |
| June | 2, 12, 20 | 4, 10, 16 |
| Index | Equation | S-2 Bands Used | Original Author |
|---|---|---|---|
| NDVI | (NIR − R)/(NIR + R) | (B8 − B4)/(B8 + B4) | [33] |
| EVI | 2.5(NIR − R)/(NIR + 6R − 7.5 × BLUE + 1) | 2.5(B8 − B4)/(B8 + 6B4 − 7.5 × B2 + 1) | [34] |
| Sept. | Oct. | Nov. | Dec. | Jen. | Feb. | Mar. | ||||||||
|---|---|---|---|---|---|---|---|---|---|---|---|---|---|---|
| OA (%) | k | OA (%) | k | OA (%) | k | OA (%) | k | OA (%) | k | OA (%) | k | OA (%) | k | |
| Experiment 1 | 68.95 | 0.57 | 70.14% | 0.61 | 72.50 | 0.63 | 70.53 | 0.60 | 63.12 | 0.51 | 68.32 | 0.57 | 71.89 | 0.62 |
| Experiment 2 | 79.37 | 0.72 | 80.01% | 0.75 | 83.58 | 0.78 | 81.82 | 0.75 | 79.26 | 0.72 | 81.67 | 0.75 | 83.89 | 0.78 |
| Experiment 3 | 79.01 | 0.71 | 79.67% | 0.72 | 82.07 | 0.76 | 80.82 | 0.74 | 78.10 | 0.70 | 80.82 | 0.74 | 82.96 | 0.77 |
| Experiment 4 | 49.10 | 0.28 | 53.80 | 0.34 | 56.64 | 0.37 | 58.32% | 0.42 | 52.67 | 0.33 | 49.27 | 0.28 | 56.96 | 0.38 |
| Experiment 5 | 80.07 | 0.73 | 83.06% | 0.77 | 84.99 | 0.79 | 84.59% | 0.79 | 82.05 | 0.75 | 85.14 | 0.78 | 86.22 | 0.81 |
| Classes | Number of Pixels | Estimated Area (ha) |
|---|---|---|
| Pomegranate | 209,388 | 2094 |
| Winter cereals | 4,656,382 | 46,564 |
| Citrus | 2,828,423 | 28,284 |
| Sugar beet | 706,455 | 7064 |
| Alfalfa | 2,566,989 | 25,670 |
| Olive | 609,967 | 6100 |
| Corn | 109,354 | 1093 |
Publisher’s Note: MDPI stays neutral with regard to jurisdictional claims in published maps and institutional affiliations. |
© 2022 by the authors. Licensee MDPI, Basel, Switzerland. This article is an open access article distributed under the terms and conditions of the Creative Commons Attribution (CC BY) license (https://creativecommons.org/licenses/by/4.0/).
Share and Cite
Saad El Imanni, H.; El Harti, A.; Hssaisoune, M.; Velastegui-Montoya, A.; Elbouzidi, A.; Addi, M.; El Iysaouy, L.; El Hachimi, J. Rapid and Automated Approach for Early Crop Mapping Using Sentinel-1 and Sentinel-2 on Google Earth Engine; A Case of a Highly Heterogeneous and Fragmented Agricultural Region. J. Imaging 2022, 8, 316. https://doi.org/10.3390/jimaging8120316
Saad El Imanni H, El Harti A, Hssaisoune M, Velastegui-Montoya A, Elbouzidi A, Addi M, El Iysaouy L, El Hachimi J. Rapid and Automated Approach for Early Crop Mapping Using Sentinel-1 and Sentinel-2 on Google Earth Engine; A Case of a Highly Heterogeneous and Fragmented Agricultural Region. Journal of Imaging. 2022; 8(12):316. https://doi.org/10.3390/jimaging8120316
Chicago/Turabian StyleSaad El Imanni, Hajar, Abderrazak El Harti, Mohammed Hssaisoune, Andrés Velastegui-Montoya, Amine Elbouzidi, Mohamed Addi, Lahcen El Iysaouy, and Jaouad El Hachimi. 2022. "Rapid and Automated Approach for Early Crop Mapping Using Sentinel-1 and Sentinel-2 on Google Earth Engine; A Case of a Highly Heterogeneous and Fragmented Agricultural Region" Journal of Imaging 8, no. 12: 316. https://doi.org/10.3390/jimaging8120316
APA StyleSaad El Imanni, H., El Harti, A., Hssaisoune, M., Velastegui-Montoya, A., Elbouzidi, A., Addi, M., El Iysaouy, L., & El Hachimi, J. (2022). Rapid and Automated Approach for Early Crop Mapping Using Sentinel-1 and Sentinel-2 on Google Earth Engine; A Case of a Highly Heterogeneous and Fragmented Agricultural Region. Journal of Imaging, 8(12), 316. https://doi.org/10.3390/jimaging8120316