Abstract
Granular films SiO2(Co) exhibit unusual magnetic and magnetotransport properties which are strongly dependent on the composition of the film and material of a substrate. For example, the injection magnetoresistance (IMR) coefficient reaches a giant (GIMR) value of 105% at room temperature in SiO2(Co) films on an n-GaAs substrate. However, the IMR effect is negligible in the case of a similar granular film deposited on the n-Si substrate. In this report, the structural and magnetic properties of granular film SiO2(Co) on Si substrate are studied with the aim to understand the cause of the difference in IMR coefficients for SiO2(Co) thin film deposited on n-GaAs and on n-Si substrates. Investigations were carried out using complementary methods of Polarized Neutron Reflectometry, Grazing Incidence Small-Angle X-ray Scattering, X-ray Reflectometry, Scanning Electron Microscope, and SQUID magnetometry. It is shown that the interface layer between the granular film and Si substrate exhibits metallic rather than magnetic properties and eliminates the GIMR effect. This interface layer is associated with the Si diffusion to Co nanoparticles and the formation of the metallic cobalt silicides.
Keywords:
granular film; nanoparticles; grazing-incidence small-angle X-ray scattering; polarized neutron reflectometry PACS:
75.70.Cn; 75.75.–c; 75.50.Lk
1. Introduction
Granular films (GFs) are nanocomposites that consist of metallic magnetic nanoparticles incorporated in an insulating matrix. GFs with a very well-controlled nanostructure have promising technological applications in microwave devices, spintronics, medicine and biology [1,2,3,4,5,6,7]. Structural investigations of GFs play a crucial role and often facilitates the interpretation of their electrical and magnetic properties as well as their interconnection. A complex interplay of intrinsic properties can be caught through their structural features also accounting for finite-size effects, size distribution, surface effects, and nanoparticle interactions.
The effect of giant injection magnetoresistance (GIMR) has been observed in the GFs SiO2(x at.% Co) deposited on GaAs substrate [8,9]. The GIMR phenomenon is a magnetic-field-induced suppression of the spin-polarized electron current from the GF into the semiconductor substrate. The IMR coefficient has maximum values for structures with Co concentrations in the range 54 ÷ 75 at.%. In the case of the opposite current direction (electrons drift from the semiconductor into the granular film) the magnetoresistance effect becomes less pronounced. The GIMR coefficient reaches 10 % in a narrow temperature range 240 K < T < 300 K at the magnetic field of H = 10 kOe applied in the sample plane and at the voltage U = 70 V applied perpendicular to the sample plane.
The extreme value of this effect at room temperature and the possibility of controlling the resistivity of heterostructure by varying the magnetic field could be used in the development of spintronic devices such as spin injectors, spin diodes, and transistors. Unlike crystalline silicon, the gallium arsenide substrate has a number of disadvantages in practical use: it is mechanically fragile and thermally unstable above 600 °C due to As evaporation, which imposes restrictions on the synthesis technology. The use of silicon substrates would eliminate these problems and provide additional advantages, such as its intrinsic carrier concentration being ni = 1.02 × 10 cm−3 and the energy gap being Eg = 1.12 eV (compared to GaAs − ni = 2.1 × 10 cm−3 and E = 1.43 eV, respectively). However, while the GIMR effect reaches 10 % in the case of the GF deposited on GaAs substrate, the GIMR is negligible in the case of a similar granular film deposited on n-Si substrate [8], and the intrinsic magnetoresistance of SiO2(x at.% Co)/Si films has even negative values. In the present work we studied Au/SiO2(Co x at.%)/Si heterostructures with cobalt content of x = 54, 60, 70, 75, 82 at.%. The aim of the study is to investigate the structural features and the associated magnetic properties of the heterostructures Au/GF/Si and to reveal the role of Si substrate in the negligible GIMR effect. For this purpose, we used the Polarized Neutron Reflectometry (PNR) technique, which we combined with complementary techniques of Grazing Incidence Small Angle X-ray Scattering (GISAXS), X-ray Reflectometry (XRR), Scanning Electron Microscope (SEM), and Superconducting Quantum Interference Device Magnetometry (SQUID).
The paper is organized in the following way. Section 2 gives details of the sample preparation and experimental results obtained via different methods to reveal structural and magnetic properties. Section 3 provides a discussion and interpretation of the results combined. A combination of different methods makes it possible to build a model explaining the negligible value of the GIMR effect, providing that almost all structural and magnetic properties of GF are practically the same for the films disposed on GaAs and Si substrates. It is shown that the interface layer between the GF and Si substrate shows metallic rather than magnetic properties and eliminates the GIMR effect. This interface layer is associated with the Si diffusion to Co nanoparticles and the formation of metallic cobalt silicides. Section 4 is the conclusion.
2. Experiment
2.1. Sample Preparation
The granular films SiO2(x at.% Co) were synthesized by ion beam co-sputtering [10,11] of the composite cobalt-quartz target on the commercial n-Si substrate heated to 200 °C and misoriented by 2 degrees from (100) plane to (110) plane and with the thickness of 0.4 mm. The resistivity of the Si substrate was measured by the dc four-probe method at room temperature and was equal to 3.7 ·cm. The concentration of cobalt nanoparticles in SiO2 was set by the ratio of cobalt and quartz target areas. The film was capped by 2 nm of the gold layer as a conductive contact for magnetoresistance measurements. The sputtering method and choice of components are described in ref. [12]. A detailed description of the characteristics of granular films is given in ref. [8].
The granular films SiO2(x at.% Co) can be differentiated by their conductivity into three classes depending on the Co concentration.
- (1)
- Class of GFs (SiO2(x at.% Co), at x < 40 at.%) shows dielectric properties since isolated metal particles are dispersed in a dielectric continuum.
- (2)
- Class of GFs (SiO2(x at.% Co), at 40 at.% ≤ x ≤ 85 at.%) demonstrates semiconductor-like (intermediate) properties as metal particles with an increase in x become interconnected to form a maze structure. The electrical conductivity in this regime is due to percolation along the metallic maze and electron tunneling between isolated metal particles. The concentration of Co x ≈ 40 at.% is a percolation threshold, below which only the tunneling process contributes to the conductivity of the granular metal.
- (3)
- Class of GFs (SiO2(x at.% Co), at x > 85 at.%) can be attributed to metals as the volume fraction of the metal x is large, metal grains merge and form a metallic continuum with dielectric inclusions.
For this study, the granular films SiO2 (x at.% Co) with Co concentrations of x = 54, 60, 70, 75, 82 at.% deposited on Si substrate were chosen. A total of 5 batches of SiO2 (x at.% Co)/Si heterostructures with the same concentrations were synthesized and studied to ensure the repeatability of synthesis results. Figure 1 demonstrates SEM images for SiO2 (54 at.% Co)/Si (a), and for SiO2 (82 at.% Co)/Si (b). Field Emission SEM (FE-SEM) Zeiss Leo 1530 capable of 2.5 nanometer resolution equipped with an In-Lens secondary electron detector has been used. The average size of cobalt nanoparticles has been obtained from a set of linear measurements using ImageJ software and equals about 75 ± 15 Å. The microscope achieves a resolution of approx. 1 nm.

Figure 1.
SiO2(54 at.% Co)/Si (a) and SiO2(82 at.% Co)/Si (b) images in the secondary electron mode with the InLens detector, mounted above the films. Light contrast corresponds to the SiO2 matrix and dark areas correspond to Co inclusions.
2.2. Grazing Incidence Small Angle X-ray Scattering and X-ray Reflectometry
The Grazing Incidence Small Angle X-ray Scattering (GISAXS) and X-ray Reflectometry (XRR) experiments were carried out at ID10 beamline of European Synchrotron Radiation Facility (ESRF, Grenoble, France) [13]. The geometry of the GISAXS (Figure 2) is described by the grazing incidence angle and two scattering angles (out of sample plane) and (in-plane). Information on the electron density distribution in the z direction is obtained by measuring the scattering intensity as a function of the momentum transfer component Qz perpendicular to the sample plane. Meanwhile, the lateral structure of the granular film, its surface and its interface with the silicon substrate can be studied by measuring intensity as a function of the component Qy lying in the sample plane. A detailed description of the theory and methodology of the GISAXS technique can be found in the review [14,15,16]. The GISAXS experiment with the GF SiO2(x at.% Co) on GaAs substrate can be found in [17]. The collimated X-ray beam of the size 1 × 0.1 mm2 and wavelength = 0.95 Å, impinging the sample surface at the grazing angle = 0.32°, was used for the GISAXS experiment. The scattering patterns were recorded with the two-dimensional position-sensitive detector MARCCD-133. The central part of the detector was protected from high-intensity direct and specular beams by a lead absorber.
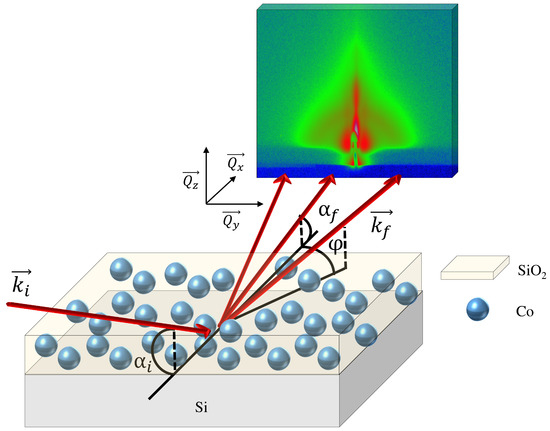
Figure 2.
Geometry of the GISAXS experiment: and are the wave vectors of the incident and scattered beams, respectively; , and angles determine the momentum transfer components Qx, Qy, Qz.
The two-dimensional GISAXS intensity maps from the samples Au/GF/Si are shown in Figure 3a–c. Several features can be distinguished. Firstly, the presence of a broad elliptic diffuse halo whose intensity is increased at = = 0.25° (where is the critical angle of the Total External Reflection) due to the Yoneda anomalous scattering and has zero intensity at = 0, i.e., below the sample horizon. This broad elliptic diffuse halo is a typical manifestation of scattering from an isotropic three-dimensional system of scatterers (cobalt nanoparticles) located at a distance from each other, where Q1 expressed in momentum transfer units is the radius of the diffuse halo.
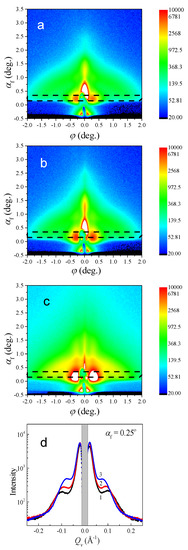
Figure 3.
(a) The two-dimensional GISAXS intensity maps from the samples SiO2(38 at.% Co)/Si (a), SiO2(54 at.% Co)/Si (b), and SiO2(82 at.% Co)/Si (c). The dashed horizontal lines indicate the integration regions for the one-dimensional profiles shown on (d) panel. (d) The scattering intensity profiles along direction at = 0.25° for SiO2(38 at.% Co)/Si—curve 1, SiO2(54 at.% Co)/Si—curve 2, and SiO2(82 at.% Co)/Si—curve 3. The gray area corresponds to the beamstop shadow.
The second feature of the scattering pattern is the presence of two symmetrical peaks at angles = ±0.29°. Such peaks correspond to the scattering from the nanoparticles spatially arranged within the monolayer at the interface with the substrate [14,15,16,18]. By taking the peaks coordinate Q2 it is easy to calculate the average interparticle distance at the interface: = 2/Q2. To determine both and distances the cuts along direction of the two-dimensional intensity maps at = 0.25° were taken (Figure 3d).
In XRR experiments, the intensity of X-rays scattered in the direction = and = 0 was measured as a function of the incidence angle . The measurements were performed with a 1 × 0.1 mm2 beam with a wavelength of 1.56 Å. To detect the reflected beam, we used an mBraun-50M linear position-sensitive detector, which made it possible not only to measure the desired signal but also to simultaneously determine the background, which was then subtracted. The specular reflection curve R(Qz) thus obtained is related to the one-dimensional in-depth distribution of the electron density of the sample using the Parratt method [19]. The results of the XRR experiment are presented in Figure 4, where the intensity of the reflected beam is shown as a function of the momentum transfer for Au/SiO2(60 at.% Co)/Si and Au/SiO2(82 at.% Co)/Si.

Figure 4.
Synchrotron X-ray reflectometry from Au/SiO2 (60 at.% Co)/Si (a) and Au/SiO2 (82 at.% Co)/Si (b) heterostructures. The gray points are experimental data, the solid line is the theoretical curve corresponding to the model of the electron-density distribution shown in the inset with the indication of electron densities plotted for the pure components of the sample.
The experimental reflectivity data shows clear maxima with oscillating intensity (Kiessig fringes) caused by the finite thickness of the film. The experimental curves (Figure 4) are sufficiently well reproduced by the model containing two layers on a substrate Si. The parameters of the model include the depth profile of the electron scattering length density (SLDX-rays), layer thickness (d) and interface (or surface) roughness (). The first layer corresponds to the technical layer of gold, the second layer corresponds to the granular SiO2(x at.%Co) film with a thickness of 450 Å. The fitting parameters for each layer adjusted to minimize the value of reduced —a weighted measure of goodness of fit are presented in Table 1. The absence of fast oscillations corresponding to the total thickness of the bilayer Au/GF cannot be explained by the insufficient resolution of the instrument. Measurements were taken at a step of 0.02 degrees (50 steps/1 degree). This is enough to resolve a film with a thickness of about 450 Å (the oscillation period from 450 Å is 0.1 degrees). The reduction in the oscillation amplitude can be attributed to the interface roughness or, rather, to smeared SLDX-rays contrast (a contrast of the electron density) between a granular film and a substrate.

Table 1.
Parameters of the model used to approximate the experimental X-ray reflectometry curves.
2.3. Polarized Neutron Reflectometry
A detailed description of the polarized neutron reflectometry technique can be found elsewhere [20]. The experiment was carried out at the SuperADAM reflectometer at Institut Laue-Langevin (Grenoble, France) [21,22,23]. Typical geometry of the PNR experiment is shown in Figure 5.
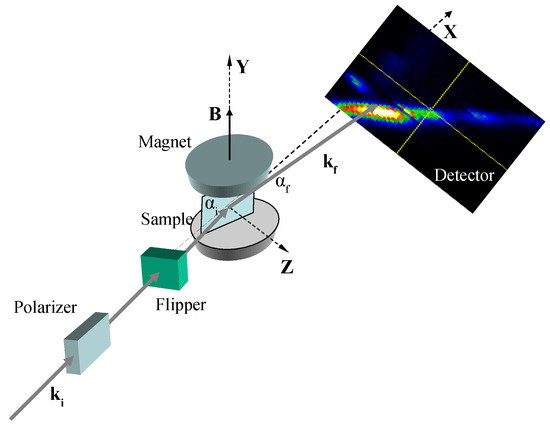
Figure 5.
Typical geometry of the polarized neutron reflectometry experiment.
We exploited a neutron beam with the wavelength = 4.41 Å and the initial polarization P0 = 0.98. The lateral components of neutron momentum transfer Qx and Qy were equal to zero, and the vertical component Qz was equal to , where is the angle of the scattered beam with wave vector . Intensities of the reflected beams with initial polarization + and , i.e., along and against the direction of the external magnetic field , were measured one by one. The magnetic field from 0 to 320 mT was applied parallel to the film surface and perpendicular to the incident neutron beam with wave vector . The direction of with respect to was switched by a spin Flipper. Specularly reflected neutrons were detected by the 3He position-sensitive detector. Measurements were performed at temperatures, where the GIMR effect is not detected (T = 120 K), reaches its maximum (T = 300 K) and again is not detected (T = 420 K) [8]. The data for every temperature were taken after the demagnetization process. No difference between reflectivity curves R(Qz, +) and R(Qz, ) was observed at B = 0 mT, while the application of the external field resulted in a pronounced splitting of two components (Figure 6).
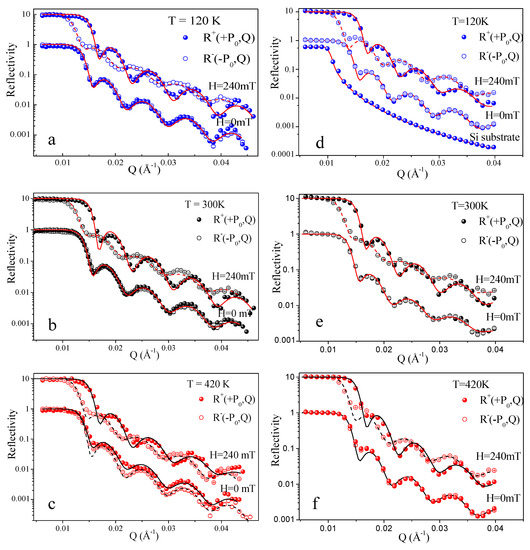
Figure 6.
The experimental (symbols) and fitted model (lines) reflectivity curves for the samples Au/SiO2(60 at.% Co)/Si (a–c) and Au/SiO2(70 at.% Co)/Si (d–f) at fields B = 0 and B = 240 mT for T = 120 K (a,d), 300 K (b,e), and 420 K (c,f). Measured and fitted model curves at B = 240 mT are multiplied by 10 for convenience.
For fitting the Polarized Neutron Reflectometry experimental data the Parratt algorithm was used [19]. The following parameters were included in the fitting routine: the beam width, the sample length, the resolution, the background and the detector offset. The scattering length density (SLD) profile (Figure 7) represents the distribution of the scattering potential of the sample into the depth of the film (in Z direction Figure 5). The results for all studied samples are shown to coincide qualitatively with insignificant numerical variations associated with the concentration of cobalt in the granular film (Figure 7). All PNR curves at different temperatures and were fitted with the same structural parameters: thickness (d), roughness (), and nuclear scattering length density (Nn). The magnetic scattering length density (Nm), which depends on the applied magnetic field, varied in the corresponding datasets (Table 2 and Table 3).
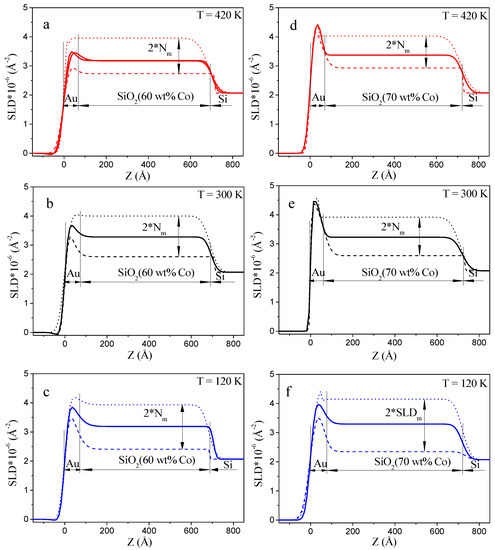
Figure 7.
The SLD profiles (dot line) and (dashed line) of the samples Au/SiO2 (60 at.% Co)/Si (a–c) and Au/SiO2 (70 at.% Co)/Si (d–f) at B = 240 mT for T = 420 K (a,c), 300 K (b,e), and 120 K (c,f). The solid line corresponds to the SLD profile at H = 0 T for every polarization of neutrons.

Table 2.
Parameters of the model used to approximate the PNR curves for Au/SiO2 (60 at.% Co)/Si.

Table 3.
Parameters of the model used to approximate the PNR curves for Au/SiO2 (70 at.% Co)/Si.
From Figure 7, it is clear that a good quantitative agreement between model calculations and experimental data has been achieved. The difference in the granular film thickness, d, defined by PNR and XRR methods is related to different batches of samples.
2.4. SQUID Magnetometry
Static magnetic properties of the samples were characterized by SQUID magnetometry (Quantum Design MPMS-5S) at the Institute of Condensed Matter Physics (Braunschweig, Germany). The magnetization curves M(H) were recorded up to 5 T. The magnetic field was applied parallel to the plane of the film. As an example, M(H) of the sample SiO2 (75 at.% Co)/Si taken at T = 200 K and 300 K are shown in Figure 8 after subtraction of the diamagnetic contribution of the Si substrate and the SiO2 matrix. A shift of the magnetic hysteresis loops along the field axis and a change of the coercive field as a function of temperature are observed. (insert (a) in Figure 8). In the fields region of 0.8 ÷ 1.8 T there are specific hysteresis loops—”pockets" (inserts (b,c) in Figure 8).
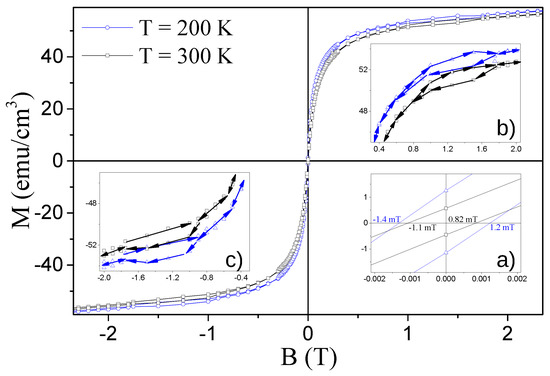
Figure 8.
Magnetic field dependence of the SiO2 (75 at.% Co)/Si sample magnetization at magnetic field from −5 T to 5 T. Inserts: (a)—region of the coercive fields, (b,c)—regions of the specific hysteresis loops.
The actual magnetic saturation value of the films is quite difficult to detect using SQUID techniques because the overall high-field signal includes the dominant diamagnetic contribution of the substrate, appearing due to its relatively large volume. If the granular film itself shows a small linear response in the high field regions, this is convoluted with an overwhelming diamagnetic signal and it is challenging to reliably subtract the latter contribution in order to separate the magnetic properties of the nanolayer itself. The saturation magnetization value of the SiO2(Co) film obtained by SQUID magnetometry (Figure 8) M 60 emu/cm3 differs significantly from the saturation magnetization of bulk cobalt M = 1422 emu/cm3.
3. Discussion
The GISAXS data from the samples Au/GF/Si has clearly shown two nanoparticle subsystems in GFs with different average interparticle distances and (Figure 3). The interparticle distance for the first subsystem increases with the increasing cobalt concentration: 64 ± 2 Å for SiO2 (38 at.% Co)/Si, 70 ± 2 Å for SiO2(54 at.% Co)/Si, and 88 ± 2 Å for SiO2 (82 at.% Co)/Si (Figure 3d). It is clear that the determined interparticle distance for these concentrations of Co should be equal to the size of nanoparticles because of the percolation limit. As one can see, the value of obtained by GISAXS is in good agreement with the particle size observed by SEM on the top surface of the GF, where percolation is clearly visible (Figure 1).
In contrast, the second subsystem with a characteristic distance = 300 nm is not revealed by SEM measurements. This is due to the fact that it is most likely located at the burred GF/Si interface. A similar structure containing two subsystems of nanoparticles in the granular films SiO2 (x at% Co) deposited on GaAs substrate was observed in [17,24]. There it was shown that the specific interface layer of cobalt nanoparticles is formed between the GF and GaAs substrate with an in-plane interparticle distance ∼ 320 Å and the thickness ∼70 Å [17,24].
The formation of such a specific layer on the GF/Semiconductor interface may be caused by a number of reasons. The deposition of cobalt on a substrate at the initial stage leads to the clustering of a thin cobalt film due to the dynamics of Co on Si, or GaAs [25,26,27,28]. The activation energy for clustering was found to be 0.3 ± 0.2 eV [25], indicating that a Co surface diffusion process dominates the kinetics. The surface energy of cobalt is about 2500–2900 erg/cm2, while the surface energy of silicon corresponds to 1230 erg/cm2 for the (111) plane, 1510 erg/cm2 for the (110) plane, and 2130 erg/cm2 for the plane (100). The surface energy of GaAs is 860 erg/cm2 [29,30]. Another reason for the formation of a specific layer at the interface is presumably related to the process of heteroepitaxial growth of the GF by ion beam co-sputtering directly onto a semiconductor substrate, while the next layers are grown in the homoepitaxial regime [31].
However, the X-ray and Polarized neutron reflectometry data (Figure 4, Figure 6 and Figure 7) do not confirm the coexistence of two nanoparticle subsystems in GFs, or they are not sensitive enough to the existence of a specific layer at the GF/Semiconductor interface in SiO2 (x at.% Co)/Si samples. In contrast to the GISAXS results, the film model which fits the XRR and PNR data in the best way consists of only two layers on the Si substrate: a granular film layer and the capping Au layer, i.e., there is no specific layer on the GF/Semiconductor interface. Why do the PNR method, which is highly sensitive to changes in magnetic properties, and the XRR method, which is highly sensitive to changes in electron density contrast, fail to detect an interface layer?
The next question deals with the study and interpretation of the magnetic properties of the granular films. The magnetic scattering length density Nm has the opposite sign for neutrons with initial polarization + and (along and against ) and its value is directly proportional to the magnetization component parallel to :
where mn and are the mass and magnetic moment of the neutron. Comparing SLD profiles = Nn + Nm and = Nn − Nm corresponding to R(Qz, +) and R(Qz, ), respectively, one can obtain a value of the magnetization in every layer forming the sample film.
From the non-zero values of Nm at the SLD profiles (Figure 7) one can conclude that only GF is magnetized under the applied field and tends to saturate the magnetic moment at B ≥ 300 mT. Magnetizations of the GF in SiO2(60 at.% Co)/Si and SiO2 (70 at.% Co)/Si samples calculated from Nm according to Equation (1) are presented in Figure 9 as a function of the applied magnetic field for T = 120, 300 and 420 K. In Figure 9, the magnetic SLD Nm is normalized to magnetic SLD of bulk cobalt (Co) = 4.24 × 10⁻⁶ Å−2. From Figure 9, it follows that the GF is in the ferromagnetic state at all three temperatures. Its magnetization decreases with increasing temperature: at the maximum applied field B = 320 mT we found that Nm/Nm(Co) = 0.21 at T = 120 K while decreasing down to 0.17 at T = 300 K and to 0.14 at T = 420 K for SiO2 (60 at.% Co) and decreasing down to 0.14 at T = 300 K and to 0.09 at T = 420 K for SiO2 (70 at.% Co). Why is the magnetization, determined by the PNR method so much smaller than the magnetization of bulk Co? It is smaller by a factor of 5 to 10 at different temperatures.
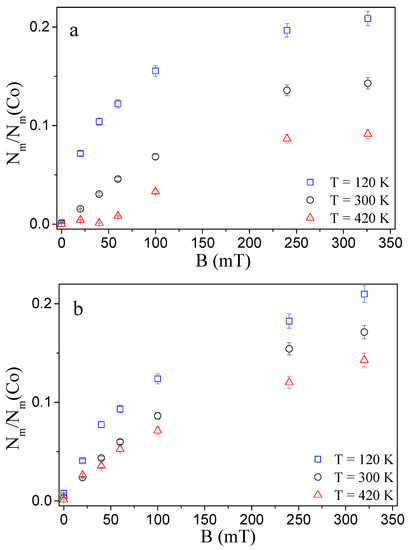
Figure 9.
Magnetic field dependence of fitted magnetic SLD value Nm normalized to magnetic SLD of bulk cobalt Nm(Co) for the ferromagnetic films SiO2 (70 at.% Co) (a) and SiO2 (60 at.% Co) (b).
Let us analyze the nuclear scattering length densities of neutrons and X-rays for all samples in order to answer these questions. The fit parameters in PNR and XRR models show excellent agreement between the measured and expected nuclear SLD values of Si (2.073 × 10⁻⁶Å−2 and 2.024 × 10⁻⁵Å−2, respectively). The fits of the nuclear SLD values of Au in the PNR and the XRR experiments are slightly lower than the expected bulk values (4.5 × 10⁻⁶Å−2 and 12.47 × 10⁻⁵Å−2, respectively). The reason could be the discontinuous layer of gold since its thickness is below 50 Å. A number of studies demonstrate changes in the physical and chemical properties of thin gold films associated with their island structure [32,33,34].
The measured nuclear SLD of the GF layer is substantially higher for neutrons and lower for X-rays as compared to expected values (Table 1, Table 2, Table 3 and Table 4). Table 4 shows the calculated Nn and SLDX-rays values for a given ratio of Co/SiO2 in GF under the assumption that cobalt can interact with oxygen from the silicon oxide dielectric matrix or oxidize in air. Unfortunately, there is no reliable way to determine the thickness of the oxide layer on the surface of cobalt nanoparticles in the present study. It is obvious that the cobalt grains must be partially oxidized for the nuclear SLD to be higher for neutrons0 or lower for X-rays, compared to the values for a given ratio of Co/SiO2 in GF. All cobalt oxides are antiferromagnets, in contrast to pure cobalt (Table 5). Magnetization measurements (Figure 8) reveal that for SiO2(x at.%Co)/Si heterostructures exchange biasing of the magnetic hysteresis loop along the field axis is observed. The exchange bias describes a phenomenon associated with interfacial coupling between ferromagnetic and antiferromagnetic materials [35]. In our investigation, the exchange biasing of the magnetic hysteresis loop confirms the oxidation of cobalt nanoparticles. The exchange biasing field, like the coercive field, changes as a function of temperature and is about 10 percent of the coercive field (insert (a) in Figure 8).

Table 4.
The calculated Nn and SLDX-rays values for a given ratio of Co/SiO2 in GF under the assumption that cobalt can be oxidized.

Table 5.
The calculated Nn and SLDX-rays values are given with Density (D), Molecular weight (MW) and Number of molecules per Å3 (n) for compounds (Comp) that may be formed in the granular film, or at the interfaces.
Another small but well-distinguished feature of the magnetization curve is the small hysteretic pockets in the field range from 0.8 to 1.6 T. They are well-detected both in the positive and negative halves of the magnetization curve. They were also detected for GF on the GaAs substrate [36]. An interesting feature of this hysteresis loop is counterintuitive large values of the magnetization when the field increases and smaller magnetization values when the field decreases. This feature can be referred to as the same biasing phenomenon of the Co (ferromagnetic) particles with the oxidized (antiferromagnetic) surface, to the so-called "core-shell" model. In this case, the magnetization of the Co particle is responsible for the large ferromagnetic response of the GF system, while the antiferromagnetic shell may show a spin flop in a certain field range, which may be energetically more favorable than the collinear spin arrangement. Considering its really small (4% only) contribution imposed on the top of the magnetization curve, we point out the biased (ferro-antiferro) magnetic nature of this phenomenon but do not go into any further details.
Figure 10 demonstrates the neutron spin asymmetry calculated by:
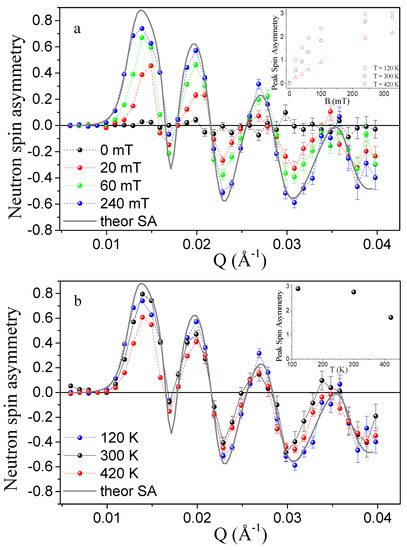
Figure 10.
The neutron spin asymmetry, SA, for Au/SiO2 (70 at.% Co)/Si fitted (gray line) to the chemical and magnetic model previously described in the text (Figure 7): (a)—under applied magnetic fields up to 320 mT, (b)—for different temperatures at B = 240 mT. Insert in panel (a)—the field-dependence of the integral intensity of the peak spin asymmetry for different temperatures. Insert in panel (b)—the temperature dependence of the integral intensity of the peak spin asymmetry at B = 240 mT. For clarity, data for (a) at B = 40, 100, and 320 mT are omitted.
As the neutron spin asymmetry is a very reliable method to study the intrinsic nanomagnetic features [37,38], it provides direct evidence that these magnetic properties originate from the composite thin film region and the substrate and surface play no detectable role. The spin asymmetry is purely related to the local magnetic moment in the sample and characterizes the in-depth distribution of the magnetization in GF directly. The observed peak SA occurs at Qz = 0.0136 ± 0.004 Å−1 and exceeds 80% (Figure 10a), which competes with that of standard magnetic alloys [39] and is large compared to the spin asymmetries typical of dilute magnetic systems [40]. The magnetic moment of the sample proportional to the SA peak area increases with the applied external field and saturates at the experimental field of 240 ÷ 320 mT (insert in Figure 10a). In contrast to SQUID magnetometry, PNR is unaffected by complications of diamagnetic or weak paramagnetic responses because they produce very low magnetizations per volume. Instead, the PNR signal is dominated by scattering effects from large local net magnetization, typically caused by a well-aligned collinear spin structure. Consequently, the small value of the neutron spin asymmetry at low fields (insert in Figure 10a) confirms the traits noted in the hysteresis from the SQUID data (Figure 8)—a low remanence and a low coercive field (Bc < 1.4 mT) which are attributed to either superparamagnetic behavior or a wandering anisotropy axis. This shows that, without a sufficient applied field, the magnetic moments in GF do not stay well aligned in any specific direction. The possible reason for this is that there are inhomogeneous magnetically ordered patches in the GF layer that experience a distribution of local spin anisotropies and consequently have a distribution of magnetization angles that are only co-aligned in a magnetic field and relax under zero field. In addition, the magnetic moment in GF changes moderately with temperature (insert in Figure 10b), indicating a strong magnetic exchange coupling.
As it is shown in Figure 10, the SA changes its sign upon the increase in the momentum transfer Qz. We interpret this observation as the presence of the "magnetically dead" layer in the GF at its interface with the Si substrate. The thickness of this layer is difficult to determine exactly, but it should be of the order of (1/10) of the thickness of the granular film itself. A similar effect of the magnetically dead layers in the PNR was observed in the multilayered structures (see, for example, [41,42].)
Based on the above, it should be assumed that the oxidation of cobalt nanoparticles is the reason for such a low magnetization value of the granular film with cobalt concentrations from 54 at.% to 82 at.% compared to pure cobalt. The same difference of the magnetic SLD value normalized to magnetic SLD of bulk cobalt was observed for GF deposited on GaAs substrate in [43].
The answer to the question of why the highly sensitive PNR and XRR methods fail to detect an interface layer between GF and Si substrate will also allow us to answer the main question of this article: what is the reason for the dramatic difference in IMR coefficients for identical SiO2(x at.% Co) granular films deposited on GaAs, or Si substrates.
It was noted above that Co due to the higher surface free energy as compared to Si would tend to grow as islands at the beginning of the deposition. The phase composition and magnetic properties of cobalt films deposited on the silicon substrate were studied in [36]. It was shown that as the film thickness increases, an interface cobalt silicide and an island film of a solid solution of silicon in cobalt are successively formed. The growth of metallic cobalt begins only after the deposition of a Co layer with a thickness of more than 7 Å. The calculated Nn values are given in Table 5 for chemical compounds that may be formed in the granular film, or at the interfaces due to boundary interlayer diffusion leading to the formation of an interface of variable binary composition—cobalt silicides. Table 5 shows that cobalt silicides and cobalt oxides have similar SLDX-rays values, which does not allow the GF and an additional interface layer to be distinguished in the Z direction (Figure 2) by XRR experiments. Wherein in the Y direction (Figure 2), an additional interface layer with large periodicity = 300 ± 10 Å is detectable by GISAXS due to the high contrast of SLDX-rays between the multiphase cobalt granules and the SiO2. Thus, both the XRR and PNR experimental results are well described by the model of a uniform granular cobalt film with a noticeably oxidized surface of the granules and a high surface roughness at the interface with the silicon substrate.
Increasing the silicon concentration to 30% in the Co-Si solid solution makes the large cobalt granules practically non-magnetic due to the charge transfer effect. Moreover, due to the formation of cobalt silicide at the GF/Si interface, the conductivity of the granular film will be determined by the chains "granule (Co)-metal (Co-Si)-semiconductor (Si)", and not by electron tunneling between ferromagnetic granules through the SiO2 dielectric matrix into the Si semiconductor. This leads to a strong decrease in the magnetoresistive coefficient to a few percent in SiO2 (x at.% Co) heterostructures on a Si substrate compared to the really giant IMR value in SiO2 (71 at.% Co) on a GaAs substrate [8].
4. Conclusions
In the present paper, we studied the structure and magnetic properties of the maze structure with interconnected cobalt particles SiO2 (x at.% Co) deposited on Si substrate at 54 at.% ≤ x ≤ 82 at.%). Investigations were carried out using Polarized Neutron Reflectometry, Grazing Incidence Small Angle X-ray Scattering, X-ray Reflectometry, Scanning Electron Microscopy, and Superconducting Quantum Interference Device Magnetometry.
The reason for the dramatic difference in IMR coefficients for SiO2 (x at.% Co) heterostructures deposited on GaAs or Si substrates was established. Despite the fact that both granular films have very similar values for thickness, interparticle distances, and magnetizations, as well as the additional layer of Co at the interface granular film/substrate, there is a difference in the interface morphology for SiO2 (x at.% Co)/Si. On the interface granular film/Si substrate there is boundary interlayer diffusion of Si atoms into Co, leading to the formation of an interface of variable binary composition - cobalt silicides. The formation of cobalt silicide at the GF/Si interface leads to the conductivity of the granular film determined by the electron movement via chains "ferromagnetic granule (Co)-metal (Co-Si)-semiconductor (Si)", and not by the electron tunneling between ferromagnetic granules through the SiO2 dielectric matrix into the Si semiconductor. A high value of the GIMR effect in SiO2 (x at.% Co) on GaAs [8,44] substrate is probably related to the spin-dependent potential barrier formed in the accumulation electron layer in the semiconductor near the interface. The action of the spin-dependent potential barrier is amplified by the avalanche process and by the electron accumulation in the quantum well in the semiconductor interface region induced by the backscattering process of injected electrons on exchange-split levels [44]. In the granular film SiO2 (x at.% Co) on the Si substrate, the cobalt silicide does not allow the formation of the region at the GF/Si interface saturated with electrons capable of polarizing in the direction of the applied magnetic field. Therefore, further efforts to form a quantum well with exchange-split levels on the well top at the surface of Si are necessary to gain a high positive magnetoresistance in SiO2 (x at.% Co)/Si heterostructure. For example, this can be achieved by introducing a buffer layer between the granular film and substrate [45,46].
Author Contributions
Conceptualization, N.A.G.; methodology, N.A.G.; validation, N.A.G. and S.V.G.; investigation, N.A.G., V.U., A.A.V.; resources, A.I.S., N.N.N. and L.V.L.; data curation, V.U. and A.A.V.; writing—original draft preparation, N.A.G. and V.U.; writing—review and editing, S.V.G.; visualization, A.A.V.; supervision, S.V.G.; project administration, L.V.L. All authors have read and agreed to the published version of the manuscript.
Funding
This work is financially supported by the Ministry of Science and Higher Education of the Russian Federation in the framework of Agreement No. 075-15-2022-830 (Prolongation of Agreement No. 075-15-2021-1358 from 12 October 2021).
Institutional Review Board Statement
Not applicable.
Informed Consent Statement
Not applicable.
Data Availability Statement
The data that support the findings of this study are available from the corresponding author upon reasonable request.
Acknowledgments
Authors would like to thank Institut Laue-Langevin, European Synchrotron Radiation Facility and Institute of Condensed Matter Physics of TU Braunschweig for the provided experimental opportunities. We would like to acknowledge M. Wolf, A.Mistonov and D.Menzel for the assistance with the neutron and magnetometry measurements. The authors are grateful to the staff of the Interdisciplinary Resource Center for Nanotechnology and the Center of X-ray diffraction studies at the Research park of Saint Petersburg State University for preliminary research of Au/SiO2(Co)/Si heterostructures, as well as Saint Petersburg State University for financial support (Activity 6—grant for academic mobility 2019, ID:41160111).
Conflicts of Interest
The authors declare that they have no conflict of interest.
References
- Gerber, A.; Milner, A.; Groisman, B.; Karpovsky, M.; Sulpice, A. Magnetoresistance of granular ferromagnet-insulator films. Thin Solid Films 1997, 304, 319–322. [Google Scholar] [CrossRef]
- Stuart, H.R.; Hall, D.G. Island size effects in nanoparticle-enhanced photodetectors. Appl. Phys. Lett. 1998, 73, 3815–3817. [Google Scholar] [CrossRef]
- Kodama, R. Magnetic Nanoparticle. J. Magn. Magn. Mater. 1999, 200, 359–372. [Google Scholar] [CrossRef]
- Fujimori, H.; Ohnuma, S.; Kobayashi, N.; Masumoto, T. Spintronics in metal-insulator nanogranular magnetic thin films. J. Magn. Magn. Mater. 2006, 304, 32–35. [Google Scholar] [CrossRef]
- Žutić, I.; Fabian, J.; Sarma, S.D. Spintronics: Fundamentals and applications. Rev. Mod. Phys. 2004, 76, 323. [Google Scholar]
- Atwater, H.A.; Polman, A. Plasmonics for improved photovoltaic devices. Nat. Mater. 2010, 9, 205–213. [Google Scholar] [CrossRef]
- Lambert, C.-H.; Mangin, S.; Varaprasad, B.C.S.; Takahashi, Y.; Hehn, M.; Cinchetti, M.; Malinowski, G.; Hono, K.; Fainman, Y.; Aeschlimann, M.; et al. All-optical control of ferromagnetic thin films and nanostructures. Science 2014, 345, 1337–1340. [Google Scholar] [CrossRef]
- Lutsev, L.V.; Stognij, A.I.; Novitskii, N.N. Giant magnetoresistance in semiconductor/granular film heterostructures with cobalt nanoparticles. Phys. Rev. B 2009, 80, 184423. [Google Scholar] [CrossRef]
- Lutsev, L. Potential barrier for spin-polarized electrons induced by the exchange interaction at the interface in the ferromagnet/semiconductor heterostructure. J. Phys. Condens. Matter 2006, 18, 5881. [Google Scholar] [CrossRef] [PubMed]
- Miller, N.C.; Shirn, G.A. Co-sputtered Au-SiO2 cermet films. Appl. Phys. Lett. 1967, 10, 86. [Google Scholar] [CrossRef]
- Miller, N.C.; Hardiman, B.; Shirn, G.A. Transport properties, microstructure, and conduction model of cosputtered Au-SiO2 cermet films. J. Appl. Phys. 1970, 41, 1850. [Google Scholar] [CrossRef]
- Stognij, A.I.; Novitskii, N.N.; Stukalov, O.M. Separate cobalt-copper interface smoothening under the action of low-energy argon ion bombardment. Tech. Phys. Lett. 2003, 29, 43–46. [Google Scholar] [CrossRef]
- Smilgies, D.M.; Boudet, N.; Struth, B.; Konovalov, O. Troika II: A versatile beamline for the study of liquid and solid interfaces. J. Synchrotron Radiat. 2005, 12, 329–339. [Google Scholar] [CrossRef]
- Renaud, G.; Lazzari, R.; Leroy, F. Probing surface and interface morphology with Grazing Incidence Small Angle X-ray Scattering. Surf. Sci. Rep. 2009, 64, 255–380. [Google Scholar] [CrossRef]
- Renaud, G.; Lazzari, R.; Revenant, C.; Barbier, A.; Noblet, M.; Ulrich, O.; Leroy, F.; Jupille, J.; Borensztein, Y.; Henry, C.R.; et al. Real-time monitoring of growing nanoparticles. Science 2003, 300, 1416–1419. [Google Scholar] [CrossRef] [PubMed]
- Lazzari, R.; Renaud, G.; Revenant, C.; Jupille, J.; Borensztein, Y. Adhesion of growing nanoparticles at a glance: Surface differential reflectivity spectroscopy and grazing incidence small angle X-ray scattering. Phys. Rev. B 2009, 79, 125428. [Google Scholar] [CrossRef]
- Grigoreva, N.; Vorobev, A.; Ukleev, V.; Dyadkina, E.; Lutsev, L.; Stognij, A.; Novitskii, N.; Grigorev, S. Investigation of the SiO2 (Co)/GaAs heterostructures using the surface scattering of synchrotron radiation. JETP Lett. 2010, 92, 767–773. [Google Scholar] [CrossRef]
- Schwartzkopf, M.; Buet, A.; Körstgens, V.; Metwalli, E.; Schlage, K.; Benecke, G.; Perlich, J.; Rawolle, M.; Rothkirch, A.; Heidmann, B.; et al. From atoms to layers: In situ gold cluster growth kinetics during sputter deposition. Nanoscale 2013, 5, 5053–5062. [Google Scholar] [CrossRef] [PubMed]
- Parratt, L.G. Surface Studies of Solids by Total Reflection of X-rays. Phys. Rev. 1954, 95, 359. [Google Scholar] [CrossRef]
- Ankner, J.; Felcher, G. Polarized-neutron reflectometry. J. Magn. Magn. Mater. 1999, 200, 741–754. [Google Scholar] [CrossRef]
- Wolff, M.; Zhernenkov, K.; Zabel, H. Neutron reflectometery with ADAM at the ILL: Present status and future perspectives. Thin Solid Films 2007, 515, 5712–5715. [Google Scholar] [CrossRef]
- Devishvili, A.; Zhernenkov, K.; Dennison, A.J.; Toperverg, B.; Wol, M.; Hj¨orvarsson, B.; Zabel, H. SuperADAM: Upgraded polarized neutron reflectometer at the Institut Laue-Langevin. Rev. Sci. Instruments 2013, 84, 025112. [Google Scholar] [CrossRef]
- Vorobiev, A.; Devishvilli, A.; Palsson, G.; Rundlöf, H.; Johansson, N.; Olsson, A.; Dennison, A.; Wollf, M.; Giroud, B.; Aguettaz, O.; et al. Recent upgrade of the polarized neutron re?ectometer Super ADAM. Neutron News 2015, 26, 25–26. [Google Scholar] [CrossRef]
- Ukleev, V.A.; Grigoryeva, N.A.; Dyadkina, E.A.; Vorobiev, A.A.; Lott, D.; Lutsev, L.V.; Stognij, A.I.; Novitskiy, N.N.; Mistonov, A.A.; Menzel, D.; et al. Magnetic properties of the SiO2(Co)/GaAs interface: Polarized neutron reflectometry and SQUID magnetometry. Phys. Rev. B 2012, 86, 134424. [Google Scholar] [CrossRef]
- Ottavian, G.; Tu, K.N.; Psaras, P.; Nobili, C. In situ resistivity measurement of cobalt silicide formation. J. Appl. Phys. 1987, 62, 2290–2294. [Google Scholar] [CrossRef]
- Cabral, C., Jr.; Barmak, K.; Gupta, J.; Clevenger, L.A.; Arcot, B.; Smith, D.A.; Harper, J.M.E. Role of stress relief in the hexagona-clos-packed to face-centered-cubic phase transformation in cobalt thin films. J. Vac. Sci. Technol. 1993, A11, 1435–1440. [Google Scholar] [CrossRef]
- Colgan, E.G., Jr.; Cabral, C.; Kotecki, D.E. Activation energy for CoSi and CoSi2 formation measured during rapid thermal annealing. J. Appl. Phys. 1995, 77, 614–619. [Google Scholar] [CrossRef]
- Lowes, T.D.; Zinke-Allmang, M. Cobalt grain growth on clean Si(100) Surfaces. Scanning Microsc. 1998, 12, 119–129. [Google Scholar]
- Jaccodine, R.J. Surface energy of germanium and silicon. J. Electrochem. Soc. 1963, 110, 524. [Google Scholar] [CrossRef]
- Messmer, C.; Bilello, J.C. The surface energy of Si, GaAs, and GaP. J. Appl. Phys. 1981, 52, 4623. [Google Scholar] [CrossRef]
- Zinke-Allmang, M. Phase separation on solid surfaces: Nucleation, coarsening and coalescence kinetics. Thin Solid Films 1999, 346, 1–68. [Google Scholar] [CrossRef]
- Loncaric, M.; Sancho-Parramon, J.; Zorc, H. Optical properties of gold island films—A spectroscopic ellipsometry study. Thin Solid Films 2011, 519, 2946–2950. [Google Scholar] [CrossRef]
- Qian, H.; Xiao, Y.; Lepage, D.; Chen, L.; Liu, Z. Quantum electrostatic model for optical properties of nanoscale gold films. Nanophotonics 2015, 4, 413–418. [Google Scholar] [CrossRef]
- Yakubovsky, D.I.; Arsenin, A.V.; Stebunov, Y.V.; Fedyanin, D.Y.; Volkov, V.S. Optical constants and structural properties of thin gold films. Opt. Express 2017, 25, 25574. [Google Scholar] [CrossRef]
- Meiklejohn, W.H.; Bean, C.P. New Magnetic Anisotropy. Phys. Rev. 1957, 105, 904. [Google Scholar] [CrossRef]
- Gomoyunova, M.V.; Grebenyuk, G.S.; Pronin, I.I. Formation of ultrathin magnetic cobalt films on the Si(111)7 × 7 surface. Tech. Phys. 2011, 56, 865–868. [Google Scholar] [CrossRef]
- Katmis, F.; Lauter, V.; Nogueira, F.S.; Assaf, B.A.; Jamer, M.E.; Wei, P.; Satpati, B.; Freeland, J.W.; Eremin, I.; Heiman, D.; et al. A high-temperature ferromagnetic topological insulating phase by proximity coupling. Nature 2016, 533, 513–516. [Google Scholar] [CrossRef]
- Mogi, M.; Nakajima, T.; Ukleev, V.; Tsukazaki, A.; Yoshimi, R.; Kawamura, M.; Takahashi, K.S.; Hanashima, T.; Kakurai, K.; Arima, T.H.; et al. Large Anomalous Hall Effect in Topological Insulators with Proximitized Ferromagnetic Insulators. Phys. Rev. Lett. 2019, 123, 016804. [Google Scholar] [CrossRef] [PubMed]
- Cortie, D.L.; Lin, K.W.; Shueh, C.; Hsu, H.F.; Wang, X.L.; James, M.; Fritzsche, H.; Bruck, S.; Klose, F. Exchange bias in a nanocrystalline hematite/permalloy thin film investigated with polarized neutron reflectometry. Phys. Rev. B 2012, 86, 054408. [Google Scholar] [CrossRef]
- Saoudi, M.; Fritzsche, H.; Nieuwenhuys, G.J.; Hesselberth, M.B.S. Size Effect in the Spin Glass Magnetization of Thin AuFe Films as Studied by Polarized Neutron Reflectometry. Phys. Rev. Lett. 2008, 100, 057204. [Google Scholar] [CrossRef]
- Ankner, J.F.; Majrzak, C.F.; Homma, H. Magnetic dead layer in Fe/Si multilayer: Profile refinement of polarized neutron reflectivity data. J. Appl. Phys. 1993, 73, 6436. [Google Scholar] [CrossRef]
- Dyadkina, E.A.; Grigoriev, S.V.; Lott, D.; Sitnikov, A.V.; Kalinin, Y.E. Study of the [(Co45Fe45Zr10)x(Al2O3)100−x/a-Si:H]m multilayer nanostructure by polarized neutron reflectometry. Phys. B 2011, 406, 2397–2400. [Google Scholar] [CrossRef]
- Dyadkina, E.A.; Grigoryeva, N.A.; Vorobiev, A.A.; Grigoriev, S.V.; Lutsev, L.V.; Zhernenkov, K.; Wolff, M.; Lott, D.; Stognij, A.I.; Novitskii, N.N.; et al. Polarized neutron reflectometry from the interface of the heterostructures SiO2(Co)/Si and SiO2(Co)/GaAs. Phys. B 2009, 404, 2547–2549. [Google Scholar] [CrossRef]
- Lutsev, L. Magnetoresistance: Types, Roles and Research; Gonzalez, R., Ed.; Nova Science Publishers, Incorporated: New York, NY, USA, 2017; pp. 65–121. [Google Scholar]
- Fan, Z.; Li, P.; Zhang, L.; Mi, W.; Jiang, E.; Bai, H. Electrical transport properties and room-temperature positive magnetoresistance of Fe3O4/a-C/n-Si junctions. Thin Solid Films 2012, 520, 3641–3646. [Google Scholar] [CrossRef]
- Volkov, N.; Tarasov, A.; Eremin, E.; Baron, F.; Varnakov, S.; Ovchinnikov, S. Extremely large magnetoresistance induced by optical irradiation in the Fe/SiO2/p-Si hybrid structure with Schottky barrier. J. Appl. Phys. 2013, 114, 093903. [Google Scholar] [CrossRef]
Publisher’s Note: MDPI stays neutral with regard to jurisdictional claims in published maps and institutional affiliations. |
© 2022 by the authors. Licensee MDPI, Basel, Switzerland. This article is an open access article distributed under the terms and conditions of the Creative Commons Attribution (CC BY) license (https://creativecommons.org/licenses/by/4.0/).