Article

Saturation of Specific Absorption Rate for Soft and Hard Spinel Ferrite Nanoparticles Synthesized by Polyol Process

by
Cristian Iacovita
1,
Gabriela Fabiola Stiufiuc
2,
Roxana Dudric
2,
Nicoleta Vedeanu
1,
Romulus Tetean
2,
Rares Ionut Stiufiuc
1,3,* and
Constantin Mihai Lucaciu
1,*
1
Department of Pharmaceutical Physics-Biophysics, Faculty of Pharmacy, “Iuliu Hatieganu” University of Medicine and Pharmacy, Pasteur 6, 400349 Cluj-Napoca, Romania
2
Faculty of Physics, “Babes Bolyai” University, Kogalniceanu 1, 400084 Cluj-Napoca, Romania
3
Department of Bionanoscopy, MedFuture Research Center for Advanced Medicine, “Iuliu Hatieganu” University of Medicine and Pharmacy, Pasteur 4-6, 400337 Cluj-Napoca, Romania
*
Authors to whom correspondence should be addressed.
Magnetochemistry 2020, 6(2), 23; https://doi.org/10.3390/magnetochemistry6020023
Submission received: 9 May 2020 / Revised: 26 May 2020 / Accepted: 28 May 2020 / Published: 29 May 2020
(This article belongs to the Special Issue Magnetic Nanoparticles 2020)

Abstract

:
Spinel ferrite nanoparticles represent a class of magnetic nanoparticles (MNPs) with enormous potential in magnetic hyperthermia. In this study, we investigated the magnetic and heating properties of spinel soft NiFe2O4, MnFe2O4, and hard CoFe2O4 MNPs of comparable sizes (12–14 nm) synthesized by the polyol method. Similar to the hard ferrite, which predominantly is ferromagnetic at room temperature, the soft ferrite MNPs display a non-negligible coercivity (9–11 kA/m) arising from the strong interparticle interactions. The heating capabilities of ferrite MNPs were evaluated in aqueous media at concentrations between 4 and 1 mg/mL under alternating magnetic fields (AMF) amplitude from 5 to 65 kA/m at a constant frequency of 355 kHz. The hyperthermia data revealed that the SAR values deviate from the quadratic dependence on the AMF amplitude in all three cases in disagreement with the Linear Response Theory. Instead, the SAR values display a sigmoidal dependence on the AMF amplitude, with a maximum heating performance measured for the cobalt ferrites (1780 W/gFe+Co), followed by the manganese ferrites (835 W/gFe+Mn), while the nickel ferrites (540 W/gFe+Ni) present the lowest values of SAR. The heating performances of the ferrites are in agreement with their values of coercivity and saturation magnetization.

1. Introduction

In recent decades, the potential applications of magnetic nanoparticles (MNPs) in various fields, have increased exponentially due to their specific characteristics [1,2,3,4]. While MNPs possess common features with other nanoparticulate systems owing to their size, such as a high surface to volume ratio, nevertheless they have specific unparalleled advantages, like the possibility of remotely controlling their movement, temperature, and organization by using external magnetic fields. These characteristics have led to numerous biomedical applications of MNPs in fields like targeted drug delivery, neural stimulation, biological separation, bio-sensing, magnetic resonance/particle imaging, and as heat dissipation agents in cancer treatment [5,6,7,8,9,10].
Magnetic hyperthermia, the heat dissipation by MNPs under the action of an alternating magnetic field (AMF), proposed in 1957 by Gilchrist et al. [11] to be used in cancer therapy for inducing the tumor cell death, was already translated in clinical trials for the treatment of glioblastoma and prostate cancer [12]. However, in these studies, for efficiently killing cancer cells, magnetic hyperthermia was used in conjunction with either radiotherapy or chemotherapy, emphasizing the need to improve the hyperthermia properties of MNPs. The heating performance of MNPs expressed as the Specific Absorption Rate (SAR), the rate of heat dissipation per unit mass, depends on both extrinsic and intrinsic parameters [13,14]. The extrinsic parameters are related to the characteristics of the AMF (frequency f, magnetic field strength amplitude H) and are limited by the safety conditions for the human body exposure Hxf < 5 × 10⁹ Am−1s−1 [15]. The intrinsic parameters are related to the MNPs’ composition, shape, size, size distribution, surface functionalization, and nanoscale organization.
Due to their low toxicity, iron oxide MNPs are the most frequently used materials in magnetic hyperthermia [16,17]. Nevertheless, other ferrite MNPs such as manganese and zinc ferrite have also been investigated for their hyperthermia properties, due to their high magnetization among the ferrite family and possessing also good stability against oxidation [18]. Another intrinsic parameter that might control the MNPs’ heating performances is the coercive field (Hc). Several theoretical models were developed aiming at describing the hyperthermic properties of MNPs and their relation to the magnetic characteristics (saturation magnetization, coercive field, anisotropy constant, and their temperature dependence) morphology and size. For small MNPs, in the superparamagnetic regime, the linear response theory (LRT) developed by Rosenzweig [13] is the most used model to describe their heating behavior. For large MNPs, in the ferromagnetic state, theories derived from the Stoner Wolfhart model are more suitable [19]. In the intermediate regime, either numeric calculations or phenomenologic equations are usually applied for interpreting the experimental data, both analytical expressions and a clear theoretical model still lacking. Therefore, more experimental data and their interpretation are needed, aiming at moving the knowledge in this field forward.
In this paper, we present the magnetic and hyperthermia properties of a series of cobalt, manganese, and nickel ferrites, which include both “hard” and “soft” magnetic materials, aiming at elucidating the role of the coercivity on the heating properties of MNPs. We used a polyol synthesis method, developed previously in our group for the elaboration of noble metal and magnetic nanoparticles [20,21,22,23,24,25], which enabled us to synthesize ferrites with the same morphology and similar sizes, thus differing only in their composition. In this manner, the main difference between the samples is their different saturation magnetizations and coercive fields, leading finally to different SAR values. Moreover, taking advantage of our technical setup, allowing us to reach very high amplitudes of the AMF (up to 65 kA/m), we checked the SAR dependence on H for all the samples at different concentrations, in water. Our results show that although our MNPs have small sizes (12–14 nm), they present a nonzero coercitivity at room temperature and their SAR dependence on H cannot be described in the frame of the LRT (which implies that SAR increases with the square of the magnetic field strength H); instead, a saturated dependence was recorded. We also discuss the saturation magnetization and the coercive field temperature dependence of the synthesized ferrites.

2. Results and Discussion

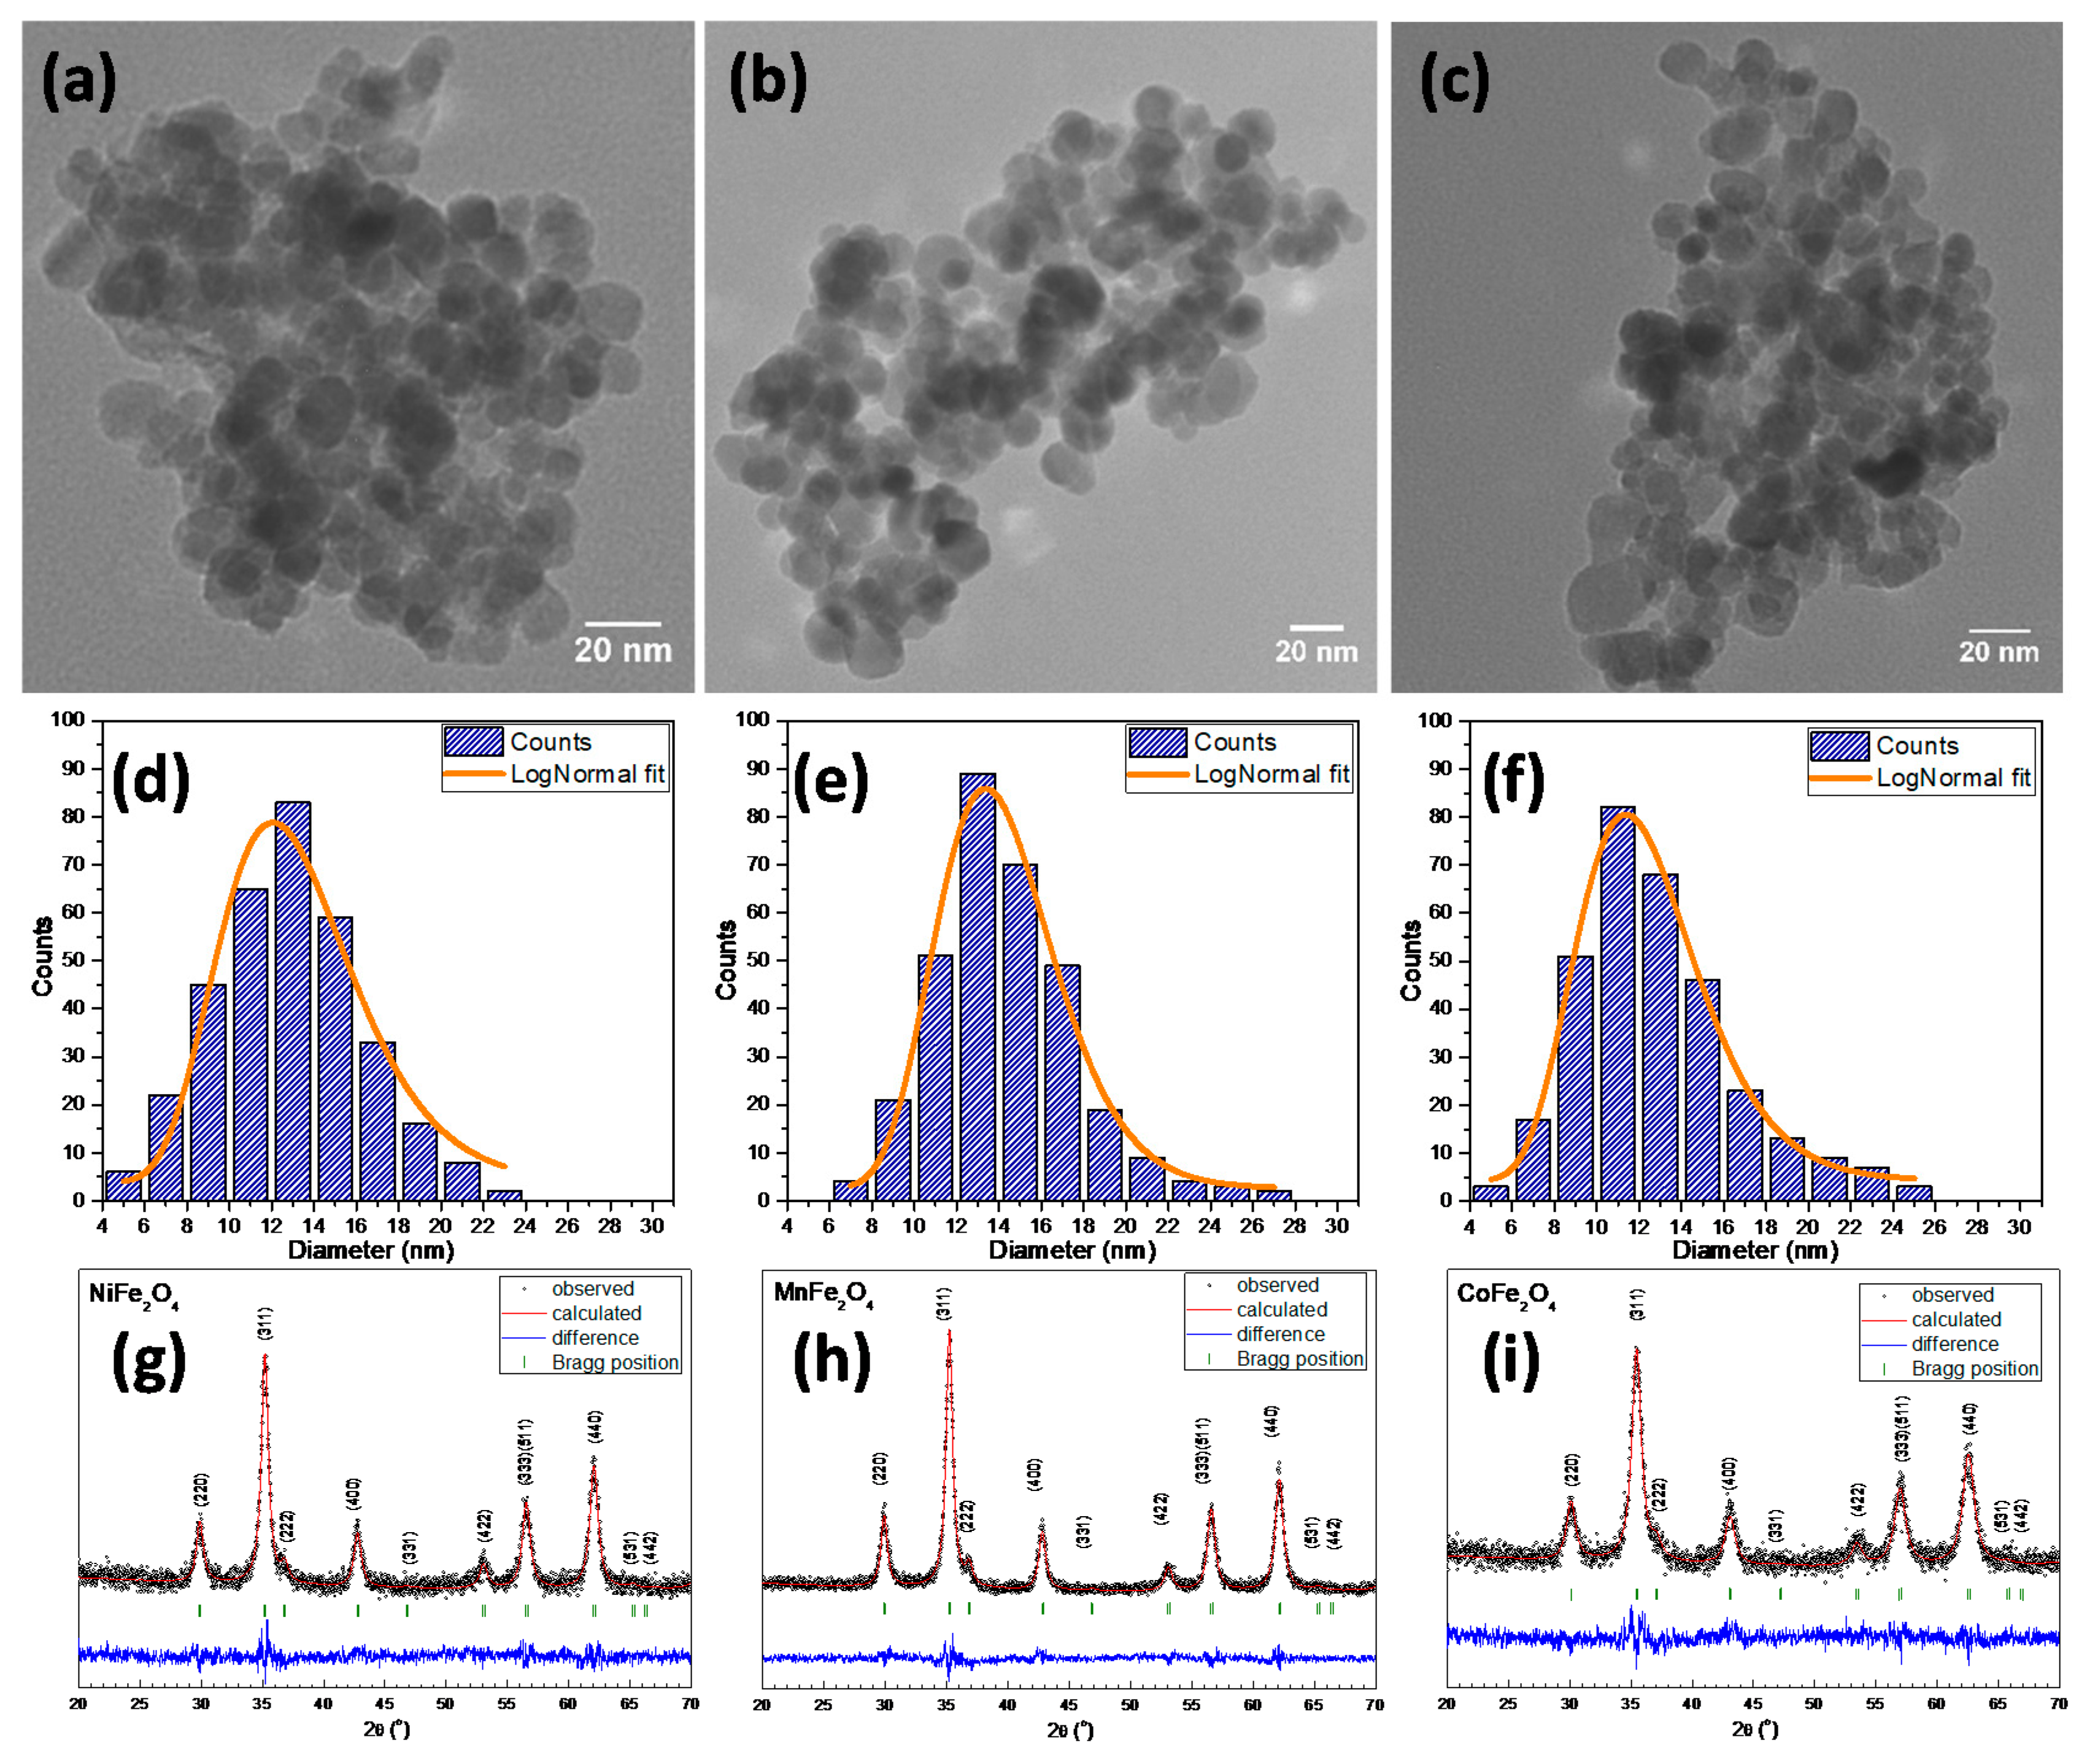
2.1. Morphological and Structural Properties

Figure 1a–c shows representative TEM images of the as-synthesized ferrite MNPs of nickel, manganese, and cobalt. All three types of ferrite MNPs possessed a roughly spherical morphology, quasi-uniform in size and appeared aggregated in the TEM images, possibly due to the drying process on the TEM grid. No specific assemblies of ferrite MNPs were observed in the TEM images. The mean diameters of all three types of ferrite MNPs were estimated by adjusting the experimental histograms (obtained by manual measurement of the diameter of around 400 MNPs through ImageJ software) with a log-normal function (using Origin software) as shown in Figure 1d–f. The results, presented in Tabel 1, indicated an average diameter (DTEM) of 12.9 nm, 13.9 nm, and 12.1 nm for nickel, manganese, and cobalt ferrites, respectively. In comparison with a previous paper, in which the ferrite MNPs were prepared in diethylene glycol at 210 °C for 3 h [26], the increase in the reaction temperature (240 °C) and time (12 h) by using PEG200 as a solvent resulted in doubling of their mean diameter. The standard deviation of all three types of ferrite MNPs varies between 0.21 nm and 0.26 nm, indicating a quasi-narrow size distribution. Therefore, the use of the same amounts and proportions of magnetic precursors and identical concentration of precipitator (NaAc) correlated with an increase in the reaction time to 12 h, made it possible to generate ferrite MNPs with an overall spherical shape of the same diameter (12–14 nm). This allowed us to study more accurately the effect of transition metals doping on the structural, magnetic, and hyperthermia properties of the synthesized ferrite MNPs.
The crystal quality of the as-synthesized ferrite MNPs was studied by XRD and the obtained diffraction patterns are shown in Figure 1g–i. For all three types of ferrite MNPs, the XRD diffractograms proved the formation of a single-phase cubic spinel structure. The position and the relative intensities of all diffraction peaks match well with bulk XRD cards of pure stoichiometric NiFe2O4 (JPCDS file no:10-0325), MnFe2O4 (JCPDS file no: 74-2403) and CoFe2O4 (JCPDS file no: 22-1086) spinel ferrite crystal structure. Moreover, the spinel ferrite diffraction peaks in all three cases are broad, implying the formation of nano-sized crystals, in agreement with the TEM images. The broadest peaks are observed for CoFe2O4 MNPs, followed by NiFe2O4 MNPs, while MnFe2O4 MNPs exhibit the narrowest peaks. Consequently, the crystallite diameters, DXRD, calculated using the Scherrer equation [27] by Gaussian fit of 220, 311, and 440 peaks, are 9.8 nm, 10.6 nm and 11.5 nm for CoFe2O4, NiFe2O4 and MnFe2O4 MNPs, respectively (Table 1). These values are comparable to those obtained by TEM measurements, suggesting, based on the quasi-narrow size distribution of all three types of ferrite MNPs, that most of the MNPs can be considered as single crystals of high quality. The insertion of the different cations in the magnetite structure leads to a change of the lattice constant as compared to that of bulk magnetite (a = 8.375 Å). Due to the differences in the ionic radii of Ni2+ (0.63 Å), Co2+ (0.74 Å) and Mn2+ (0.83 Å), the lattice constants are affected by the nature of the inserted cation. Bulk manganese ferrites adopt a normal spinel structure whereas the bulk nickel and cobalt ferrites crystallize into an inverse spinel structure. This means that the Mn2+ occupy the tetrahedral sites by replacing the Fe3+ ions, while Ni2+ and Co2+ replace the Fe2+ in the octahedral sites. Therefore, the lattice constant decreases for nickel ferrites and increases for cobalt and manganese ferrites with respect to the bulk magnetite, as can be seen also in our case (Table 1). However, at the nanoscale the doping cations often migrate in both octahedral and tetrahedral sites, giving rise to a mixed spinel structure [28,29]. The lattice parameters obtained for our ferrite MNPs are closed to the ones corresponding to the bulk nickel (8.339 Å), manganese (8.444 Å), and cobalt (8.391 Å) ferrites, in agreement with previous reports on analogous sizes of ferrite MNPs [24,30,31,32,33]. This observation confirms that the ferrite MNPs contain a predominant crystalline phase that corresponds to their bulk counterparts.

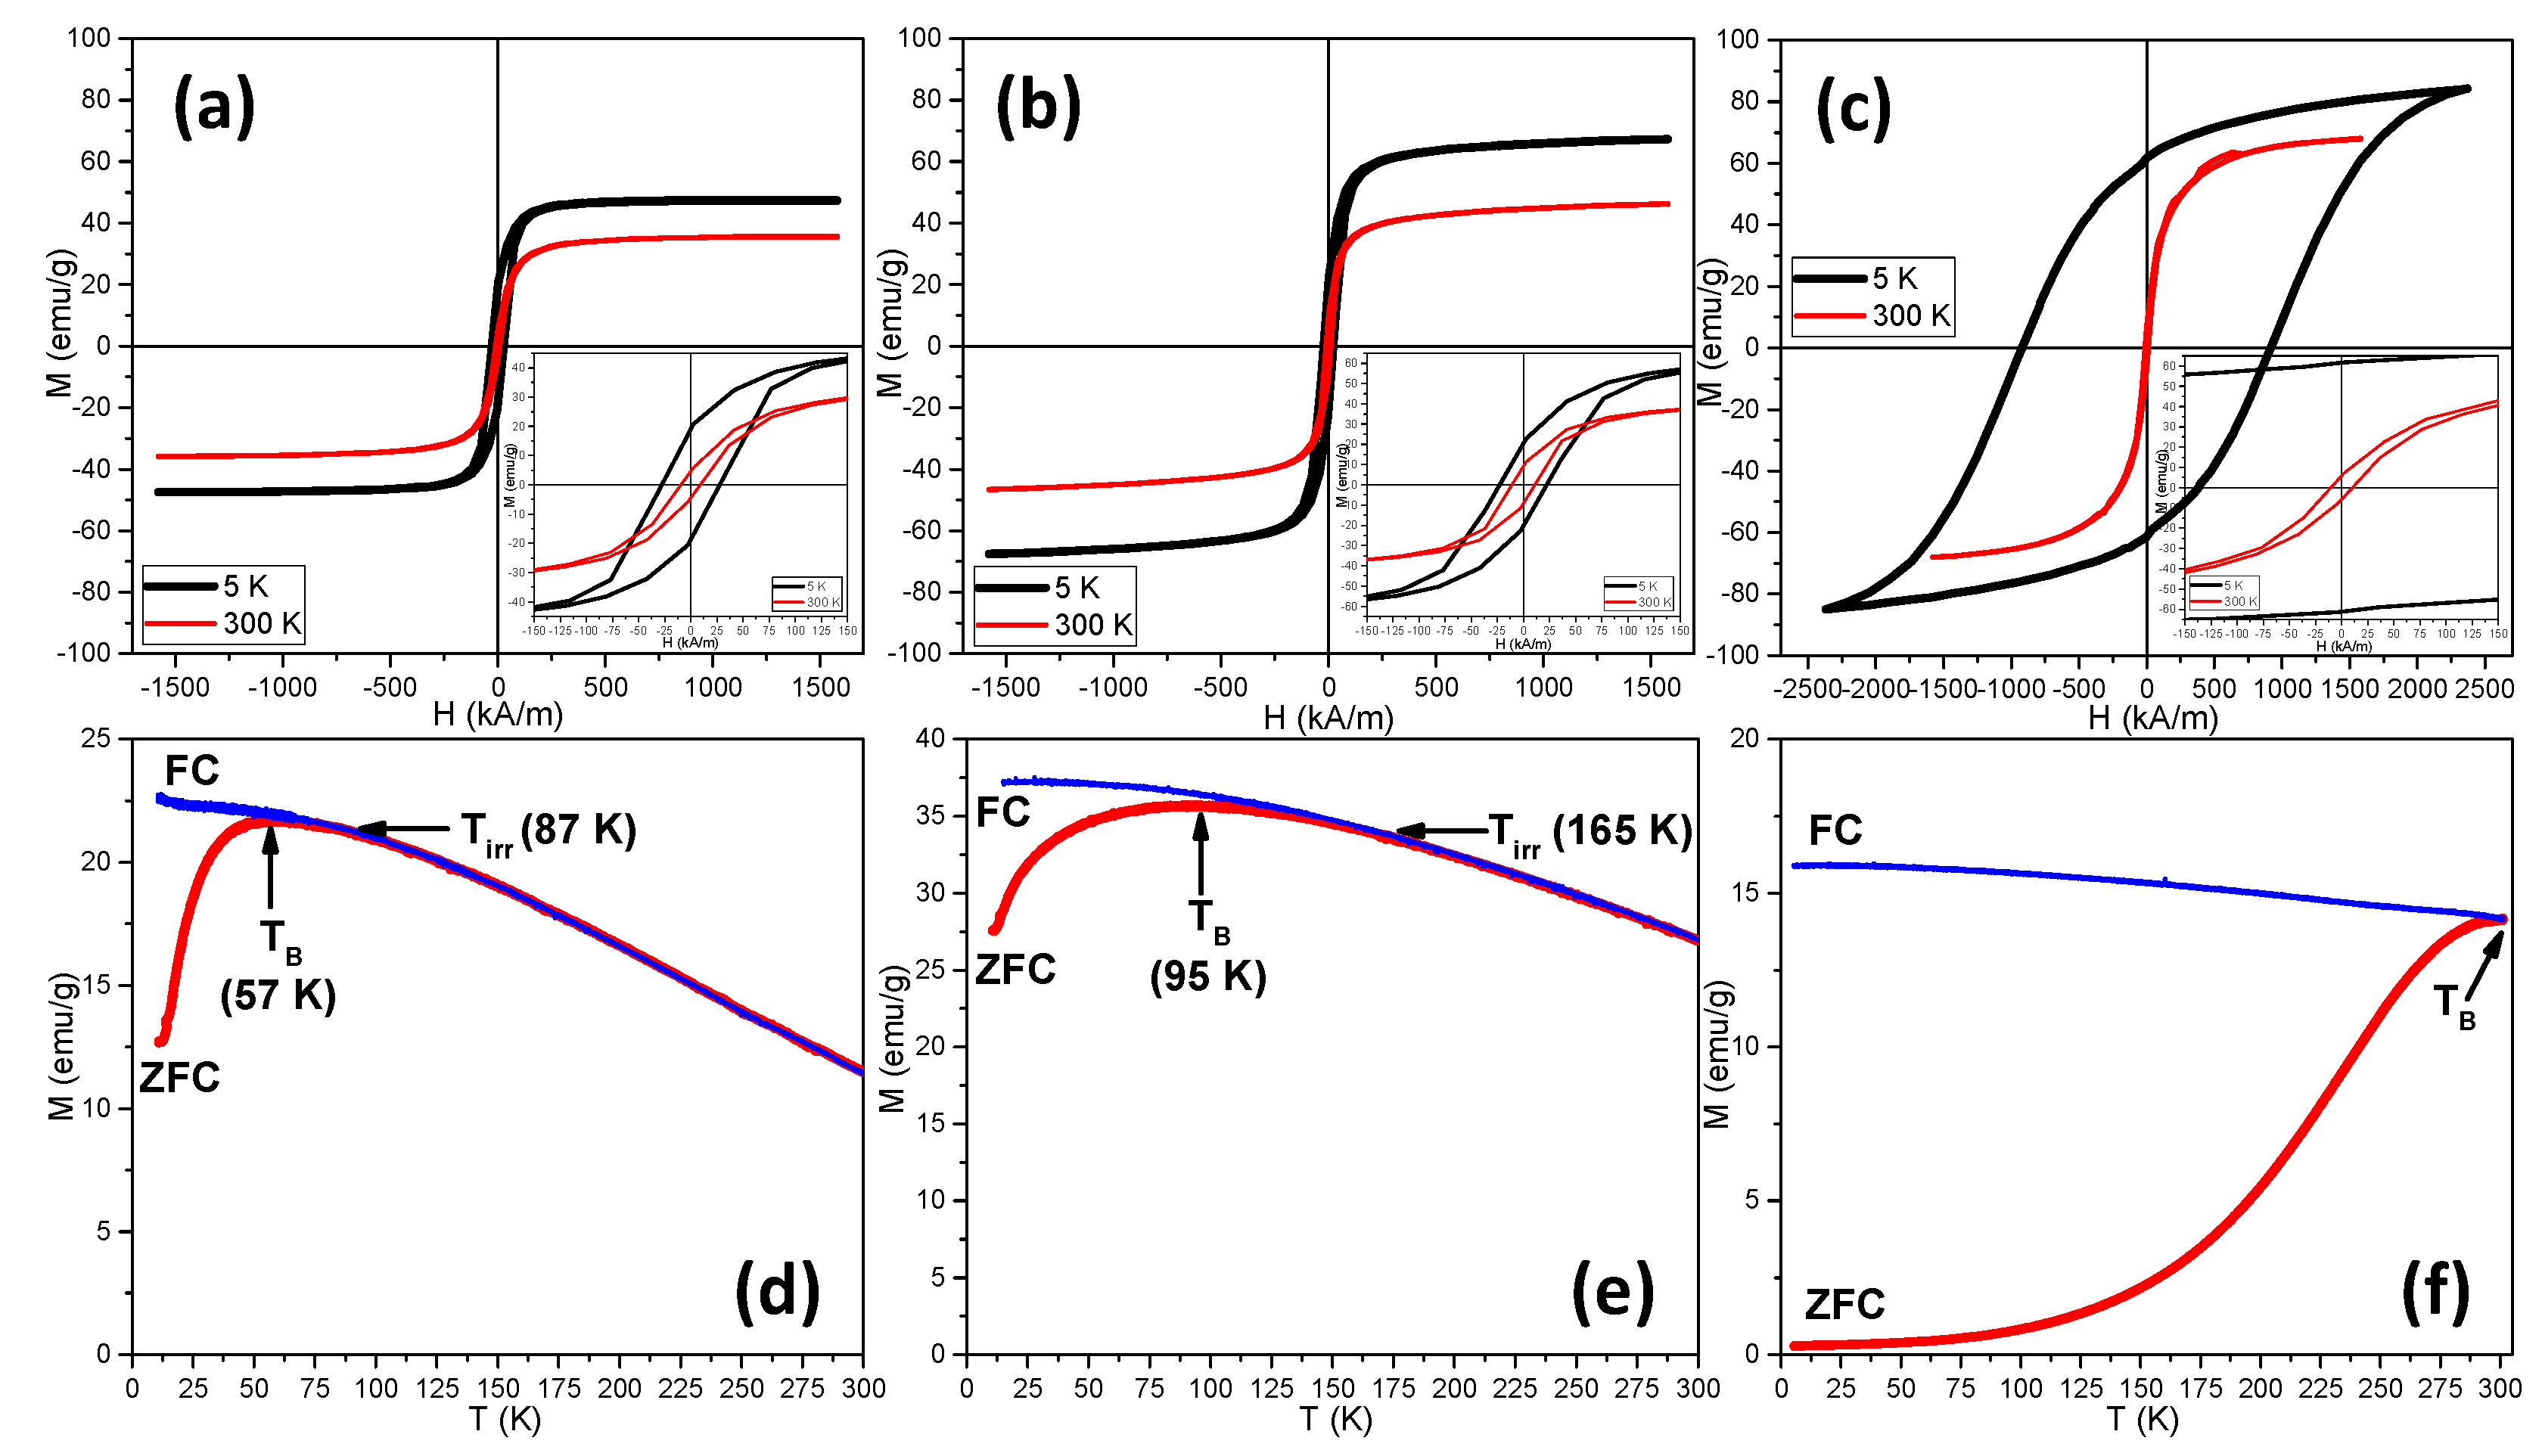
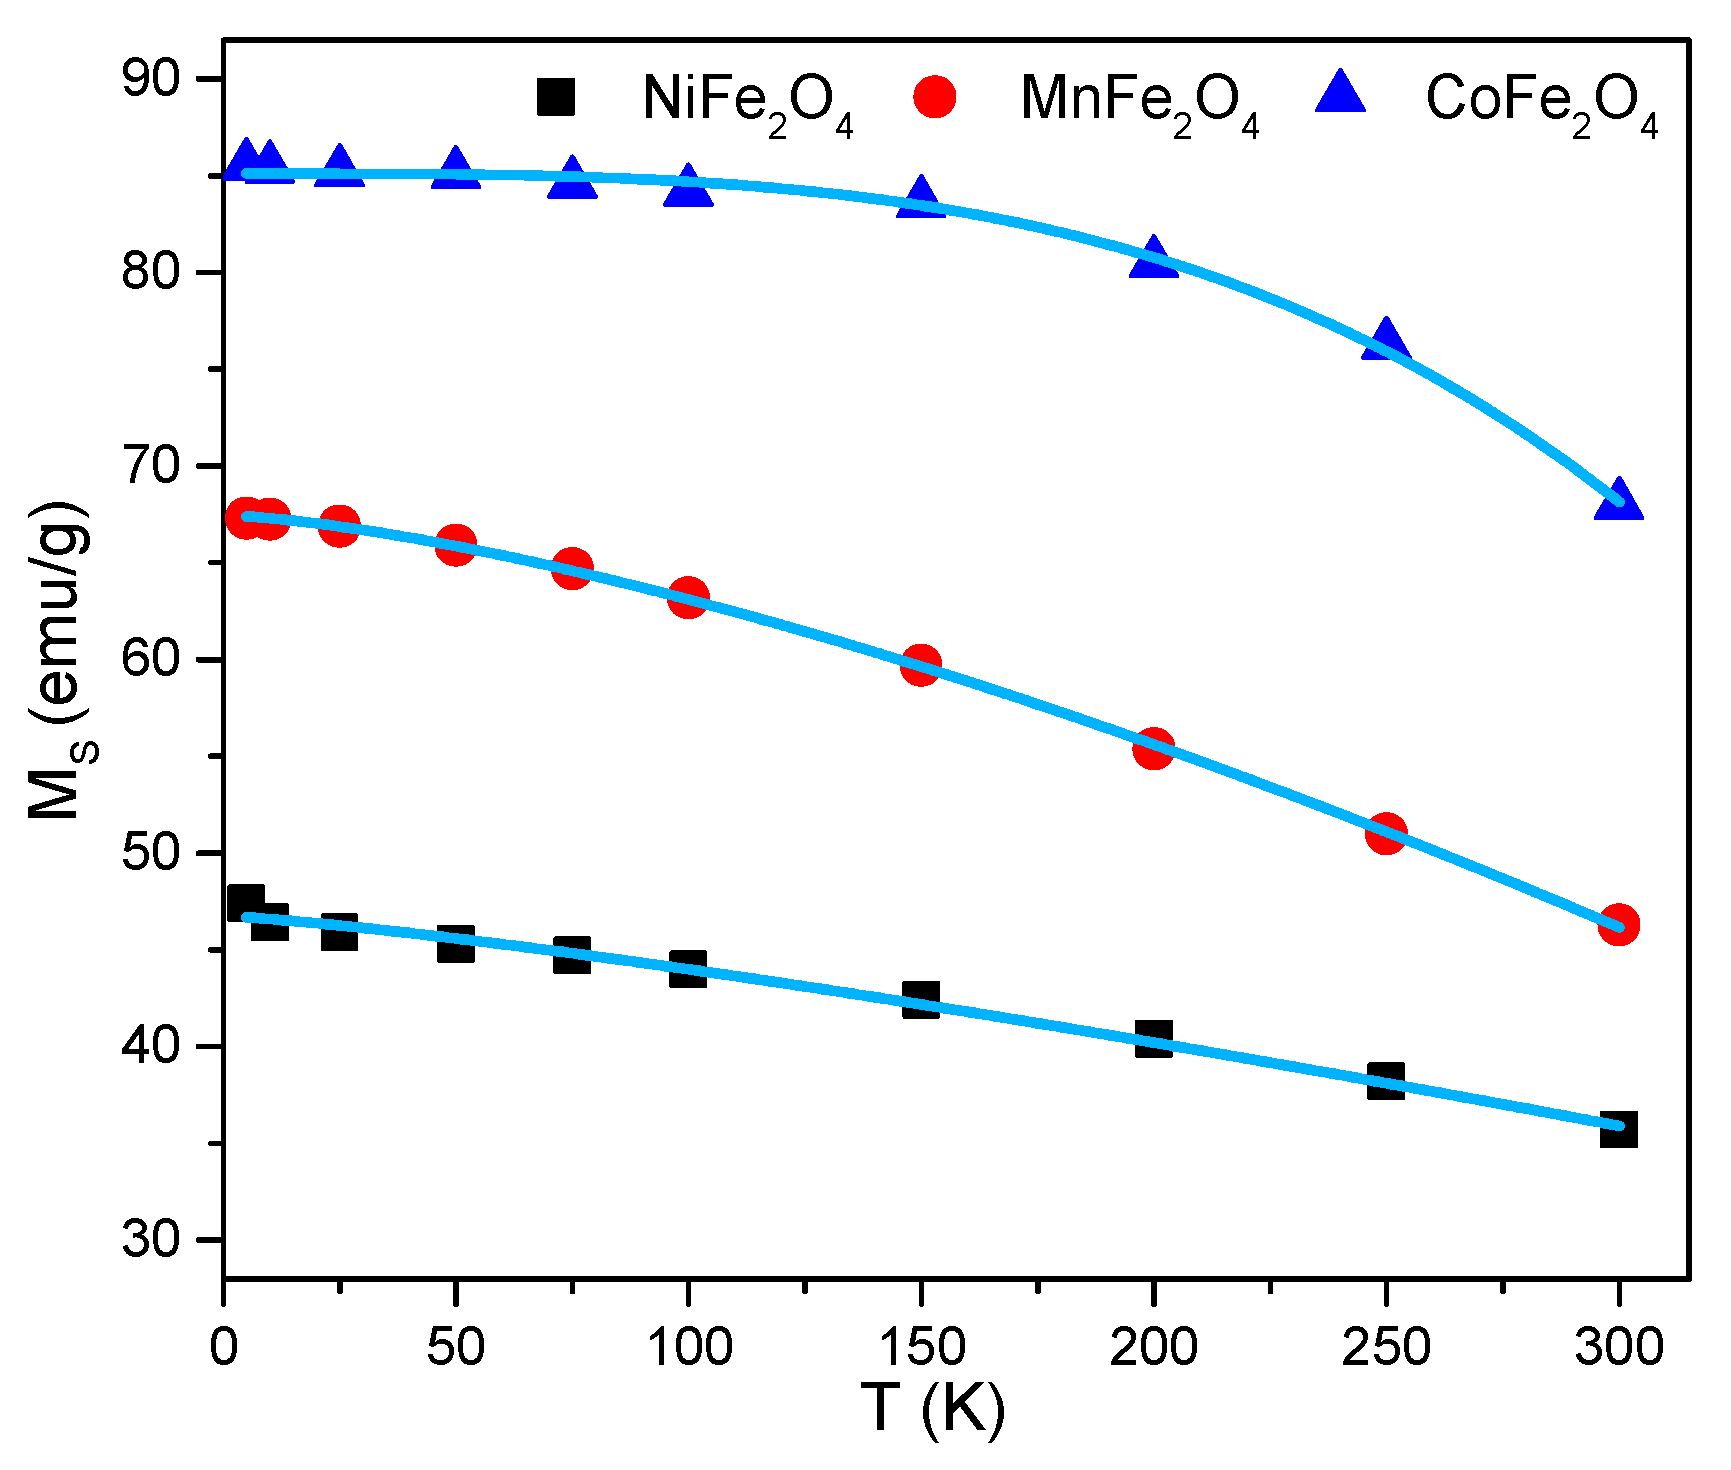
2.2. Magnetic Properties

The magnetic properties of ferrite MNPs were investigated by recording magnetization versus applied magnetic field (M-H) curves at 5 K and 300 K (Figure 2a–c). Table 2 collects the magnetic parameters extracted from the hysteresis loops at both temperatures, including saturation magnetization (MS), coercivity (Hc), magnetic remanence (Mr), and squareness ratio (Mr/Ms). For all three types of ferrite MNPs, the M-H curves are hysteretic at 5 K. The Hc is maximal in the cobalt ferrites (Hc = 922 kA/m), being almost two orders of magnitude larger than the Hc of both nickel (Hc = 27.75 kA/m) and manganese (Hc = 22.8 kA/m) ferrites. These results are in agreement with the well-known “hardness” of cobalt ferrites and “softness” of manganese and nickel ferrites. Among the synthesized ferrite MNPs, the cobalt ferrite exhibit the highest Ms of 85.5 emu/g, followed by the manganese ferrite with a Ms value of 67.3 emu/g, while the nickel ferrite displays the lowest Ms value of 47.4 emu/g. The Ms value of both cobalt and nickel ferrites are with approximately 9 emu/g lower than the bulk values of Ms (94 emu/g for CoFe2O4 and 56 emu/g for NiFe2O4), suggesting the excellent quality of the crystallites. Instead, in the case of manganese ferrites, their Ms value represents only 60% of the bulk value (112 emu/g for MnFe2O4). This significant difference might be attributed to cation vacancies resulting from the synthesis. Typical hysteresis loops were obtained at 300 K for all three types of ferrites, but with smaller openings (insets of Figure 2a–c). This indicates the absence of superparamagnetic behavior in all three samples, hence the Hc did not vanish at room temperature (Table 2). The existence of the magnetic dead layers and spin canting effects at the surface of MNPs leads to a considerable reduction of their Ms at room temperature [34]. In our case, a decrease was recorded in the Ms for cobalt, nickel, and manganese ferrites by 20%, 25%, and 31%, respectively (Table 2).
According to the Stoner–Wohlfarth theory, the cubic anisotropy corresponds to a Mr/Ms value of 0.83, while the uniaxial anisotropy is associated with a Mr/Ms value around or below 0.5 [19]. At room temperature, all three types of ferrites have Mr/Ms values well below 0.5 (Table 2), indicating that they display a uniaxial anisotropy. The lowest Mr/Ms values for cobalt and nickel ferrites suggest that they are less anisotropic containing a larger fraction of superparamagnetic nanoparticles and exhibit pronounced spin canting effects as compared to manganese ferrites [35]. The soft ferrites preserve the uniaxial anisotropy at low temperatures. Instead, the cobalt ferrites have a mixed cubic/uniaxial anisotropy at 5 K as their Mr/Ms value is of 0.72. The magnetic anisotropy constant (K) of ferrite MNPs can be calculated by the followed formula:
K μ 0 H c M s
where μ 0 is the vacuum magnetic permeability, Hc is the coercive field, and Ms the saturation magnetization. At the same time, the blocking temperature TB can be calculated as:
T B = K V k B   l n ( τ m τ 0 )  
where k B is the Boltzman constant, T B is the blocking temperature of the samples, τm is the characteristic measuring time (few hundreds of seconds for a vibrating sample magnetometer), and τ0 is the attempt time, which is usually taken as 10−9 s, and V is the volume of a single nanoparticle. In typical laboratory measurements, l n ( τ m τ 0 ) is usually considered to be 25. It is assumed that the nanoparticles possess a spherical shape, thus V = 4 π 3 r 3 = π 6 d 3 , where d is the mean diameter of nanoparticles resulted from the XRD measurements (Table 1). Due to the thermal fluctuations, the following formula was proposed for calculating Hc:
μ 0 H c = 0.96   K M s 1 ( k B T K V l n τ m τ 0 ) 3 / 4
The calculated K values for cobalt (515 kJ/m3) and manganese (9.9 kJ/m3) ferrites are larger than the K values corresponding to their bulk counterparts, 200–300 kJ/m3, and 2.5–3 kJ/m3, respectively [36]. For the nickel ferrite, the calculated K value (8.6 kJ/m3) is approximately 4 times smaller than the bulk K value (40 kJ/m3) [36]. Usually, larger values of the anisotropy constant for the MNPs as compared to the bulk materials are due to the surface anisotropy, an additive term that increases the overall MNPS’ anisotropy. As the size of the MNP is smaller, this supplementary contribution to the anisotropy is more important.
Further insights into the magnetic properties of ferrite MNPs can be provided by the temperature dependences of magnetization obtained in two different measurement modes: zero-field cooling (ZFC) and field cooling (FC). In ZFC mode, the samples were cooled in zero external magnetic fields to 5 K, and then their magnetization was measured as a function of temperature in the process of sample heating by applying an external magnetic field of 4 kA/m (50 Oe). The FC mode differs from the ZFC one in that the samples are cooled in the mentioned external magnetic field. A common feature in the ZFC curves of the three types of ferrites is the maximum (red curves in Figure 2c,d,f), which corresponds to the average onset of the ferromagnetic to superparamagnetic transition. The temperature at which the peak in the ZFC curves occurs is usually called the blocking temperature (TB), which is assigned around 55 K and 95 K for nickel and manganese ferrites, respectively (Figure 2c,d). These values are close to those calculated based on Equation (2), of 78 K and 90 K for nickel and manganese ferrites, respectively. For both soft ferrites, the peak region around TB is broad, which could indicate a large size distribution, contrary to the size histograms obtained from TEM images, which show quite narrow size distributions. On the other hand, the bifurcation between ZFC and FC magnetization curves, which defines the so-called irreversibility temperature (TIRR), occurred at higher temperatures than the TB. As can be seen in Figure 2c,d, the difference between TIRR and TB is 30 K and 70 K for nickel and manganese ferrites, respectively. It has to be noted that for monodispersed and non-interacting single-domain magnetic particles, assumed as ideal superparamagnetic nanoparticles, the TIRR coincides with TB, the peak is narrow and both the ZFC and FC magnetization curves decrease progressively towards zero while their curvature became negative in the vicinity of room temperature [37,38]. The ZFC magnetization curve drops to zero as the temperature decreases below TB. This is not the case, for the FC curve, as the magnetization curve reaches a plateau for both nickel and manganese ferrites (Figure 2c,d). Moreover, at room temperature, both ZFC and FC magnetization curves display magnetization values of 11.4 emu/g and 26.9 emu/g for nickel and manganese ferrites, respectively. These behaviors are typically for an assembly of nanoparticles with non-negligible particle size distribution which manifest strong interparticle interactions at room temperature [37]. This regime is more pronounced for manganese ferrites if one compares their ZFC and FC magnetization curves (Figure 2d) with those of nickel ferrites (Figure 2c). The picture is completely different for cobalt ferrites, as the peak in the ZFC magnetization curve starts to form in the proximity of 300 K, extending over this temperature (Figure 2e). The FC magnetization curve joins the ZFC one at room temperature and defines a plateau as the temperatures are decreased. Thus, part of the cobalt ferrites is superparamagnetic, whereas the rest of them are in a ferromagnetic state at room temperature manifesting non-negligible interparticle interactions.
The thermal behavior of the magnetization data was further characterized by recording the hysteresis curves at different temperatures, in the range 5 K–300 K (Figure S1). From these data, we represent the saturation magnetization for all the samples as a function of temperature (Figure 3).
The data were fitted with the Bloch equation:
M s ( T ) = M s ( 0 ) 1 ( T T b ) n
where Ms(0) is the saturation at 0 K, Tb is the Bloch temperature, and n is an exponent which, according to Bloch’s law, is 1.5 for bulk magnetic materials. We obtain n values of 1.45, 1.25, and 3.3 for the manganese, nickel, and cobalt ferrites, respectively. While the n is close to Bloch’s law value for the nickel and manganese ferrite, the n value for the cobalt ferrite is more than double. It has been shown that this deviation is quite often observed in the case of nanoparticles and it was attributed to the finite-size effects in nanoparticles [39]. It is interesting to follow the change in the Mr/Ms ratio for all three ferrites (Figure S2). While at low temperature, the highest ratio corresponds to the ”hard” cobalt ferrite (indicating a mixed uniaxial and cubic magnetic anisotropy), at 300 K this ratio is the smallest for the same ferrite.
The Hc dependence on temperature is presented in Figure S3. Any attempt to obtain a reasonable fit with the well-known Kneller’s law, which reads
H c ( T ) = H c ( 0 ) 1 ( T T B ) 1 / 2
where Hc(0) is the coercive field at 0 K, and TB is the blocking temperature, was unsuccessful. Following Equation (3), where in a first approximation the coercive field decreases with the temperature at the power ¾, we represented the Hc values as a function of T3/4 (Figure S4). We noticed that in this kind of representation the data can be fitted with two straight lines for all three ferrites. Enpuku et al. [40] obtained the same type of dependence for Resovist nanoparticles, and they assigned this behavior to the occurrence in the sample of both individual particles and aggregates. At low temperatures, the steep decrease in the coercive field is attributed to the individual nanoparticles and at higher temperatures, the slower decrease of Hc on T was attributed to the aggregates. This hypothesis is consistent with Equation (3), in which the coefficient in front of the temperature is inversely proportional to the volume, and thus smaller MNPs have a steeper dependence on temperature for their coercive field. These results might suggest that all our samples contain both smaller NPs and larger ones with different magnetic behavior. This supposition is consistent with the nonzero coercive field at 300 K for both soft ferrites, which, on the other hand, have both blocking temperature, TB values below 100 K and should be in superparamagnetic state at room temperature.

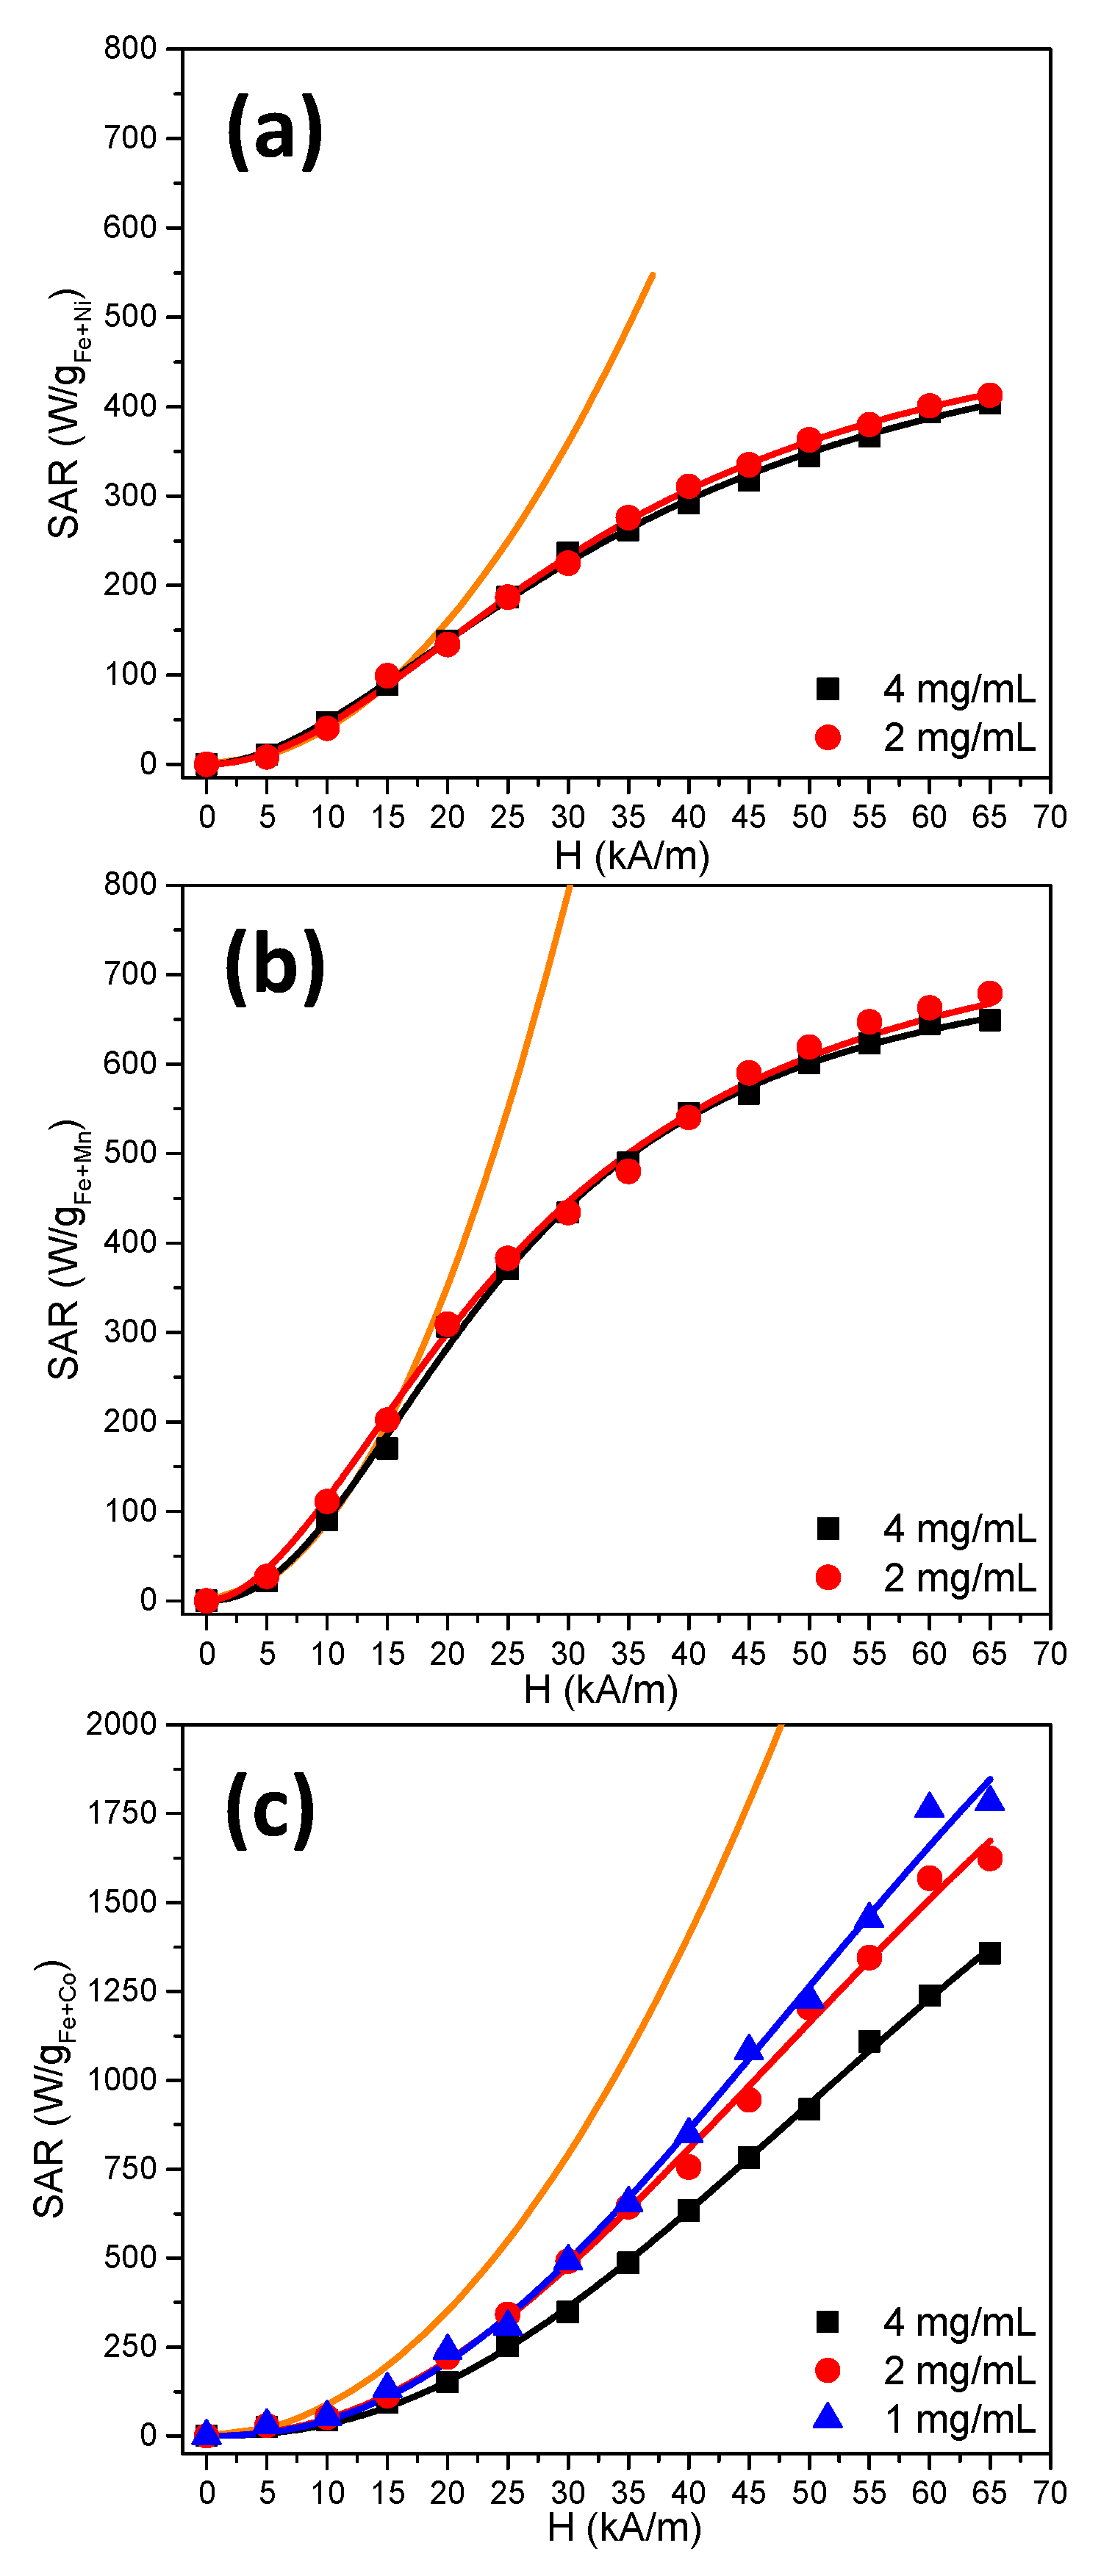
2.3. Hyperthermia Properties

The hyperthermia performances of the MNPs were recorded at a fixed frequency of 355 kHz and with AMF amplitudes varying up to 65 kA/m in steps of 5 kA/m. The SAR values were calculated by fitting the heating curves, temperature as a function of time (Figure S5), with the Box-Lucas equation, as described in the experimental section. The SAR values, recorded at different amplitudes of AMF strength, are shown in Figure 4 for all three samples and different concentrations. As can be observed for all samples, but more obviously for the MnFe2O4 and NiFe2O4 ones, there is a clear tendency of saturation for the SAR values as the AMF amplitude is increased. This type of behavior is characteristic of ferromagnetic nanoparticles with a nonzero hysteresis at the measuring temperature. This is also the case for our samples, which all have a nonzero Hc at room temperature. However, for ion oxide magnetic nanoparticles like magnetite and maghemite of these size ranges (10–14 nm) their heating properties are described in the terms of the Linear Response Theory [13]. In this theory, it is approximated that the magnetization of the nanoparticles depends linearly on the applied magnetic field, the proportionality factor being complex susceptibility.
The volumetric rate of heat release in an alternating magnetic field can be written as [13]:
P = μ 0 π χ f H 2
where f is the frequency and H the amplitude of the alternating magnetic field strength, χ is the imaginary part of the magnetic susceptibility, which is expressed in the terms of Debye relaxation:
χ = χ 0 ω τ 1 + ( ω τ ) 2
with the static susceptibility χ₀ being proportional to the square of the saturation magnetization and the volume of the MNP, τ being the relaxation time, and ω the angular frequency. The relaxation time is the characteristic time needed for the MNPs to follow the changes of the external AMF. Two main relaxation processes are considered to occur when the MNPs are submitted to a variable magnetic field (either an alternating or a rotating one): (i) the Brown relaxation produced by the physical rotation of the MNP as a whole under the influence of the external magnetic field changes, the corresponding relaxation time being directly proportional to the viscosity of the suspending medium and the hydrodynamic volume of the MNPs and inversely proportional to the thermal energy kBT; and (ii) the Neel relaxation, occurring in small, single-domain particles, during which the macroscopic magnetization will tend to vanish after the external magnetic field is shut off due to the thermal agitation when the thermal energy (kBT) surpasses the energy barrier needed to reverse the magnetization given by KeffV, where V is the volume of the nanoparticle and Keff is the magnetic anisotropy constant. When both relaxations occur, the overall relaxation time is calculated as:
1 τ = 1 τ B + 1 τ N
where τB and τN are the Brown and Neel relaxation times, respectively. From Equation (6), it is clear that according to the LRT, the SAR increases with the square of the AMF amplitude (the lines in Figure 4), which is obviously not the case for our samples.
For MNPs in ferromagnetic state other theoretical approaches are used, based on the original model proposed by Stoner and Wohlfarth [19]. In the limit case T = 0, the magnetic nanoparticles with uniaxial symmetry, possess only two orientations possible for the magnetization, the thermal activation is not taken into account. The magnetization of the MNPs can be reversed only by magnetic fields exceeding a critical value Hk. The hysteresis loop is rectangular and the coercive field equals the critical field and the anisotropy field. The area of the hysteresis loop is maximum and gives us the upper limit of the SAR for a given material:
SAR = P / ρ = A f / ρ = 4 μ 0 M s H c f / ρ
where A stands for the area of the hysteresis loop, and ρ is the density. From this equation, it appears that the SAR is proportional to both the Ms and the Hc. The SAR dependence on H is a step function with zero values for H < Hk and a constant value provided by Equation (9) for H > Hk.
In real cases of randomly oriented MNPs, and at higher temperatures, the shape of the hysteresis loop is far from a square. The simplest way to express the SAR in this situation is to multiply the expression in Equation (9) with a dimensionless factor α with values between 0 for and 1, the value 1 corresponding to the ideal square case with al MNPs having the magnetization along the easy axis of magnetization and parallel with the magnetic field. Values as high as 0.46 for α have been obtained for aligned magnetosomes [41]. The SAR dependence on H changes form a step function to a sigmoidal growth function, as the SAR dependence on H is steeper, closer is the model to the ideal one.
In our case, both hysteresis and relaxation processes contribute to heat dissipation. As pointed out by Carrey et al. [41], although the hysteresis and the relaxation losses are treated as distinct phenomena they can be treated within the framework of single dynamic hysteresis theory, and the relaxation processes should not be considered apart from the hysteresis losses. However, within the frame of dynamic hysteresis theory, the shape and size of the hysteresis loop are different from the static hysteresis loop. Moreover, the coercive field Hc, measured in a DC magnetometer, is different from HcHyp, the hyperthermic coercive field, which depends on Hc but also on other parameters, including the arrangement of the particles at the nanoscale and their mobility [23,24]. Because there is no analytical expression to express the SAR in the case of an intermediate regime, usually either numerical methods are employed [42,43] or empirical, phenomenological formulas [23,24,41]. Based on our previous results [23,24,25] we fitted the SAR experimental data with a simple logistic function:
SAR = S A R m a x ( H H c H y p ) n 1 + ( H H c H y p ) n
with:
= n + 1 n 1
where SARmax represents the saturation value of the SAR, HcHyp is the hyperthermia coercive field, the value of the AMF amplitude for which the function presents the highest slope [41] or the magnetic field at which the first derivative of SAR against the amplitude of the AC magnetic field present a maximum [23]. The exponent n indicates how steep the dependence of SAR on the amplitude of the AC magnetic field is, and as n is higher the model is more close to an ideal Stoner Wohlfarth one [19]. The main parameters obtained from these fits are represented in Table 3.
Because the MH experiments have been performed by different groups under different AMF amplitude and frequency conditions, the so-called intrinsic loss power (ILP), defined as:
I L P = S A R H 2 f
which is the SAR value normalized to the frequency and the AMF field amplitude [17], based on Rosensweig LRT (Equation (6)) is commonly used to compare the heating performances of magnetic nanoparticles under different AMF conditions. Because, as can be clearly seen from Figure 4, the SAR dependence on H for our nanoparticles saturates, the ILP values are not constant, decreasing with increasing H (Figure S6), meaning that the ILP is not an intrinsic parameter in our case. For this reason, our data were interpreted based on Equation (10).
Based on an inspection of Figure 4, the maximum heating performance was measured for the cobalt ferrite (1782 W/gFe+Co for H = 65 kA/m and a concentration of 1 mg/mL), followed by the manganese ferrite, with the nickel ferrite presenting the lowest values of SAR. This result is in agreement with the values of Hc and Ms for the three samples, presented in Table 2. Moreover, the HcHyp are also ordered according to the DC values of Hc for the three ferrites. However, while the static Hc values present small differences among the three sets of MNPs, there are large variations in the values of their hyperthermic counterparts with the HcHyp of the cobalt ferrite (48 kA/m) being almost 4 times larger than the value for the manganese ferrite (12 kA/m). We consider that this result is a clear correlation between the hyperthermic behavior and the magnetic “hardness” of the ferrites, the cobalt ferrite being considered “hard” with large Hc values as compared to those of manganese and nickel ferrites, which are considered “soft’’ materials.
There is also a slight variation of HcHyp for different concentrations, in the case of manganese and zinc ferrites, with smaller values at higher concentrations. This type of behavior was also observed for ferromagnetic magnetite and manganese and zinc ferrite nanoparticles dispersed in water [24,25]. This observation might be explained by chain formation by the MNPs under the action of the AMF. At higher concentrations, the closer proximity of the MNPs leads to a higher probability of chain formation. This behavior was also observed for 35 nm magnetite nanoparticles suspended in water, and chain formation was suggested by AC hysteresis, susceptibility, and SAR data [44]. The chain formation by the MNPs leads to an increased anisotropy, but this anisotropy is not related to an individual anisotropy of the individual MNPs but to their collective behavior, more specifically, to the demagnetizing factor of the chain [45]. Other reports have also shown that the changes in magnetic susceptibility data (Ms, Mr, χ) are related to the length of the chains formed by the MNPs [46]. No changes in the HcHyp were observed if the MNPs were immobilized in a solid matrix [24,25], the solid matrix hampering the organization of MNPs in chains. However, in the case of our samples, the change in HcHyp when we pass from 2 mg/mL to 4 mg/mL are relatively small (from 14 kA/m to 12.2 kA/m for manganese ferrite and from 19.6 kA/m to 17.9 kA/m for nickel ferrite) as compared, for example, to the changes in larger (42 nm) magnetite nanoparticles for which the HcHyp changes from 29 kA/m to 21 kA/m if the concentration changes form 2 mg/mL to 0.5 mg/mL [25]. At the same time, no significant changes can be detected for the cobalt ferrite. This behavior might be explained by the differences in the Mr/Ms ratios for the different sets of MNPs. The Mr/Ms has the smallest value for the cobalt ferrite (Table 2) while its value is ~0.3 for magnetite [25]. Moreover, the cobalt ferrite MNPs have the smallest sizes among the ferrites studied and are much smaller than the magnetite NPs. It was suggested that the chain formation is observed when the magnetic energy overcame the thermal energy and for small particles with small remanence, the thermal energy is comparable to the dipolar one, inhibiting the formation of chains [44].
Another interesting result is that the value of the power coefficient n is close to 2 for all samples, but this value is about half from the values measured in larger magnetite or manganese and zinc ferrites (40–80 nm) [24,25], for which the value in water is double. As mentioned above, n is a measure of the squareness of the AC hysteresis loop and the suitability of the model. This low value of n is a clear indication that apart from the hysteresis losses, the relaxation losses have a significant contribution to dynamic hysteresis and they reduce thus its squareness. The concentration dependence of SAR reveals that decreasing concentration leads to an increase in the SARmax values, the largest changes being observed for the cobalt ferrite. This observation is largely accepted in the literature as being due to the decrease in the magnetic dipolar interactions between the MNPs as the concentration decreases. While the SARmax values for the cobalt ferrite are very high (~4000 W/gFe+Co) is to be noted that this value is only a theoretical one and can be eventually reached at AMF strengths above two times the HcHyp, i.e., 100 kA/m. On one hand, technically such high-amplitude magnetic fields at radiofrequency are difficult to obtain, and, on the other hand, such high-amplitude AMF at 355 kHz is far above the safety limit for biomedical applications.

3. Materials and Methods

3.1. Synthesis Method

The following products of analytical grade have been used, without any further purification, for the synthesis of ferrites nanoparticles: iron(III) chloride hexahydrate (FeCl3 6H2O) (Roth, ≥98%), nickel(II) chloride hexahydrate (NiCl2 6H2O) (Roth, ≥98%), manganese(II) chloride tetrahydrate (MnCl2 4H2O) (Roth, ≥98%), cobalt(II) chloride hexahydrate (CoCl2 6H2O) (Roth, ≥98%), polyethylene glycol 200 (PEG 200) (Roth, ≥99%) and sodium acetate trihydrate (NaAc) (Roth, ≥99.5%).
The polyol mediated synthetic route has been employed to synthesize the ferrite MNPs, as follows: 1 mmol of FeCl3 6H2O (0.27 g), 0.5 mmol of NiCl2 6H2O (0.12 g)/MnCl2 4H2O (0.1 g)/CoCl2 6H2O (0.12 g) and 3.6 g of NaAc were mixed and dissolved in 60 mL PEG 200. The three solutions were firstly stirred thoroughly via a magnetic stirrer at 50 °C (500 rot/min, 30 min), then transferred into a home-made stainless steel reaction vessel, and degassed by exposure to a flux of gaseous nitrogen for 5 min, before sealing the reaction vessel using a Teflon gasket and five screws. Finally, the reaction vessel was heated from room temperature to 240 °C in an oven (Nabertherm GmbH, Lilienthal, Germany) equipped with a temperature controller (JUMO dTron 316), with a constant heating rate of 5 °C/min and kept at this temperature for 12 h. After cooling the reaction vessel at room temperature, the black precipitates were magnetically separated from the excess liquid and washed with ethanol/double distilled water, employing multiple ultrasonication/magnetic separation cycles, to remove the excess of ligands and unreacted precursors.

3.2. Characterization Methods

The morphological characterization of ferrite MNPs was realized by transmission electron microscopy (TEM) carried out on a Hitachi HT7700 (Hitachi Ltd., Tokyo, Japan) operating at 100 kV in high contrast mode. The TEM images of ferrite MNPs were recorded with an 8-megapixel CCD camera on carbon-coated copper grids.
X-ray diffraction (XRD) patterns of ferrite MNPs were recorded on a Bruker D8 Advance diffractometer using the Cu Kα radiation. The diffractograms were realized at room temperature on powder samples, obtained by drying the black precipitates in a rota-evaporator, while the FullProf software served to identify the crystalline phases and calculate the lattice parameters.
The direct current (DC) magnetic measurements were carried out using a commercial vibrating sample magnetometer (VSM) produced by Cryogenic Limited (London, UK). The measurements have been performed on powder samples in the temperature interval from 5 K to 300 K and magnetic fields up to 2 T.

3.3. Hyperthermia Measurements

The temperature rise of colloidal suspensions of ferrite MNPs was measured as a function of alternating magnetic fields (AMF) using a commercially available magnetic heating system, Easy Heat 0224, provided by Ambrell (Scottsville, NY, USA). AC magnetic field strengths, generated in the center of an 8-turn coil, were between 5 kA/m and 65 kA/m at a fixed frequency of 355 kHz [36]. The temperature increase as a function of time was measured in an environment, held at a temperature around 25 °C, using a fiber-optic probe, placed in the center of 0.5 mL volume containing MNPs dispersed in water at different concentrations. To ensure colloidal stability and to hamper the formation of big clusters, the MNPs have been treated with tetramethylammonium hydroxide (TMAOH) aqueous solution. Briefly, 20 mg of MNPs have been dispersed in 20 mL of TMAOH aqueous solution (10%), ultrasonicated for 1 h, and left overnight. Subsequently, the MNPs were washed with double distilled water employing three ultrasonication/magnetic separation cycles. Finally, the MNPs were re-dispersed in 5 mL of double distilled water for hyperthermia measurements. Upon this protocol, the TMAOH molecules attach to the IOMNP surface through the OH groups, thus preventing their further agglomeration into big clusters and sedimentation at the bottom of vial [22]. Before performing the set of temperature-vs.-time measurements at each magnetic field strength, the samples were sonicated for 15 s to assure a uniform distribution of the MNPs in the sample volume. The heat performance of MNPs was quantified by the specific absorption rate (SAR), defined as the heat released from a suspension of MNPs in unit time reported to the mass of iron content. For accurate determination of SAR, the heating curves were fitted with the Box-Lucas equation [47]:
Δ T = S m k   ( 1 e k ( t t 0 ) )
where the fitting parameters S m and k are the initial slope of the heating curve and the constant describing the cooling rate, respectively. Therefore, SAR can be calculated according to the following formula:
SAR = c   m   S m m F e + M ( C o ,   M n ,   N i )
where c is the specific heat of the colloid (in our case this was approximated with the specific heat of water, c = 4186.8 J kg   K , the MNPs’ contribution to the specific heat being negligible), m = ρ V is the mass of the colloid, taken as the product between the density ( ρ w a t e r = 0.997 g c m 3 ) and the volume (0.5 mL).

4. Conclusions

Cobalt, manganese, and nickel ferrite with sizes in the range 12–14 nm were successfully synthesized employing a polyol method, using sodium acetate as precipitator. The XRD data revealed that all three ferrites have a spinel structure, the changes in the lattice constant, as compared to magnetite, being explained by the differences in the atomic radii of the cations. The magnetization curves measured at 5 K clearly demonstrate the differences between the “hardness” of the cobalt ferrite, which presents a coercive field almost 2 orders of magnitude higher as compared to the nickel and manganese “soft” counterparts, at 5 K. The saturation magnetization is close to the bulk values for the nickel and cobalt ferrites, while representing only 60% of the bulk value in the case of manganese ferrite, indicating the occurrence of cation vacancies in the latter case. All three samples present a nonzero coercitivity at 300 K and thus at least a part of the MNPs are in a ferromagnetic state.
The heating behavior of the ferrites in large alternating magnetic fields (up to 65 kA/m) cannot be explained within the frame of the Linear Response Theory, with the SAR values saturating at high AMF amplitudes. The SAR data were well fitted with a sigmoidal function. However, our results suggest that the synthesized ferrites are a mixture of both superparamagnetic and ferromagnetic MNPs. The best heating performance was obtained for the cobalt ferrite (1782 W/gFe+Co for H = 65 kA/m), which possesses the highest values for the saturation magnetization and coercive field. These results underscore the important role of these parameters in the heating performance of MNPs. At the same time, the cobalt ferrite presents the highest hypertermic coercive field (48 kA/m). This means that for reaching the SAR saturation values alternating magnetic fields of ~100 kA/m are needed. These values of the AMF, at the used frequency, are above the safety limits for human exposure, making these MNPs less suitable for medical applications.

Supplementary Materials

The following are available online at https://www.mdpi.com/2312-7481/6/2/23/s1, Figure S1: magnetization curves for all three ferrites at different temperatures in the range 5 K–300 K; Figure S2: Mr/Ms ratio dependence on temperature for all three ferrites; Figure S3: Coercive field (Hc) dependence on temperature; Figure S4: Coercive field (Hc) as a function of T3/4; Figure S5: Heating curves T = f(time) for all samples; Figure S6: ILP dependence on H for all three types of MNPs.

Author Contributions

Conceptualization, C.I. and C.M.L.; methodology, C.I., R.I.S. and C.M.L.; software, C.I. and C.M.L.; validation, C.I., R.I.S. and C.M.L.; formal analysis, C.I., G.F.S., R.D. and C.M.L.; investigation, C.I., G.F.S., R.D., N.V. and C.M.L.; resources, C.I.; data curation, C.I., G.F.S., R.D. and C.M.L.; writing—original draft preparation, C.I. and C.M.L.; writing—review and editing, C.I., R.I.S. and C.M.L.; visualization, C.I. and C.M.L.; supervision, R.T., R.I.S. and C.M.L.; project administration, C.I. and R.I.S.; funding acquisition, C.I. and R.I.S. All authors have read and agreed to the published version of the manuscript.

Funding

This research was funded by Romanian National Authority for Scientific Research, CNCSIS-UEFISCDI, through the research project to stimulate young independent teams No. PN-III-P1-1.1-TE-2016-0967 and through research project for exploratory research No. PN-III-P4-ID-PCCF-2016-0112.

Conflicts of Interest

The authors declare no conflict of interest.

References

  1. Hepel, M. Magnetic Nanoparticles for Nanomedicine. Magnetochemistry 2020, 6, 3. [Google Scholar] [CrossRef] [Green Version]
  2. Katz, E. Synthesis, Properties and Applications of Magnetic Nanoparticles and Nanowires—A Brief Introduction. Magnetochemistry 2019, 5, 61. [Google Scholar] [CrossRef] [Green Version]
  3. Bilal, M.; Mehmood, S.; Rasheed, T.; Iqbal, H.M.N. Bio-Catalysis and Biomedical Perspectives of Magnetic Nanoparticles as Versatile Carriers. Magnetochemistry 2019, 5, 42. [Google Scholar] [CrossRef] [Green Version]
  4. Dulinska-Litewk, J.; Lazarczyk, A.; Halubiec, P.; Szafranski, O.; Karnas, K.; Karewicz, A. Superparamagnetic Iron Oxide Nanoparticles—Current and Prospective Medical Applications. Materials 2019, 12, 617. [Google Scholar] [CrossRef] [PubMed] [Green Version]
  5. Popescu, R.C.; Andronescu, E.; Vasile, B.S. Recent Advances in Magnetite Nanoparticle Functionalization for Nanomedicine. Nanomaterials 2019, 9, 1791. [Google Scholar] [CrossRef] [PubMed] [Green Version]
  6. Socoliuc, V.; Peddis, D.; Petrenko, V.I.; Avdeev, M.V.; Susan-Resiga, D.; Szabo, T.; Turcu, R.; Tombacz, E.; Vekas, L. Magnetic Nanoparticle Systems for Nanomedicine—A Materials Science Perspective. Magnetochemistry 2019, 6, 2. [Google Scholar] [CrossRef] [Green Version]
  7. Hosu, O.; Tertis, M.; Cristea, C. Implication of Magnetic Nanoparticles in Cancer Detection, Screening and Treatment. Magnetochemistry 2019, 5, 55. [Google Scholar] [CrossRef] [Green Version]
  8. Bruschi, M.L.; de Toledo, L.D.A.S. Pharmaceutical Applications of Iron-Oxide Magnetic Nanoparticles. Magnetochemistry 2019, 5, 50. [Google Scholar] [CrossRef] [Green Version]
  9. Obaidat, I.M.; Narayanaswamy, V.; Alaabed, S.; Sambasivam, S.; Muralee Gopi, C.V.V. Principles of Magnetic Hyperthermia: A Focus on Using Multifunctional Hybrid Magnetic Nanoparticles. Magnetochemistry 2019, 5, 67. [Google Scholar] [CrossRef] [Green Version]
  10. Obaidat, I.M.; Issa, B.; Haik, J. Magnetic Properties of Magnetic Nanoparticles for Efficient Hyperthermia. Nanomaterials 2015, 5, 63–89. [Google Scholar] [CrossRef] [Green Version]
  11. Gilchrist, R.K.; Medal, R.; Shorey, W.D.; Hanselman, R.C.; Parrot, J.C.; Taylor, C.B. Selective Inductive Heating of Lymph Nodes. J. Ann. Surg. 1957, 146, 596–606. [Google Scholar] [CrossRef]
  12. Maier-Hauff, K.; Ulrich, F.; Nestler, D.; Niehoff, H.; Wust, P.; Thiesen, B.; Orawa, H.; Budach, V.; Jordan, A. Efficacy and safety of intratumoral thermotherapy using magnetic iron oxide nanoparticles combined with external beam radiotherapy on patients with recurrent glioblastoma multiforme. J. Neurooncol. 2011, 103, 317–324. [Google Scholar] [CrossRef] [Green Version]
  13. Rosensweig, R.E. Heating Magnetic Fluid with Alternating Magnetic Field. J. Magn. Magn. Mater. 2002, 252, 370–374. [Google Scholar] [CrossRef]
  14. Glöckl, G.; Hergt, R.; Zeisberger, M.; Dutz, S.; Nagel, S.; Weitschies, W. The Effect of Field Parameters, Nanoparticle Properties and Immobilization on the Specific Heating Power in Magnetic Particle Hyperthermia. J. Phys. Condens. Matter 2006, 18, S2935. [Google Scholar]
  15. Hergt, R.; Dutz, S. Magnetic Particle Hyperthermia-Biophysical Limitations of a Visionary Tumour Therapy. J. Magn. Magn. Mater. 2007, 311, 187–192. [Google Scholar] [CrossRef]
  16. Pineiro, Y.; Vargas, Z.; Rivas, J.; López-Quintela, M.A. Iron Oxide Based Nanoparticles for Magnetic Hyperthermia Strategies in Biological Applications. Eur. J. Inorg. Chem. 2015, 27, 4495–4509. [Google Scholar] [CrossRef]
  17. Blanco-Andujar, C.; Walter, A.; Cotin, G.; Bordeianu, C.; Mertz, D.; Felder-Flesch, D.; Begin-Colin, S. Design of iron oxide-based nanoparticles for MRI and magnetic hyperthermia. Nanomedicine (London) 2016, 11, 1889–1910. [Google Scholar] [CrossRef] [PubMed]
  18. Mohapatra, J.; Xing, M.; Ping Liu, J. Inductive Thermal Effect of FerriteMagneticNanoparticles. Materials 2019, 12, 3208. [Google Scholar] [CrossRef] [Green Version]
  19. Stoner, E.C.; Wohlfarth, E.P. A mechanism of magnetic hysteresis in heterogeneous alloys. Philos. Trans. R. Soc. 1948, A240, 599–642. [Google Scholar] [CrossRef]
  20. Stiufiuc, R.; Iacovita, C.; Lucaciu, C.M.; Stiufiuc, G.; Dutu, A.G.; Braescu, C.; Leopold, N. SERS-active silver colloids prepared by reduction of silver nitrate with short-chain polyethylene glycol. Nanoscale Res. Lett. 2013, 8, 1–5. [Google Scholar] [CrossRef] [Green Version]
  21. Stiufiuc, R.; Iacovita, C.; Nicoara, R.; Stiufiuc, G.; Florea, A.; Achim, M.; Lucaciu, C.M. One-Step Synthesis of PEGylated Gold Nanoparticles with Tunable Surface Charge. J. Nanomater. 2013, 2013, 146031. [Google Scholar] [CrossRef]
  22. Iacovita, C.; Stiufiuc, R.; Radu, T.; Florea, A.; Stiufiuc, G.; Dutu, A.; Mican, S.; Tetean, R.; Lucaciu, C.M. Polyethylene glycol-mediated synthesis of cubic iron oxide nanoparticles with high heating power. Nanoscale Res. Lett. 2015, 10, 1–16. [Google Scholar] [CrossRef] [Green Version]
  23. Iacovita, C.; Florea, A.; Dudric, R.; Pall, E.; Moldovan, A.I.; Tetean, R.; Stiufiuc, R.; Lucaciu, C.M. Small versus Large Iron Oxide Magnetic Nanoparticles: Hyperthermia and Cell Uptake Properties. Molecules 2016, 21, 1357. [Google Scholar] [CrossRef] [PubMed] [Green Version]
  24. Iacovita, C.; Florea, A.; Scorus, L.; Pall, E.; Dudric, R.; Moldovan, A.I.; Stiufiuc, R.; Tetean, R.; Lucaciu, C.M. Hyperthermia, Cytotoxicity, and Cellular Uptake Properties of Manganese and Zinc Ferrite Magnetic Nanoparticles Synthesized by a Polyol-Mediated Process. Nanomaterials 2019, 9, 1489. [Google Scholar] [CrossRef] [PubMed] [Green Version]
  25. Iacovita, C.; Fizesan, I.; Pop, A.; Scorus, L.; Dudric, R.; Stiufiuc, G.; Vedeanu, N.; Tetean, R.; Loghin, F.; Stiufiuc, R.; et al. In Vitro Intracellular Hyperthermia of Iron Oxide Magnetic Nanoparticles, Synthesized at High Temperature by a Polyol Process. Pharmaceutics 2020, 12, 424. [Google Scholar] [CrossRef]
  26. Sabale, S.; Jadhav, V.; Khot, V.; Zhu, X.; Xin, M.; Chen, H. Superparamagnetic MFe2O4 (M = Ni, Co, Zn, Mn) nanoparticles: Synthesis, characterization, induction heating and cell viability studies for cancer hyperthermia applications. J. Mater. Sci. Mater. Med. 2015, 26, 1–9. [Google Scholar] [CrossRef]
  27. Patterson, A.L. The Scherrer formula for X-ray particle size determination. Phys. Rev. 1939, 56, 978–982. [Google Scholar] [CrossRef]
  28. Lee, J.-H.; Huh, Y.-M.; Jun, Y.-W.; Seo, J.-W.; Jang, J.-T.; Song, H.-T.; Kim, S.; Cho, E.-J.; Yoon, H.-G.; Suh, J.-S.; et al. Artificially engineered magnetic nanoparticles for ultra-sensitive molecular imaging. Nat. Med. 2007, 13, 95–99. [Google Scholar] [CrossRef]
  29. Andersen, H.L.; Saura-Múzquiz, M.; Granados-Miralles, C.; Canévet, E.; Lock, N.; Christensen, M. Crystalline and magnetic structure-property relationship in spinel ferrite nanoparticles. Nanoscale 2018, 10, 14902–14914. [Google Scholar] [CrossRef] [Green Version]
  30. Menelaou, M.; Georgoula, K.; Simeonidis, K.; Dendrinou-Samara, C. Evaluation of nickel ferrite nanoparticles coated with oleylamine by NMR relaxation measurements and magnetic hyperthermia. Dalton Trans. 2014, 43, 3626–3636. [Google Scholar] [CrossRef]
  31. Vamvakidis, K.; Sakellari, D.; Angelakeris, M.; Dendrinou-Samara, C. Size and compositionally controlled manganese ferrite nanoparticles with enhanced magnetization. J. Nanopart. Res. 2013, 15, 1–11. [Google Scholar] [CrossRef]
  32. Li, X.-H.; Xu, C.-L.; Han, X.-H.; Qiao, L.; Wang, T.; Li, F.-S. Synthesis and Magnetic Properties of Nearly Monodisperse CoFe2O4 Nanoparticles Through a Simple Hydrothermal Condition. Nanoscale Res. Lett. 2010, 5, 1039–1044. [Google Scholar] [CrossRef] [Green Version]
  33. Demirci Donmez, C.E.; Manna, P.K.; Nickel, R.; Akturk, S.; van Lierop, J. Comparative Heating Efficiency of Cobalt-, Manganese-, and Nickel-Ferrite Nanoparticles for a Hyperthermia Agent in Biomedicines. ACS Appl. Mater. Interfaces 2019, 11, 6858–6866. [Google Scholar] [CrossRef] [PubMed]
  34. Baaziz, W.; Pichon, B.P.; Fleutot, S.; Liu, Y.; Lefevre, C.; Grenache, J.-M.; Toumi, M.; Mhiri, T.; Begin-Colin, S. Magnetic Iron Oxide Nanoparticles: Reproducible Tuning of the Size and Nanosized-Dependent Composition, Defects, and Spin Canting. J. Phys. Chem. C 2014, 118, 3795–3810. [Google Scholar] [CrossRef]
  35. Jiang, J.Z.; Goya, G.F.; Rechenberg, H.R. Magnetic properties of nanostructured CuFe2O4. J. Phys. Condens. Matter 1999, 11, 4063. [Google Scholar] [CrossRef] [Green Version]
  36. Weisz, R.S. Magnetic Anisotropy Constants of Ferromagnetic Spinels. Phys. Rew. 1954, 96, 800–801. [Google Scholar] [CrossRef]
  37. Pacakova, P.; Kubickova, S.; Reznickova, A.; Niznasky, D.; Vejpranova, J. Spinel Ferrite Nanoparticles: Correlation of Structure and Magnetism, Magnetic Spinels—Synthesis, Properties and Applications, Mohindar Singh Seehra; InTech Publishers: London, UK, March 2017; pp. 1–30. ISBN 978-953-51-2974-5. Print ISBN:978-953-51-2973-8. [Google Scholar] [CrossRef] [Green Version]
  38. Yelenich, O.; Solopan, S.; Kolodiazhnyi, T.; Tykhonenko, Y.; Tovstolytkin, A.; Belous, A. Magnetic Properties and AC Losses in AFe2O4 (A = Mn, Co, Ni, Zn) Nanoparticles Synthesized from Nonaqueous Solution. J. Chem. 2015, 2015, 532198. [Google Scholar] [CrossRef] [Green Version]
  39. Nayeb, C.; Manna, K.; Bhattacharjee, G.; Murugavel, P.; Obaidat, I. Investigating Size- and Temperature-Dependent Coercivity and Saturation Magnetization in PEG Coated Fe3O4 Nanoparticles. Magnetochemisty 2017, 3, 19. [Google Scholar]
  40. Enpuku, K.; Elrefai, A.L.; Yoshida, T.; Kahmann, T.; Zong, J.; Viereck, T.; Ludwig, F. Estimation of the effective magnetic anisotropy constant of multi-core based magnetic nanoparticles from the temperature dependence of the coercive field. J. Appl. Phys. 2020, 127, 133903. [Google Scholar] [CrossRef] [Green Version]
  41. Carrey, J.; Mehdaoui, B.; Respaud, M. Simple models for dynamic hysteresis loop calculations of magnetic single-domain nanoparticles: Application to magnetic hyperthermia optimization. J. Appl. Phys. 2011, 109, 083921. [Google Scholar] [CrossRef]
  42. Chen, R.; Christiansen, M.G.; Anikeeva, P. Maximizing hysteretic losses in magnetic ferrite nanoparticles via model-driven synthesis and materials optimization. ACS Nano 2013, 7, 8990–9000. [Google Scholar] [CrossRef] [Green Version]
  43. Christiansen, M.G.; Senko, A.W.; Chen, R.; Romero, G.; Anikeeva, P. Magnetically multiplexed heating of single domain nanoparticles. Appl. Phys. Lett. 2014, 104. [Google Scholar] [CrossRef] [Green Version]
  44. Morales, I.; Costo, R.; Mille, N.; da Silva, G.B.; Carrey, J.; Hernando, A.; de la Presa, P. High-Frequency Hysteresis Losses on γ-Fe2O3 and Fe3O4: Susceptibility as a Magnetic Stamp for Chain Formation. Nanomaterials 2018, 8, 970. [Google Scholar] [CrossRef] [PubMed] [Green Version]
  45. Wetterskog, E.; Johansson, C.; Smilgies, D.M.; Schaller, V.; Johansson, C.; Svedlindh, P. Colossal Anisotropy of the Dynamic Magnetic Susceptibility in Low-Dimensional Nanocube Assemblies. ACS Nano 2018, 12, 1403–1412. [Google Scholar] [CrossRef] [PubMed]
  46. Serantes, D.; Simeonidis, K.; Angelakeris, M.; Chubykalo-Fesenko, O.; Marciello, M.; Morales, M.D.; Baldomir, D.; Martinez-Boubeta, C. Multiplying Magnetic Hyperthermia Response by Nanoparticle Assembling. J. Phys. Chem. C 2014, 118, 5927–5934. [Google Scholar] [CrossRef]
  47. Teran, F.J.; Casado, C.; Mikuszeit, N.; Salas, G.; Bollero, A.; Morales, M.P.; Camarero, V.; Miranda, R. Accurate determination of the specific absorption rate in superparamagnetic nanoparticles under non-adiabatic conditions. Appl. Phys. Lett. 2012, 101, 062413. [Google Scholar] [CrossRef] [Green Version]
Figure 1. Large-scale TEM images, the size distribution histograms fitted to a log-normal distribution (orange lines), and the XRD diffractograms of (a,d,g) nickel, (b,e,h) manganese and (c,f,i) cobalt ferrite MNPs.
Magnetochemistry 06 00023 g001
Figure 2. Magnetic hysteresis loops measured at 5 K and 300 K and zero-field cooling and field cooling magnetization curves for (a,d) NiFe2O4, (b,e) MnFe2O4, and (c,f) CoFe2O4. Insets represent low-field regime hysteresis loops.
Magnetochemistry 06 00023 g002
Figure 3. Saturation magnetizations as a function of temperature for nickel, manganese, and cobalt ferrites. The lines represent the best fits obtained with the Bloch equation.
Magnetochemistry 06 00023 g003
Figure 4. SAR dependence on the amplitude of the magnetic field strength for (a) NiFe2O4, (b) MnFe2O4, and (c) CoFe2O4 dispersed in water at the indicated concentration together with the fits with the logistic function. The orange line in each panel represents the parabolic evolution of SAR with the amplitude of the magnetic field strength according to the Linear Response Theory [13].
Magnetochemistry 06 00023 g004
Table 1. Structural information of ferrite MNPs.
SampleDTEM
(nm)
DXRD
(nm)
A
(Å)
NiFe2O412.9 ± 0.3210.6 ± 2.448.349(9)
MnFe2O413.9 ± 0.1311.5 ± 1.848.450(8)
CoFe2O412.1 ± 0.089.8 ± 1.538.397(9)
Table 2. Magnetic hysteresis parameters of ferrite MNPs.
Sample5 K300 K
Ms (emu/g)Hc (kA/m)Mr (emu/g)Mr/MsMs (emu/g)Hc (kA/m)Mr (emu/g)Mr/MsKeff (kJ/m3)
NiFe2O447.427.75190.4035.79.44.80.138.6
MnFe2O467.322.620.30.3046.310.78.70.199.94
CoFe2O485.592261.50.726811.27.40.11515
Table 3. Fitting results of SAR evolution with AMF amplitude.
Samplec (mg/mL)SARMAX (W/g)HcHyp (kA/m)Power Coefficient n
NiFe2O44541 ± 2317.9 ± 11.8 ± 0.1
2530 ± 1819.6 ± 1.22 ± 0.1
MnFe2O44733 ± 1712.2 ± 0.52.15 ± 0.1
2835 ± 2714 ± 0.71.8 ± 0.1
CoFe2O443175 ± 36648.8 ± 42.3 ± 0.1
23872 ± 90947.1 ± 72.2 ± 0.2
14142 ± 106147.6 ± 72.3 ± 0.2

