Article

Foliar Application of Potassium Mitigates Salinity Stress Conditions in Spinach (Spinacia oleracea L.) through Reducing NaCl Toxicity and Enhancing the Activity of Antioxidant Enzymes

by
Tayyaba Naz
1,2,*,
Muhammad Mazhar Iqbal
3,
Muhammad Tahir
1,2,
Montaser M. Hassan
4,
Muhammad Ishaq Asif Rehmani
5,*,
Mazhar Iqbal Zafar
6,
Umber Ghafoor
7,
Muhammad Akram Qazi
8,
Ayman EL Sabagh
9,* and
Mohamed I. Sakran
10,11
1
Institute of Soil and Environmental Science, University of Agriculture, Faisalabad 38400, Pakistan
2
Saline Agriculture Research Centre, University of Agriculture, Faisalabad 38400, Pakistan
3
Soil and Water Testing Laboratory Chiniot, Ayub Agricultural Research Institute, Department of Agriculture, Government of Punjab, Faisalabad 35400, Pakistan
4
Department of Biology, College of Science, Taif University, P.O. Box 11099, Taif 21944, Saudi Arabia
5
Department of Agronomy, Ghazi University, Dera Ghazi Khan 32200, Pakistan
6
Department of Environmental Sciences, Quaid-i-Azam University, Islamabad 45320, Pakistan
7
Pesticide Residue Laboratory, Kala Shah Kaku 39320, Pakistan
8
Rapid Soil Fertility Survey and Soil Testing Institute, Lahore 53700, Punjab, Pakistan
9
Department of Agronomy, Faculty of Agriculture, Kafrelsheikh University, Kafr El-Shaikh 33516, Egypt
10
Biochemistry Section, Chemistry Department, Faculty of Science, Tanta University, Tanta 31527, Egypt
11
Biochemistry Department, Faculty of Science, University of Tabuk, Tabuk 47512, Saudi Arabia
*
Authors to whom correspondence should be addressed.
Horticulturae 2021, 7(12), 566; https://doi.org/10.3390/horticulturae7120566
Submission received: 9 October 2021 / Revised: 30 November 2021 / Accepted: 3 December 2021 / Published: 9 December 2021
(This article belongs to the Special Issue Abiotic Stress Responses of Vegetable Crops)

Abstract

:
Agronomic biofortification is the purposeful utilization of mineral fertilizers to increase the concentration of desired minerals in edible plant parts for enhancing their dietary intake. It is becoming crucial to enhance the dietary intake of K for addressing hidden hunger and related health issues such as cardiac diseases and hypertension. This study was designed to enhance the potassium concentration in edible parts of spinach through its foliar application under saline environment. The salinity levels of electrical conductivity (EC) = 4, 6, and 8 dS m−1 were applied using sodium chloride (NaCl) along with control. The levels of K for foliar sprays were 5 and 10 mM, along with control. The present experiment was performed under two factorial arrangements in a completely randomized design (CRD). After 60 days of sowing, the crop was harvested. Data regarding growth, ionic, physiological, and biochemical parameters, i.e., shoot dry weight, relative water content, electrolyte leakage, total chlorophyll content, tissue sodium (Na) and K concentration, activities of superoxide dismutase (SOD), and catalase (CAT) were recorded and those were found to be significantly (p ≤ 0.05) affected by foliar application of K on spinach under saline conditions. The highest growth, physiological and biochemical responses of spinach were observed in response to foliar-applied K at 10 mM. It is concluded that agronomic bio-fortification by foliar use of K can be a useful strategy to increase tissue K intakes and minimize Na toxicity in the vegetables studied under saline conditions.

1. Introduction

In arid zones with low precipitation, salinity is a common problem for crop production. Potential hazards linked with salinity are ion imbalances, oxidative stress, biochemical and physical disturbances, nutrient deficiencies, plant sterility, specific ion effects, and osmotic stress which ultimately result in degraded physico-chemical properties of soils and decreased crop yield [1,2]. The high concentrations of Na and chloride (Cl) ions become toxic for plants and affect various processes within them, including photosynthesis reducing growth rate [3]. Deficiency of essential nutrients e.g., K—occurred due to the presence of an excessive number of soluble salts and exchangeable Na in soil which reduce nutrient uptake and negatively affect plant metabolism and activities of many enzymes [4,5,6]. The production of reactive oxygen species (ROS) like hydroxyl radicals, superoxides and hydrogen peroxide are among the significant biochemical responses which occur in the plants subjected to environmental stresses [
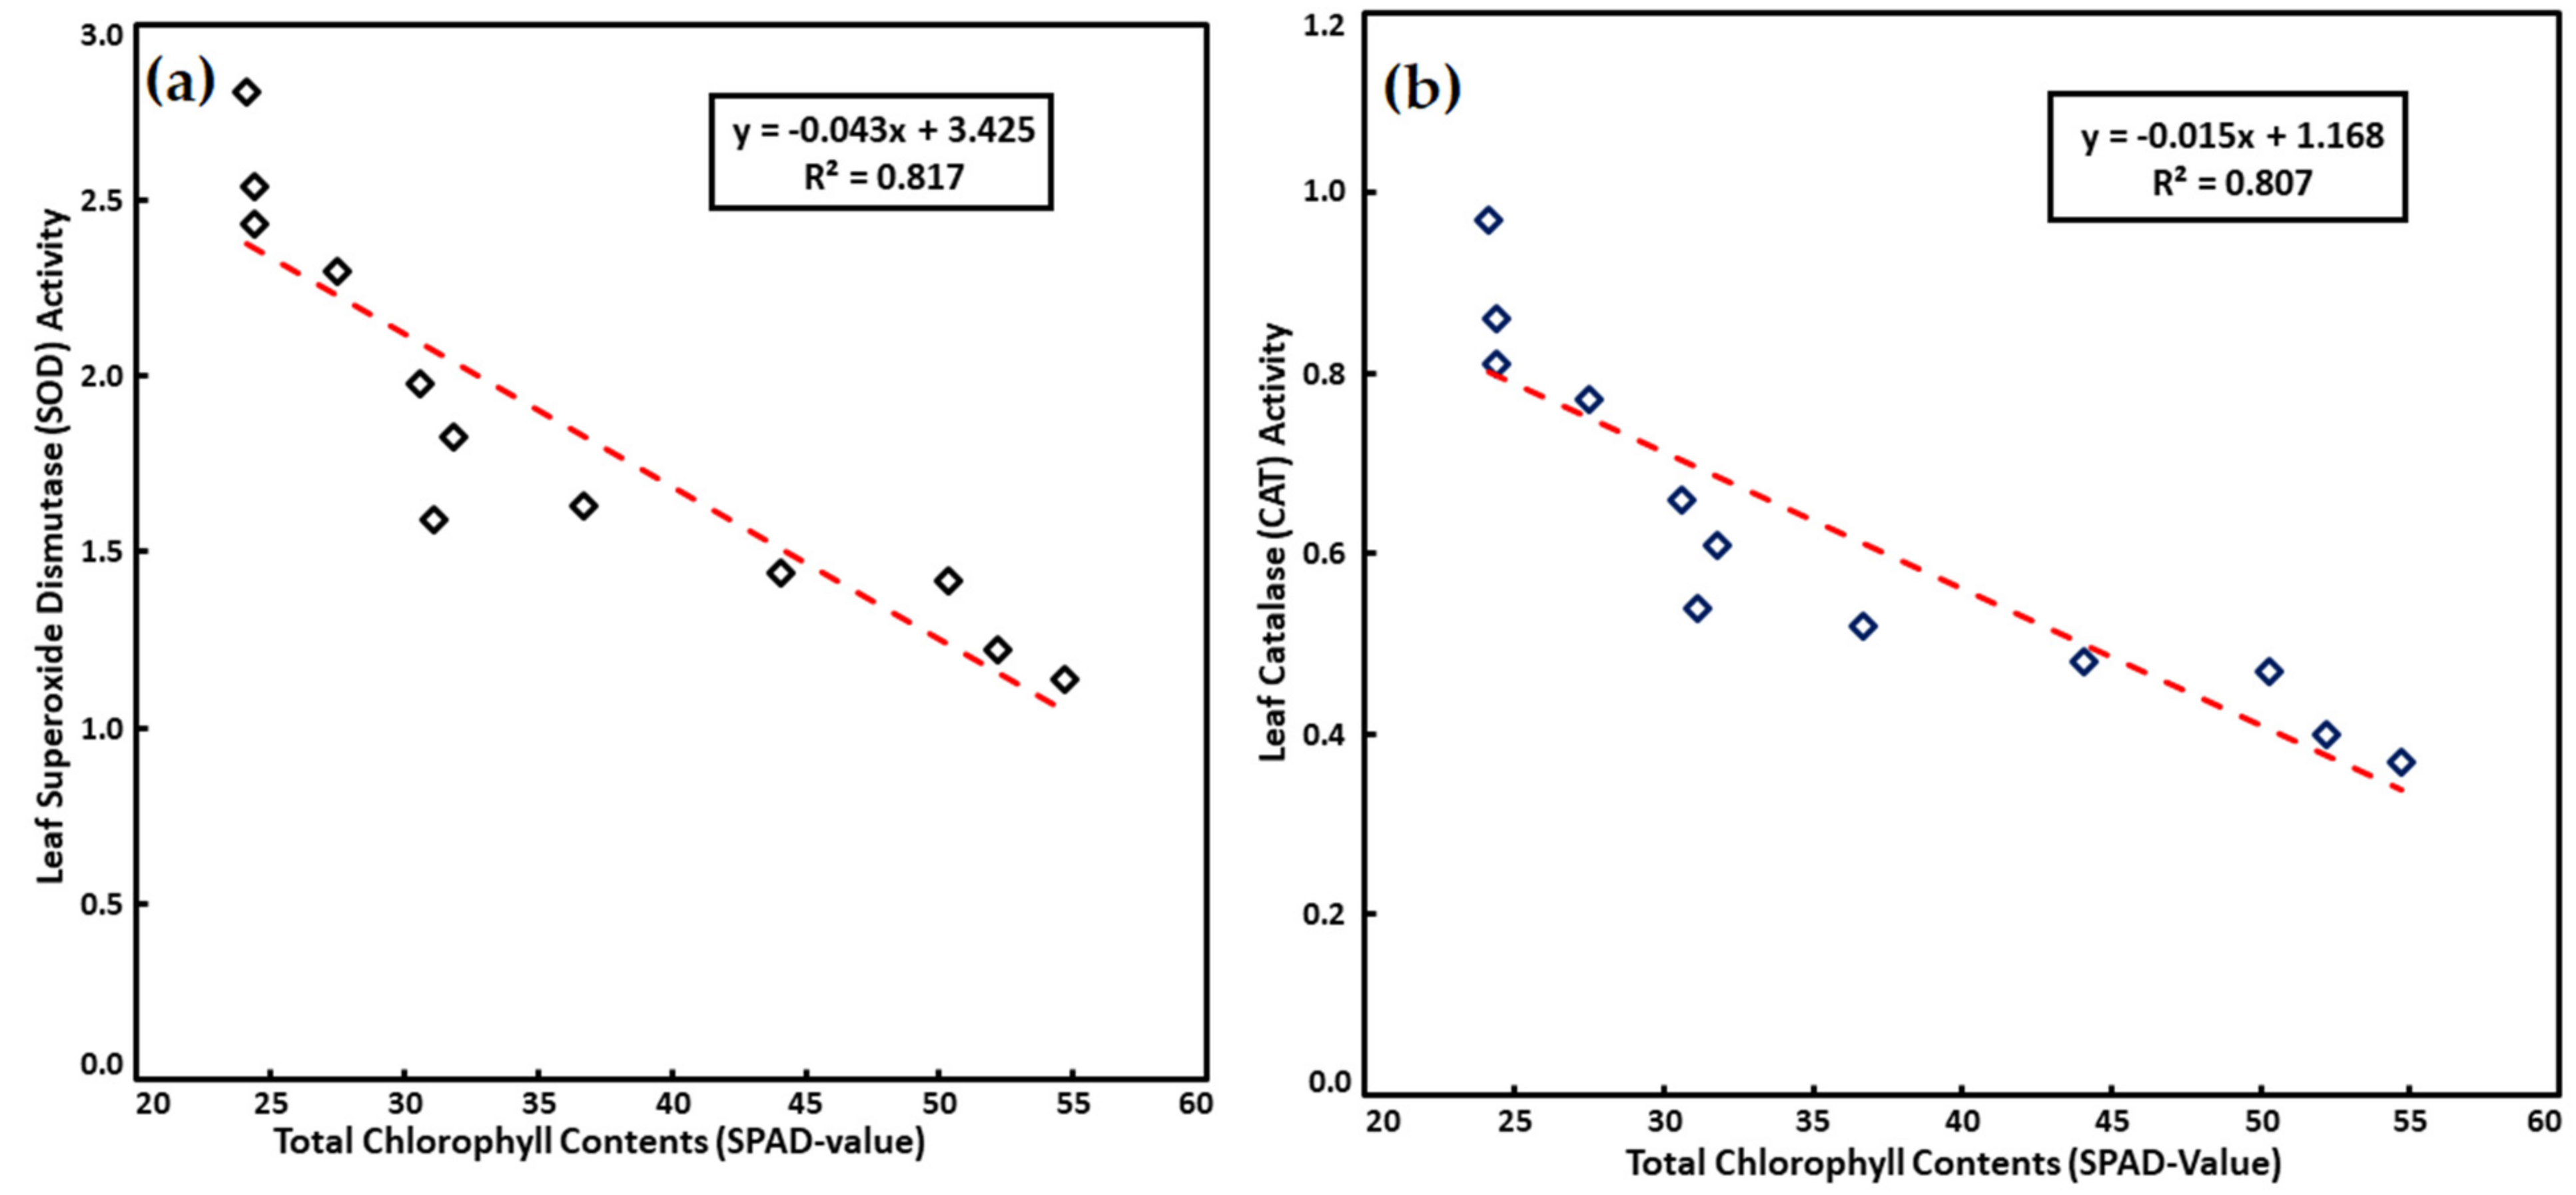
1]. The detrimental effects of ROS are evaded by the operation of an effective scavenging system of plants which consist of antioxidant enzymes such as superoxide dismutase (SOD) and catalase (CAT) [7].
According to the Department of Economics and Social Welfare, United Nations, “The Sustainable Development Goal 2” (SDG 2) aims to “end hunger, by ensuring food security and enhanced nutrition and promoting sustainable agriculture” [8]. Potassium (K), being an important intracellular cation and essential macronutrient for plants is not only required for proper functioning of plant metabolism [9], but also plays a vital role in human health through its nutritional functions [10]. The enrichment of dietary sources with K is becoming increasingly important for the maintenance of acid-base balance, osmotic pressure and water balance [9,11,12]. The heartbeat regulation, neuromuscular activity, protein metabolism and enzyme activation require the presence of sufficient K [13,14]. Insufficient dietary K intake may be responsible for skeletal muscle contraction, poor tissue health, and gastrointestinal dysfunction. Severe deficiency of K is known as hypokalemia, which is associated with glucose intolerance, muscle weakness and cardiac arrhythmias [15]. The non-communicable ailments primarily responsible for morbidity and mortality around the globe can be ameliorated through adequate dietary intake of K [16,17,18]. A daily adequate intake of K is recommended for adults [19], and this can be acquired from K-rich vegetables and fruits such as oranges and spinach [20].
There are several approaches to address the dietary deficiencies of nutrients including supplementation, food fortification, dietary diversification, or agronomic biofortification [21,22]. Among these approaches, the agronomic biofortification of crops results in the enhancement of mineral concentrations in edible plant parts through mineral fertilizers application and is the cheapest and quickest method, having significant additional effects for improving yield on marginal and salt-affected land [17]. Dietary diversification can be achieved not only through the biofortification of staples but also by biofortifying the under-utilized crops, fruits and vegetables [8].
The quality of the crop yield can be improved by K application. The K use increases the salts tolerance of different crops [23]. The K acts as an inorganic compatible solute, Na competitor, acts as an enzyme activator and helps in the synthesis of protein [24]. Under saline conditions, the use of K decreases the adverse effects of salts through osmoregulation, stomatal regulation, homeostasis and maintaining ion balance [25,26].
Foliar application of major nutrients like K and P is proven beneficial in comparison to their soil application. Foliar feeding is relatively non-conventional and new in comparison to conventional methods of application, but is now used to provide primary, secondary, and especially micronutrient supplemental doses, hormones, stimulants, plant growth promoters, and other beneficial substances [27]. As compared to ground application, foliar feeding is 8–20 times more effective in terms of absorption of nutrients [28]. In the agricultural advanced countries, K consumption through foliar application in plants is well acknowledged and is being in practice. Therefore, it is needed to fulfill K requirements by its foliar application particularly in crops grown in saline conditions.
Spinach is an important vegetable and is highly rich in antioxidants and important cellular constituent polyglutamyl folate (vitamin B9 and folic acid) having high nutritional value [29]. Those plants growing under normal conditions when compared with the plants growing under stress can be used to determine the range of harmful effects.
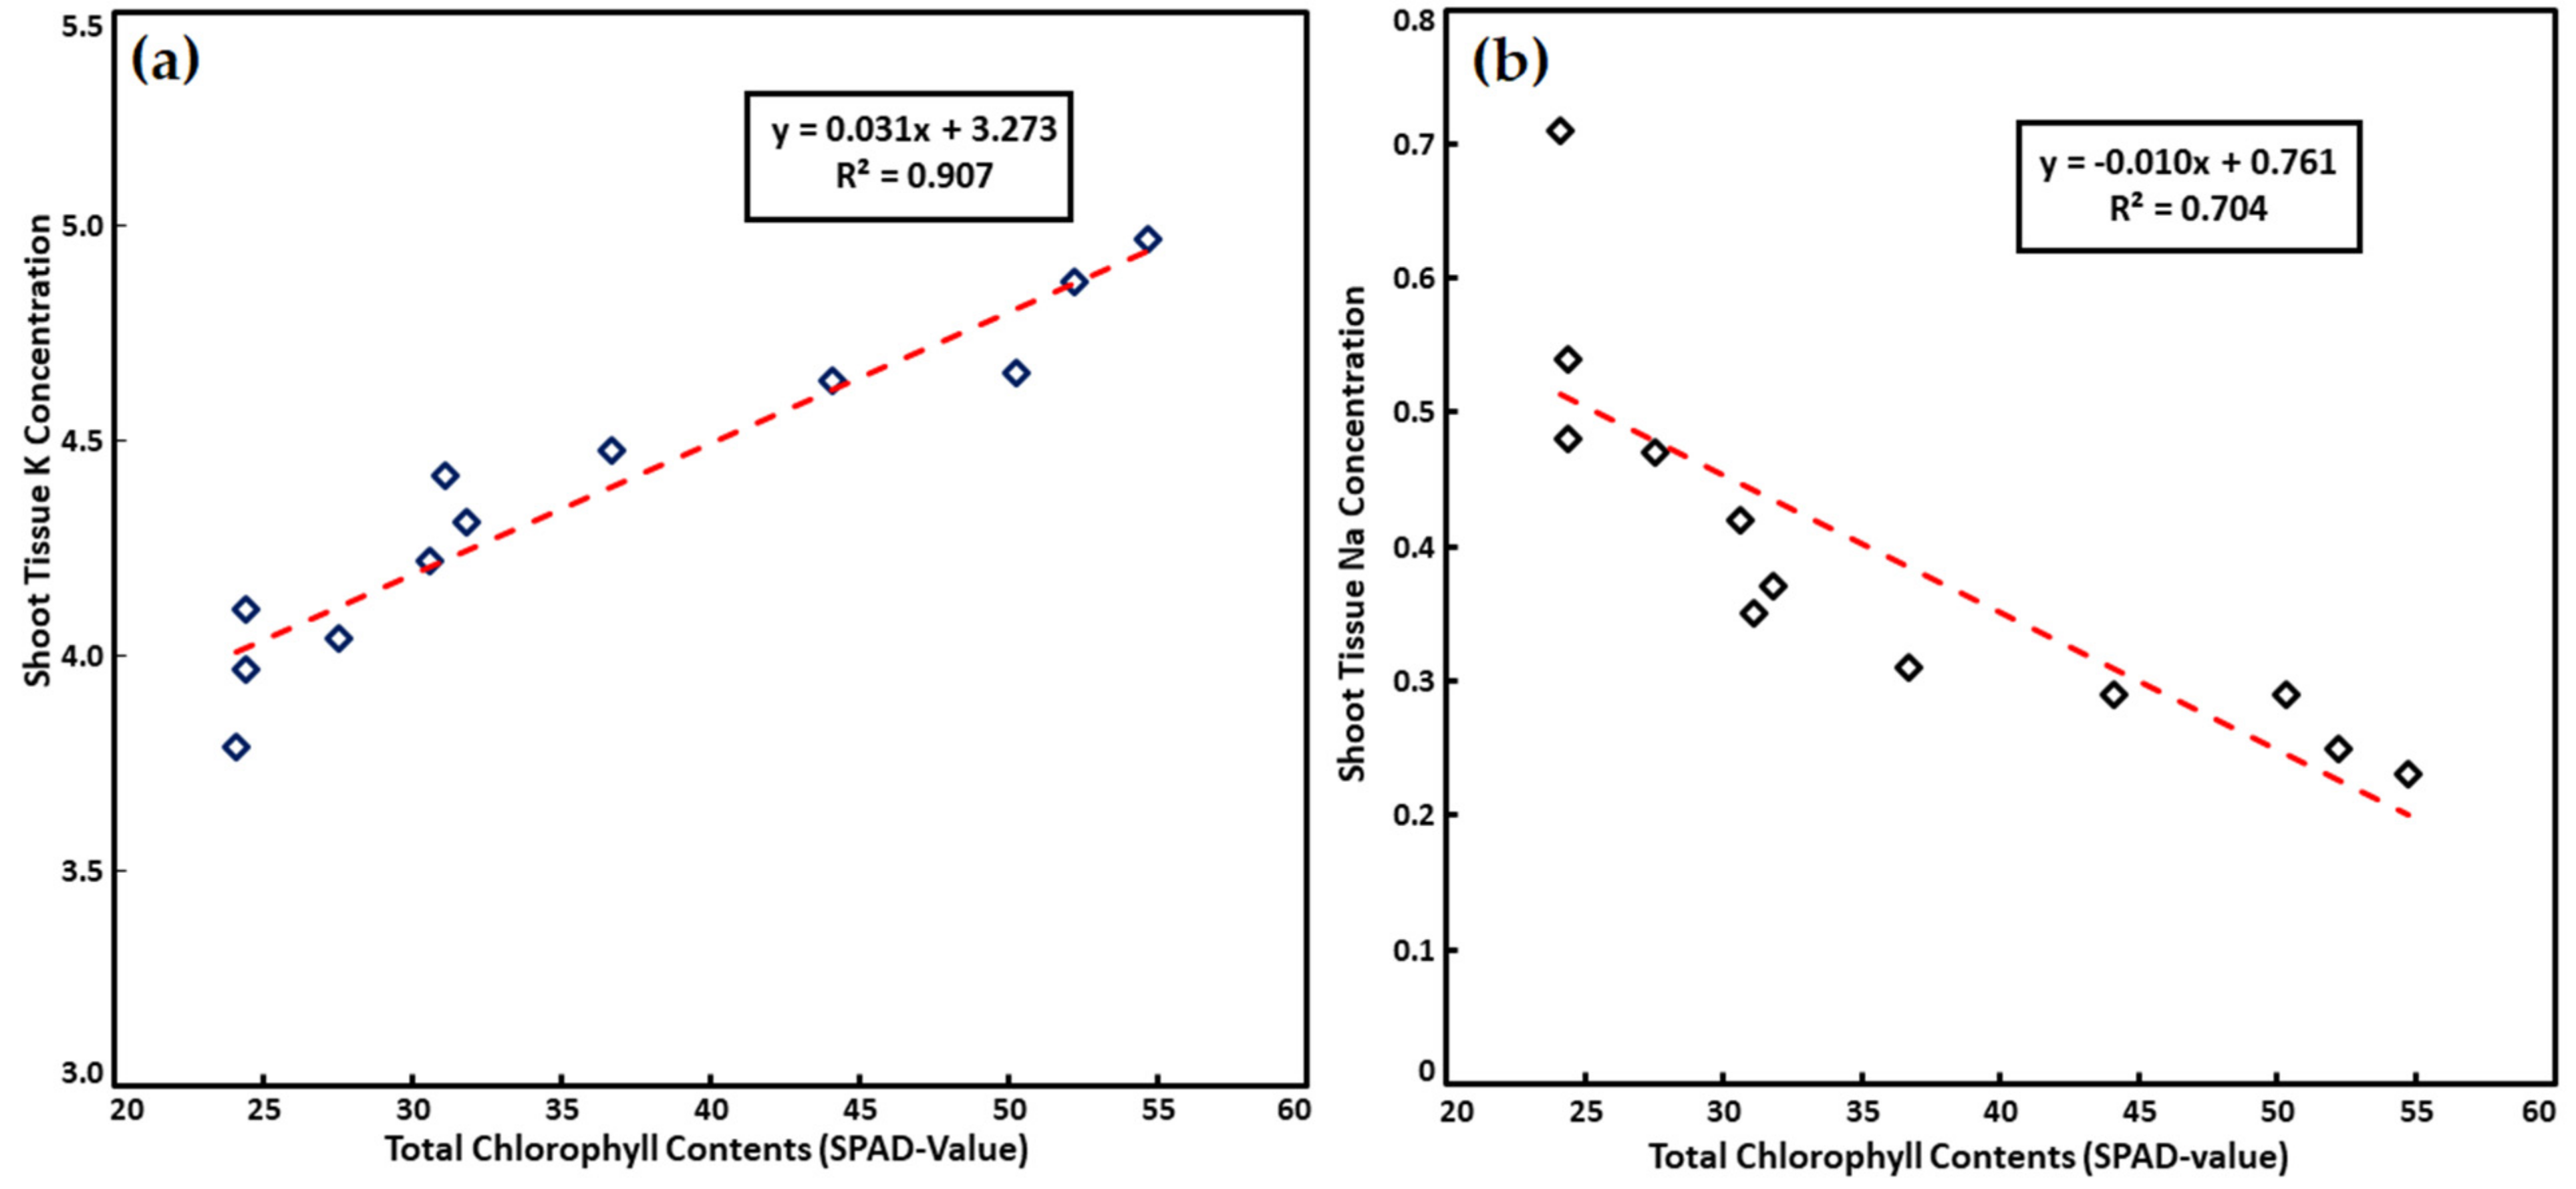
Still, there is very limited information present in the literature about the foliar application of K for the biofortification of spinach. The present study aimed to appraise whether K concentration in a wire house grown spinach could be increased through biofortification by adding an extra amount of foliar-applied K to regular fertilizers under salinity. A secondary aim was to assess the effect of K biofortification on the Na concentration of spin-ach and determine whether increasing the K concentration of spinach results in a reduction in the Na concentration and toxicity due to the competition between these two cations. Therefore, the study was conducted to examine the effects of salinity on tissue concentration of K in spinach and to examine the effects of foliar use of K on the growth of spinach under saline conditions.

2. Materials and Methods

2.1. Experimental Conditions

A pot trial was executed for assessing the effects of foliar-applied K on the spinach (Spinacia oleracea) grown under saline conditions in the wirehouse with a glass-covered roof (sides having only an iron wire screen without control over temperature and humidity) at the Institute of Soil and Environmental Sciences (ISES), University of Agriculture Faisalabad (UAF) (latitude 31.4310° North, longitude 73.0695° East). The recorded average temperature was 25.7 °C and relative humidity was 57.9% during spring seasoned pot study, with day and night temperatures ranging from 18.9 °C (minimum) to 32.6 °C (maximum) in the wirehouse.
The seeds of spinach were obtained from the Vegetable Research Institute, Ayub Agriculture Research Institute, Faisalabad, Pakistan. Soil physical and chemical analysis was done before filling the soil in the pot following Iqbal et al. [30]. Soil used in this study was sandy clay loamy in texture (sand = 58.1%, silt = 19.4% and clay = 22.5%) having pH = 7.6, EC = 2.57 dS m−1, soluble Na+ = 19.02 mmolc L−1, sodium adsorption ratio (SAR) = 7.4 (mmol L−1)1/2, organic matter = 0.91%, nitrogen (N) = 357 mg kg−1, phosphorus (P) = 6.3 mg kg−1, K = 112 mg kg−1 and saturation percentage = 38%.

2.2. Experimental Setup and Layout

This experiment was conducted with two factors (NaCl & foliar application of K) in a completely randomized design (CRD) and each treatment was repeated three times. Three salinity levels were artificially created by adding the calculated amount of NaCl to achieve control (2.57), 4, 6 and 8 dS m−1 EC following Naz, et al. [31]. The foliar application of K on spinach was applied as 0, 5 mM and 10 mM using potassium di-hydrogen phosphate (KH2PO4) salt.
The soil was ground, sieved and filled in 12 kg pots. The recommended dose of NPK fertilizer at 120:60:90 kg ha−1 was used for spinach. In the present study, for foliar application of K at 5 and 10 mM, the 680 and 1360 mg of KH2PO4, respectively, was dissolved in 1000 mL of distilled water, which is the final volume of the working solution (water) per pot. The solubility of KH2PO4 is 22.6 g 100 mL−1 of H2O at 20 °C. The pKa of KH2PO4 is 12.67 up to 25 °C. The specific gravity/density of KH2PO4 is 2.338 g cm−3.
Surfactant (commercial surf; at 1.00 mg L−1) was added to desired levels of K treated spray solution to enhance the adhesion of spray substance to the aerial parts of spinach. The pH of foliar solution was retained at 6.0 ± 0.5 using 1N HCl and 1N NaOH. At the time of foliar spraying, pots were covered all around by polyethylene sheet adhesive tape to avoid the penetration of foliar applied K solution in the soil. The desired levels of K solutions were foliar applied via spray gun from 04:00 p.m. to 06:00 p.m., twice a week as to frontier the sufferers of K by volatilization. Plants in control treatment were sprayed with distilled water.
After two months of sowing, at the harvesting stage, data on growth parameters including shoot fresh and dry weights; physiological parameters like total chlorophyll contents, membrane stability index, relative water content; as well as ionic parameters such as K and Na concentration and biochemical responses i.e., superoxide dismutase and catalase, were recorded.

2.3. Analytical Measurements

2.3.1. Total Chlorophyll Contents

The total chlorophyll content index was examined according to Saqib et al. [32] as Special Products Analysis Division (a SPAD, Division of Minolta) value. A handheld SPAD-502 m (Minolta, Osaka, Japan) was used to measure from leaf base to tip, subsequently, and average value was taken for analysis. It is a low-cost mode to quantify plant photosynthetic capacity compared to the expensive chlorophyll fluorescence [31,33].

2.3.2. Samples Collection

The young leaves of spinach were collected for measuring relative water content, electrolyte leakage, SOD and CAT from 9.00 a.m. to 11.00 a.m. From each replication, the leaves from three plants were collected. The fresh leaf samples were transported in the ice bucket and freshly used for determining the relative water content (RWC) and electrolyte leakage.

2.3.3. Relative Water Contents

Leaf sample (0.5 g fresh weight) was taken immediately after harvesting and immersed in deionized water for four hours. The turgid weight of leaf samples was taken after removing the adhering water on the surface by blotting. The dried weight was recorded after the leaves were oven-dried at 65 °C for forty-eight hours (48 h). Relative water content of leaf samples was determined using Equation (1) [34].
RWC = [(Fresh Weight − Dry Weight)/(Turgid Weight − Dry Weight)] × 100

2.3.4. Electrolyte Leakage

To assess the permeability of membrane, electrolyte leakage is used [35]. Electrical conductivity (EC) meter was used to determine electrolyte leakage. Samples of the plant leaf were taken and cut into segments of 1 cm. After washing with distilled water for removing contamination, the samples were put in vials filled with 10 mL of deionized water and incubated at 25 °C for 24 h on a shaker at 100 rpm. After incubation, the electrical conductivity of the bathing solution (EC1) was recorded. The samples were then placed in an autoclave for 20 min at 120 °C and then the second reading (EC2) was taken. The electrolyte leakage was determined as EC1/EC2 and then expressed as a percentage.

2.3.5. Antioxidant Enzymes Extraction

Fresh leaves (0.1 g) were homogenized in 5 mL of cooled phosphate buffer (50 mM, pH 7.8). The mixture was centrifuged at 15,000 rpm for 20 min at 4 °C. This extract was used to determine the activities of catalase (CAT) and superoxide dismutase (SOD).

2.3.6. Superoxide Dismutase

The SOD was assayed by the nitroblue tetrazolium (NBT) method as described by Gong et al. [36]. The assay ingredients included: enzyme extract (50 µL), 50 µM NBT (1 mL), 1.3 µM Riboflavin (1 mL), 13 mM Methionine (500 µL), 75 mM EDTA (500 µL), 50 mM phosphate buffer pH 7.8 (950 µL).
By using a micropipette all the ingredients were poured in quartz cuvette including enzymes extract and NBT. Immediately after adding enzyme extract and NBT, the cuvette was placed under a 30 W fluorescent lamp for 5 min, after pouring NBT until the formation of blue formazan as a result of NBT photo-reduction. Also, one cuvette containing all other ingredients but lacking enzyme extract was placed in the dark for five minutes. The lamp was switched off and a UV spectrophotometer was used to observe absorbance at 560 nm wavelength. Single SOD unit was described as “the amount of enzyme responsible for causing 50% inhibition of NBT reduction rate at 560 nm in comparison with tubes lacking the enzyme extract”.

2.3.7. Catalase

The method of Cakmak et al. [37] was used to determine the catalase activity. The activity of catalase was recorded by measuring the initial disappearance rate of hydrogen peroxide at 240 nm. The Catalase reaction mixture included: (1) enzyme extract (100 µL), (2) 50 mM phosphate buffer (2 mL at pH 7.0), and (3) 5.9 mM hydrogen peroxide (900 µL).
Subsequently, phosphate buffer, enzyme extract and hydrogen peroxide were dispensed into the cuvette and then placed in UV-spectrophotometer, and readings were taken at 30 s interval for 5 min. The blank was also run by pouring phosphate buffer and H2O2 into the cuvette without enzyme extract. The CAT activity was estimated using the coefficient of extinction.
The activity of CAT was calculated by using Equation (2):
A = lC ε   / mg Protein
where A = Absorbance, l = Distance traveled by light through the body (usually 1 cm), C = Concentration of species that absorbs light in the sample, ε = Molar extinction coefficient (36 mol−1 L cm−1).

2.3.8. Inorganic Ions (Na+, K+)

For determining ionic concentration, the freeze-thaw method was used to collect leaf sap [38]. After thawing, the leaf samples were put into microcentrifuge tubes with an opening at the base for allowing leaf sap to pass into a collection tube. The leaf samples were then crushed, followed by centrifugation at 11,000 rpm for 3 min. The K+ and Na+ in extracted leaf sap were measured using a flame photometer (Sherwood Flame photometer, Model-410; Sherwood Scientifics, Ltd., Cambridge, UK) following the methods described in Estefan et al. [39]. In brief, working standards were prepared of 10, 20, 30, 40, 50 Na and 2, 4, 6, 8, 10 for K, or according to the instrument sensitivity and accuracy using Certified Reference Materials (CRMs) stock solution via Equation (3):
C1V1 = C2V2
whereas C1 = Concentration of the stock solution in ppm, V1 = Volume to be taken of stock solution in mL, C2 = Concentration of Na or K to be required in ppm, V2 = Total volume to be required in mL
C2 (ppm required) = V1 (mL of known solution) × C1 (ppm of known solution)/V2 (Total volume to be made)
Flame photometer was operated according to the instruction manual provided for the equipment. A series of suitable Na or K standards were run to standardize the instrument and calibration curve were drawn. The Na or K concentrations were calculated according to the calibration curves using the Equation (5).
Na or K (ppm) = ppm Na or K (from calibration curve) × V/Wt
where, V = Total volume of the extract (mL), Wt = Weight of dry plant (g).
Later, the ppm values were converted into percent (%) for Na or K to be presented in the respective mean Table(s).

2.3.9. Quality Assurance

The analytical reagent grade (AR grade) chemicals were used. All the solutions were prepared in deionized water for the tests and analytical procedures. All determinations were done in triplicate, and their standard errors (SE) were calculated (values in tables). All the extracts were preserved in the dark at 4 °C.

2.3.10. Statistical Analysis

The Fisher analysis of variance technique [40] was used to analyze the collected statistically. The Least Significance Difference (LSD) test was employed for the comparison of treatment means at 5% probability level.

3. Results and Discussion

3.1. Shoot Dry Weight

The shoot dry weight (SDW) of spinach was significantly (p ≤ 0.05) reduced by salinity, which was counteracted by foliar-applied K (Table 1). Under saline environments, SDW reduced and a reduction 8.3, 24.2 and 45.2% was found at 4, 6 and 8 dS m−1, respectively, in comparison to control. Foliar usage of 5 and 10 mM K significantly (p ≤ 0.05) improved SDW of spinach and the maximum SDW (24.5 g) was observed with 10 mM K foliar spray in control conditions where no salinity was imposed, and it was 53.2% higher than the respective control. The foliar application of K at 10 mM resulted in 57.6, 39.8 and 65.8% enhancement in SDW at 4, 6 and 8 dS m−1 NaCl salinity in comparison with respective control. The least SDW was 8.7 g visualized when no K was applied at 8 dS m−1 salinity level.
The outcomes of previous research conducted by Sumithra et al. [41] and Nxele et al. [42] support the present study results. The monitored decrease in biomass might be a result of specific ion effects, osmotic stress, and ionic imbalance as Na+ reduces the absorption of K+. Plant development and growth were reduced by salt-stressed environment; as a result, overall salt stress negatively affected the plant dry biomass [43]. However, the supplementary K application as foliar spray enhanced the dry biomass. It has been established that the total dry mass production of plat under drought and salt stress increases with an adequate supply of K fertilizer compared to its deficient concentrations [44]. Similar findings were stated by Amjad et al. [45] in tomato where the foliar application of K enhanced the biomass production under saline conditions. Foliar application of KOH in sunflower improved the yield and growth significantly along with reduction of toxic influences of salt stress [46]. The supplementary K application as foliar spray enhanced the growth of cucumber and pepper cultivars under salt stress [47].

3.2. Potassium Concentration in Spinach Leaves

In the present study, under saline environment, K concentration significantly (p ≤ 0.05,) declined and there was 5.1, 13.3 and 18.6% decrease in K concentration in spinach leaves at 4, 6 and 8 dS m−1, respectively, without K supplementation as foliar spray percent reduction (Table 2). The foliar supplementation of K at 5 and 10 mM enhanced leaf K concentration by 4.3 and 6.2%, respectively, under the non-saline situation. The foliar application of K also proved useful under saline conditions for enhancing leaf K concentration. Under saline conditions, the foliar spray of K at 10 mM enhanced leaf K concentration by 4.9%, 6.6% and 8.5% (% DW) at 4, 6 and 8 dS m−1 NaCl toxicity correspondingly. At a salinity level of 8 dS m−1, the minimum leaf K concentration was observed, which was 18.6% less than the control with no foliar K application.
Comprehending the salinity-nutrient relationships is of vast economic significance since nutrients may offer protective mechanisms against salinity stress by lowering ion toxicity via dilution effect, competitive ion uptake and involvement with osmotic adjustment, retaining ion balance and scavenging of ROS under saline environment [25]. Increased salinity caused a decline in leaf K concentration [28,29]. The significance of K for osmotic adjustment cannot be denied, so plants uptake it in the required amount [24]. However, conditions become unfavorable for plants in saline soil. The Na competes with K as they both have similar ionic radius that causes deficiency of K, along with the accumulation of Na [6,10]. Ali et al. [48] stated that foliar usage of SO4 form of K gave better straw yield and paddy, K content of paddy and straw and number of tillers.

3.3. Sodium Concentration in Spinach Leaves

It was witnessed that foliar-applied K significantly (p ≤ 0.05) reduced NaCl toxicity in spinach leaves. The Na+ concentration was increased in response to saline conditions. Na+ an increase in leaf Na+ concentration of 20.6, 62.0 and 144.8% was observed at 4, 6 and 8 dS m−1, respectively, with no usage of foliar K (Table 3). However, a decrease in Na concentration was observed with increasing dose of foliar-applied K under normal, as well as saline, conditions. The highest Na+ concentration (0.71% DW) was observed at 8 dS m1 without K application as foliar spray. However, Na+ concentration was 0.29, 0.37 and 0.48 (% DW) was observed at 4, 6 and 8 dS m−1 respectively with K level of 10 mM which indicated that K application at 10 mM reduced Na concentration in spinach leaves by 17.1, 21.2 and 32.3% at 4, 6 and 8 dS m−1, respectively, in comparison to respective control.
Sairam et al. [49] and Nguyen et al. [50] also reported that an increase in soil salinity increases the leaf Na concentration. Plants develop mineral ion homeostasis to counteract stress, and the replacement of K+ by Na+ can lead to alternations in the result and lack of proteins functionality along with ion cytotoxicity. The Na concentration disturbs intracellular homeostasis, which leads to inhibition of metabolic activity, membrane instability and other harmful alternations, as an outcome declined growth, as well as the occurrence of cell death [5,51,52]. However, it can be implicit that increasing K concentration in the vegetable can be beneficial metabolically to alleviate the adverse effects of Na consumption [53,54]. The present study accomplished that the negative effects of high Na intake can be mitigated through the consumption of K-rich vegetables.

3.4. Potassium/Sodium Ratio Relationship for Bio-Fortified Spinach

By increasing K concentration, a significant (p ≤ 0.05) improvement in K: Na ratio of leaf was observed (Table 4). It was detected that K/Na ratio declined and there were 21.1, 47.2 and 66.4% decreases in K/Na ratio at 4, 6 and 8 dS m−1, respectively, as compared to respective control under saline conditions with no K application as foliar spray. The maximum K/Na ratio was 21.6, observed in treatment where 10 mM K was applied as foliar spray in control conditions, while the lowest K/Na ratio was 5.4 at a salinity concentration of 8 dS m−1 when no foliar K was used. However, the application of foliar K (10 mM) under saline conditions enhanced K/Na ratio by 28.3, 36.4 and 57.4%, respectively, at 0, 4, 6 and dS m−1 over respective control.
In glycophytic plants, a declined K+: Na+ proportion is the utmost frequently detected concern of Na+-stress. The major reason for decline of K concentration in cells may be due to the reason that Na+ hinders K+ influx into the cell [55,56]. Yet, Na+ leading to the stimulation of K+ efflux may be another potential cause. Salt stress causes membrane depolarization due to high Na+ influx into the cytoplasm of cells leading to efflux of cytosolic K+ [57]. It has been revealed that K+ efflux is enhanced by the osmotic stress established by non-ionic osmolytes. Yet, various qualitative upshots of non-ionic and ionic osmolytes on K+ transportation have been visualized in barley root and bean leaf [58]. Membrane disintegration caused as a result of osmotically hampered loss of water from cells may lead to accelerated K+ efflux by osmotic stress. In an investigation, it was found that both ionic and osmotic elements were responsible for K+ efflux [12]. The K+ equilibrium is upset via reduced influx, elevated efflux, and declined cytosolic K+ collections under high Na+ concentrations [55]. The results of Chow et al. [59] also supported the present results. Replacement of K by Na results in ion cytotoxicity and alternations, along with a lack of protein functionality [51]. Under a saline environment, Na accumulation in plant parts occur as Na competes with K, and K deficiency occurs as well [6].

3.5. Total Chlorophyll Contents

The foliar K levels significantly (p ≤ 0.05) influenced total chlorophyll content in spinach leaves (Table 5). It was observed that when K was not applied as foliar spray, total chlorophyll contents declined by 38.1, 45.3 and 52.0%, respectively, at 4, 6 and 8 dS m−1 as compared to control under a saline environment. The minimum value of total chlorophyll content (24.1 SPAD value) was observed when K was not applied as foliar spray at 8 dS m−1. However, the K supplementation as foliar spray in saline conditions resulted in enhancement of total content.
Figure 1 Correlation shows the significance level for shoot Na and K concentration and with total chlorophyll contents (SPAD-value) as affected by foliar application of K on spinach plants exposed to varying levels of salt stress, Shoot Na concentration in spinach leaves increased with increasing SPAD values; however, shoot tissue Na concentration was inversely linked with SPAD values (Figure 1a,b). Membrane and chlorophyll damage were visualized in tomatoes under saline conditions, which was lowered by foliar application of KH2PO4 [60]. The toxic ion consequences of salt on fruit formation in bottle gourd (Lagenaria siceraria) was decreased along with an increase in production by 77% after foliar usage of 250 ppm KNO3 under salt stress [61]. Under salt stress, spraying of foliar of KOH on sunflower amplified K+ concentration along with significant growth and yield elevation [46]. The present study results align with the findings for cucumber, pepper [47], tomato [60], spinach [62] and cotton [63].

3.6. Relative Water Content

By increasing salt stress (Table 6) levels, the RWC of spinach declined significantly (p ≤ 0.05). The outcomes highlighted that in saline situation at 8 dS m−1 without foliar K, the RWC was reduced by 19.78% as compared to control. The foliar application of K enhanced RWC in saline conditions. An increase of 6.7 and 9.34% was found at 8 dS m−1 with foliar supplementation of K at 5 and 10 mM, respectively, as compared to respective control. The foliar application of K enhanced RWC in saline conditions. An increase of 6.7 and 9.34% was found at 8 dS m−1 with foliar supplementation of K at 5 and 10 mM, respectively, as compared to respective control.
Relative water content and electrolyte leakage are generally influenced by salinity and considered as important criteria for evaluation of the plant capability to tolerate salinity stress [64,65]. Decline in RWC under NaCl stress might be linked to salt-induced reduction in water potential in rhizosphere, which lowers the water extraction ability of the plant from soil, exporting it to aerial plant parts [66]. Sairam et al. [49] visualized similar results in wheat. They tested wheat RWC against saline environment and illustrated that RWC was decreased by rising salinity [67]. Under higher levels of salinity, plants showed significant reduction in RWC [68,69].

3.7. Electrolyte Leakage

There was a significant (p ≤ 0.05) increase in electrolyte leakage in spinach in response to salt stress (Table 7). The salt stress was responsible for 60, 118.1 and 225.2% enhancement in electrolyte leakage, respectively, at 4, 6 and 8 dS m−1 as compared to control. At 8 dS m−1 the highest electrolyte leakage (32.2%) was observed, while minimum electrolyte leakage was found in non-saline condition when K was applied as foliar spray at 10 mM. Moreover, in saline conditions, increasing level of foliar supplementation of K reduced electrolyte leakage and a reduction of 17.6, 21.3 and 31.68% was observed with 10 mM K application as foliar spray at 4, 6 and 8 dS m−1, respectively, over respective control. Electrolyte leakage is generally used to assess membrane permeability. Salinity-induced electrolyte leakage is already reported in different plant species [70], including tomato [60] and spinach [62].

3.8. Activity of Superoxide Dismutase

Under high level of salinity, the activity of SOD tended to grow substantially (p ≤ 0.05) at all salinity levels (Table 8). The percent increase in SOD was 11.9, 61.9 and 97.8% at 4, 6 and 8 dS m−1 correspondingly compared to control. However, increasing levels of foliar K application resulted in decreased SOD activity. There was 9.4, 20.4 and 13.5% reduction in SOD activity at K level of 10 mM and salinity of 4, 6 and 8 dS m−1, respectively, over respective control.
The CAT and SOD are counted as the front-line defense enzymes that decrease cellular damage in plants and detoxify ROS [2,31]. Esfandiari et al. [71] inspected that as the concentration of NaCl tends to increase the SOD activity in two wheat cultivators. The ROS caused membrane damage and a decline in oxidative stress was found due to better SOD activity. The superoxide level tended to increase as an outcome of saline conditions.
Foliar application of K behaves as an antioxidant substance, which protects the photosynthetic machinery under stress condition through abolishing the excessively reactive oxygen species (ROS). Thus, it enhances the resistance and controlled the concentration of ROS within the tissues of plants under stress conditions [27,45].

3.9. Activity of Catalase

The catalase (CAT) activity increased statistically (p ≤ 0.05) with increasing salinity level (Table 9). The percent rise in CAT activity was noted to be 14.8, 63.8 and 106.3% at 4, 6 and 8 dS m−1 compared to control. The greatest CAT (0.97 µmol g−1 FW) was observed at 8 dS m−1 salinity. The applied K as foliar spray reduced the activity of CAT. The CAT activity was 0.37, 0.48, 0.61 and 0.81 µmol g−1 FW with 10 mM K foliar application at control, 4, 6 and 8 dS m−1 salinity levels.
Barakat et al. [72] discovered that CAT activity was significantly enhanced in pot grown wheat in response to salinity. Similarly, it has been reported that concentrations of SOD and CAT were increased in spinach plants subjected to salinity stress [73]. The CAT and SOD are the vital antioxidant enzyme that alters hydrogen peroxide (H2O2) to water. The activities of antioxidant enzymes in plants exposed to biotic and abiotic stresses indicate the tolerance ability of plant species against stresses.
Leaf SOD activity in spinach leaves decreased with increasing SPAD values, similarly, CAT activity in spinach leaves also showed inverse linkage with SPAD values (Figure 2a,b). In the current study the antioxidant enzymes (SOD and CAT) activity was reduced in treatments where sufficient K nutrition was applied. It has been suggested that the ROS production can be decreased to a greater extent with the improved status of K nutrition in plants as improving K nutrition helps reduce activity of NAD(P)H oxidases and maintains photosynthetic electron transport; as a result, the activity of antioxidant enzymes reduces with K application [25,74].

4. Conclusions

Outcomes of the present study indicated that diverse levels of salinity significantly affected the physiological and growth of spinach, whereas a significant improvement in morphological, physiological and antioxidant characteristics in spinach plant were observed under different levels of foliar applied K in salinity. It was recognized that dietary deficiency of essential elements can be quickly addressed by agronomic biofortification. It is an economical and eco-friendly approach to additionally provide essential minerals to the population with commonly used vegetables, fruits and cereals. Moreover, it enhances plant growth and improves quality of produce in salt-affected soils. The present study indicates that K is beneficial for improving the yields by mitigating the Na toxicity in spinach. The results showed that agronomic biofortification of spinach with K results in its enhanced nutritional level through the improved K concentration in the edible portion. This provides an efficient way not only for addressing some health and nutritional challenges, but also for improving incomes and livelihoods of masses. The present research is practical and novel in its proposed scientific approach and objectives. However, the present study outcomes required to be established in field test and economic feasibility must be calculated.

Author Contributions

Conceptualization and methodology, T.N. and M.M.I.; validation and formal analysis, M.T., T.N. and M.M.I.; resources and data curation, T.N., M.M.I. and M.I.Z.; writing—original draft preparation, T.N. and M.M.I.; writing—review and editing, M.M.H., A.E.S., M.I.S., M.I.A.R., U.G. and M.I.Z.; supervision, T.N., M.M.I. and M.A.Q.; visualization and funding acquisition, M.M.H., M.I.A.R. and M.M.H. All authors have read and agreed to the published version of the manuscript.

Funding

The authors thank Taif University Researchers Supporting Project number (TURSP-2020/119), Taif University, Taif, Saudi Arabia for providing financial support.

Institutional Review Board Statement

Not applicable.

Informed Consent Statement

Not applicable.

Data Availability Statement

All obtained data is enclosed with this manuscript.

Acknowledgments

The authors extend their appreciation to the Researchers Supporting Project number (TURSP-2020/119), Taif University, Taif, Saudi Arabia for providing financial support. Authors are greatly gratified to Higher Education Commission of Pakistan for provision of funds under NRPU project to T.N. Assistance of staff of SARC, ISES University of Agriculture Faisalabad, Pakistan is highly appreciated.

Conflicts of Interest

The authors declare no conflict of interest.

References

  1. Saddiq, M.S.; Iqbal, S.; Hafeez, M.B.; Ibrahim, A.M.H.; Raza, A.; Fatima, E.M.; Baloch, H.; Jahanzaib, A.; Woodrow, P.; Ciarmiello, L.F. Effect of Salinity Stress on Physiological Changes in Winter and Spring Wheat. Agronomy 2021, 11, 1193. [Google Scholar] [CrossRef]
  2. Askari-Khorasgani, O.; Rehmani, M.I.A.; Wani, S.H.; Kumar, A. Osmotic Stress: An Outcome of Drought and Salinity. In Handbook of Plant and Crop Physiology; CRC Press: New York, NY, USA, 2021; pp. 445–464. [Google Scholar] [CrossRef]
  3. Mukhtar, I.; Shahid, M.A.; Khan, M.W.; Balal, R.M.; Iqbal, M.M.; Naz, T.; Zubair, M.; Ali, H.H. Improving salinity tolerance in chili by exogenous application of calcium and sulphur. Soil Environ. 2016, 35, 56–64. [Google Scholar]
  4. Bello, S.K.; Alayafi, A.H.; AL-Solaimani, S.G.; Abo-Elyousr, K.A.M. Mitigating Soil Salinity Stress with Gypsum and Bio-Organic Amendments: A Review. Agronomy 2021, 11, 1735. [Google Scholar] [CrossRef]
  5. Uçgun, K.; Ferreira, J.F.S.; Liu, X.; da Silva Filho, J.B.; Suarez, D.L.; Lacerda, C.F.d.; Sandhu, D. Germination and Growth of Spinach under Potassium Deficiency and Irrigation with High-Salinity Water. Plants 2020, 9, 1739. [Google Scholar] [CrossRef]
  6. Ferreira, J.F.S.; da Silva Filho, J.B.; Liu, X.; Sandhu, D. Spinach Plants Favor the Absorption of K+ over Na+ Regardless of Salinity, and May Benefit from Na+ When K+ is Deficient in the Soil. Plants 2020, 9, 507. [Google Scholar] [CrossRef] [PubMed] [Green Version]
  7. Yasir, T.A.; Khan, A.; Skalicky, M.; Wasaya, A.; Rehmani, M.I.A.; Sarwar, N.; Mubeen, K.; Aziz, M.; Hassan, M.M.; Hassan, F.A.S.; et al. Exogenous Sodium Nitroprusside Mitigates Salt Stress in Lentil (Lens culinaris Medik.) by Affecting the Growth, Yield, and Biochemical Properties. Molecules 2021, 26, 2576. [Google Scholar] [CrossRef]
  8. Adu, M.O.; Asare, P.A.; Yawson, D.O.; Nyarko, M.A.; Osei-Agyeman, K. Agronomic biofortification of selected underutilised solanaceae vegetables for improved dietary intake of potassium (K) in Ghana. Heliyon 2018, 4, e00750. [Google Scholar] [CrossRef] [PubMed] [Green Version]
  9. Sardans, J.; Peñuelas, J. Potassium Control of Plant Functions: Ecological and Agricultural Implications. Plants 2021, 10, 419. [Google Scholar] [CrossRef] [PubMed]
  10. Dar, J.S.; Cheema, M.A.; Rehmani, M.I.A.; Khuhro, S.; Rajput, S.; Virk, A.L.; Hussain, S.; Bashir, M.A.; Alghanem, S.M.; Al-Zuaibr, F.M.; et al. Potassium fertilization improves growth, yield and seed quality of sunflower (Helianthus annuus L.) under drought stress at different growth stages. PLoS ONE 2021, 16, e0256075. [Google Scholar] [CrossRef]
  11. Prasad, R.; Shivay, Y.S. Agronomic biofortification of plant foods with minerals, vitamins and metabolites with chemical fertilizers and liming. J. Plant Nutr. 2020, 43, 1534–1554. [Google Scholar] [CrossRef]
  12. Wang, Y.; Chen, Y.-F.; Wu, W.-H. Potassium and phosphorus transport and signaling in plants. J. Int. Plant Biol. 2021, 63, 34–52. [Google Scholar] [CrossRef] [PubMed]
  13. McDonough, A.A.; Youn, J.H. Potassium Homeostasis: The Knowns, the Unknowns, and the Health Benefits. Physiology 2017, 32, 100–111. [Google Scholar] [CrossRef]
  14. Kumar, P.; Kumar, T.; Singh, S.; Tuteja, N.; Prasad, R.; Singh, J. Potassium: A key modulator for cell homeostasis. J. Biotechnol. 2020, 324, 198–210. [Google Scholar] [CrossRef]
  15. Krogager, M.L.; Søgaard, P.; Torp-Pedersen, C.; Bøggild, H.; Lee, C.J.-Y.; Bonde, A.; Thomassen, J.Q.; Gislason, G.; Pareek, M.; Kragholm, K. Impact of plasma potassium normalization on short-term mortality in patients with hypertension and hypokalemia or low normal potassium. BMC Cardiovasc. Disord. 2020, 20, 386. [Google Scholar] [CrossRef] [PubMed]
  16. Kumssa, D.B.; Joy, E.J.M.; Broadley, M.R. Global Trends (1961–2017) in Human Dietary Potassium Supplies. Nutrients 2021, 13, 1369. [Google Scholar] [CrossRef]
  17. Rauber, F.; Da Costa Louzada, M.L.; Steele, E.M.; Millett, C.; Monteiro, C.A.; Levy, R.B. Ultra-Processed Food Consumption and Chronic Non-Communicable Diseases-Related Dietary Nutrient Profile in the UK (2008–2014). Nutrients 2018, 10, 587. [Google Scholar] [CrossRef] [Green Version]
  18. Bolton, K.A.; Trieu, K.; Woodward, M.; Nowson, C.; Webster, J.; Dunford, E.K.; Bolam, B.; Grimes, C. Dietary Intake and Sources of Potassium in a Cross-Sectional Study of Australian Adults. Nutrients 2019, 11, 2996. [Google Scholar] [CrossRef] [Green Version]
  19. W.H.O. Guideline: Potassium Intake for Adults and Children; World Health Organization: Geneva, Switzerland, 2012. [Google Scholar]
  20. Campbell, S. Dietary reference intakes: Water, potassium, sodium, chloride, and sulfate. Clin. Nutr. Insight 2004, 30, 1–4. [Google Scholar]
  21. Harding, K.L.; Aguayo, V.M.; Webb, P. Hidden hunger in South Asia: A review of recent trends and persistent challenges. Public Health Nutr. 2018, 21, 785–795. [Google Scholar] [CrossRef] [PubMed] [Green Version]
  22. Sharma, P.; Aggarwal, P.; Kaur, A. Biofortification: A new approach to eradicate hidden hunger. Food Rev. Int. 2017, 33, 1–21. [Google Scholar] [CrossRef]
  23. Zhu, Y.-X.; Gong, H.-J.; Yin, J.-L. Role of Silicon in Mediating Salt Tolerance in Plants: A Review. Plants 2019, 8, 147. [Google Scholar] [CrossRef] [Green Version]
  24. Zelm, E.v.; Zhang, Y.; Testerink, C. Salt Tolerance Mechanisms of Plants. Annu. Rev. Plant Biol. 2020, 71, 403–433. [Google Scholar] [CrossRef] [Green Version]
  25. Kumari, S.; Chhillar, H.; Chopra, P.; Khanna, R.R.; Khan, M.I.R. Potassium: A track to develop salinity tolerant plants. Plant Physiol. Biochem. 2021, 167, 1011–1023. [Google Scholar] [CrossRef] [PubMed]
  26. Wakeel, A. Potassium–sodium interactions in soil and plant under saline-sodic conditions. J. Plant Nutr. Soil Sci. 2013, 176, 344–354. [Google Scholar] [CrossRef]
  27. Adhikari, B.; Dhungana, S.K.; Kim, I.-D.; Shin, D.-H. Effect of foliar application of potassium fertilizers on soybean plants under salinity stress. J. Saud. Soc. Agric. Sci. 2020, 19, 261–269. [Google Scholar] [CrossRef]
  28. Anil, V.S.; Krishnamurthy, P.; Kuruvilla, S.; Sucharitha, K.; Thomas, G.; Mathew, M.K. Regulation of the uptake and distribution of Na+ in shoots of rice (Oryza sativa) variety Pokkali: Role of Ca2+ in salt tolerance response. Physiol. Plant. 2005, 124, 451–464. [Google Scholar] [CrossRef]
  29. Singh, J.; Jayaprakasha, G.K.; Patil, B.S. Extraction, Identification, and Potential Health Benefits of Spinach Flavonoids: A Review. In Advances in Plant Phenolics: From Chemistry to Human Health; American Chemical Society: Washington, DC, USA, 2018; Volume 1286, pp. 107–136. [Google Scholar] [CrossRef]
  30. Iqbal, M.M.; Murtaza, G.; Naz, T.; Hussain, A.; Button, M.; Du Laing, G. Pb fractionation and redistribution as affected by applied inorganic amendments under different soil moisture regimes and incubation time in saline–sodic Pb-polluted paddy soil. Paddy Water Environ. 2018, 16, 875–885. [Google Scholar] [CrossRef]
  31. Naz, T.; Alihtar, J.; Iqbal, M.M.; Anwar-ul-Haq, M.; Murtaza, G.; Niazi, N.K.; Farooq, O.; Ali, M.; Dell, B. Assessment of gas exchange attributes, chlorophyll contents, ionic composition and antioxidant enzymes of bread wheat genotypes in boron toxic, saline and boron toxic-saline soils. Int. J. Agric. Biol. 2019, 21, 1271–1281. [Google Scholar] [CrossRef]
  32. Saqib, Z.A.; Akhtar, J.; Ul-Haq, M.A.; Ahmad, I.; Bakhat, H.F. Rationality of using various physiological and yield related traits in determining salt tolerance in wheat. Afr. J. Biotechnol. 2012, 11, 3558–3568. [Google Scholar] [CrossRef]
  33. Wei, G.; Rehmani, M.I.A.; Xiong, J.; Ding, Y.; Wang, S. A simple tillering model for irrigated japonica rice based on measured relative SPAD for lower reaches of Yangtze River Delta, China. Int. J. Agric. Biol. 2013, 15, 48–54. [Google Scholar]
  34. Hafeez, Y.; Iqbal, S.; Jabeen, K.; Shahzad, S.; Jahan, S.; Rasul, F. Effect of biochar application on seed germination and seedling growth of Glycine max (l.) Merr. Under drought stress. Pak. J. Bot. 2017, 49, 7–13. [Google Scholar]
  35. Kaya, C.; Higgs, D. Short-term relationships between membrane permeability and growth parameters in three tomato cultivars grown at low and high zinc. J. Plant Nutr. 2000, 23, 1373–1383. [Google Scholar] [CrossRef]
  36. Gong, H.; Zhu, X.; Chen, K.; Wang, S.; Zhang, C. Silicon alleviates oxidative damage of wheat plants in pots under drought. Plant Sci. 2005, 169, 313–321. [Google Scholar] [CrossRef]
  37. Cakmak, I.; Strbac, D.; Marschner, H. Activities of Hydrogen Peroxide-Scavenging Enzymes in Germinating Wheat Seeds. J. Exp. Bot. 1993, 44, 127–132. [Google Scholar] [CrossRef]
  38. Gorham, J.; Bridges, J.; Dubcovsky, J.; Dvorak, J.; Hollington, P.A.; Luo, M.C.; Khan, J.A. Genetic analysis and physiology of a trait for enhanced K+/Na+ discrimination in wheat. New Phytol. 1997, 137, 109–116. [Google Scholar] [CrossRef]
  39. Estefan, G.; Sommer, R.; Ryan, J. Methods of Soil, Plant, and Water Analysis: A Manual for the West Asia and North Africa Region, 3rd ed.; ICARDA (International Center for Agricultural Research in the Dry Areas): Beirut, Lebanon, 2013. [Google Scholar]
  40. Steel, R.G.; Torrie, J.H.; Dickey, D. Principles and Procedures of Statistics: A Biometrical Approach, 3rd ed.; McGraw-Hill: New York, NY, USA, 1997. [Google Scholar]
  41. Sumithra, K.; Jutur, P.P.; Carmel, B.D.; Reddy, A.R. Salinity-induced changes in two cultivars of Vigna radiata: Responses of antioxidative and proline metabolism. Plant Growth Regul. 2006, 50, 11–22. [Google Scholar] [CrossRef]
  42. Nxele, X.; Klein, A.; Ndimba, B.K. Drought and salinity stress alters ROS accumulation, water retention, and osmolyte content in sorghum plants. S. Afr. J. Bot. 2017, 108, 261–266. [Google Scholar] [CrossRef]
  43. Shoukat, E.; Ahmed, M.Z.; Abideen, Z.; Azeem, M.; Ibrahim, M.; Gul, B.; Khan, M.A. Short and long term salinity induced differences in growth and tissue specific ion regulation of Phragmites karka. Flora 2020, 263, 151550. [Google Scholar] [CrossRef]
  44. Pandey, G.K.; Mahiwal, S. Potassium in Abiotic Stress. In Role of Potassium in Plants; Springer International Publishing: Cham, Switzerland, 2020; pp. 45–49. [Google Scholar] [CrossRef]
  45. Amjad, M.; Akhtar, J.; Haq, M.A.U.; Imran, S.; Jacobsen, S.-E. Soil and foliar application of potassium enhances fruit yield and quality of tomato under salinity. Turk. J. Biol. 2014, 38, 208–218. [Google Scholar] [CrossRef]
  46. Akram, M.S.; Athar, H.; Ashraf, M. Improving growth and yield of sunflower (Helianthus annuus L.) by foliar application of potassium hydroxide (KOH) under salt stress. Pak. J. Bot. 2007, 39, 769–776. [Google Scholar]
  47. Kaya, C.; Kirnak, H.; Higgs, D. Effects of supplementary potassium and phosphorus on physiological development and mineral nutrition of cucumber and pepper cultivars grown at high salinity (NaCl). J. Plant Nutr. 2001, 24, 1457–1471. [Google Scholar] [CrossRef]
  48. Ali, A.; Salim, M.; Zia, M.; Mahmood, I.; Shahzad, A. Performance of rice as affected by foliar application of different K fertilizer sources. Pak. J. Agric. Sci. 2005, 42, 38–41. [Google Scholar]
  49. Sairam, R.K.; Rao, K.V.; Srivastava, G.C. Differential response of wheat genotypes to long term salinity stress in relation to oxidative stress, antioxidant activity and osmolyte concentration. Plant Sci. 2002, 163, 1037–1046. [Google Scholar] [CrossRef]
  50. Nguyen, H.T.T.; Shim, I.S.; Kobayashi, K.; Usui, K. Effects of salt stress on ion accumulation and antioxidative enzyme activities of Oryza sativa L. and Echinochloa oryzicola Vasing. Weed Biol. Manag. 2005, 5, 1–7. [Google Scholar] [CrossRef]
  51. Kamran, M.; Parveen, A.; Ahmar, S.; Malik, Z.; Hussain, S.; Chattha, M.S.; Saleem, M.H.; Adil, M.; Heidari, P.; Chen, J.-T. An Overview of Hazardous Impacts of Soil Salinity in Crops, Tolerance Mechanisms, and Amelioration through Selenium Supplementation. Int. J. Mol. Sci. 2020, 21, 148. [Google Scholar] [CrossRef] [PubMed] [Green Version]
  52. Alnusairi, G.S.H.; Mazrou, Y.S.A.; Qari, S.H.; Elkelish, A.A.; Soliman, M.H.; Eweis, M.; Abdelaal, K.; El-Samad, G.A.; Ibrahim, M.F.M.; ElNahhas, N. Exogenous Nitric Oxide Reinforces Photosynthetic Efficiency, Osmolyte, Mineral Uptake, Antioxidant, Expression of Stress-Responsive Genes and Ameliorates the Effects of Salinity Stress in Wheat. Plants 2021, 10, 1693. [Google Scholar] [CrossRef] [PubMed]
  53. Liu, F.; Zhang, R.; Zhang, W.; Zhu, L.; Yu, Q.; Liu, Z.; Zhang, Y.; Pan, S.; Wang, Y.; Chu, C.; et al. Potassium supplementation blunts the effects of high salt intake on serum retinol-binding protein 4 levels in healthy individuals. J. Diabetes Investig. 2021, 12, 658–663. [Google Scholar] [CrossRef] [PubMed]
  54. Huang, L.; Neal, B.; Wu, J.H.Y.; Huang, Y.; Marklund, M.; Campbell, N.R.C.; He, F.J.; Yoshimura, S.; Chalmers, J.; Trieu, K. The impact of baseline potassium intake on the dose–response relation between sodium reduction and blood pressure change: Systematic review and meta-analysis of randomized trials. J. Hum. Hypertens. 2021, 35, 946–957. [Google Scholar] [CrossRef]
  55. Hameed, A.; Ahmed, M.Z.; Hussain, T.; Aziz, I.; Ahmad, N.; Gul, B.; Nielsen, B.L. Effects of Salinity Stress on Chloroplast Structure and Function. Cells 2021, 10, 2023. [Google Scholar] [CrossRef] [PubMed]
  56. Ulfat, M.; Athar, H.U.R.; Khan, Z.D.; Kalaji, H.M. RNAseq Analysis Reveals Altered Expression of Key Ion Transporters Causing Differential Uptake of Selective Ions in Canola (Brassica napus L.) Grown under NaCl Stress. Plants 2020, 9, 891. [Google Scholar] [CrossRef] [PubMed]
  57. Demidchik, V. Mechanisms and physiological roles of K+ efflux from root cells. J. Plant Physiol. 2014, 171, 696–707. [Google Scholar] [CrossRef] [PubMed]
  58. Chen, Z.; Newman, I.; Zhou, M.; Mendham, N.; Zhang, G.; Shabala, S. Screening plants for salt tolerance by measuring K+ flux: A case study for barley. Plant Cell Environ. 2005, 28, 1230–1246. [Google Scholar] [CrossRef]
  59. Chow, W.; Ball, M.; Anderson, J. Growth and Photosynthetic Responses of Spinach to Salinity: Implications of K+ Nutrition for Salt Tolerance. Funct. Plant Biol. 1990, 17, 563–578. [Google Scholar] [CrossRef]
  60. Kaya, C.; Kirnak, H.; Higgs, D. Enhancement of growth and normal growth parameters by foliar application of potassium and phosphorus in tomato cultivars grown at high (NaCl) salinity. J. Plant Nutr. 2001, 24, 357–367. [Google Scholar] [CrossRef]
  61. Ahmad, R.; Jabeen, R. Foliar spray of mineral elements antagonistic to sodium-a technique to induce salt tolerance in plants growing under saline conditions. Pak. J. Bot. 2005, 37, 913. [Google Scholar]
  62. Kaya, C.; Higgs, D.; Kirnak, H. The effects of high salinity (NaCl) and supplementary phosphorus and potassium on physiology and nutrition development of spinach. Bulg. J. Plant Physiol. 2001, 27, 47–59. [Google Scholar]
  63. Leidi, E.O.; Saiz, J.F. Is salinity tolerance related to Na accumulation in Upland cotton (Gossypium hirsutum) seedlings? Plant Soil 1997, 190, 67–75. [Google Scholar] [CrossRef]
  64. Win, K.T.; Aung, Z.O.; Hirasawa, T.; Ookawa, T.; Yutaka, H. Genetic analysis of Myanmar Vigna species in responses to salt stress at the seedling stage. Afr. J. Biotechnol. 2011, 10, 1615–1624. [Google Scholar] [CrossRef]
  65. Abdelaal, K.A.; EL-Maghraby, L.M.; Elansary, H.; Hafez, Y.M.; Ibrahim, E.I.; El-Banna, M.; El-Esawi, M.; Elkelish, A. Treatment of Sweet Pepper with Stress Tolerance-Inducing Compounds Alleviates Salinity Stress Oxidative Damage by Mediating the Physio-Biochemical Activities and Antioxidant Systems. Agronomy 2020, 10, 26. [Google Scholar] [CrossRef] [Green Version]
  66. Ashraf, M.; Shahzad, S.M.; Imtiaz, M.; Rizwan, M.S.; Iqbal, M.M. Ameliorative effects of potassium nutrition on yield and fiber quality characteristics of cotton (Gossypium hirsutum L.) under NaCl stress. Soil Environ. 2017, 36, 51–58. [Google Scholar] [CrossRef]
  67. El-Bassiouny, H.M.; Bekheta, M. Effect of salt stress on relative water content, lipid peroxidation, polyamines, amino acids and ethylene of two wheat cultivars. Int. J. Agric. Biol. 2005, 7, 363–368. [Google Scholar]
  68. Sheldon, A.R.; Dalal, R.C.; Kirchhof, G.; Kopittke, P.M.; Menzies, N.W. The effect of salinity on plant-available water. Plant Soil 2017, 418, 477–491. [Google Scholar] [CrossRef]
  69. Shah, T.; Latif, S.; Saeed, F.; Ali, I.; Ullah, S.; Abdullah Alsahli, A.; Jan, S.; Ahmad, P. Seed priming with titanium dioxide nanoparticles enhances seed vigor, leaf water status, and antioxidant enzyme activities in maize (Zea mays L.) under salinity stress. J. King Saud Univ. Sci. 2021, 33, 101207. [Google Scholar] [CrossRef]
  70. Hniličková, H.; Hnilička, F.; Orsák, M.; Hejnák, V. Effect of salt stress on growth, electrolyte leakage, Na+ and K+ content in selected plant species. Plant Soil Environ. 2019, 65, 90–96. [Google Scholar] [CrossRef] [Green Version]
  71. Esfandiari, E.; Shakiba, M.R.; Mahboob, S.A.; Alyari, H.; Toorchi, M. Water stress, antioxidant enzyme activity and lipid peroxidation in wheat seedling. J. Food Agric. Environ. 2007, 5, 149–153. [Google Scholar]
  72. Barakat, N.; Laudadio, V.; Cazzato, E.; Tufarelli, V. Antioxidant potential and oxidative stress markers in wheat (Triticum aestivum) treated with phytohormones under salt-stress condition. Int. J. Agric. Biol. 2013, 15, 843–849. [Google Scholar]
  73. Eraslan, F.; Inal, A.; Pilbeam, D.J.; Gunes, A. Interactive effects of salicylic acid and silicon on oxidative damage and antioxidant activity in spinach (Spinacia oleracea L. cv. Matador) grown under boron toxicity and salinity. Plant Growth Regul. 2008, 55, 207. [Google Scholar] [CrossRef]
  74. Hasanuzzaman, M.; Bhuyan, M.H.M.B.; Nahar, K.; Hossain, M.S.; Mahmud, J.A.; Hossen, M.S.; Masud, A.A.C.; Moumita, A.; Fujita, M. Potassium: A Vital Regulator of Plant Responses and Tolerance to Abiotic Stresses. Agronomy 2018, 8, 31. [Google Scholar] [CrossRef] [Green Version]
Figure 1. Correlation showing significance level for shoot (a) Na and (b) K concentration and with total chlorophyll contents (SPAD-value) as affected by foliar application of K on spinach in salt stress.
Horticulturae 07 00566 g001
Figure 2. Correlation showing significance level for leaf (a) SOD & (b) CAT activity and with total chlorophyll contents (SPAD-value) as affected by foliar application of K on spinach plants exposed to varying levels of salt stress.
Horticulturae 07 00566 g002
Table 1. Impact of Foliar Application of K on Shoot Dry Weight (g pot−1) of Spinach Plants Exposed to varying Concentrations of Salt Stress.
Salinity Levels (dS m−1)Foliar K Levels
K0 (0 mM K)K5 (5 mM K)K10 (10 mM K)Mean
Control15.99 ± 0.48 cde18.19 ± 0.53 b (13.7%)24.52 ± 0.83 a (53.2%)19.57 ± 0.64 A
EC4 (4 dS m−1 NaCl)14.66 ± 0.47 de (−8.3%)16.68 ± 0.28 bcd (13.8%)23.11 ± 0.45 a (57.6%)18.15 ± 0.48 B
EC6 (6 dS m−1 NaCl)12.11 ± 0.25 fg (−24.3%)14.04 ± 0.37 ef (15.9%)16.93 ± 0.38 bc (39.8%)14.36 ± 0.31 C
EC8 (8 dS m−1 NaCl)8.76 ± 0.28 h (−45.2%)11.40 ± 0.36 g (30.1%)14.53 ± 0.29 de (65.8%)11.56 ± 0.24 D
Mean12.88 ± 0.58 C15.08 ± 0.46 B19.77 ± 0.48 A
Coefficient of VarianceF-Value
SalinityPotassiumSalinity × Potassium
8.3277.21 **97.97 **2.77 *
Means sharing dissimilar letter(s) in a row or in a column are statistically significant (p ≤ 0.05, n = 3 ± SE). Value in ( ) are % decrease or increase over respective control. NS = Non-significant (p > 0.05); * = Significant (p ≤ 0.05); ** = Highly significant (p ≤ 0.01).
Table 2. Impact of Foliar Application of K on Shoot Tissue K Concentration (% DW) of Spinach Plants Exposed to varying Concentrations of Salt Stress.
Salinity Levels (dS m−1)Foliar K Levels (mM)
K0 (0 mM K)K5 (5 mM K)K10 (10 mM K)Mean
Control4.66 ± 0.051 b4.87 ± 0.053 a (4.3%)4.97 ± 0.057 a (6.2%)4.83 ± 0.048 A
EC4 (4 dS m−1 NaCl)4.42 ± 0.064 cd (−5.1%)4.48 ± 0.046 c (1.3%)4.64 ± 0.056 b (4.9%)4.51 ± 0.061 B
EC6 (6 dS m−1 NaCl)4.04 ± 0.047 fg (−13.3%)4.22 ± 0.053 ef (4.4%)4.31 ± 0.062 de (6.6%)4.19 ± 0.058 C
EC8 (8 dS m−1 NaCl)3.79 ± 0.053 l (−18.6%)3.97 ± 0.047 h (4.7%)4.11 ± 0.043 gh (8.4%)3.96 ± 0.050 C
Mean4.23 ± 0.056 C4.38 ± 0.052 B4.51 ± 0.046 A
Coefficient of VarianceF-Value
SalinityPotassiumSalinity × Potassium
5.56280.33 **49.48 **0.82 *
Means sharing dissimilar letter(s) in a row or in a column are statistically significant (p ≤ 0.05, n = 3 ± SE). Value in ( ) are % decrease or increase over respective control. NS = Non-significant (p > 0.05); * = Significant (p ≤ 0.05); ** = Highly significant (p ≤ 0.01).
Table 3. Impact of Foliar Application of K on Shoot Tissue Na Concentration (% DW) of Spinach Plants Exposed to varying Concentrations of Salt Stress.
Salinity Levels (dS m−1)Foliar K Levels
K0 (0 mM K)K5 (5 mM K)K10 (10 mM K)Mean
Control0.29 ± 0.026 gh 0.25 ± 0.011 hi (−13.7%)0.23 ± 0.027 I (−20.6%)0.26 ± 0.022 D
EC4 (4 dS m−1 NaCl)0.35 ± 0.028 ef (20.6%)0.31 ± 0.026 fg (−11.4%)0.29 ± 0.018 gh (−17.1%)0.32 ± 0.024 C
EC6 (6 dS m−1 NaCl)0.47 ± 0.023 c (62.0%)0.42 ± 0.028 d (−10.63%)0.37 ± 0.021 de (−21.2%)0.42 ± 0.023 B
EC8 (8 dS m−1 NaCl)0.71 ± 0.023 a (144.8%)0.54 ± 0.025 b (−23.94%)0.48 ± 0.020 c (−32.3%)0.58 ± 0.027 A
Mean0.46 ± 0.026 A0.38 ± 0.025 B0.34 ± 0.024 C
Coefficient of VarianceF-Value
SalinityPotassiumSalinity × Potassium
6.68260.51 **57.16 **6.97 *
Means sharing dissimilar letter(s) in a row or in a column are statistically significant (p ≤ 0.05, n = 3 ± SE). Value in ( ) are % decrease or increase over respective control. NS = Non-significant (p > 0.05); * = Significant (p ≤ 0.05); ** = Highly significant (p ≤ 0.01).
Table 4. Impact of Foliar Application of K on Shoot K/Na ratio of Spinach plants Exposed to varying Concentrations of Salt Stress.
Salinity Levels (dS m−1)Foliar K Levels
K0 (0 mM K)K5 (5 mM K)K10 (10 mM K)Mean
Control16.1 ± 1.11 c19.4 ± 1.29 b (21.74%)21.6 ± 1.22 a (39.75%)19.4 ± 1.23 A
EC4 (4 dS m−1 NaCl)12.7 ± 1.38 de (−21.12%)14.5 ± 1.32 cd (14.17%)16.3 ± 1.24 c (28.35%)14.5 ± 1.27 B
EC6 (6 dS m−1 NaCl)8.5 ± 1.14 fg (−47.2%)10.2 ± 1.23 ef (20%)11.6 ± 1.27 e (36.47%)10.1 ± 1.29 C
EC8 (8 dS m−1 NaCl)5.4 ± 1.05 h (−66.46%)7.3 ± 1.09 gh (35.19%)8.5 ± 1.32 fg (57.41%)7.1 ± 1.25 D
Mean10.7 ± 1.20 C12.9 ± 1.19 B14.7 ± 1.17 A12.8
Coefficient of VarianceF-Value
SalinityPotassiumSalinity × Potassium
9.32102.89 **19.44 **0.78 *
Means sharing dissimilar letter(s) in a row or in a column are statistically significant (p ≤ 0.05, n = 3 ± SE). Value in ( ) are % decrease or increase over respective control. NS = Non-significant (p > 0.05); * = Significant (p ≤ 0.05); ** = Highly significant (p ≤ 0.01).
Table 5. Impact of foliar application of K on Leaf Total Chlorophyll Content (SPAD-value) of Spinach Plants Exposed to varying Concentrations of Salt Stress.
Salinity Levels (dS m−1)Foliar K Levels
K0 (0 mM K)K5 (5 mM K)K10 (10 mM K)Mean
Control50.3 ± 1.52 b52.2 ± 1.48 ab (3.64%)54.7 ± 1.56 a (8.04%)52.4 ± 3.21 A
EC4 (4 dS m−1 NaCl)31.1 ± 1.35 e (−38.17%)36.7 ± 1.64 d (15.26%)44.1 ± 1.34 c (29.48%)37.3 ± 2.58 B
EC6 (6 dS m−1 NaCl)27.5 ± 1.76 fg (−45.33%)30.6 ± 1.48 ef (10.13%)31.8 ± 1.27 e (13.52%)30.0 ± 3.09 C
EC8 (8 dS m−1 NaCl)24.1 ± 1.12 h (−52.09%)24.4 ± 0.87 gh (1.23%)24.4 ± 1.01 gh (1.24%)24.3 ± 3.65 D
Mean33.2 ± 1.98 C36.0 ± 1.62 B38.8 ± 1.58 A
Coefficient of VarianceF-Value
SalinityPotassiumSalinity × Potassium
11.18381.69 **26.29 **6.28 *
Means sharing dissimilar letter(s) in a row or in a column are statistically significant (p ≤ 0.05, n = 3 ± SE). Value in ( ) are % decrease or increase over respective control. NS = Non-significant (p > 0.05); * = Significant (p ≤ 0.05); ** = Highly significant (p ≤ 0.01).
Table 6. Impact of foliar application of K on Leaf Relative Water Contents (%) of Spinach Plants Exposed to varying Concentrations of Salt Stress.
Salinity Levels (dS m−1)Foliar K Levels
K0 (0 mM K)K5 (5 mM K)K10 (10 mM K)Mean
Control92.0 ± 2.18 a89.5 ± 1.76 b (2.72%)91.5 ± 1.91 a (0.54%)91.0 ± 2.73 A
EC4 (4 dS m−1 NaCl)84.3 ± 1.67 de (−8.37%)87.0 ± 2.21 c (3.1%)87.6 ± 2.05 c (3.77%)86.3 ± 3.38 B
EC6 (6 dS m−1 NaCl)79.8 ± 3.21 g (−13.26%)83.0 ± 2.41 e (3.86%)85.4 ± 2.19 d (6.56%)82.8 ± 3.70 C
EC8 (8 dS m−1 NaCl)73.8 ± 2.86 h (−19.78%)79.1 ± 2.65 g (6.7%)81.4 ± 1.26 f (9.34%)78.1 ± 2.35 D
Mean82.5 ± 2.04 C84.7 ± 2.13 B86.5 ± 2.76 A84.5
Coefficient of VarianceF-Value
SalinityPotassiumSalinity × Potassium
9.47432.73 **77.06 **19.14 *
Means sharing dissimilar letter(s) in a row or in a column are statistically significant (p ≤ 0.05, n = 3 ± SE). Value in ( ) are % decrease or increase over respective control. NS = Non-significant (p > 0.05); * = Significant (p ≤ 0.05); ** = Highly significant (p ≤ 0.01).
Table 7. Impact of foliar application of K on Leaf Electrolyte Leakage (%) of Spinach Plants Exposed to varying Concentrations of Salt Stress.
Salinity Levels (dS m−1)Foliar K Levels
K0 (0 mM K)K5 (5 mM K)K10 (10 mM K)Mean
Control9.9 ± 0.79 h8.5 ± 0.83 hi (−14.14%)7.7 ± 0.84 l (−22.2%)8.7 ± 1.11 D
EC4 (4 dS m−1 NaCl)15.9 ± 0.69 ef (60.00%)14.1 ± 0.74 fg (−11.32%)13.1 ± 0.52 g (−17.6%)14.4 ± 1.89 C
EC6 (6 dS m−1 NaCl)21.6 ± 0.89 c (118.18%)19.0 ± 0.59 d (−9.54%)17.0 ± 0.79 e (−21.3%)19.2 ± 3.83 B
EC8 (8 dS m−1 NaCl)32.2 ± 0.9 a (225.25%)24.8 ± 0.74 b (−22.98%)22.0 ± 0.67 c (−31.68%)26.3 ± 2.64 A
Mean19.9 ± 2.53 A16.6 ± 2.81 B14.9 ± 1.69 C17.1
Coefficient of VarianceF-Value
SalinityPotassiumSalinity × Potassium
419.84 **63.50 **9.12 *
Means sharing dissimilar letter(s) in a row or in a column are statistically significant (p ≤ 0.05, n = 3 ± SE). Value in ( ) are % decrease or increase over respective control. NS = Non-significant (p > 0.05); * = Significant (p ≤ 0.05); ** = Highly significant (p ≤ 0.01).
Table 8. Impact of foliar application of K on Leaf Superoxide Dismutase (SOD) Activity (U mg−1 protein min−1) of Spinach Plants Exposed to varying Concentrations of Salt Stress.
Salinity Levels (dS m−1)Foliar K Levels
K0 (0 mM K)K5 (5 mM K)K10 (10 mM K)Mean
Control1.42 ± 0.02 fg1.22 ± 0.09 gh (14.08%)1.14 ± 0.03 h (19.72%)1.26 ± 0.13 D
EC4 (4 dS m−1 NaCl)1.59 ± 0.03 f (11.97%)1.63 ± 0.04 ef (−2.52%)1.44 ± 0.02 fg (−9.43%)1.55 ± 0.12 C
EC6 (6 dS m−1 NaCl)2.30 ± 0.02 c (61.97%)1.98 ± 0.05 d (−13.91%)1.83 ± 0.03 de (−20.43%)2.03 ± 0.11 B
EC8 (8 dS m−1 NaCl)2.81 ± 0.04 a (97.88%)2.54 ± 0.02 b (−9.6%)2.43 ± 0.05 bc (−13.52%)2.59 ± 0.109 A
Mean2.03 ± 0.143 A1.84 ± 0.112 B1.71 ± 0.105 C1.86
Coefficient of VarianceF-Value
SalinityPotassiumSalinity × Potassium
7.35164.03 **16.60 **1.27 *
Means sharing dissimilar letter(s) in a row or in a column are statistically significant (p ≤ 0.05, n = 3 ± SE). Value in ( ) are % decrease or increase over respective control. NS = Non-significant (p > 0.05); * = Significant (p ≤ 0.05); ** = Highly significant (p ≤ 0.01).
Table 9. Impact of Foliar Application of K on Leaf Catalase (CAT) Activity (µmol H2O2 mg−1 Protein) of Spinach Plants Exposed to Varying Concentrations of Salt Stress.
Salinity Levels (dS m−1)Foliar K Levels
K0 (0 mM K)K5 (5 mM K)K10 (10 mM K)Mean
Control0.47 ± 0.026 gh0.40 ± 0.011 h (−14.89%)0.37 ± 0.027 I (−21.28%)0.41 ± 0.022 D
EC4 (4 dS m−1 NaCl)0.54 ± 0.028 ef (14.89%)0.52 ± 0.026 f (−3.70%)0.48 ± 0.018 g (−11.11%)0.51 ± 0.024 E
EC6 (6 dS m−1 NaCl)0.77 ± 0.023 c (63.83%)0.66 ± 0.028 d (−14.29%)0.61 ± 0.021 de (−20.78%)0.68 ± 0.023 B
EC8 (8 dS m−1 NaCl)0.97 ± 0.023 a (106.38%)0.86 ± 0.025 b (−11.34%)0.81 ± 0.020 c (−16.49%)0.88 ± 0.027 A
Mean0.69 ± 0.026 A0.61 ± 0.025 B0.56 ± 0.024 C0.62
Coefficient of VarianceF-Value
SalinityPotassiumSalinity × Potassium
13.421394.59 **176.11 **7.01 *
Means sharing dissimilar letter(s) in a row or in a column are statistically significant (p ≤ 0.05, n = 3 ± SE). Value in ( ) are % decrease or increase over respective control. NS = Non-significant (p > 0.05); * = Significant (p ≤ 0.05); ** = Highly significant (p ≤ 0.01).
Publisher’s Note: MDPI stays neutral with regard to jurisdictional claims in published maps and institutional affiliations.

