
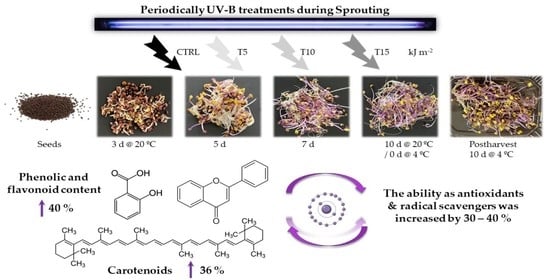
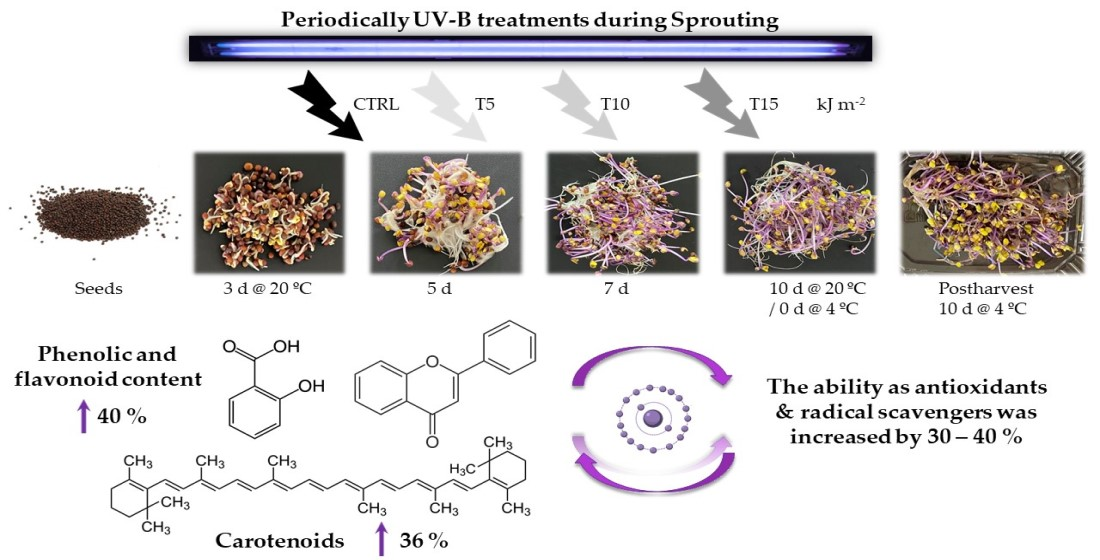
UV-B Radiation as Abiotic Elicitor to Enhance Phytochemicals and Development of Red Cabbage Sprouts


Abstract
1. Introduction
2. Materials and Methods
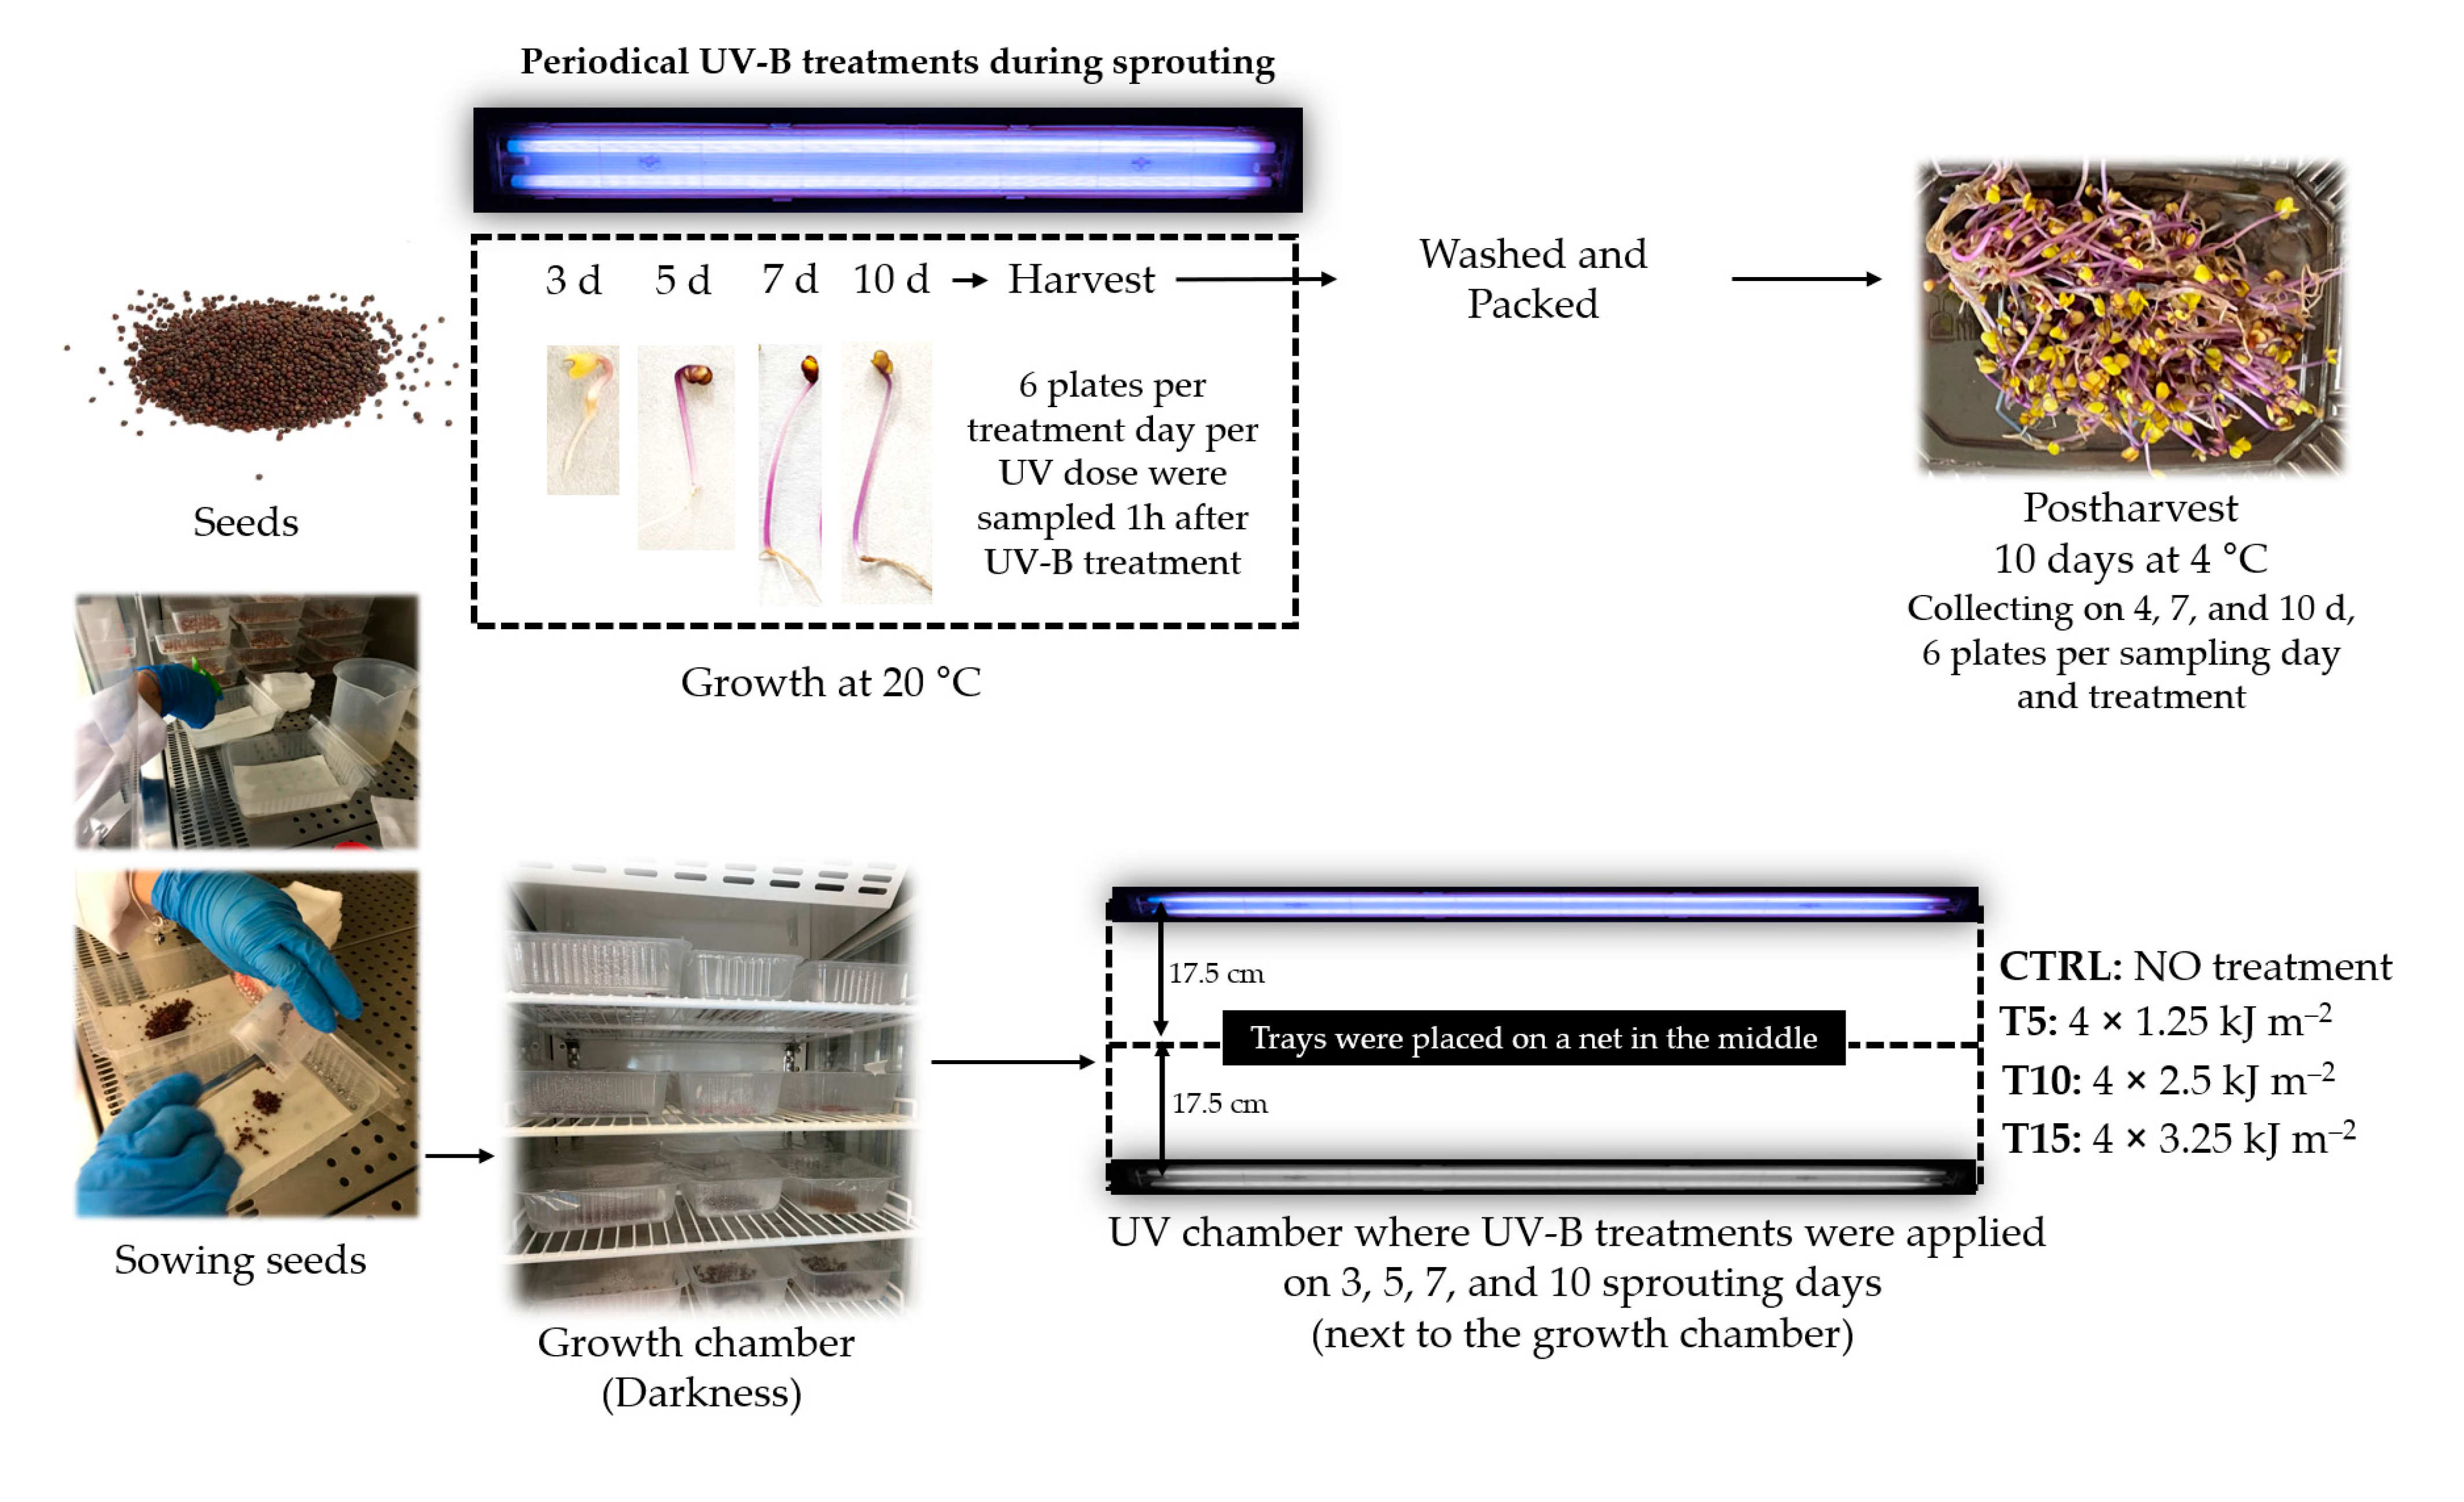
2.1. Sprouting Conditions
2.2. UV-B Doses during Sprouting and Processing after Harvesting
- CTRL: no UV treatment was used as a control.
- T5: the sprouts received a total of 5 kJ m−2 UV-B at the end of germination using 1.25 kJ m−2 day−1. For that, UV-B lamps were switched on for 2 min 42 s each day.
- T10: the sprouts received a total of 10 kJ m−2 UV-B at the end of the germination using 2.50 kJ m−2 day−1. For that, UV-B lamps were switched on for 5 min 24 s each day.
- T15: the sprouts received a total of 15 kJ m−2 UV-B at the end of the germination using 3.25 kJ m−2 day−1. For that, UV-B lamps were switched on for 8 min 6 s each day.
2.3. Morphological Development during Growth
2.4. Extraction of Bioactive Compounds
2.5. Extraction and Determination of Total Carotenoids Content
2.6. Data Analysis
3. Results
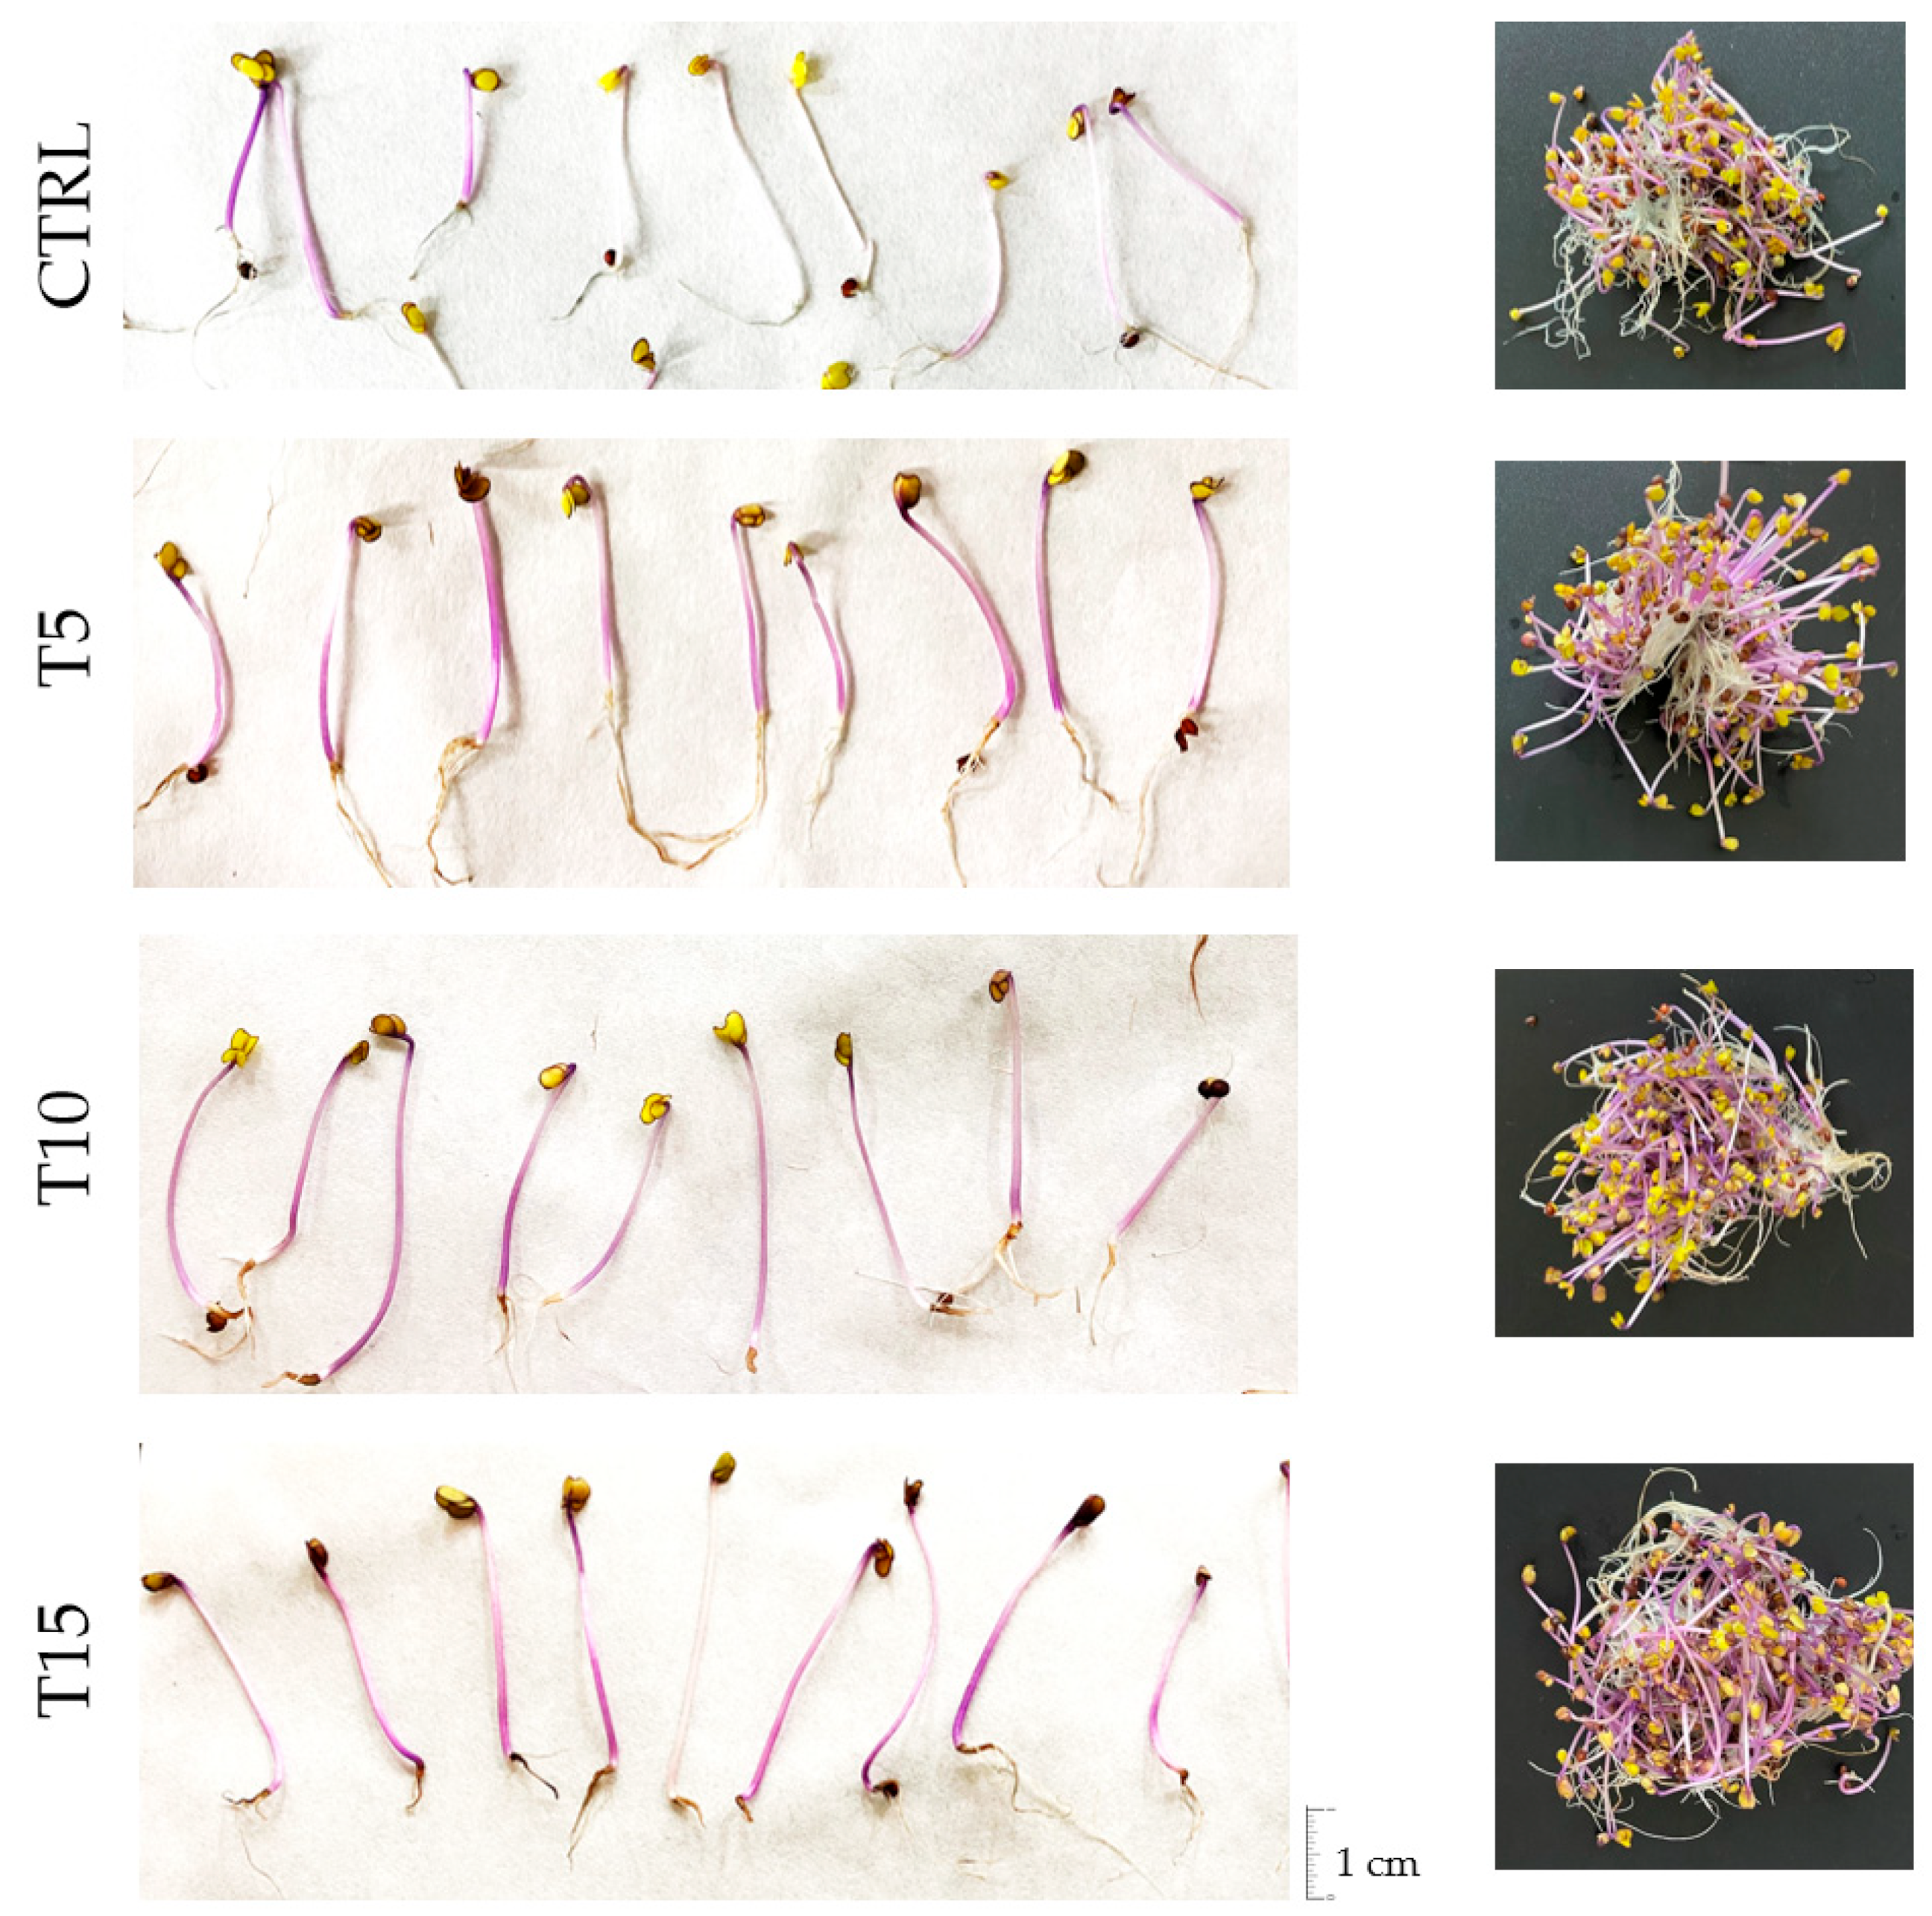
3.1. Morphological Parameters of Red Cabbage Sprouts
3.2. Bioactive Compounds
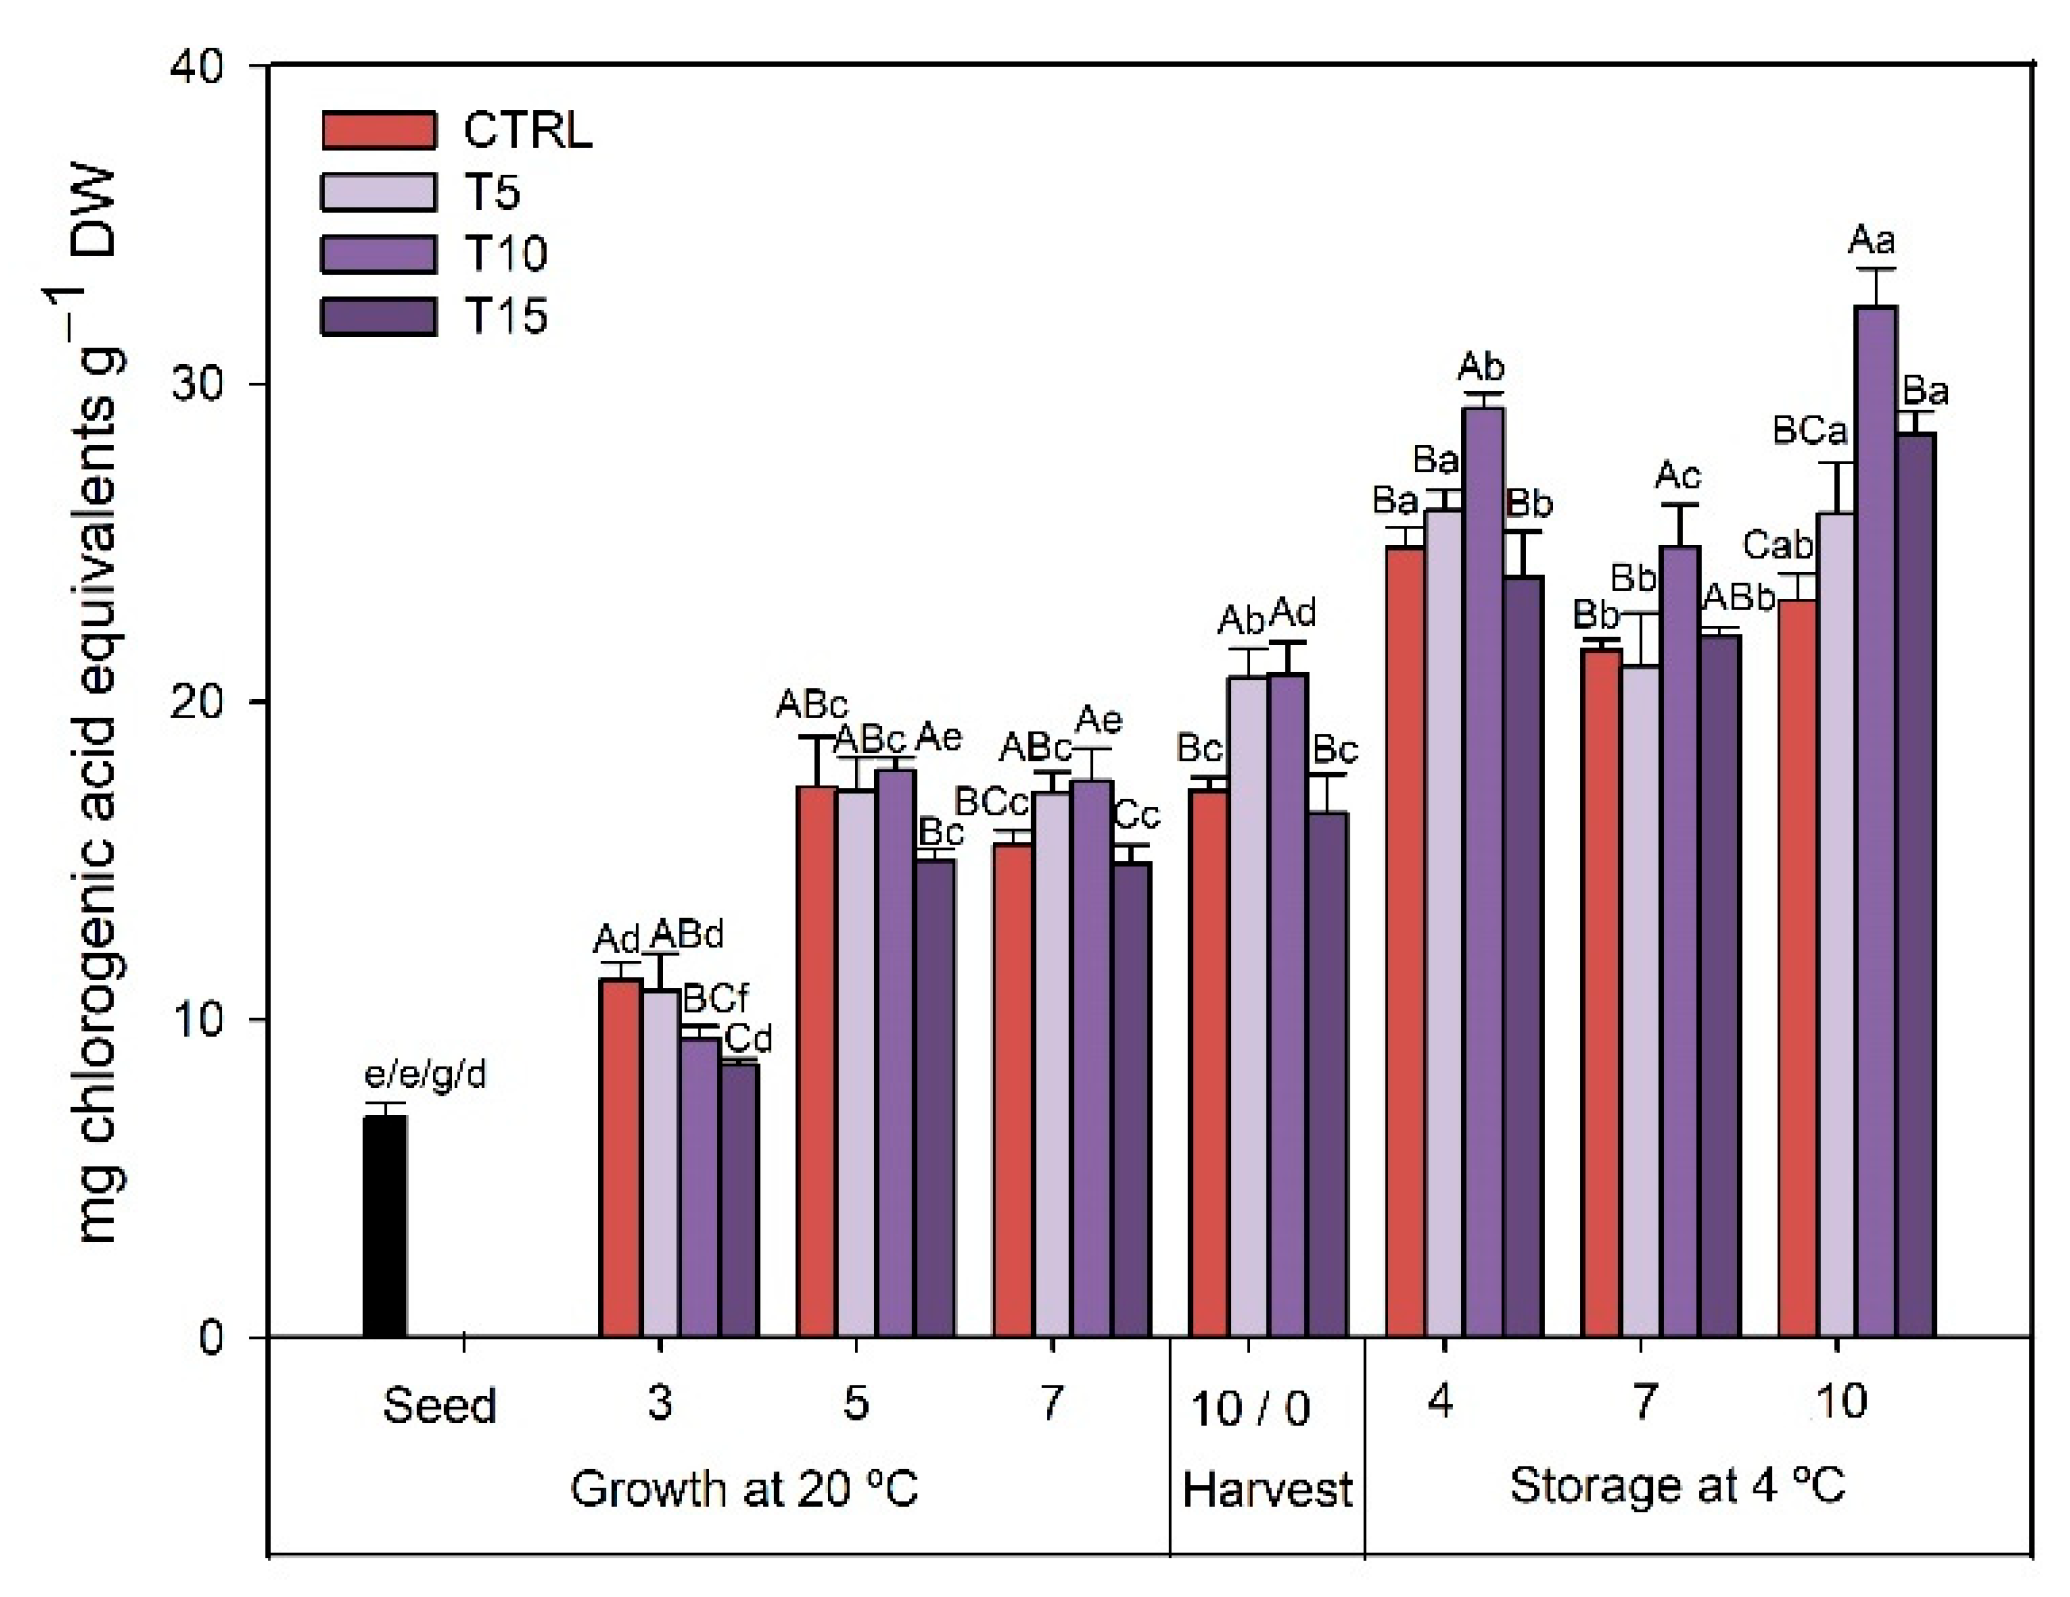
3.2.1. TPC
3.2.2. TFC
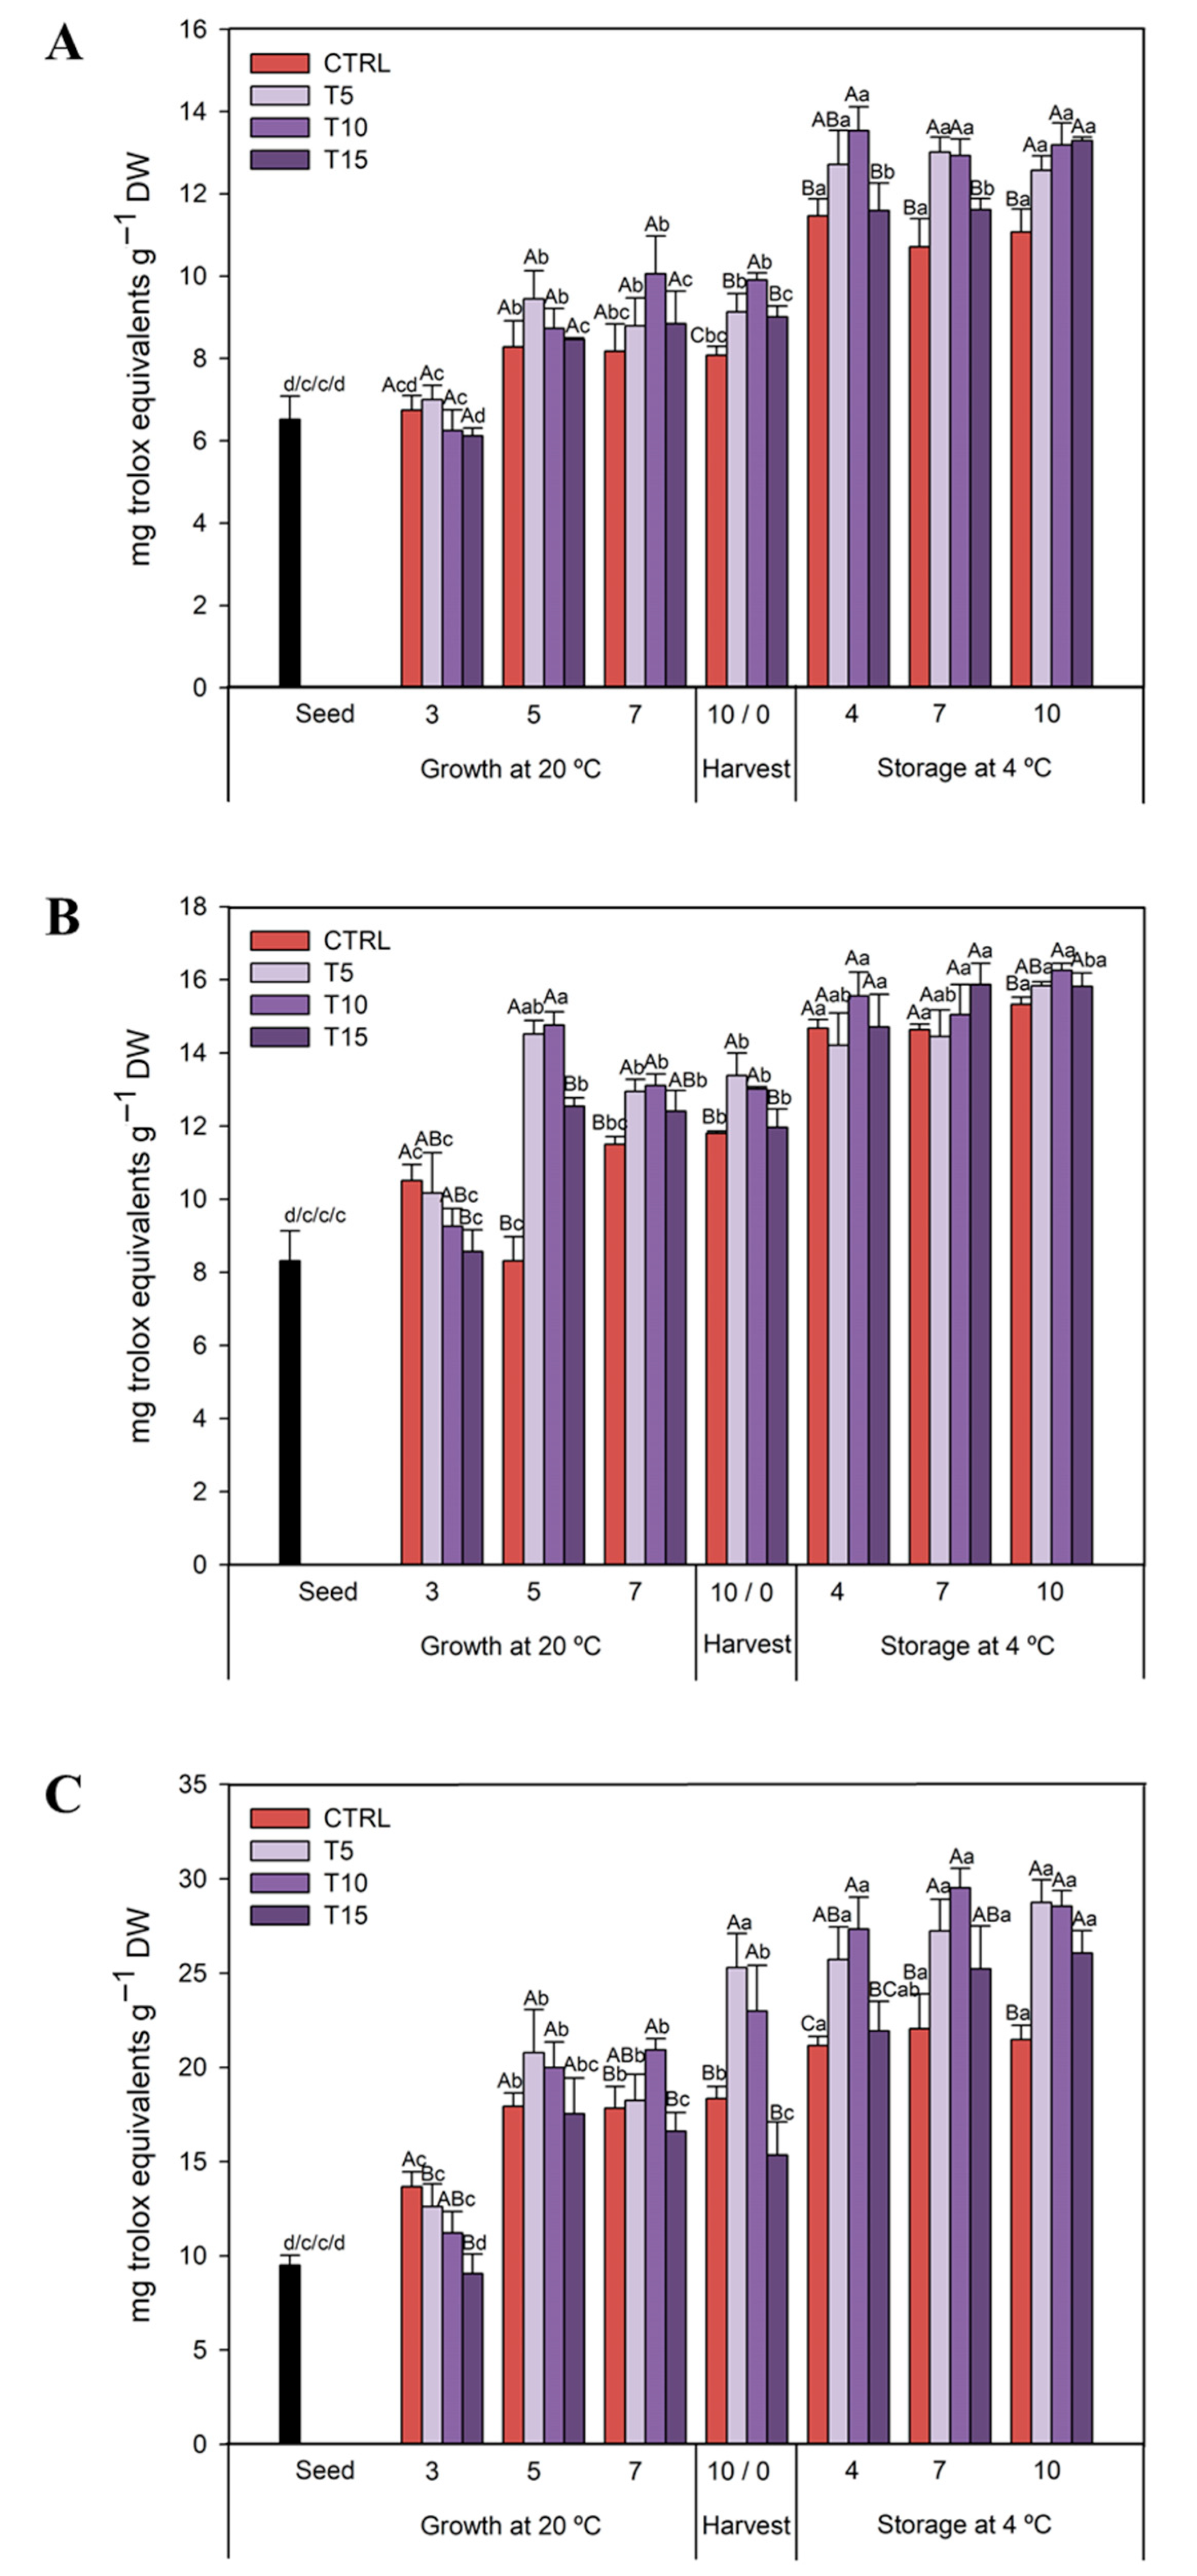
3.2.3. TAC
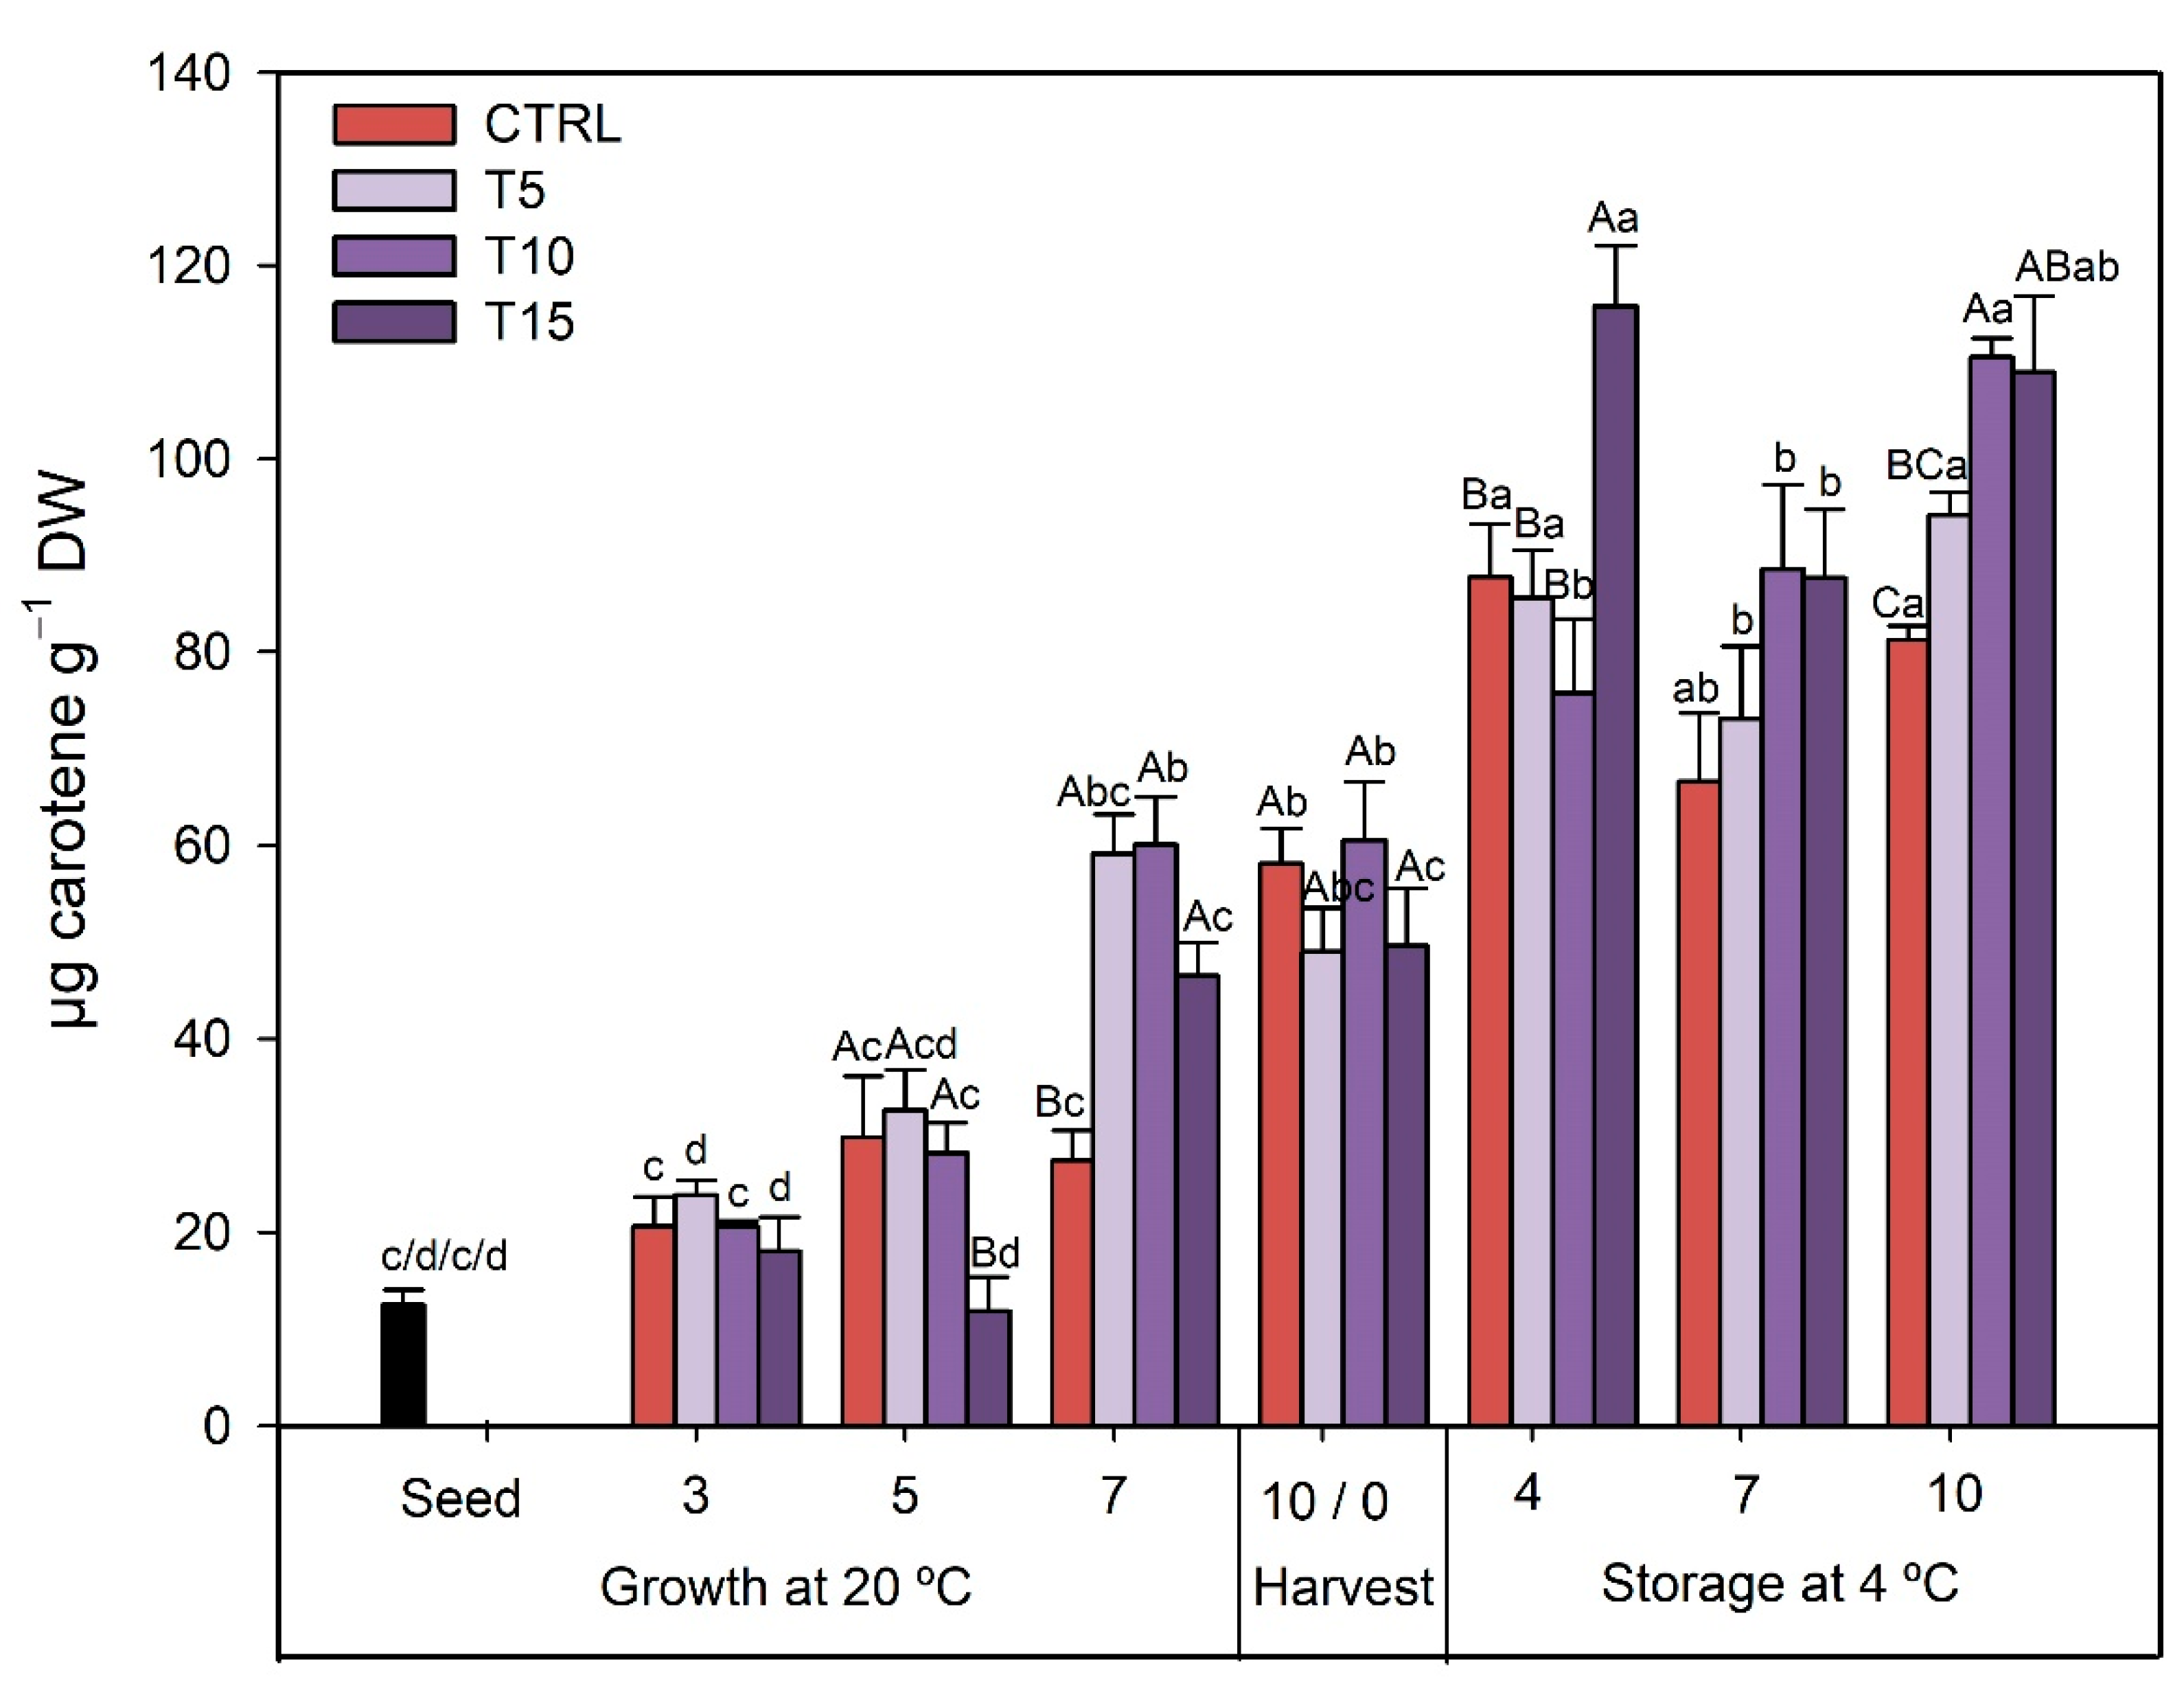
3.2.4. TCC
4. Discussion
4.1. UV-B Treatment Improved the Morphological Development of Sprouts
4.2. UV-B Treatment Enhanced the Biosynthesis of Nutraceuticals
5. Conclusions
Supplementary Materials
Author Contributions
Funding
Institutional Review Board Statement
Informed Consent Statement
Data Availability Statement
Acknowledgments
Conflicts of Interest
References
- Benincasa, P.; Falcinelli, B.; Lutts, S.; Stagnari, F.; Galieni, A. Sprouted grains: A comprehensive review. Nutrients 2019, 11, 421. [Google Scholar] [CrossRef] [PubMed]
- Artés-Hernández, F.; Castillejo, N.; Martínez-Zamora, L.; Martínez-Hernández, G.B. Phytochemical Fortification in Fruit and Vegetable Beverages with Green Technologies. Foods 2021, 10, 2534. [Google Scholar] [CrossRef] [PubMed]
- Raiola, A.; Errico, A.; Petruk, G.; Monti, D.M.; Barone, A.; Rigano, M.M. Bioactive compounds in brassicaceae vegetables with a role in the prevention of chronic diseases. Molecules 2018, 23, 15. [Google Scholar] [CrossRef] [PubMed]
- Barba, F.J.; Mariutti, L.R.B.; Bragagnolo, N.; Mercadante, A.Z.; Barbosa-Cánovas, G.V.; Orlien, V. Bioaccessibility of bioactive compounds from fruits and vegetables after thermal and nonthermal processing. Trends Food Sci. Technol. 2017, 67, 195–206. [Google Scholar] [CrossRef]
- Marton, M.; Mandoki, Z.S.; Csapo-Kiss, Z.S.; Csapo, J. The role of sprouts in human nutrition: A review. Acta Univ. Sapientiae 2010, 3, 81–117. [Google Scholar]
- Šamec, D.; Pavlović, I.; Radojčić Redovniković, I.; Salopek-Sondi, B. Comparative analysis of phytochemicals and activity of endogenous enzymes associated with their stability, bioavailability and food quality in five Brassicaceae sprouts. Food Chem. 2018, 269, 96–102. [Google Scholar] [CrossRef]
- Huché-Thélier, L.; Crespel, L.; Le Gourrierec, J.; Morel, P.; Sakr, S.; Leduc, N. Light signaling and plant responses to blue and UV radiations-Perspectives for applications in horticulture. Environ. Exp. Bot. 2016, 121, 22–38. [Google Scholar] [CrossRef]
- Taulavuori, K.; Pyysalo, A.; Taulavuori, E.; Julkunen-Tiitto, R. Responses of phenolic acid and flavonoid synthesis to blue and blue-violet light depends on plant species. Environ. Exp. Bot. 2018, 150, 183–187. [Google Scholar] [CrossRef]
- Klem, K.; Ač, A.; Holub, P.; Kováč, D.; Špunda, V.; Robson, T.M.; Urban, O. Interactive effects of PAR and UV radiation on the physiology, morphology and leaf optical properties of two barley varieties. Environ. Exp. Bot. 2012, 75, 52–64. [Google Scholar] [CrossRef]
- Klem, K.; Holub, P.; Štroch, M.; Nezval, J.; Špunda, V.; Tříska, J.; Jansen, M.A.K.; Robson, T.M.; Urban, O. Ultraviolet and photosynthetically active radiation can both induce photoprotective capacity allowing barley to overcome high radiation stress. Plant Physiol. Biochem. 2015, 93, 74–83. [Google Scholar] [CrossRef]
- Moreira-Rodríguez, M.; Nair, V.; Benavides, J.; Cisneros-Zevallos, L.; Jacobo-Velázquez, D.A. UVA, UVB light, and methyl jasmonate, alone or combined, redirect the biosynthesis of glucosinolates, phenolics, carotenoids, and chlorophylls in broccoli sprouts. Int. J. Mol. Sci. 2017, 18, 2330. [Google Scholar] [CrossRef]
- Jenkins, G.I. Signal transduction in responses to UV-B radiation. Annu. Rev. Plant Biol. 2009, 60, 407–431. [Google Scholar] [CrossRef]
- Jenkins, G.I. The UV-B photoreceptor UVR8: From structure to physiology. Plant Cell 2014, 26, 21–37. [Google Scholar] [CrossRef]
- Darré, M.; Valerga, L.; Ortiz Araque, L.C.; Lemoine, M.L.; Demkura, P.V.; Vicente, A.R.; Concellón, A. Role of UV-B irradiation dose and intensity on color retention and antioxidant elicitation in broccoli florets (Brassica oleracea var. Italica). Postharvest Biol. Technol. 2017, 128, 76–82. [Google Scholar] [CrossRef]
- Jansen, M.A.K.; Bornman, J.F. UV-B radiation: From generic stressor to specific regulator. Physiol. Plant. 2012, 145, 501–504. [Google Scholar] [CrossRef]
- Hectors, K.; Van Oevelen, S.; Guisez, Y.; Prinsen, E.; Jansen, M.A.K. The phytohormone auxin is a component of the regulatory system that controls UV-mediated accumulation of flavonoids and UV-induced morphogenesis. Physiol. Plant. 2012, 145, 594–603. [Google Scholar] [CrossRef]
- Roeber, V.M.; Bajaj, I.; Rohde, M.; Schmülling, T.; Cortleven, A. Light acts as a stressor and influences abiotic and biotic stress responses in plants. Plant Cell Environ. 2021, 44, 645–664. [Google Scholar] [CrossRef]
- Formica-Oliveira, A.C.; Martínez-Hernández, G.B.; Díaz-López, V.; Artés, F.; Artés-Hernández, F. Use of postharvest UV-B and UV-C radiation treatments to revalorize broccoli byproducts and edible florets. Innov. Food Sci. Emerg. Technol. 2017, 43, 77–83. [Google Scholar] [CrossRef]
- Topcu, Y.; Dogan, A.; Kasimoglu, Z.; Sahin-Nadeem, H.; Polat, E.; Erkan, M. The effects of UV radiation during the vegetative period on antioxidant compounds and postharvest quality of broccoli (Brassica oleracea L.). Plant Physiol. Biochem. 2015, 93, 56–65. [Google Scholar] [CrossRef]
- Formica-Oliveira, A.C.; Martínez-Hernández, G.B.; Díaz-López, V.; Artés, F.; Artés-Hernández, F. Effects of UV-B and UV-C combination on phenolic compounds biosynthesis in fresh-cut carrots. Postharvest Biol. Technol. 2017, 127, 99–104. [Google Scholar] [CrossRef]
- Formica-Oliveira, A.C.; Martínez-Hernández, G.B.; Aguayo, E.; Gómez, P.A.; Artés, F.; Artés-Hernández, F. A functional smoothie from carrots with induced enhanced phenolic content. Food Bioprocess Technol. 2017, 10, 491–502. [Google Scholar] [CrossRef]
- Castillejo, N.; Martínez-Zamora, L.; Artés–Hernández, F. Periodical UV-B Radiation Hormesis in Biosynthesis of Kale Sprouts Nutraceuticals. Plant Physiol. Biochem. 2021, 165, 274–285. [Google Scholar] [CrossRef]
- Rasband, W. ImageJ—Image Processing and Analysis in Java. Astrophys. Source Code Libr. 2012, 1, 06013. [Google Scholar]
- Martínez-Zamora, L.; Castillejo, N.; Artés-Hernández, F. Postharvest UV-B and UV-C Radiation Enhanced the Biosynthesis of Glucosinolates and Isothiocyanates in Brassicaceae Sprouts. Postharvest Biol. Technol. 2021, 181, 111650. [Google Scholar] [CrossRef]
- Singleton, V.L.; Rossi, J.A. Colorimetry of Total Phenolics with Phosphomolybdic-Phosphotungstic Acid Reagents. Am. J. Enol. Vitic. 1965, 16, 144–158. [Google Scholar]
- Martínez-Zamora, L.; Castillejo, N.; Gómez, P.A.; Artés, F. Amelioration Effect of LED Lighting in the Bioactive Compounds Synthesis during Carrot Sprouting. Agronomy 2021, 11, 304. [Google Scholar] [CrossRef]
- Hamed, M.; Kalita, D.; Bartolo, M.E.; Jayanty, S.S. Capsaicinoids, polyphenols and antioxidant activities of Capsicum annuum: Comparative study of the effect of ripening stage and cooking methods. Antioxidants 2019, 8, 364. [Google Scholar] [CrossRef]
- Castillejo, N.; Martínez-Hernández, G.B.; Monaco, K.; Gómez, P.A.; Aguayo, E.; Artés, F.; Artés-Hernández, F. Preservation of bioactive compounds of a green vegetable smoothie using short time-high temperature mild thermal treatment. Food Sci. Technol. Int. 2017, 23, 46–60. [Google Scholar] [CrossRef]
- Castillejo, N.; Martínez-Zamora, L.; Gómez, P.A.; Pennisi, G.; Crepaldi, A.; Fernández, J.A.; Orsini, F.; Artés-Hernández, F. Postharvest LED lighting: Effect of red, blue and far red on quality of minimally processed broccoli sprouts. J. Sci. Food Agric. 2021, 101, 44–53. [Google Scholar] [CrossRef]
- Castillejo, N.; Martínez-Zamora, L.; Artés-Hernández, F. UV radiation enhanced biosynthesis of flavonoids and carotenes in bell peppers. Postharvest Biol. Technol. Postharvest 2022, 184, 111774. [Google Scholar] [CrossRef]
- Wellburn, A.R. The Spectral Determination of Chlorophylls a and b, as well as Total Carotenoids, Using Various Solvents with Spectrophotometers of Different Resolution. J. Plant Physiol. 1994, 144, 307–313. [Google Scholar] [CrossRef]
- Nelder, J.A. The Fitting of a Generalization of the Logistic Curve. Biometrics 1961, 17, 89–110. [Google Scholar] [CrossRef]
- Rogez, H.; Pompeu, D.R.; Akwie, S.N.T.; Larondelle, Y. Sigmoidal kinetics of anthocyanin accumulation during fruit ripening: A comparison between açai fruits (Euterpe oleracea) and other anthocyanin-rich fruits. J. Food Compos. Anal. 2011, 24, 796–800. [Google Scholar] [CrossRef][Green Version]
- Zhong, Y.; Shahidi, F. Methods for the Assessment of Antioxidant Activity in Foods; Elsevier Ltd.: Amsterdam, The Netherlands, 2015; ISBN 9781782420972. [Google Scholar]
- Antolovich, M.; Prenzler, P.D.; Patsalides, E.; McDonald, S.; Robards, K. Methods for testing antioxidant activity. Analyst 2002, 127, 183–198. [Google Scholar] [CrossRef]
- Kacharava, N.; Chanishvili, S.; Badridze, G.; Chkhubianishvili, E.; Janukashvili, N. Effect of seed irradiation on the content of antioxidants in leaves of Kidney bean, Cabbage and Beet cultivars. Aust. J. Crop Sci. 2009, 3, 137–145. [Google Scholar]
- Escobar-Bravo, R.; Klinkhamer, P.G.L.; Leiss, K.A. Interactive effects of UV-B light with abiotic factors on plant growth and chemistry, and their consequences for defense against arthropod herbivores. Front. Plant Sci. 2017, 8, 1–14. [Google Scholar] [CrossRef]
- Tohge, T.; Kusano, M.; Fukushima, A.; Saito, K.; Fernie, A.R. Transcriptional and metabolic programs following exposure of plants to UV-B irradiation. Plant Signal. Behav. 2011, 6, 1987–1992. [Google Scholar] [CrossRef][Green Version]
- Zuk-Golaszewska, K.; Upadhyaya, M.K.; Golaszewski, J. The effect of UV-B radiation on plant growth and development. Plant Soil Environ. 2003, 49, 135–140. [Google Scholar] [CrossRef]
- Zlatev, Z.S.; Lidon, F.J.C.; Kaimakanova, M. Plant physiological responses to UV-B radiation. Emir. J. Food Agric. 2012, 24, 481–501. [Google Scholar] [CrossRef]
- Dou, H.; Niu, G.; Gu, M. Pre-harvest UV-B radiation and photosynthetic photon flux density interactively affect plant photosynthesis, growth, and secondary metabolites accumulation in basil (Ocimum basilicum) plants. Agronomy 2019, 9, 434. [Google Scholar] [CrossRef]
- Lim, Y.J.; Jeong, H.Y.; Gil, C.S.; Kwon, S.J.; Na, J.K.; Lee, C.; Eom, S.H. Isoflavone accumulation and the metabolic gene expression in response to persistent UV-B irradiation in soybean sprouts. Food Chem. 2020, 303, 125376. [Google Scholar] [CrossRef]
- Legris, M.; Boccaccini, A. Stem phototropism toward blue and ultraviolet light. Physiol. Plant. 2020, 169, 357–368. [Google Scholar] [CrossRef] [PubMed]
- Prior, R.L.; Wu, X.; Schaich, K. Standardized methods for the determination of antioxidant capacity and phenolics in foods and dietary supplements. J. Agric. Food Chem. 2005, 53, 4290–4302. [Google Scholar] [CrossRef] [PubMed]
- Drozdowska, M.; Leszczyńska, T.; Koronowicz, A.; Piasna-Słupecka, E.; Dziadek, K. Comparative study of young shoots and the mature red headed cabbage as antioxidant food resources with antiproliferative effect on prostate cancer cells. RSC Adv. 2020, 10, 43021–43034. [Google Scholar] [CrossRef]
- Vera, C.; Hinojosa, A.; Tapia, M.L.; Gonzalez, D.; Bustamante, A.; Luchsinger, L.; Escalona, V. Effect of UV-B radiation on the pigments and functional compounds in two cultivars of chard “baby type”. Rev. Iberoam. Tecnol. Postcosecha 2014, 15, 193–200. [Google Scholar]
- Su, N.; Lu, Y.; Wu, Q.; Liu, Y.; Xia, Y.; Xia, K.; Cui, J. UV-B-induced anthocyanin accumulation in hypocotyls of radish sprouts continues in the dark after irradiation. J. Sci. Food Agric. 2016, 96, 886–892. [Google Scholar] [CrossRef] [PubMed]
- Csepregi, K.; Coffey, A.; Cunningham, N.; Prinsen, E.; Hideg, É.; Jansen, M.A.K. Developmental age and UV-B exposure co-determine antioxidant capacity and flavonol accumulation in Arabidopsis leaves. Environ. Exp. Bot. 2017, 140, 19–25. [Google Scholar] [CrossRef]
- Chang, C.C.; Yang, M.H.; Wen, H.M.; Chern, J.C. Estimation of total flavonoid content in propolis by two complementary colometric methods. J. Food Drug Anal. 2002, 10, 178–182. [Google Scholar] [CrossRef]
- Neugart, S.; Zietz, M.; Schreiner, M.; Rohn, S.; Kroh, L.W.; Krumbein, A. Structurally different flavonol glycosides and hydroxycinnamic acid derivatives respond differently to moderate UV-B radiation exposure. Physiol. Plant. 2012, 145, 582–593. [Google Scholar] [CrossRef]
- Neugart, S.; Hideg, É.; Czégény, G.; Schreiner, M.; Strid, Å. Ultraviolet-B radiation exposure lowers the antioxidant capacity in the: Arabidopsis thaliana pdx1.3-1 mutant and leads to glucosinolate biosynthesis alteration in both wild type and mutant. Photochem. Photobiol. Sci. 2020, 19, 217–228. [Google Scholar] [CrossRef]
- Topcu, Y.; Dogan, A.; Sahin-Nadeem, H.; Polat, E.; Kasimoglu, Z.; Erkan, M. Morphological and biochemical responses of broccoli florets to supplemental ultraviolet-B illumination. Agric. Ecosyst. Environ. 2018, 259, 1–10. [Google Scholar] [CrossRef]
- Takshak, S.; Agrawal, S.B. Defense potential of secondary metabolites in medicinal plants under UV-B stress. J. Photochem. Photobiol. B Biol. 2019, 193, 51–88. [Google Scholar] [CrossRef]
- Singh, J.; Upadhyay, A.K.; Bahadur, A.; Singh, B.; Singh, K.P.; Rai, M. Antioxidant phytochemicals in cabbage (Brassica oleracea L. var. capitata). Sci. Hortic. 2006, 108, 233–237. [Google Scholar] [CrossRef]
- Singh, J.; Upadhyay, A.K.; Prasad, K.; Bahadur, A.; Rai, M. Variability of carotenes, vitamin C, E and phenolics in Brassica vegetables. J. Food Compos. Anal. 2007, 20, 106–112. [Google Scholar] [CrossRef]
- He, W.; Wang, Y.; Dai, Z.; Liu, C.; Xiao, Y.; Wei, Q.; Song, J.; Li, D. Effect of UV-B radiation and a supplement of CaCl2 on carotenoid biosynthesis in germinated corn kernels. Food Chem. 2019, 278, 509–514. [Google Scholar] [CrossRef]
- Tian, S.L.; Li, L.; Shah, S.N.M.; Gong, Z.H. The relationship between red fruit colour formation and key genes of capsanthin biosynthesis pathway in Capsicum annuum. Biol. Plant. 2015, 59, 507–513. [Google Scholar] [CrossRef]
- Llorente, B.; Martinez-Garcia, J.F.; Stange, C.; Rodriguez-Concepcion, M. Illuminating colors: Regulation of carotenoid biosynthesis and accumulation by light. Curr. Opin. Plant Biol. 2017, 37, 49–55. [Google Scholar] [CrossRef]
- Martínez-Zamora, L.; Castillejo, N.; Artés, F. Postharvest UV-B and Photoperiod with Blue + Red LEDs as Strategies to Stimulate Carotenogenesis in Bell Peppers. Appl. Sci. 2021, 11, 3736. [Google Scholar] [CrossRef]


| Days at 20 °C | Treatment | Hypocotyl Length (cm) | Sprout Length (cm) | H/R Ratio | Moisture (%) | Growth Rate (mm day−1) * |
|---|---|---|---|---|---|---|
| 3 | CTRL | 0.25 ± 0.12 B d | 1.03 ± 0.07 c | 0.35 ± 0.21 AB c | 61.8 ± 0.3 B c | 0.82 ± 0.40 B c |
| T5 | 0.27 ± 0.07 AB d | 1.01 ± 0.17 c | 0.38 ± 0.14 AB c | 59.9 ± 1.7 B c | 0.91 ± 0.22 AB c | |
| T10 | 0.45 ± 0.06 A c | 1.13 ± 0.11 c | 0.65 ± 0.07 A b | 64.6 ± 2.2 A c | 1.49 ± 0.20 A c | |
| T15 | 0.21 ± 0.02 B d | 0.96 ± 0.15 c | 0.28 ± 0.02 B c | 55.5 ± 1.5 C d | 0.69 ± 0.07 B c | |
| 5 | CTRL | 0.76 ± 0.04 C c | 1.97 ± 0.17 C b | 0.63 ± 0.09 b | 63.5 ± 1.5 AB c | 1.52 ± 0.08 C b |
| T5 | 1.15 ± 0.05 B c | 2.75 ± 0.16 B b | 0.72 ± 0.04 bc | 64.2 ± 1.3 A c | 2.29 ± 0.11 B b | |
| T10 | 1.43 ± 0.03 A b | 3.74 ± 0.25 A b | 0.62 ± 0.07 b | 61.3 ± 0.1 B c | 2.85 ± 0.07 A b | |
| T15 | 1.09 ± 0.09 B c | 2.82 ± 0.16 B b | 0.63 ± 0.07 b | 60.3 ± 1.9 B c | 2.18 ± 0.19 B b | |
| 7 | CTRL | 1.69 ± 0.05 D b | 3.82 ± 0.43 B a | 0.81 ± 0.16 b | 67.6 ± 4.0 B b | 2.41 ± 0.07 D a |
| T5 | 2.20 ± 0.14 C b | 5.06 ± 0.74 AB a | 0.80 ± 0.20 b | 75.6 ± 2.5 A b | 3.14 ± 0.20 C a | |
| T10 | 3.17 ± 0.11 A a | 5.49 ± 0.37 A a | 1.39 ± 0.21 a | 78.2 ± 4.3 A b | 4.53 ± 0.15 A a | |
| T15 | 2.52 ± 0.06 B b | 4.81 ± 0.81 AB a | 1.20 ± 0.44 a | 73.3 ± 0.4 AB b | 3.60 ± 0.09 B a | |
| 10 | CTRL | 2.41 ± 0.21 B a | 4.33 ± 0.16 a | 1.27 ± 0.20 a | 79.6 ± 2.2 B a | 2.41 ± 0.21 B a |
| T5 | 3.20 ± 0.06 A a | 5.19 ± 0.37 a | 1.67 ± 0.38 a | 84.8 ± 3.0 A a | 3.20 ± 0.06 A a | |
| T10 | 3.18 ± 0.12 A a | 5.07 ± 0.61 a | 1.77 ± 0.45 a | 85.6 ± 3.1 A a | 3.18 ± 0.12 A b | |
| T15 | 3.28 ± 0.15 A a | 5.12 ± 0.54 a | 1.84 ± 0.40 a | 83.6 ± 0.4 AB a | 3.28 ± 0.15 A a |
| Treatment | CMAX (mg g−1 DW) | X1/2 | g | R2 | |
|---|---|---|---|---|---|
| TPC | CTRL | 25.2 | −14.0 | 0.054 | 0.900 |
| T5 | 25.0 | 2.5 | 0.111 | 0.927 | |
| T10 | 40.7 | −19.0 | 0.031 | 0.932 | |
| T15 | 72.1 | −119.9 | 0.009 | 0.940 | |
| TFC | CTRL | 12.8 | 6.5 | 0.113 | 0.981 |
| T5 | 15.1 | 7.2 | 0.117 | 0.965 | |
| T10 | 15.8 | 4.9 | 0.080 | 0.996 | |
| T15 | 17.9 | 7.7 | 0.072 | 0.998 | |
| TCC | CTRL | 78.8 * | 9.0 | 0.323 | 0.937 |
| T5 | 111.8 * | 0.8 | 0.047 | 0.914 | |
| T10 | 515.4 * | −65.6 | 0.006 | 0.962 | |
| T15 | 105.9 * | 9.8 | 0.232 | 0.916 | |
| DPPH• | CTRL | 11.5 | 9.5 | 0.132 | 0.882 |
| T5 | 13.6 | 8.5 | 0.099 | 0.918 | |
| T10 | 13.5 | 7.1 | 0.128 | 0.942 | |
| T15 | 18.4 | 11.6 | 0.039 | 0.946 | |
| ABTS•+ | CTRL | 17.3 | −68.0 | 0.031 | 0.891 |
| T5 | 15.1 | −25.1 | 0.086 | 0.847 | |
| T10 | 16.2 | −27.7 | 0.063 | 0.823 | |
| T15 | 19.4 | −38.7 | 0.028 | 0.895 | |
| FRAP | CTRL | 22.3 | −33.8 | 0.068 | 0.962 |
| T5 | 28.8 | 1.9 | 0.094 | 0.951 | |
| T10 | 29.5 | 3.7 | 0.107 | 0.965 | |
| T15 | 69.6 | −24.2 | 0.011 | 0.886 |
Publisher’s Note: MDPI stays neutral with regard to jurisdictional claims in published maps and institutional affiliations. |
© 2021 by the authors. Licensee MDPI, Basel, Switzerland. This article is an open access article distributed under the terms and conditions of the Creative Commons Attribution (CC BY) license (https://creativecommons.org/licenses/by/4.0/).
Share and Cite
Martínez-Zamora, L.; Castillejo, N.; Artés-Hernández, F. UV-B Radiation as Abiotic Elicitor to Enhance Phytochemicals and Development of Red Cabbage Sprouts. Horticulturae 2021, 7, 567. https://doi.org/10.3390/horticulturae7120567
Martínez-Zamora L, Castillejo N, Artés-Hernández F. UV-B Radiation as Abiotic Elicitor to Enhance Phytochemicals and Development of Red Cabbage Sprouts. Horticulturae. 2021; 7(12):567. https://doi.org/10.3390/horticulturae7120567
Chicago/Turabian StyleMartínez-Zamora, Lorena, Noelia Castillejo, and Francisco Artés-Hernández. 2021. "UV-B Radiation as Abiotic Elicitor to Enhance Phytochemicals and Development of Red Cabbage Sprouts" Horticulturae 7, no. 12: 567. https://doi.org/10.3390/horticulturae7120567
APA StyleMartínez-Zamora, L., Castillejo, N., & Artés-Hernández, F. (2021). UV-B Radiation as Abiotic Elicitor to Enhance Phytochemicals and Development of Red Cabbage Sprouts. Horticulturae, 7(12), 567. https://doi.org/10.3390/horticulturae7120567