Article

Proteomic Variation in Two Genotypes of Bitter Gourd During Cold Acclimation

1
Horticulture Research Institute, Chengdu Agricultural College, Chengdu 611130, China
2
Jiangsu Key Laboratory for Horticultural Crop Genetic Improvement, Institute of Vegetable Crops, Jiangsu Academy of Agricultural Sciences, Nanjing 210014, China
3
College of Horticulture, Nanjing Agricultural University, Nanjing 211800, China
*
Authors to whom correspondence should be addressed.
These authors contributed equally to this work.
Horticulturae 2026, 12(1), 123; https://doi.org/10.3390/horticulturae12010123
Submission received: 18 December 2025 / Revised: 12 January 2026 / Accepted: 18 January 2026 / Published: 22 January 2026
(This article belongs to the Special Issue Tolerance of Horticultural Plants to Abiotic Stresses)

Abstract

Bitter gourd (Momordica charantia L.) is widely consumed worldwide due to its unique flavor and medicinal value. In subtropical regions, low spring temperatures limit bitter gourd growth, leading to plant mortality and yield loss. Thus, elucidating the mechanisms of cold tolerance in bitter gourd could facilitate the development of cold-resistant cultivars via genetic engineering or molecular breeding. In this study, a cold-tolerant (CT) and a cold-sensitive (CS) inbred line of bitter gourd were used to investigate proteomic differences under cold stress. Before cold stress, 504 differentially accumulated proteins (DAPs) were identified, with 123 up-accumulated in CT plants compared to CS plants. Upon exposure to cold stress, these numbers changed to 388 DAPs (259 up-accumulated in CT) at 6 h and further to 649 DAPs (415 up-accumulated in CT) at 24 h. K-means cluster analysis identified 65 cold-stress response proteins that may contribute to cold tolerance in CT plants, including evm.TU.chr4.3733 (Proline dehydrogenase 1), evm.TU.chr10.115 (Delta(1)-pyrroline-2-carboxylate reductase), and evm.TU.chr10.815 (Calcium-dependent protein kinase 3). Glucose and starch levels remained stable in both CS and CT plants during cold stress, and the baseline concentration of glucose was consistently and significantly higher in CT plants than in CS plants. Before cold stress, proline content was similar in both CT and CS plants. Following 6 h of cold stress, CS plants accumulated significantly higher proline levels than CT plants. This trend, however, reversed after 24 h, with proline content becoming significantly lower in CS plants. Differential protein accumulation between CT and CS plants under cold stress reflects their distinct responses, with core DAPs serving as key functional determinants of enhanced cold tolerance in the CT genotype. This study revealed important proteomic data underlying the cold stress response in bitter gourd.

1. Introduction

As a major abiotic stress factor in global climate change, low-temperature stress severely threatens vegetable production by limiting crop growth, geographical distribution and yield [1,2]. Cold stress induces a spectrum of alterations in plants, ranging from morphology to internal metabolism, including disrupted cell membrane stability, inhibited photosynthesis, metabolic disorders, and oxidative stress [3,4]. To combat low-temperature stress, three primary strategies were employed: (1) breeding cold-tolerant varieties; (2) optimizing cultivation conditions through practices such as greenhouse cultivation, mulching, and supplemental heating; and (3) applying exogenous substances (glycine betaine, melatonin, salicylic acid, etc.) to enhance cold resistance [5,6,7].
Momordica charantia L. (bitter gourd), a widely cultivated Cucurbitaceae plant in tropical and subtropical regions, is known for its unique bitter flavor and valued for its dual role as a traditional food and medicine [8,9]. Bitter gourd is rich in nutrients and bioactive compounds, including momordicosides (triterpenoids), polyphenols, and polysaccharides, which underpin its medicinal value [10,11]. Studies have indicated that bitter gourd exhibits therapeutic potential for the treatment of diabetes, inflammation, and cancer [12,13]. However, bitter gourd is highly sensitive to low-temperature stress, which is primarily characterized by significant reductions in growth, physiological metabolism, yield, and quality [14,15]. Therefore, elucidating the cold adaptation mechanisms in bitter gourd is not only of scientific interest but also crucial for developing strategies to improve its cold tolerance [16,17].
Advances in understanding plant cold-stress response mechanisms have led to the development of various strategies for mitigating low-temperature stress in crop production [18,19]. Transcriptomic studies provide valuable insights into changes at the mRNA level, while proteins are the functional executors of cellular processes [20,21]. Proteomics offers a powerful and direct approach to investigate dynamic protein expression, protein-protein interactions, and post-translational modifications that sustain phenotypic responses to stress [21,22]. By profiling the proteome, we can identify key players and regulatory networks involved in cold acclimation, thereby bridging the gap between genomic information and physiological phenotypes [23].
Despite its importance, a comprehensive proteomic analysis of bitter gourd under cold stress is still lacking. To fill this critical knowledge gap, the present study employed a label-free quantitative proteomics approach to investigate temporal changes in the proteome of bitter gourd seedlings exposed to cold stress. Our objectives were to: (1) identify DAPs in response to chilling treatment; (2) functionally categorize these DAPs to uncover key biological pathways affected by cold stress; and (3) integrate proteomic data with physiological assays to construct a regulatory model of cold-stress response in bitter gourd. We hypothesize that the differential responses of cold-tolerant (CT) and cold-sensitive (CS) bitter gourd genotypes to cold stress can be characterized and explained by their specific proteomic alterations, among which a subset of core DAPs serves as crucial functional determinants conferring enhanced cold tolerance in the CT genotype. We anticipate that our findings will provide novel insights into the molecular mechanisms of cold tolerance in bitter gourd and identify potential protein targets for molecular breeding or biotechnological approaches aimed at enhancing its resilience to low-temperature environments.

2. Materials and Methods

2.1. Plant Materials and Cold Treatment

Two bitter gourd materials were used in this study: a cold-tolerant inbred line (CT), XiangYan, and a cold-sensitive line (CS), QingFeng [24]. Plump bitter gourd seeds were soaked in water at 55 °C for 3 h and subsequently sown in plastic pots containing sterilized medium (Pindstrup, Ryomgaard, Denmark). Seedlings were irrigated with half-strength Hoagland nutrient solution every three days and cultivated in a growth chamber under a 16 h light/8 h dark photoperiod with temperatures of 28 °C (day) and 20 °C (night). Seedlings at the four-true-leaf stage were exposed to 4 °C for low-temperature treatment [25]. Leaf samples were collected from two genotypes at 0, 6, and 24 h after treatment, with three biological replicates for each line at each time point (each replicate comprised five seedlings). The collected leaves were immediately snap-frozen in liquid nitrogen and stored at −80 °C for subsequent proteomic analysis [26].

2.2. Protein Extraction and Digestion

Protein extraction was performed by lysing the samples in 300 μL of 8 M urea supplemented with protease inhibitors at a 10% (v/v) ratio. Following centrifugation at 14,100× g for 20 min, the supernatant was collected for protein quantification using the Bradford assay, and the remainder was stored at −80 °C. For digestion, a 50 µg aliquot of the extracted proteins was reduced with 200 mM dithiothreitol (DTT) at 37 °C for 1 h. Subsequently, the mixture was diluted eightfold with 50 mM ammonium bicarbonate (ABC) buffer and subjected to overnight tryptic digestion at 37 °C using an enzyme-to-protein ratio of 1:25.

2.3. Protein Solution RP Separation

Following overnight digestion, the reaction was quenched with 50 μL of 0.1% formic acid (FA). The C18 column was first activated with 100 μL of 100% acetonitrile (ACN) and centrifuged at 1200 rpm for 3 min. It was then equilibrated with two washes of 100 μL of 0.1% FA, each followed by centrifugation. The digested sample (≤30 μg) was loaded onto the conditioned column and centrifuged. To remove salts, the column was washed twice with 100 μL of 0.1% FA and once with 100 μL of pH 10 water, with centrifugation after each wash. Peptides were eluted using a step gradient of pH 10 buffer containing increasing acetonitrile concentrations (6%, 9%, 12%, 15%, 18%, 21%, 25%, 30%, 35%, and 50%). The eluates were pooled into three fractions as follows: Fraction 1 (6%, 15%, 25%, and 50%), Fraction 2 (9%, 18%, and 30%), and Fraction 3 (12%, 21%, and 35%). All fractions were lyophilized and stored at −80 °C until LC-MS/MS analysis

2.4. Peptide Identification by LC–MS/MS

For LC-MS/MS analysis, the lyophilized fractions were reconstituted in 20 µL of 2% methanol/0.1% formic acid, clarified by centrifugation (12,000 rpm, 10 min), and 10 µL of the supernatant was loaded via a sandwich method. Chromatographic separation was performed at a constant flow rate of 300 nL/min over a 120-minute gradient. The mobile phases consisted of 0.1% formic acid in water (A) and 0.1% formic acid in acetonitrile (B). The gradient program was: 4% B (0–8 min), 4–10% B (8–11 min), 10–25% B (11–88 min), 25–50% B (88–98 min), 50–99% B (98–102 min), 99% B (102–108 min), 99–4% B (108–112 min), and 4% B (112–120 min).
Data were acquired on a Thermo Orbitrap Fusion mass spectrometer (Thermo Fisher, Waltham, MA, USA) in a data-dependent mode. A full MS scan (m/z 250–1450) was performed in the Orbitrap at a resolution of 120,000, followed by a repeated CID MS/MS scan of the top 20 most intense ions. MS/MS spectra were acquired in the linear ion trap using the fast mode, with a normalized collision energy of 30%, an activation time of 50 ms, an AGC target of 7000, a maximum injection time of 35 ms, and a dynamic exclusion of 18 s. All MS/MS data were processed using MaxQuant (version 1.5.2.8) against the Uniprot_HUMAN database.

2.5. Protein Identification

Database search parameters were configured with mass tolerances of ±15 ppm for precursors and ±0.5 Da for fragment ions. A maximum of two missed cleavages were permitted. Cysteine carbamidomethylation (+57.021 Da) was set as a fixed modification, and methionine oxidation (+15.995 Da) was specified as a variable modification. For subsequent bioinformatic analysis, proteins meeting the thresholds of a p-value ≤ 0.05 and a fold-change ≥ 1.2 were considered statistically significant and selected for further investigation.

2.6. K-Mean Cluster Analysis

Three comparisons, CS0_vs_CT0, CS6_vs_CT6, and CS24_vs_CT24, were applied to analyze the tendency of DAPs in two genotypes during cold stress. K-means cluster analysis was conducted using R software (version 4.5.0). Then, DAPs in each group were classified into different classes [27].

2.7. The Detection of Starch, Glucose, Proline and Total Chlorophyll Content

The Plant Chlorophyll Content Assay Kit (Solarbio, Beijing, China, BC0990) was used to detect total chlorophyll content of leaves in two genotypes [28]. The Proline (Pro) Content Assay Kit (Solarbio, Beijing, China, BC0295) was used to detect Proline content of leaves in two genotypes [29]. The Glucose Content Assay Kit (Solarbio, Beijing, China, BC2505) was used to detect the glucose content of leaves in two genotypes [30]. The Starch Content Assay Kit (Solarbio, Beijing, China, BC0705) was used to detect the Starch content of leaves in two genotypes [31].

3. Results

3.1. Differentially Accumulated Proteins (DAPs) Under Cold Stress

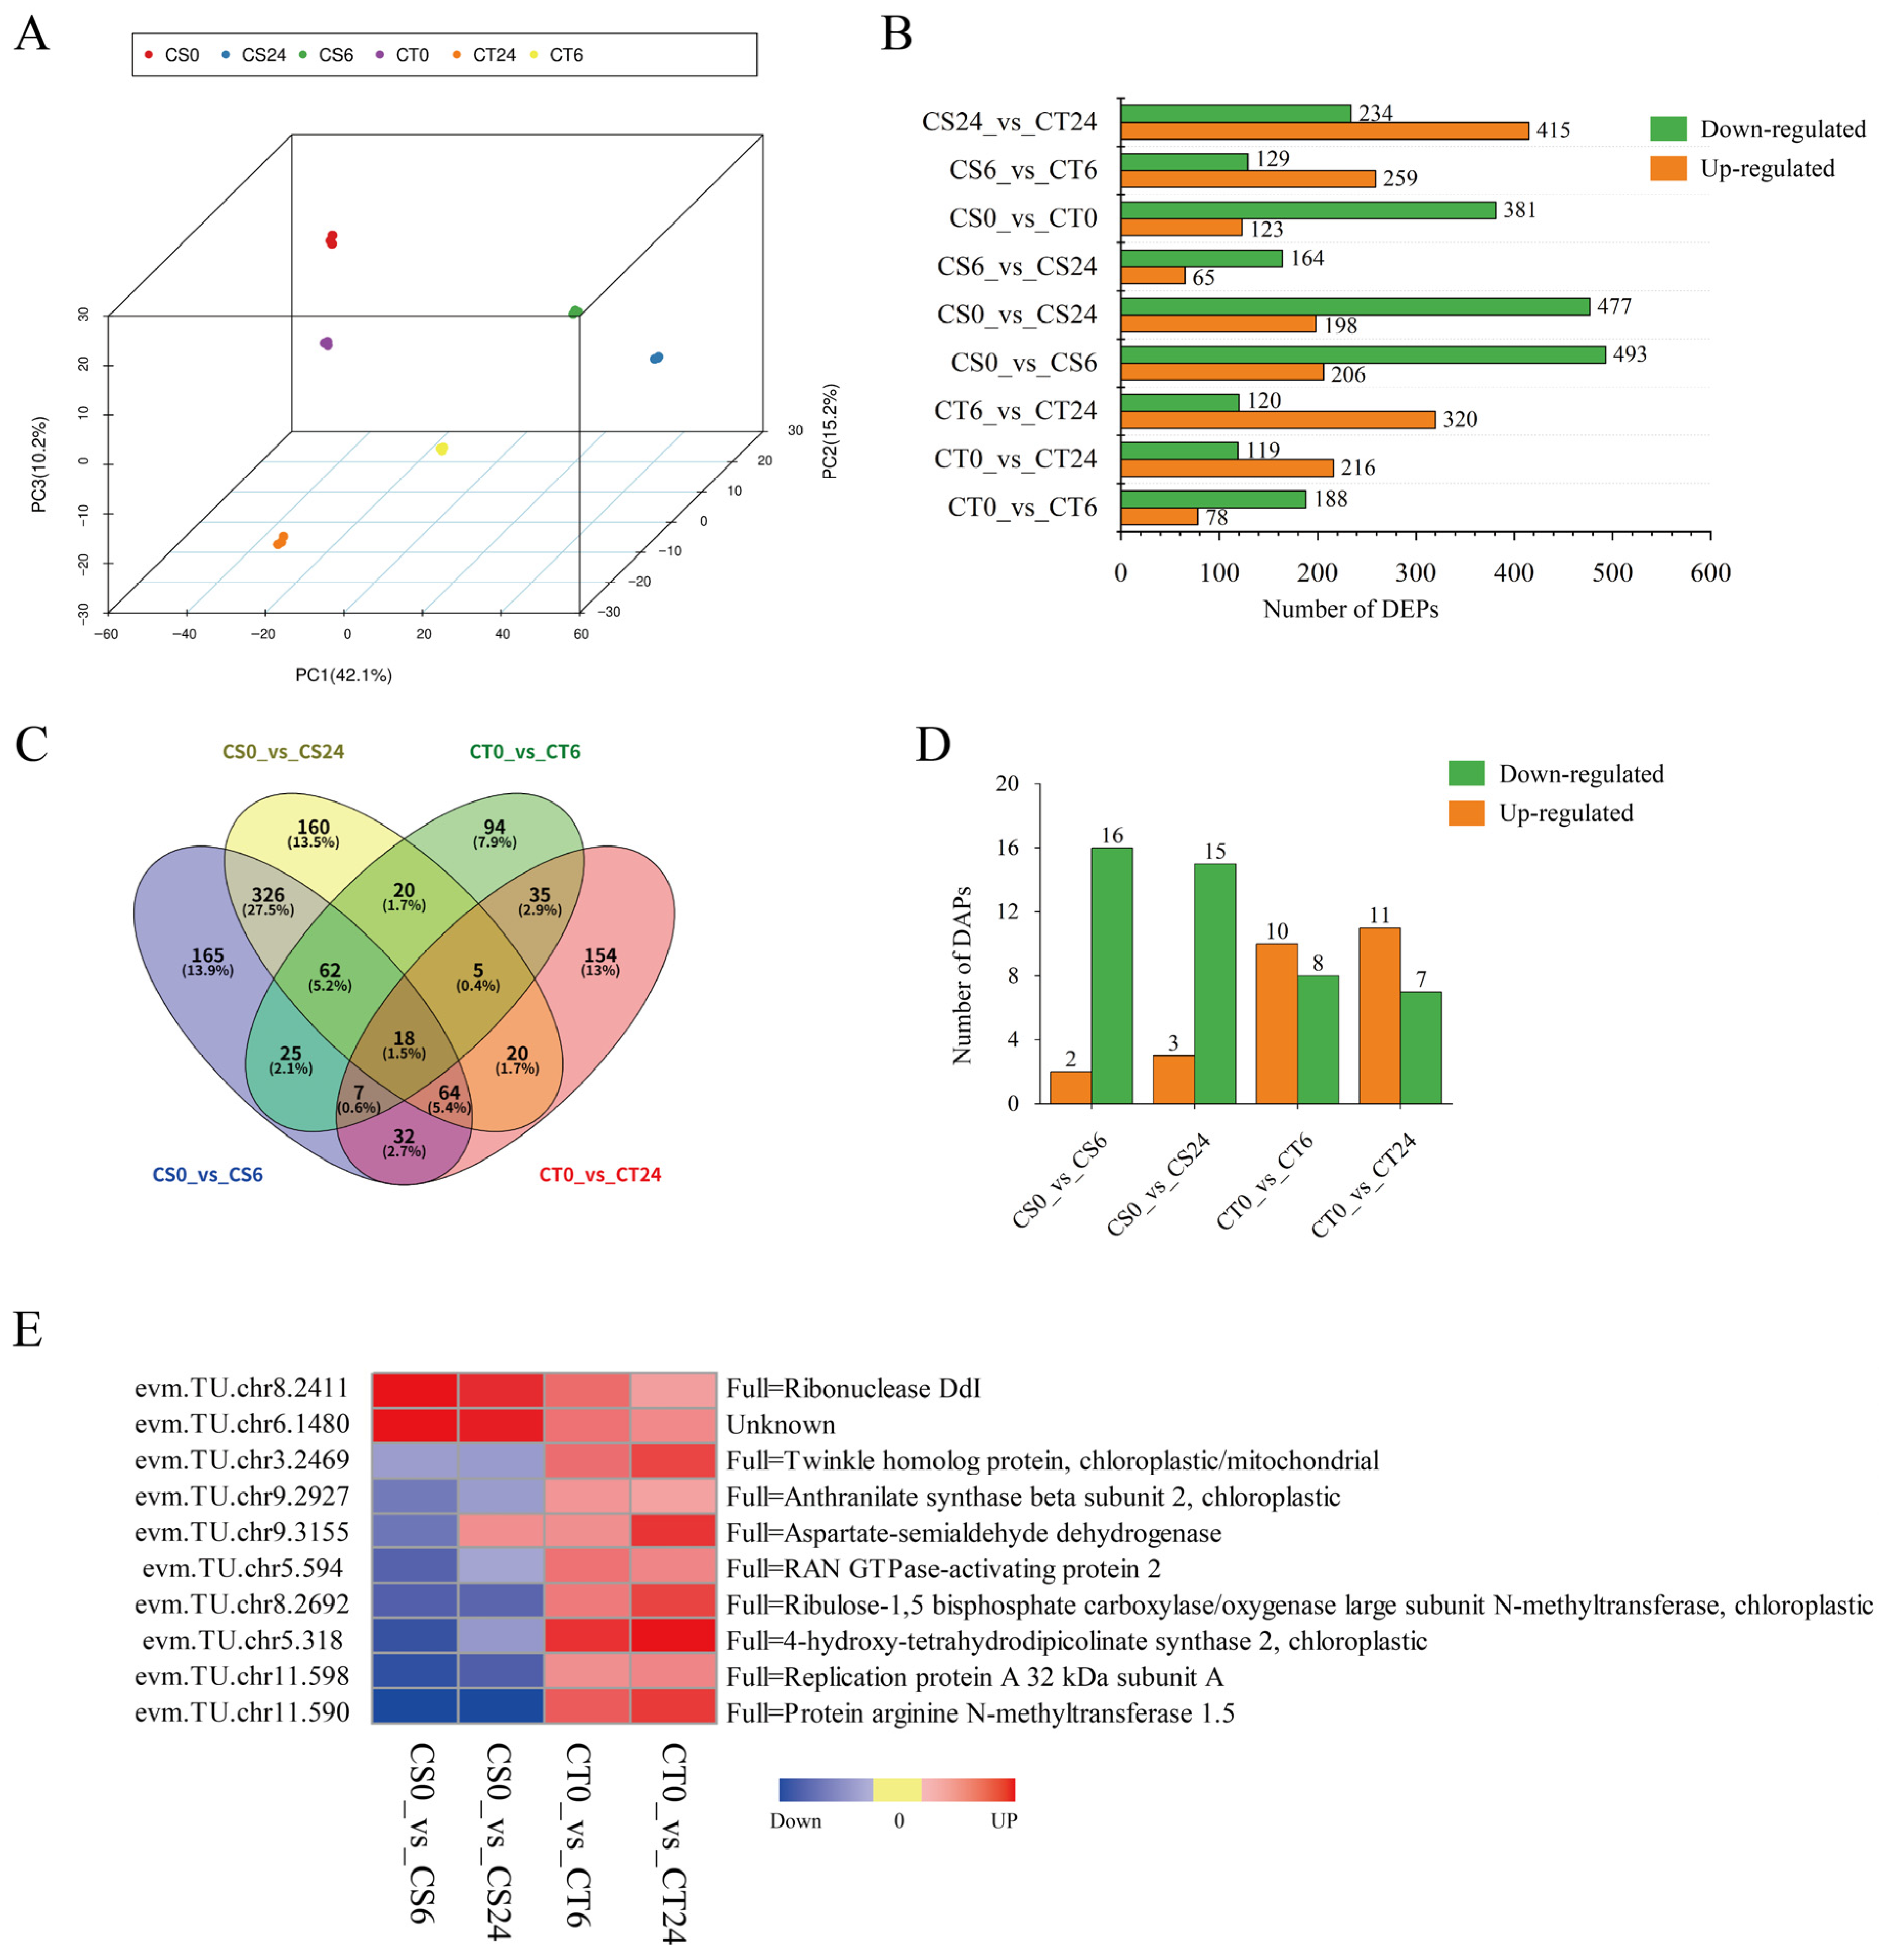
From our previous study [24], we have identified a cold-tolerant inbred line (CT), XiangYan, and a cold-sensitive line (CS), QingFeng. The leaves of both genotypes collected at 0, 6, and 24 h (h) after cold treatment were subjected to proteomic analysis with three biological replicates. The PCA results (Figure 1A) showed that leaf samples from the three stages were separated on PC1 (91.1%), PC2 (5.8%), and PC3 (1.6%). We set |Log2(foldchange)| > 1.2 and p-value < 0.05 as the thresholds for differentially accumulated proteins (DAPs).
After cold stress, 266 (78 up-regulated and 188 down-regulated), 335 (216 up-regulated and 119 down-regulated), and 440 (320 up-regulated and 120 down-regulated) DAPs were detected in the CT0_vs_CT6, CT0_vs_CT24, and CT6_vs_CT24 comparisons, respectively (Figure 1B). In the cold-sensitive line (CS), 699 (206 up-regulated and 493 down-regulated), 675 (198 up-regulated and 477 down-regulated), and 229 (65 up-regulated and 164 down-regulated) DAPs were detected in the CS0_vs_CS6, CS0_vs_CS24, and CS6_vs_CS24 comparisons, respectively. In comparisons between the cold-sensitive (CS) and cold-tolerant (CT) lines, 504 (123 up-regulated and 381 down-regulated), 388 (259 up-regulated and 129 down-regulated), and 649 (415 up-regulated and 234 down-regulated) DAPs were detected in the CS0_vs_CT0, CS6_vs_CT6, and CS24_vs_CT24 comparisons, respectively. In conclusion, more proteins were up-regulated in CT than in CS under cold stress.
The Venn diagram showed overlaps of DAPs among different comparisons (Figure 1C). The intersection of the four comparisons (CT0_vs_CT6, CT0_vs_CT24, CS0_vs_CS6, and CS0_vs_CS24) contained eighteen common DAPs. Among the 18 common DAPs, two proteins were up-regulated in CS0_vs_CS6, three proteins were up-regulated in CS0_vs_CS24, ten proteins were up-regulated in CT0_vs_CT6, and eleven proteins were up-regulated in CT0_vs_CT24. The up-regulated proteins among the eighteen common DAPs were identified; three (evm.TU.chr8.2411, evm.TU.chr6.1480, and evm.TU.chr9.3155) exhibited similar expression patterns between the two genotypes during cold stress, while seven exhibited opposite patterns (Figure 1E). These results indicated that the patterns of DAP accumulation differed substantially between the CT and CS plants.

3.2. Functional Enrichment Analysis of DAPs

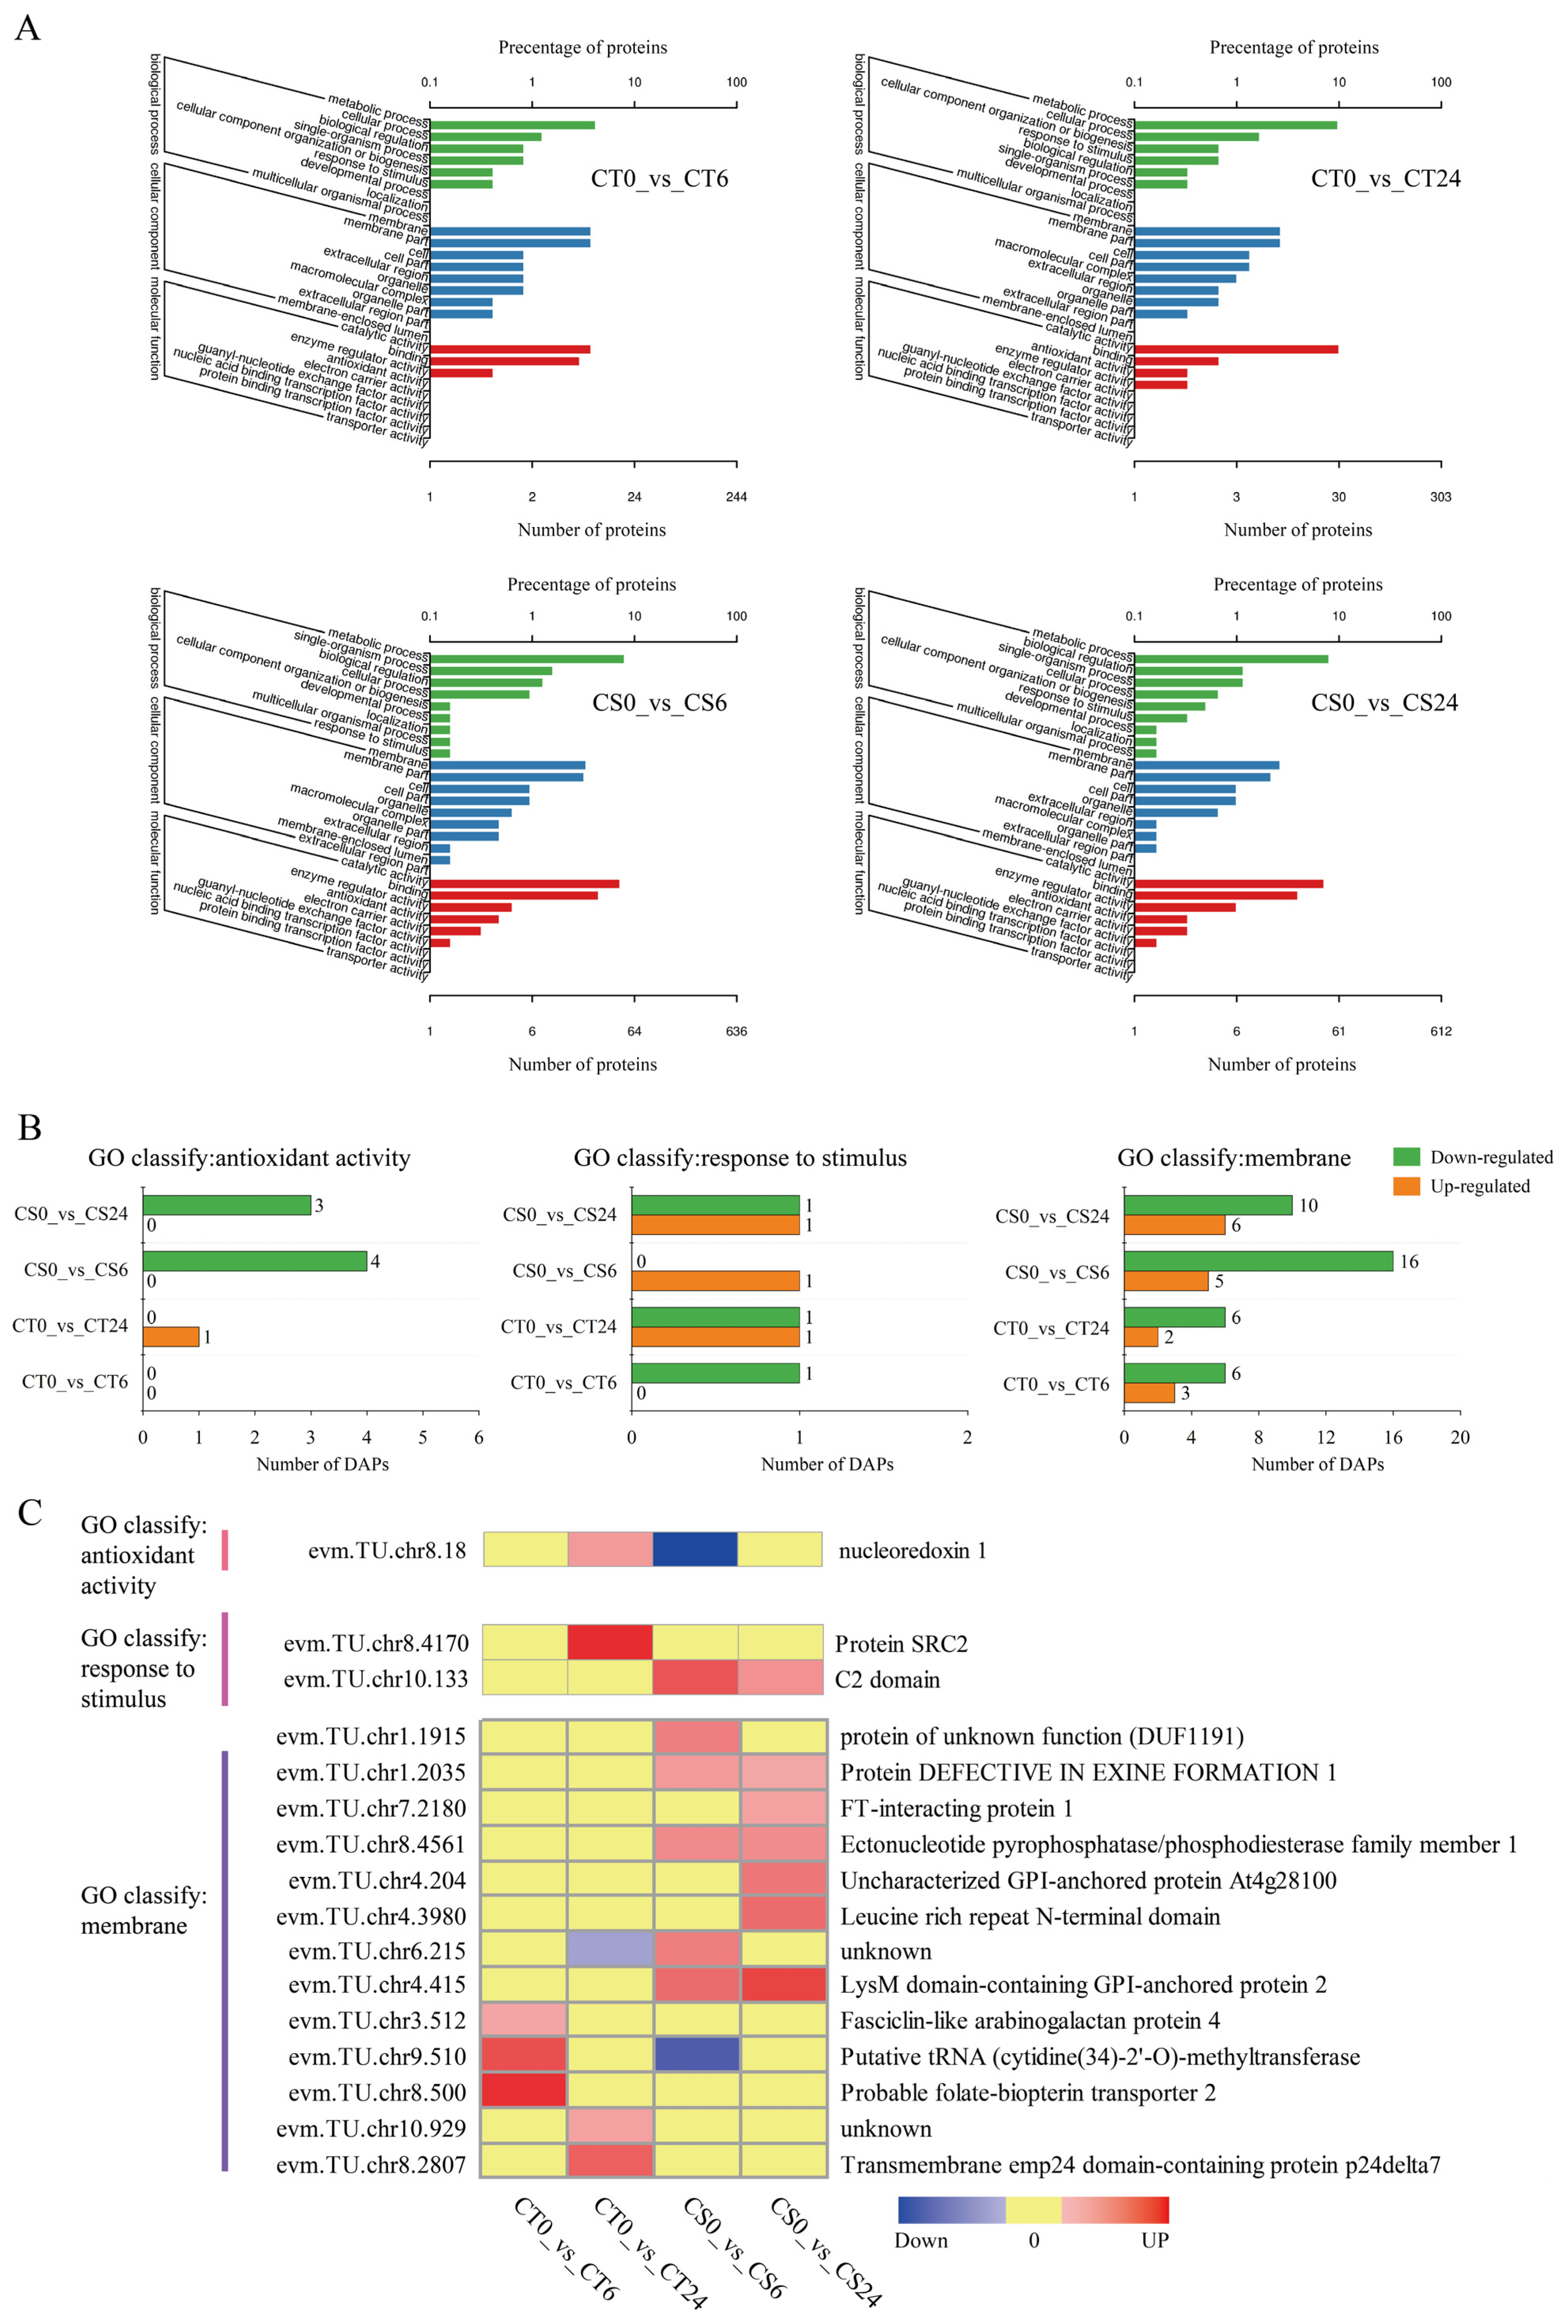
To elucidate the function of DAPs during cold stress in CT and CS, DAPs were assigned to three primary functional categories—biological process (BP), cellular component (CC), and molecular function (MF)—for functional annotation using the Gene Ontology (GO) database. Three GO terms were identified as being related to cold stress: “antioxidant activity” in the molecular function category, “response to stimulus” in the biological process category, and “membrane” in the cellular component category (Figure 2A). For these three GO terms, the majority of DAPs were down-regulated during cold stress in both genotypes, whereas only a few were up-regulated. The up-regulated DAPs from these three GO terms were selected, and a heatmap was generated to illustrate their expression patterns across the different comparisons. The up-regulated DAPs in these three GO terms showed no overlap between the two genotypes, indicating that CS and CT plants have distinct responses to cold stress (Figure 2C).
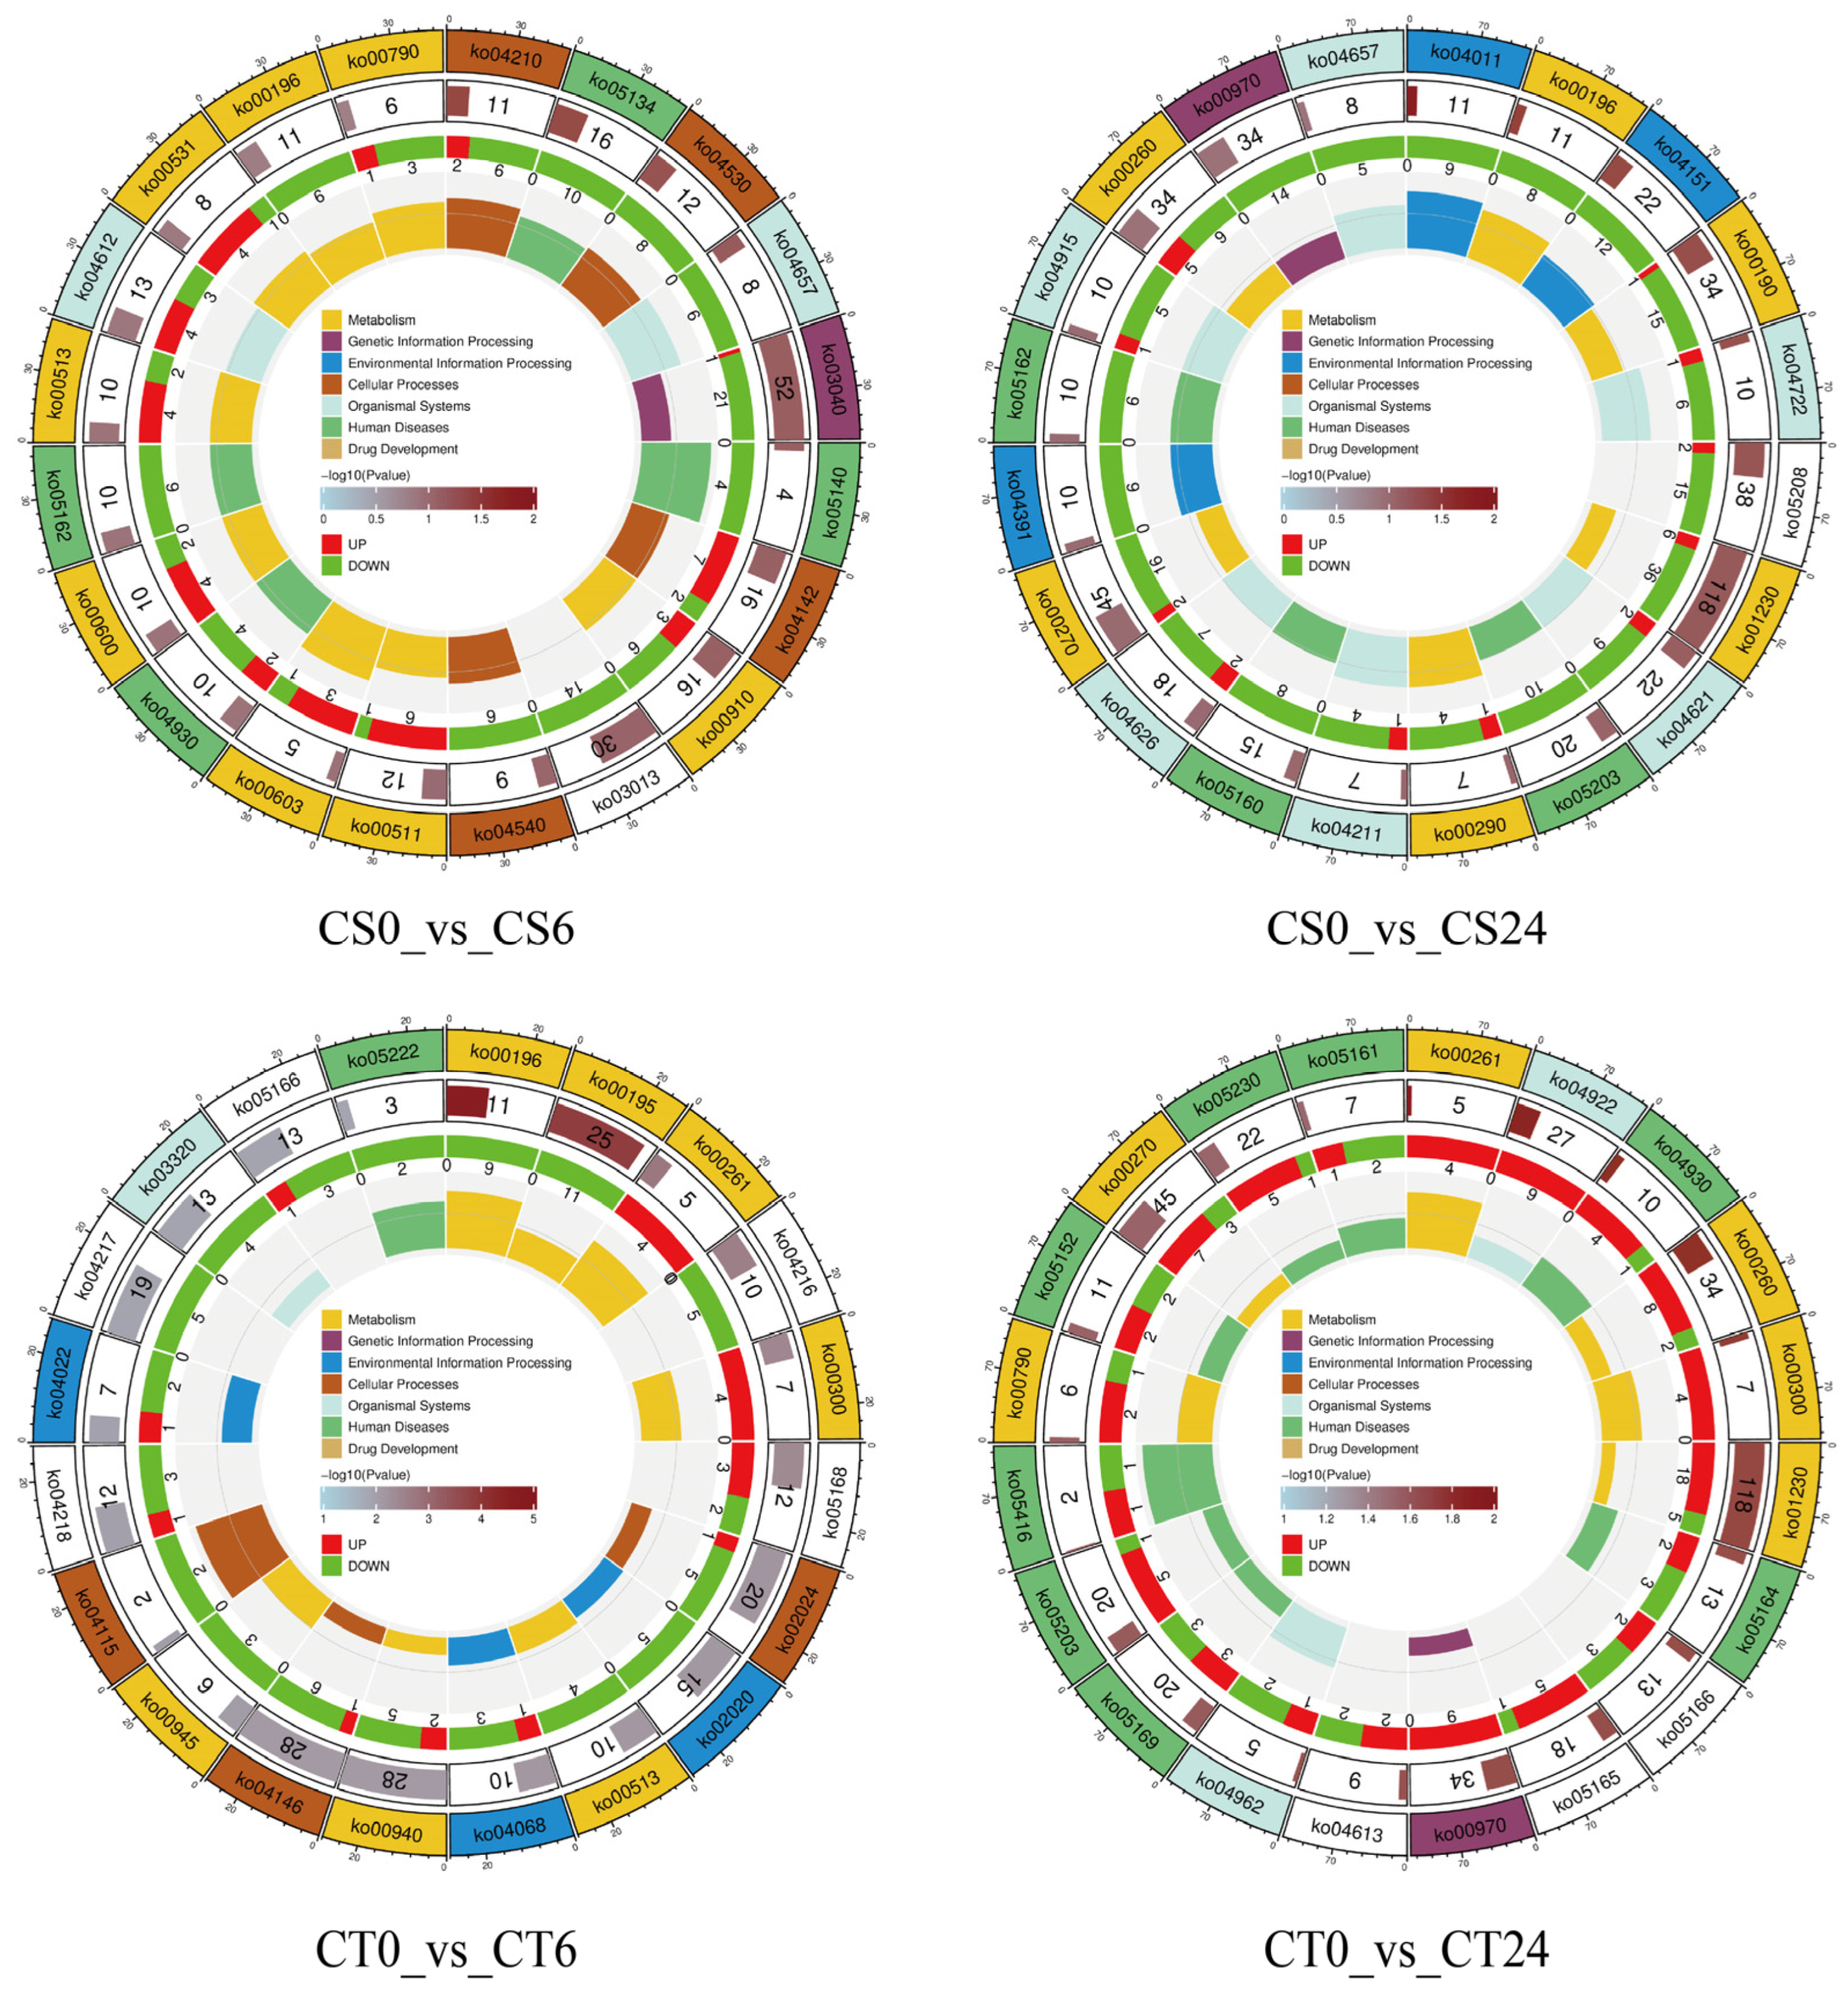
All DAPs were submitted to the Kyoto Encyclopedia of Genes and Genomes (KEGG) database for functional analysis of their roles in metabolic or signaling pathways (Figure 3). The top 20 KEGG pathways for each comparison were presented in Figure 2. After 6 h of cold stress, the DAPs identified in both the CT and CS genotypes were enriched in the “Various types of N-glycan biosynthesis (ko00513)” pathway. In the CS0_vs_CS6 comparison, most up-regulated DAPs were enriched in “Lysosome (ko04142),” “Glycosaminoglycan degradation (ko00531),” “Glycosphingolipid biosynthesis—globo and isoglobo seri (Ko00603),” “Other glycan degradation (ko00511),” and “Sphingolipid metabolism (ko00600).” In the CT0_vs_CT6 comparison, most up-regulated DAPs were enriched in “Lysine biosynthesis (Ko00300)” and “Monobactam biosynthesis (ko00261).” After 24 h of cold stress, most DAPs in the CS0_vs_CS24 comparison were down-regulated, whereas most in the CT0_vs_CT24 comparison were up-regulated within the KEGG pathways. In the CT0_vs_CT24 comparison, most up-regulated DAPs were enriched in “Biosynthesis of amino acids (ko01230),” “Aminoacyl-tRNA biosynthesis (ko00970),” “Glycine, serine and threonine metabolism (ko00260),” and “Glucagon signaling pathway (ko04922).”

3.3. The Expression Pattern of HSP, APX, SOD, POD and CAT Proteins in CT and CS

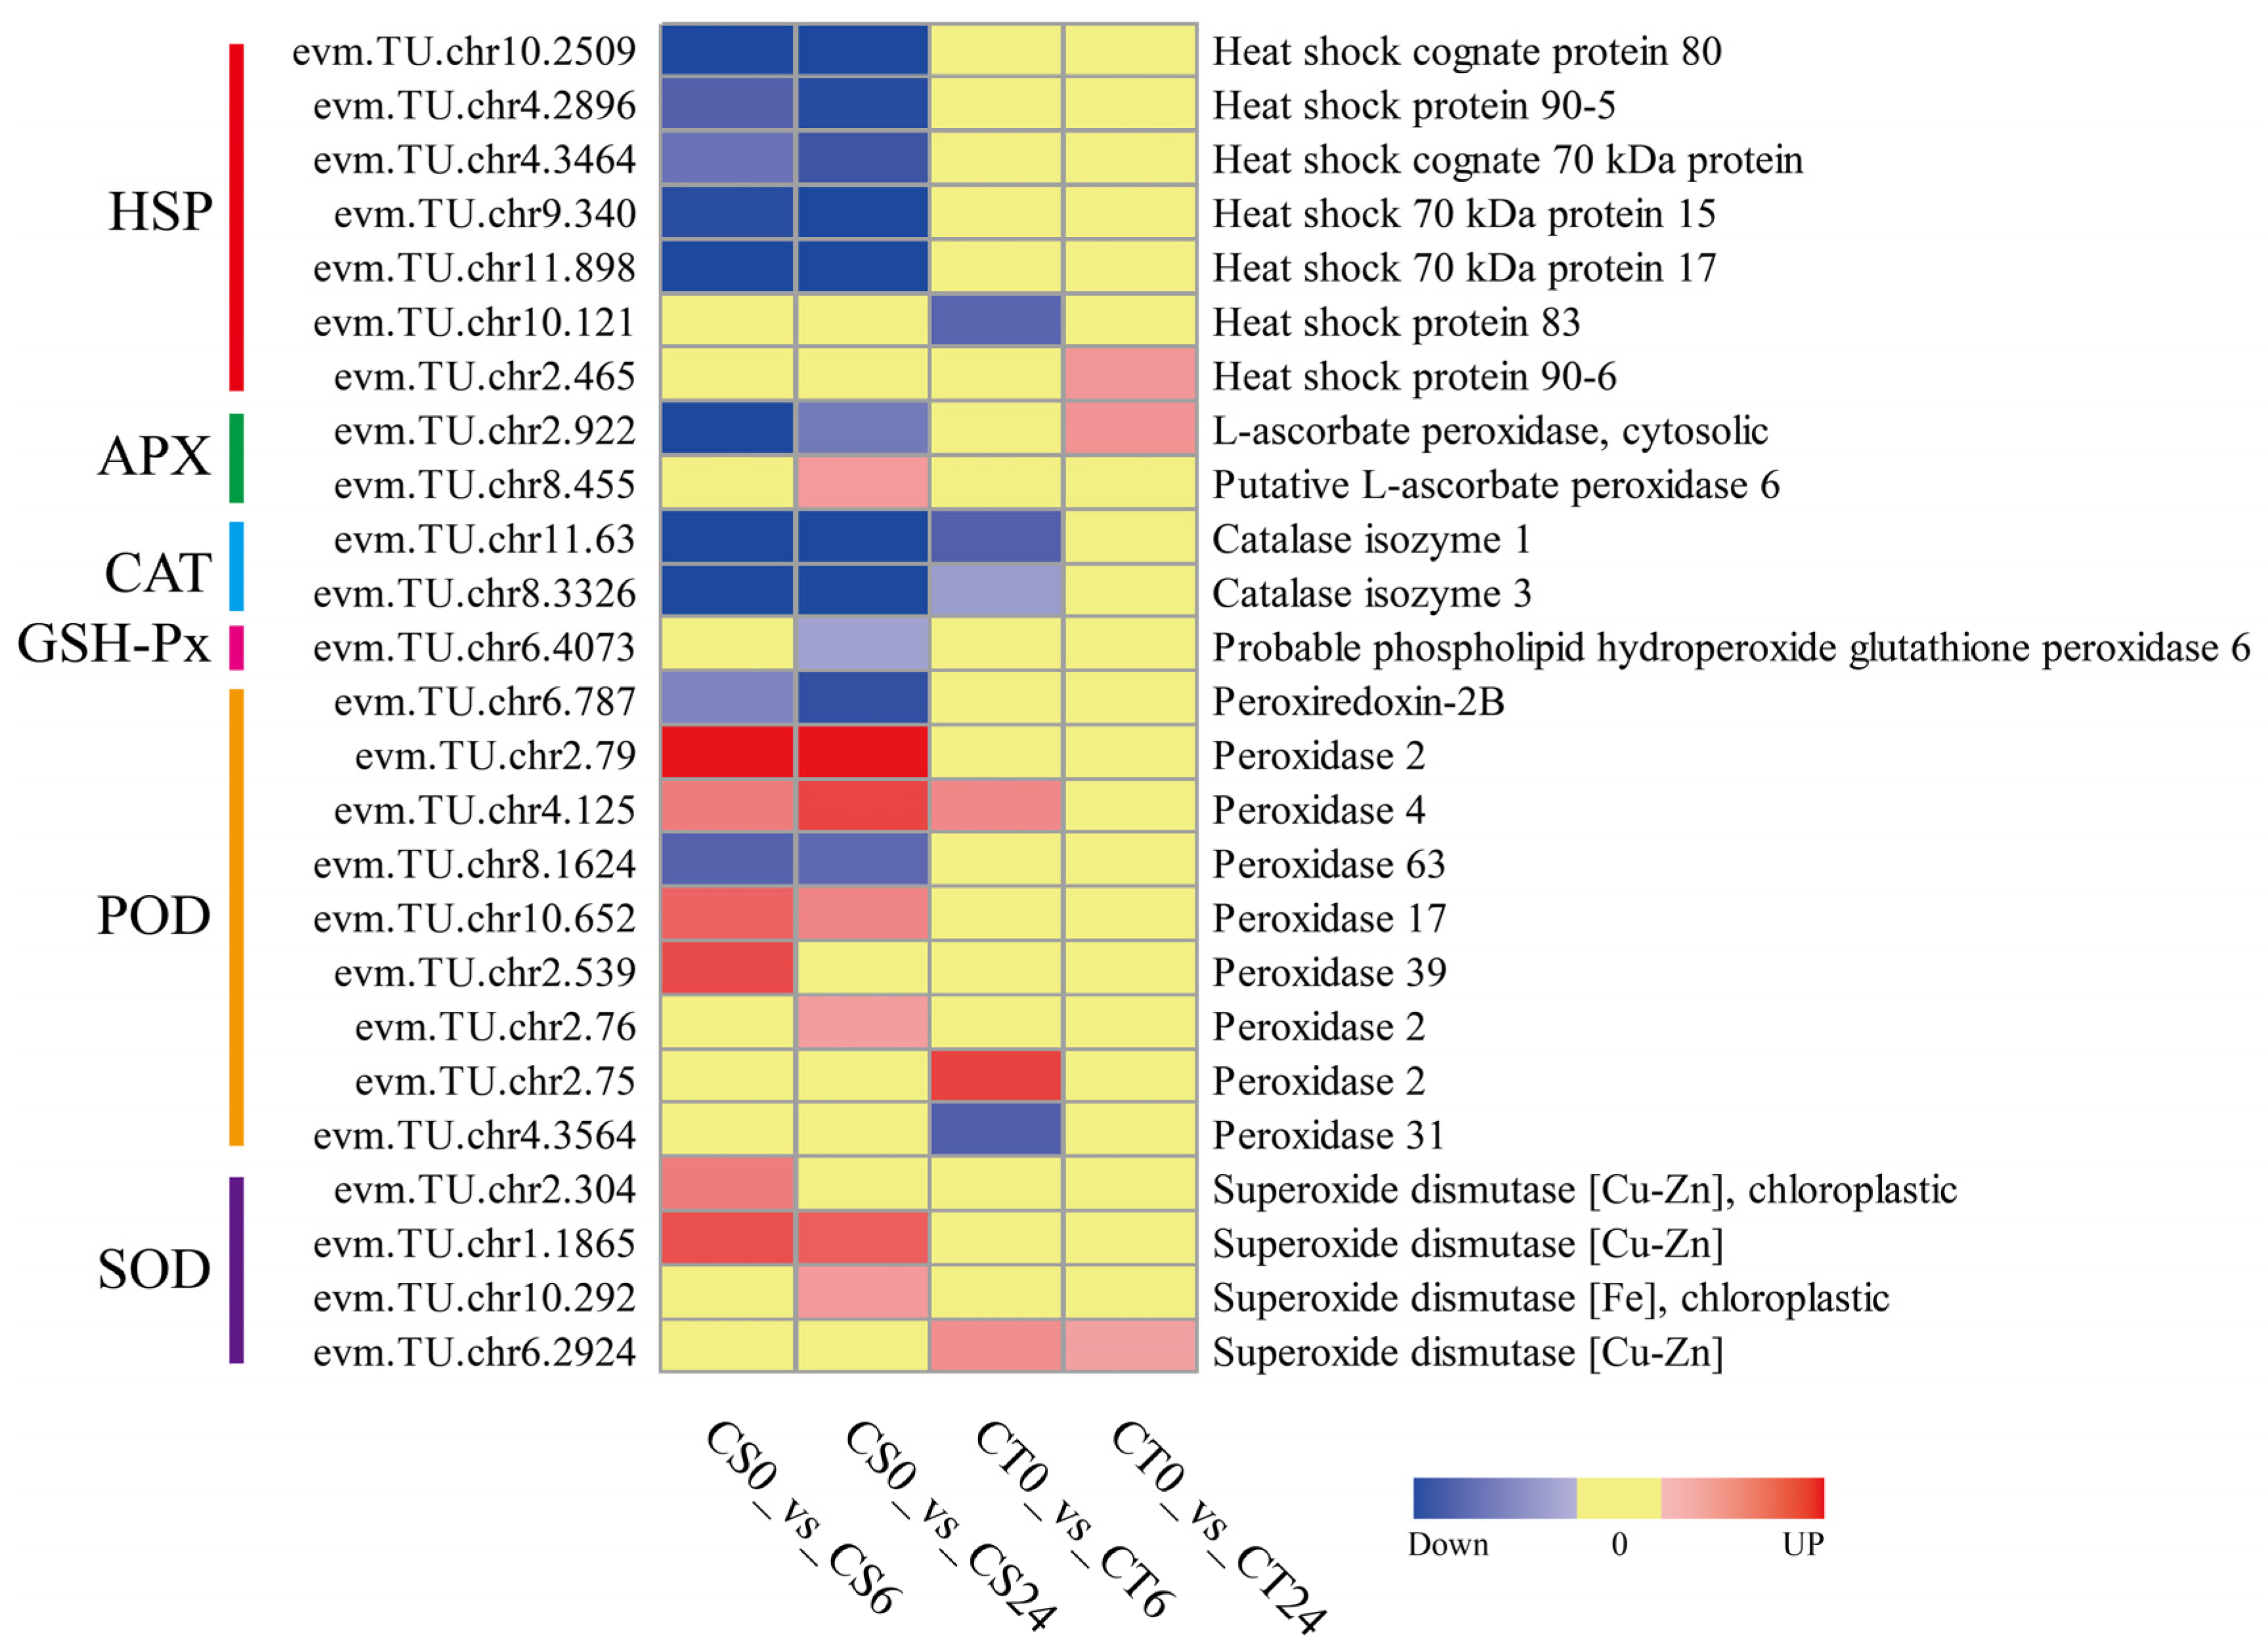
The prevailing view was that the Heat shock protein (Hsp) functions as a cytosolic chaperone, playing a key role in mediating essential processes such as protein folding, degradation, complex assembly, and translocation. Thus, we performed a proteomic screening and identified seven DAPs that encode HSPs (Figure 4). Among these seven HSPs, five were down-regulated in the CS genotypes under cold stress, while in the CT genotypes, one was down-regulated and one (evm.TU.chr2.465) was up-regulated.
We further analyzed the expression of several antioxidant enzymes to elucidate the mechanisms that mitigate oxidative damage in response to cold stress. A total of eighteen antioxidant enzymes were identified, among which two were annotated as L-ascorbate peroxidase (APX), two as Catalase isozyme (CAT), one as phospholipid hydroperoxide glutathione peroxidase (GSH-Px), nine as Peroxidase (POD), and four as Superoxide dismutase (SOD). Among these antioxidant enzymes, nine were up-regulated in CS plants, while four were up-regulated in CT plants after cold stress.

3.4. K-Mean Cluster Analysis of DAPs Between Two Genotypes

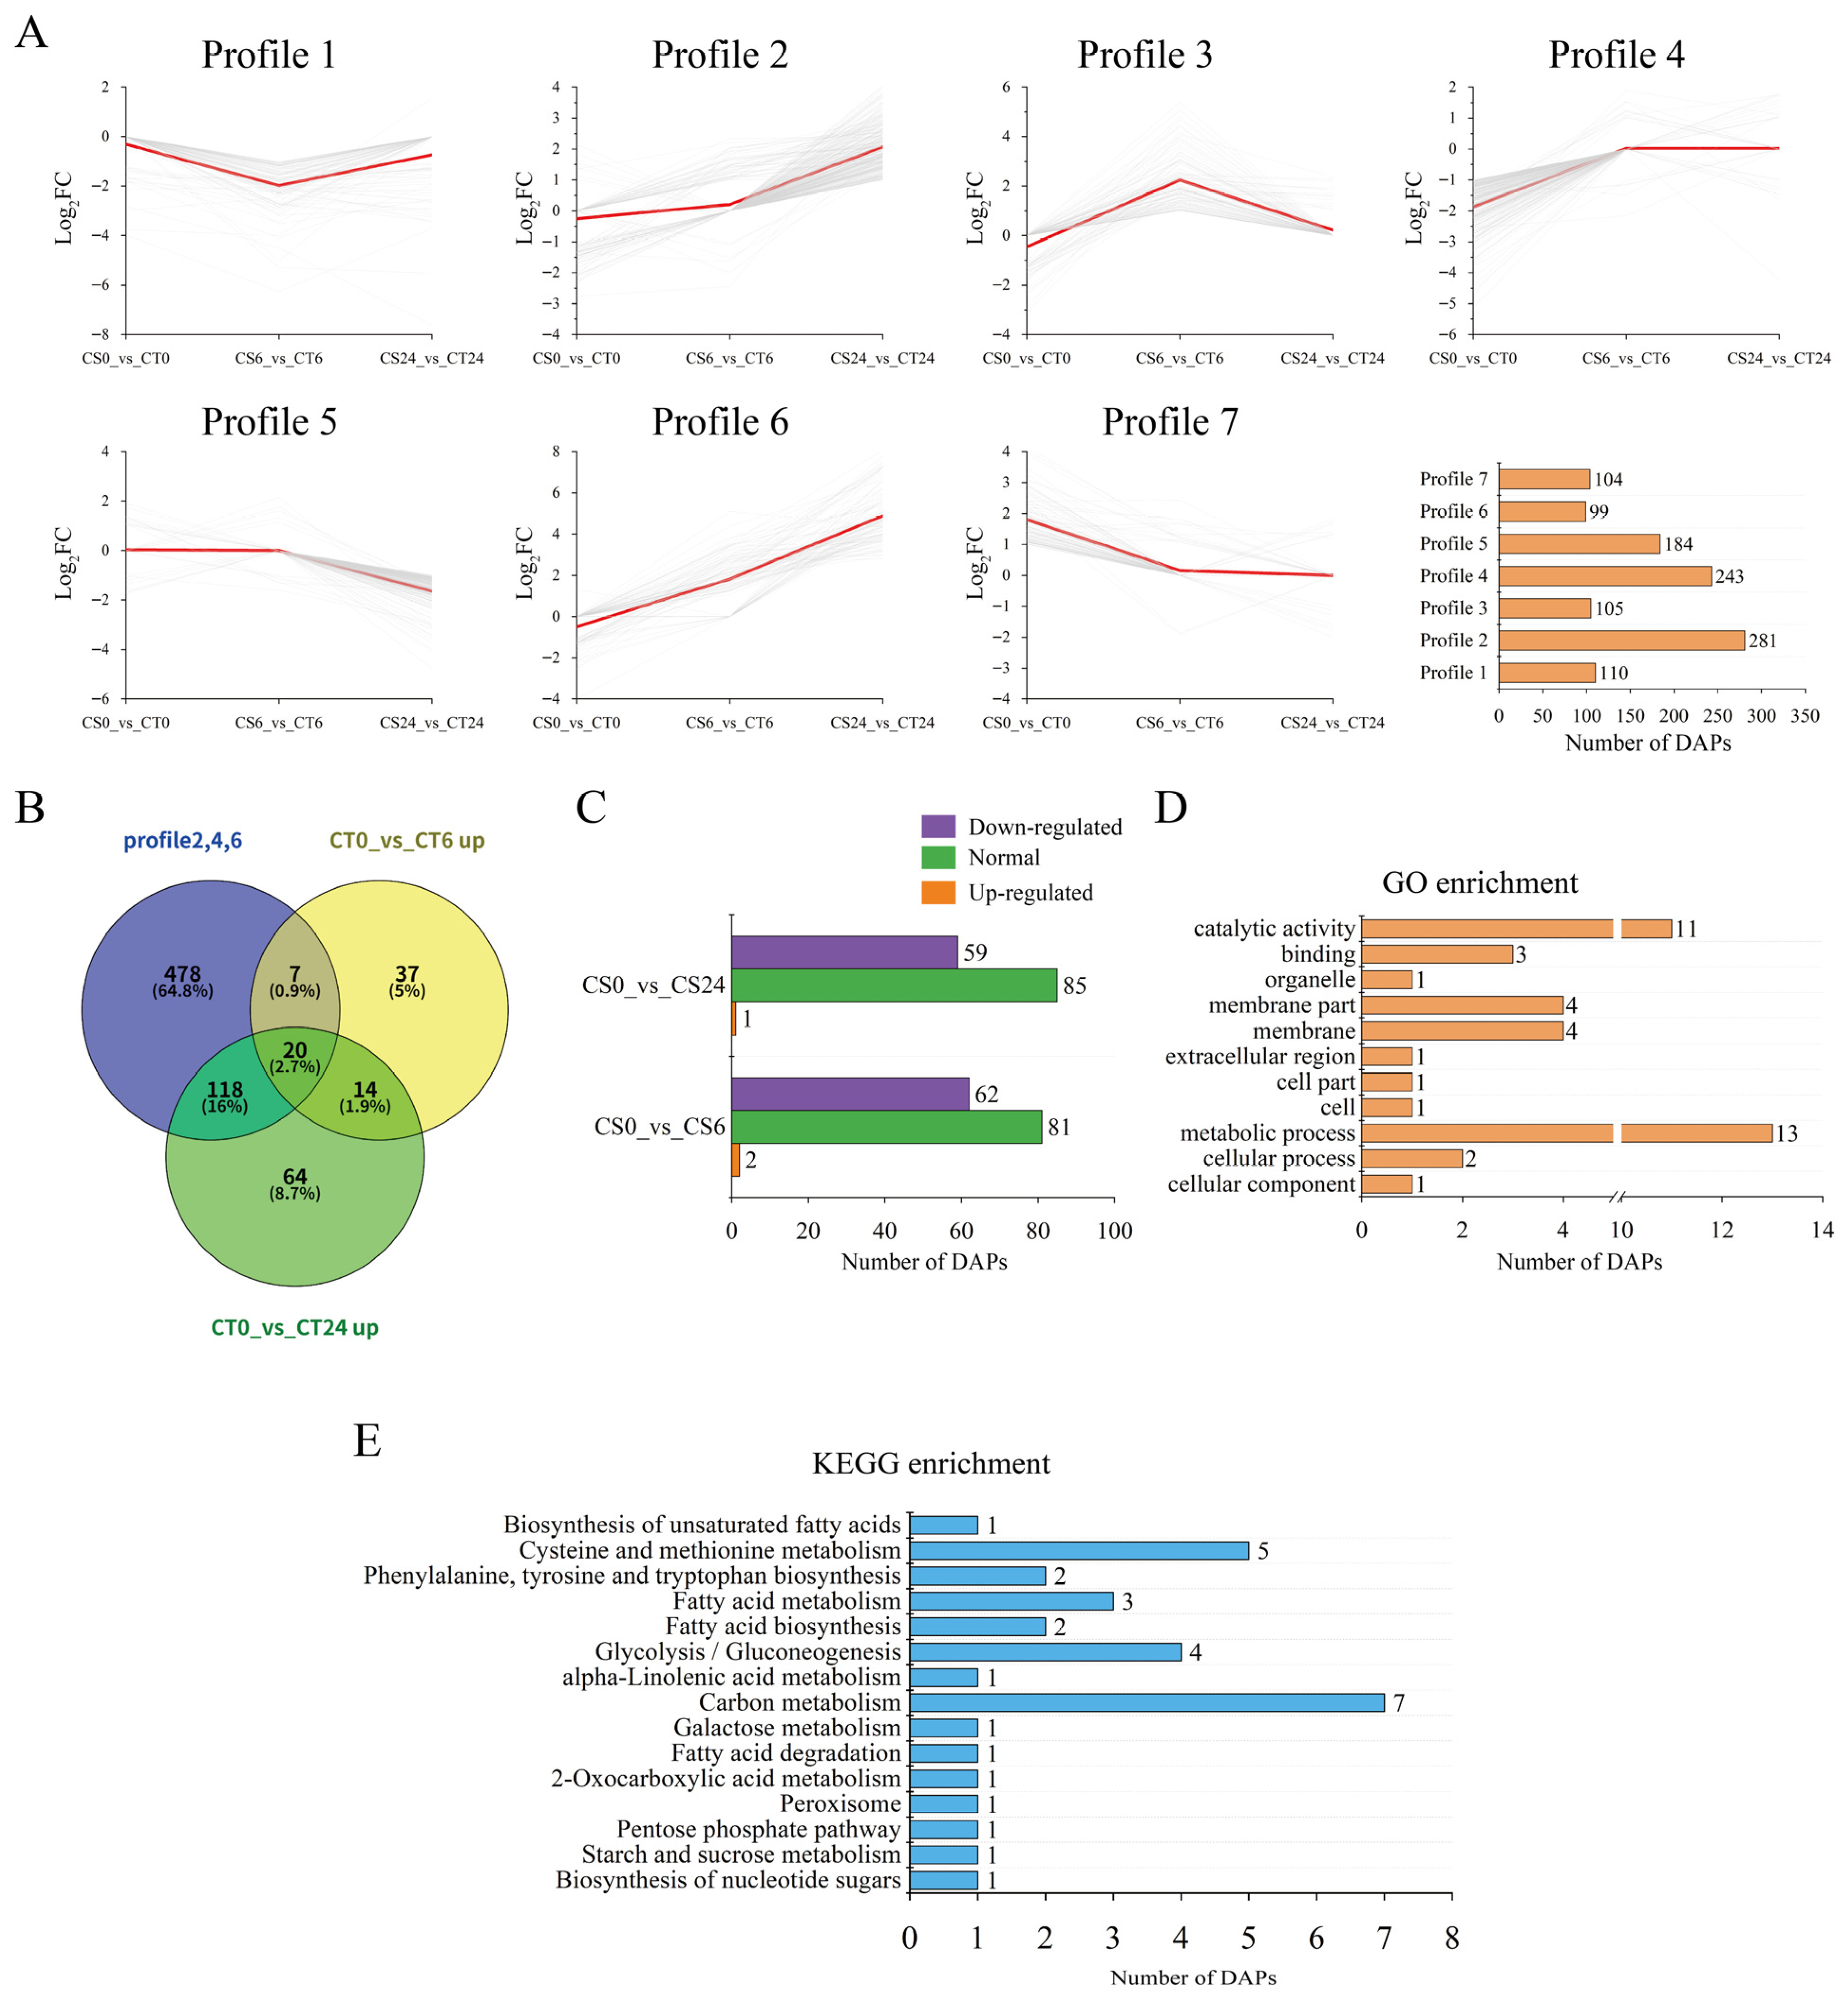
To elucidate changes in DAPs between the two genotypes under cold stress, K-means cluster analysis was applied using three comparisons: CS0_vs_CT0, CS6_vs_CT6, and CS24_vs_CT24 (Figure 5A). DAPs in three comparisons were divided into seven groups. According to the DAPs trend in three comparisons, these seven groups were approximately subdivided into three forms: form I (DAPs demonstrated an overall increasing trend, including profiles 2, 4, and 6), form II (DAPs demonstrated an overall decreasing trend, including profiles 5 and 7), and form III (DAPs returned to normal levels at 24 h, profiles 1 and 3). Then, we took the intersection of the DAPs from three sources: Form I, the up-regulated DAPs in CT0_vs_CT6, and the up-regulated DAPs in CT0_vs_CT24. 145 DAPs were identified, and most of these DAPs exhibited normal or down-regulated expression in the CS genotype during cold stress. These results revealed that these 145 DAPs might contribute to cold tolerance in CT plants (Figure 5B).
These 145 DAPs were then subjected to GO and KEGG enrichment analysis. GO analysis revealed that these DAPs were primarily enriched in the following terms: “metabolic process,” “catalytic activity,” and “membrane” (Figure 5D). Meanwhile, KEGG analysis results exhibited that most of these DAPs were participants in “Carbon metabolism,” “Cysteine and methionine metabolism,” and “Glycolysis/Gluconeogenesis pathway” (Figure 5E).

3.5. Differential Changes in Metabolites Under Cold Stress

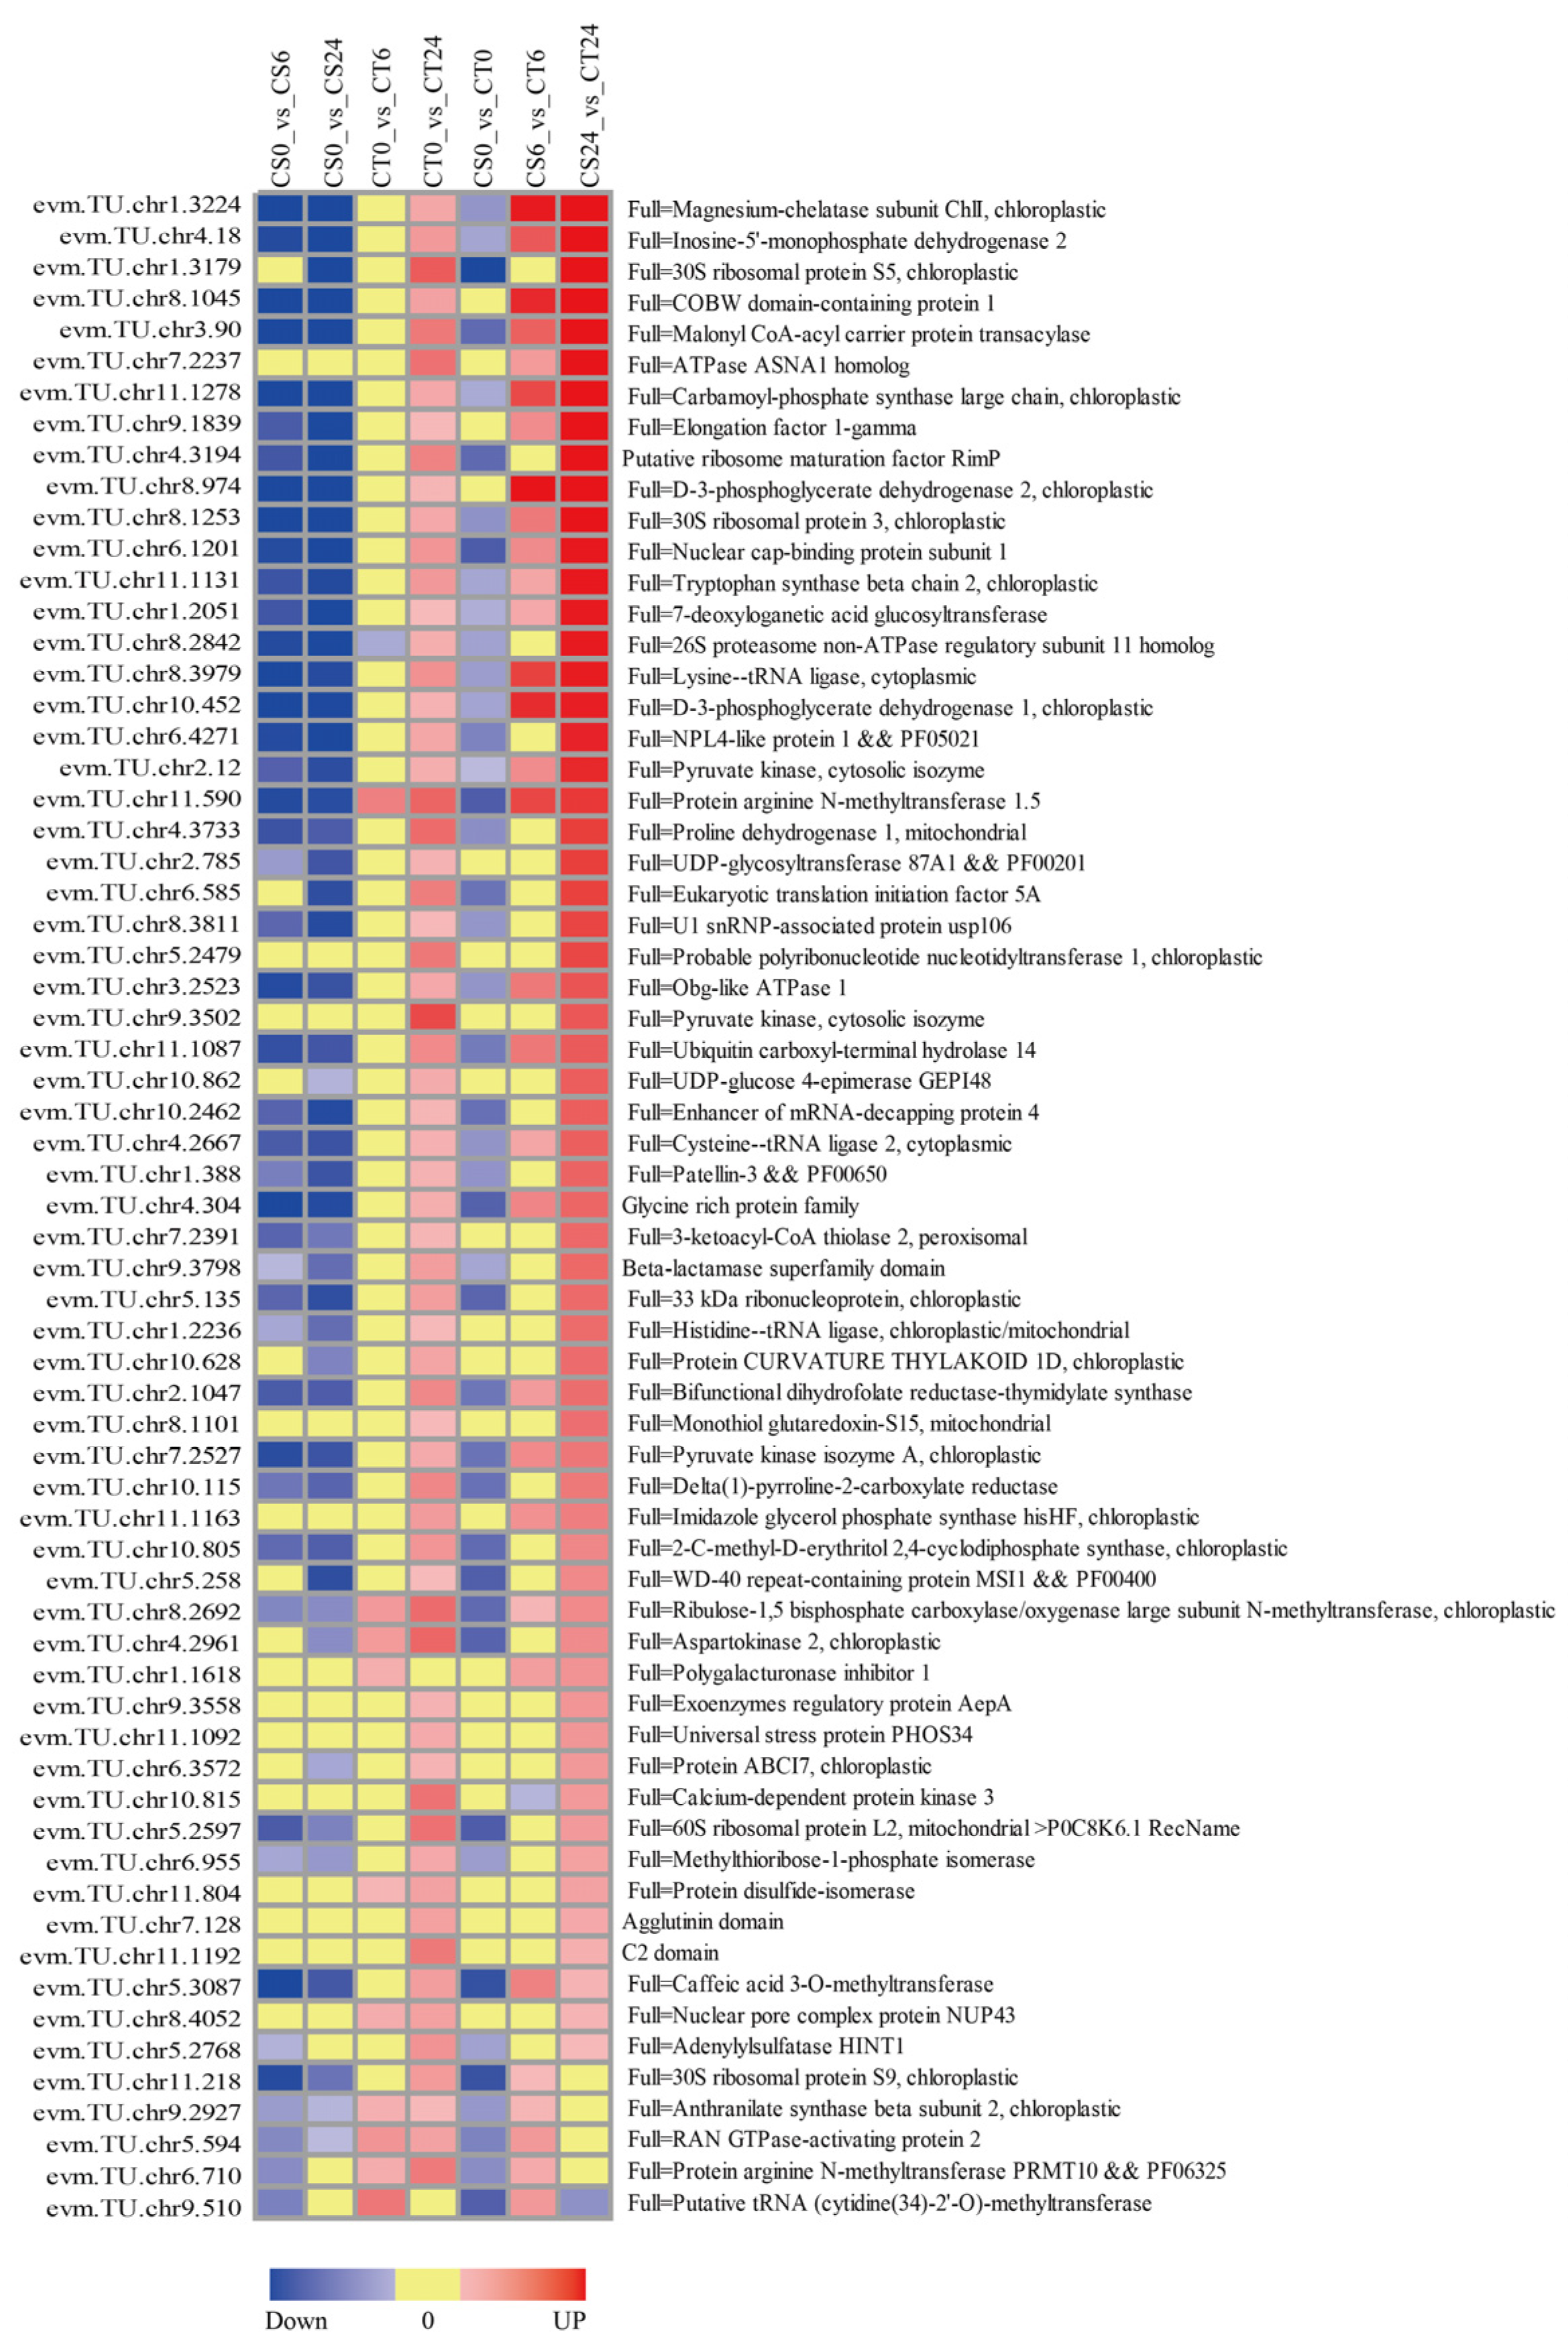
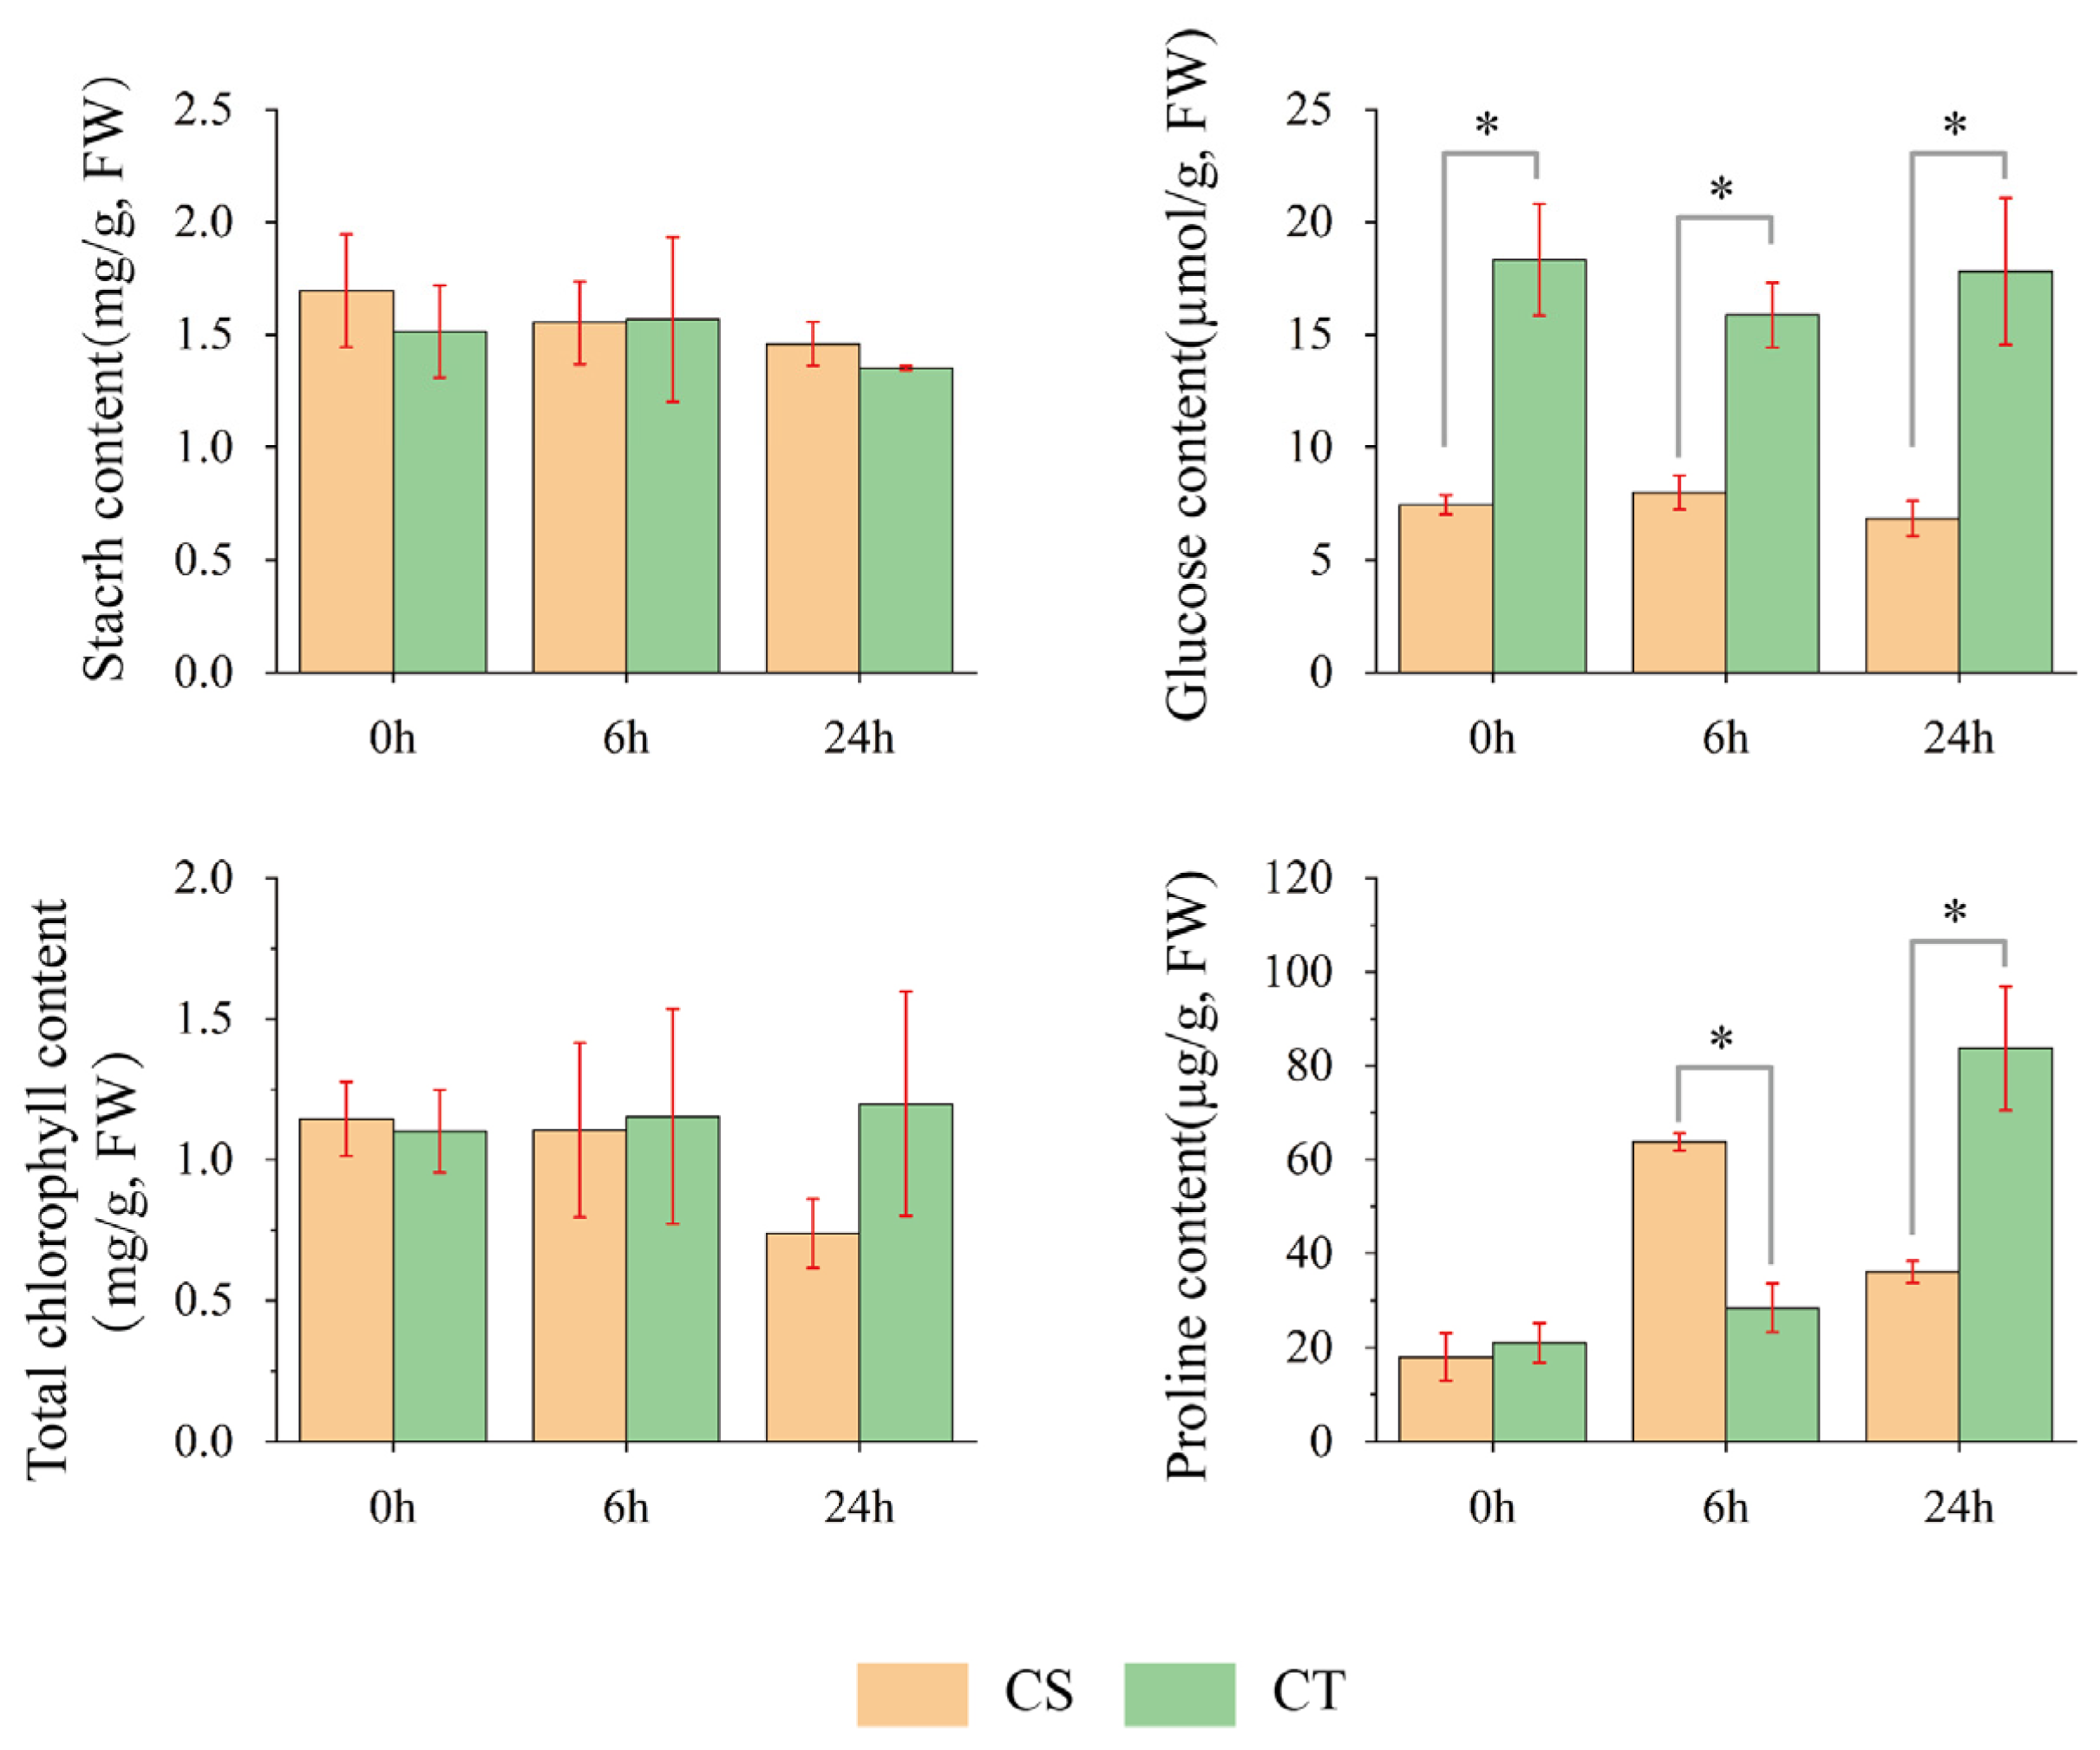
From the 145 DAPs, 65 DAPs were selected that were either down-regulated or exhibited normal conditions in the CS0_vs_CT0 comparison but became up-regulated after cold stress in either the CS6_vs_CT6 or CS24_vs_CT24 comparison. Of these 65 DAPs, a total of 19 were related to chloroplasts (Figure 6). Then, we detected the total chlorophyll content of CS and CT plants during cold stress (Figure 7). No significant differences were observed in total chlorophyll content between CS and CT plants under cold treatment at both 0 h and 6 h. After 24 h of cold stress, despite a decreasing trend in the total chlorophyll content of CS plants, the difference compared to CT plants was not statistically significant.
Proline is widely studied for its role in plant stress regulation. Two proteins (evm.TU.chr10.115 and evm.TU.chr4.3733) related to proline synthesis and catabolism were identified among these 65 DAPs. The gene evm.TU.chr10.115 encodes for Delta(1)-pyrroline-2-carboxylate reductase, which catalyzes the conversion of the pyrrole-2-carboxylic acid (P2C) to proline in the final step of proline biosynthesis. The gene evm.TU.chr4.3733 encodes for proline dehydrogenase 1, which catalyzes the first step of proline catabolism by oxidizing proline to 1-pyrroline-5-carboxylic acid (P5C), thereby playing a pivotal role in energy metabolism, stress response, and cellular recovery. Then, we detected the proline content in two genotypes during cold stress (Figure 7). Before cold stress, there was no significant difference in proline content between the two genotypes. After 6 h of cold stress, proline content in the cold-sensitive (CS) genotypes was significantly higher than in the cold-tolerant (CT) genotype; however, after 24 h, it became significantly lower.
Among these 65 DAPs, evm.TU.chr10.862 encoded a UDP-glucose 4-epimerase that catalyzes the reversible interconversion between UDP-glucose and UDP-galactose. Then we detected the glucose content of two genotypes. The glucose content in both CS and CT plants remained constant during cold stress; however, the levels in CT plants were significantly higher than those in CS plants. For starch content, no significant difference was observed between the two genotypes during cold stress (Figure 7).

4. Discussion

Cold stress, a major abiotic adversity, adversely affects plant growth and development and poses a serious threat to crop yield [18,32]. In response to low-temperature environments, plants activate complex molecular and physiological regulatory networks [33,34]. Proteomic studies play a pivotal role in elucidating these adaptive mechanisms [21]. Proteomic technologies, such as two-dimensional gel electrophoresis (2D-PAGE), isobaric tags for relative and absolute quantitation (iTRAQ), and label-free quantitative proteomics, have greatly facilitated the identification of differentially expressed proteins in plants under cold stress, leading to a deeper understanding of their cold adaptation strategies [35,36,37]. In this study, label-free quantitative proteomics was employed to investigate the differential responses of two genotypes—cold-sensitive (CS) and cold-tolerant (CT)—to cold stress. These findings provide valuable insights for the molecular breeding of cold-resistant bitter gourd varieties.
Plant materials with different genotypes exhibit differential expression in their proteomes under cold stress, which reflects the complex molecular regulation underlying plant adaptation to low-temperature environments [38]. These differences are manifested not only in the types and abundance of proteins but also involve the activation or inhibition of various biological pathways, thereby influencing the plant’s physiological and biochemical status as well as its stress resistance capacity. In coconuts, the Xiangshui coconut (XS, cold-sensitive type) and the Hainan Tall coconut (BD, cold-tolerance type) exhibited significant differences in protein quantity under 8 °C cold treatment. The BD plants showed a greater number of up-regulated DAPs than the XS plants following cold stress [39]. Similar phenomena were observed in our study, and the results indicate that cold-tolerant materials exhibited more active protein changes under cold stress.
The perception of cold stress represents the first step in plant adaptation to low temperatures. The plasma membrane was widely regarded as the key site for this perception, with alterations in its fluidity leading to the induction of multiple signaling cascades [40,41]. DAPs from both CS and CT genotypes were enriched in the GO term “membrane” after cold stress, but there was no overlap between the CS and CT in these DAPs. This indicates that the specific proteins regulating the cell membrane in response to cold stress differ between the two genotypes. The influx of calcium ions (Ca2+) serves as a pivotal early signal in the plant cold response. Upon entering the cytosol, these Ca2+ fluctuations are directly perceived by Calcium-Dependent Protein Kinases (CDPKs) via their N-terminal calmodulin-like domain. Ca2+ binding induces a conformational change that activates the kinase. Subsequently, the activated CDPKs phosphorylate downstream target proteins, initiating a signal transduction cascade [42,43]. In this study, evm.TU.chr10.815, which encodes a CDPK3 protein, demonstrated higher accumulation in CT plants than in CS plants after 24 h of cold stress treatment. These results indicate that evm.TU.chr10.815 may contribute to the enhanced cold tolerance observed in CT plants.
The effect of cold stress on chlorophyll content in plants is an important aspect of plant physiology research [44]. It is typically demonstrated as a decrease in chlorophyll content, which directly affects the plant’s photosynthetic efficiency, growth, and development [45,46]. However, different genotypes show varied responses in chlorophyll content to cold stress. Before and after cold acclimation, there was no significant difference in chlorophyll content between the inner and outer leaves of the pakchoi genotype G-04. In contrast, genotype Y-05 exhibited a significant decrease in total chlorophyll in the inner leaves and a significant increase in the outer leaves [47]. In this study, total chlorophyll content showed no significant change in CT plants after cold stress, in contrast to a non-significant decrease observed in CS plants. Additionally, 19 DAPs related to chloroplasts were identified as up-regulated in CT plants compared to CS plants. These DAPs might have helped stabilize the total chlorophyll content after cold stress.
In response to cold stress, plants modulate their sugar metabolism and accumulation as a key adaptive strategy to improve freezing tolerance [48,49,50]. Studies have demonstrated that cold stress generally induces a significant increase in soluble sugar concentration in plants [48,49,50]. Functioning as key osmolytes, these accumulated sugars lower the cellular freezing point and increase cytoplasmic viscosity under low-temperature conditions, thereby protecting cells from freeze-induced damage [51]. In our study, the higher glucose content in CT plants might contribute to greater cold tolerance than that in CS plants. Studies have indicated that after cold stress, the increase in soluble sugar content has been attributed to starch degradation [52]. However, this phenomenon is not universal. In our study, both starch and glucose content exhibited no significant change in CT and CS plants during cold stress. Meanwhile, a study on durum wheat (Triticum durum Desf.) reported no significant change in soluble sugar content under cold stress compared to the control group [53]. These findings indicate that sugar accumulation in response to cold stress is species and genotype-dependent.
Low-temperature stress significantly promotes the accumulation of free proline in plant leaves [54,55]. The increased proline content helps maintain cellular turgor and osmotic balance, stabilizes protein structures, protects enzyme activity, and reduces membrane lipid peroxidation, thereby protecting cells against oxidative injury [56]. In our study, CS plants exhibited higher proline content than CT plants in the early stage of cold stress. However, at the 24 h cold stress, CT plants surpassed CS plants in proline accumulation. Our results were consistent with previous studies, indicating that different cultivars of the same species exhibit variable proline accumulation levels and distinct response patterns under cold stress [57]. Proteomic analysis revealed the up-regulation of two key proline metabolic enzymes in CT plants compared to CS plants: evm.TU.chr10.115 (Delta(1)-pyrroline-2-carboxylate reductase, P5CR) and evm.TU.chr4.3733 (proline dehydrogenase 1, PDH). It has been reported that in grapevines, proline biosynthesis-related genes (P5CS1, P5CS2, and P5CR) and catabolism-related genes (PDH and P5CDH) were coordinately regulated under abiotic stress to modulate proline accumulation [58]. Thus, evm.TU.chr10.115 and evm.TU.chr4.3733 were crucial for CT plants’ cold tolerance.
Under low-temperature stress, plants accumulate reactive oxygen species (ROS), including superoxide anions (O2) and hydrogen peroxide (H2O2), which cause damage to cell membranes, proteins, and nucleic acids [59,60]. The antioxidant enzyme system alleviates cellular oxidative damage by catalyzing the conversion and scavenging of these ROS [61]. In pepper, CaMYB80 enhances cold tolerance by interacting with CaPOA1 to increase POD activity [16]. In chrysanthemum, DgPR1 enhances cold tolerance by enhancing POD activity [62]. Thus, higher antioxidant enzyme activity under cold stress is associated with higher cold tolerance. After cold stress, CS plants exhibited up-regulation of nine antioxidant enzymes, in contrast to only four in CT plants. Increased abundance of antioxidant enzymes does not necessarily imply elevated enzymatic activity. Enzyme proteins may accumulate abnormally due to impaired degradation pathways, yet lack normal function.
As molecular chaperones, HSPs are primarily known for their role in maintaining the functional conformation of proteins under high-temperature stress [63]. Recent studies have demonstrated that they also exhibit protective effects under low-temperature stress [64]. For example, in Cut Lily, LbHSP17.9 expression is up-regulated under cold stress. Silencing of this gene leads to increased malondialdehyde (MDA) content and decreased CAT activity under cold treatment, indicating reduced resistance to cold stress [65]. In tomato, SlHSP17.7 is induced by low temperature, and its overexpression enhances cold stress tolerance [66]. Our study identified one HSP protein, evm.TU.chr2.465, as being up-regulated in CT plants, suggesting its potential contribution to CT cold tolerance.

5. Conclusions

Our study compared the proteomes of a cold-sensitive (CS) and a cold-tolerant (CT) line of bitter gourd under cold stress. Cold-tolerant genotypes exhibit more active protein changes under cold stress, while the specific proteins involved in the response differ between the two genotypes. In CT plants, the cold stress response involved a CDPK3 protein (evm.TU.chr10.815) and two key proline metabolic enzymes (evm.TU.chr10.115 and evm.TU.chr4.3733). Furthermore, the higher levels of glucose and proline measured in CT plants likely contributed to their enhanced cold tolerance. Collectively, this work provides important proteomic insights into the molecular basis of cold stress response in bitter gourd.

Author Contributions

Conceptualization, L.C. and H.L.; methodology, Y.N. and Z.L.; software, K.Y. and L.S.; validation, K.Y. and Y.W.; formal analysis, K.Y. and L.S.; investigation, K.Y. and Y.N.; resources, H.X. and Y.N.; data curation, Z.L. and Y.N.; writing—original draft preparation, L.S. and K.Y.; writing—review and editing, L.S. and Y.W.; visualization, L.S. and K.Y.; supervision, L.C. and H.L.; project administration, L.C. and H.L.; funding acquisition, L.C. and H.L. All authors have read and agreed to the published version of the manuscript.

Funding

This research was funded by the Natural Science Foundation of Sichuan Province (grant number 2025ZNSFSC0183), the Natural Science Foundation of Jiangsu Province (grant number BK20242004), the Key Research and Development Program of Jiangsu Province (grant number Be2022339) and the 2025 Chengdu Agricultural Technology Transfer Project.

Data Availability Statement

The raw data applied in this work were released on Integrated Proteome Resources (https://www.iprox.cn/, accessed on 30 December 2025), with the Project ID IPX0014752000.

Conflicts of Interest

The authors declare no conflicts of interest.

References

  1. Raza, M.A.; Sohail, H.; Hassan, M.A.; Sajad, S.; Xing, Y.; Song, J. Cold stress in Brassica vegetables: Morpho-physiological and molecular responses underlying adaptive mechanism. Sci. Hortic. 2024, 329, 113002. [Google Scholar] [CrossRef]
  2. Jan, S.; Rustgi, S.; Barmukh, R.; Shikari, A.B.; Leske, B.; Bekuma, A.; Sharma, D.; Ma, W.; Kumar, U.; Kumar, U.; et al. Advances and opportunities in unraveling cold-tolerance mechanisms in the world’s primary staple food crops. Plant Genome 2024, 17, e20402. [Google Scholar] [CrossRef] [PubMed]
  3. Soualiou, S.; Duan, F.; Li, X.; Zhou, W. CROP PRODUCTION UNDER COLD STRESS: An understanding of plant responses, acclimation processes, and management strategies. Plant Physiol. Biochem. 2022, 190, 47–61. [Google Scholar] [CrossRef]
  4. Kang, H.; Thomas, H.R.; Xia, X.; Shi, H.; Zhang, L.; Hong, J.; Shi, K.; Zhou, J.; Yu, J.; Zhou, Y. An integrative overview of cold response and regulatory pathways in horticultural crops. J. Integr. Plant Biol. 2025, 67, 1028–1059. [Google Scholar] [CrossRef] [PubMed]
  5. Guo, X.; Yu, X.H.; Lin, C.Y.; Zhao, P.J.; Wang, B.; Zou, L.P.; Li, S.X.; Yu, X.L.; Chen, Y.H.; Zhang, P.; et al. Down-regulation of MeMYB2 leads to anthocyanin accumulation and increases chilling tolerance in cassava (Manihot esculenta Crantz). Crop J. 2023, 11, 1181–1191. [Google Scholar] [CrossRef]
  6. Swain, R.; Sahoo, S.; Behera, M.; Rout, G.R. Instigating prevalent abiotic stress resilience in crop by exogenous application of phytohormones and nutrient. Front. Plant Sci. 2023, 14, 1104874. [Google Scholar] [CrossRef] [PubMed]
  7. Dai, T.; Ban, S.; Han, L.; Li, L.; Zhang, Y.; Zhang, Y.; Zhu, W. Effects of exogenous glycine betaine on growth and development of tomato seedlings under cold stress. Front. Plant Sci. 2024, 15, 1332583. [Google Scholar] [CrossRef]
  8. Tan, S.P.; Kha, T.C.; Parks, S.E.; Roach, P.D. Bitter melon (Momordica charantia L.) bioactive composition and health benefits: A review. Food Rev. Int. 2016, 32, 181–202. [Google Scholar] [CrossRef]
  9. Huang, H.; Chen, F.; Long, R.; Huang, G. The antioxidant activities in vivo of bitter gourd polysaccharide. Int. J. Biol. Macromol. 2020, 145, 141–144. [Google Scholar] [CrossRef]
  10. Liu, J.; Guo, Y.; Sun, J.; Lei, Y.; Guo, M.; Wang, L. Extraction methods, multiple biological activities, and related mechanisms of Momordica charantia polysaccharide: A review. Int. J. Biol. Macromol. 2024, 263, 130473. [Google Scholar] [CrossRef]
  11. Tan, S.P.; Stathopoulos, C.; Parks, S.; Roach, P. An Optimised Aqueous Extract of Phenolic Compounds from Bitter Melon with High Antioxidant Capacity. Antioxidants 2014, 3, 814–829. [Google Scholar] [CrossRef]
  12. Rohajatien, U.; Harijono; Estiasih, T.; Sriwahyuni, E. Bitter Melon (Momordica Charantia L.) Fruit Decreased Blood Glucose Level and Improved Lipid Profile of Streptozotocin Induced Hyperglycemia Rats. Curr. Res. Nutr. Food Sci. J. 2018, 6, 359–370. [Google Scholar] [CrossRef]
  13. Deligiannidou, G.E.; Pritsa, A.; Nikolaou, A.; Poulios, E.; Kontogiorgis, C.; Papadopoulou, S.K.; Giaginis, C. Nutraceutical Potential of Bitter Melon (Momordica charantia) on Cancer Treatment: An Overview of In Vitro and Animal Studies. Curr. Issues Mol. Biol. 2025, 47, 425. [Google Scholar] [CrossRef]
  14. Wang, H.; Li, L.; Sun, D.-W.; Ma, L.; Han, L.; He, X.; Wang, Q.; Watkins, C.B.; Zuo, J.; Zheng, Y. Multi-omics analysis of the effects of low-temperature storage on chilling injury of bitter gourd. Postharvest Biol. Technol. 2024, 218, 113161. [Google Scholar] [CrossRef]
  15. Yang, X.; Wang, K.; Guan, F.; Shi, B.; Xie, Y.; Du, C.; Tang, T.; Yang, Z.; Ma, S.; Wan, X. The Bitter Gourd Transcription Factor McNAC087 Confers Cold Resistance in Transgenic Arabidopsis. Plants 2025, 14, 3440. [Google Scholar] [CrossRef]
  16. Xiao, J.; Wang, D.; Liang, L.; Xie, M.; Tang, Y.; Lai, Y.S.; Sun, B.; Huang, Z.; Zheng, Y.; Li, H. CaMYB80 enhances the cold tolerance of pepper by directly targeting CaPOA1. Hortic. Res. 2024, 11, uhae219. [Google Scholar] [CrossRef]
  17. Meng, D.; Li, S.; Feng, X.; Di, Q.; Zhou, M.; Yu, X.; He, C.; Yan, Y.; Wang, J.; Sun, M.; et al. CsBPC2 is essential for cucumber survival under cold stress. BMC Plant Biol. 2023, 23, 566. [Google Scholar] [CrossRef]
  18. Feng, Y.; Li, Z.; Kong, X.; Khan, A.; Ullah, N.; Zhang, X. Plant Coping with Cold Stress: Molecular and Physiological Adaptive Mechanisms with Future Perspectives. Cells 2025, 14, 110. [Google Scholar] [CrossRef] [PubMed]
  19. Gusain, S.; Joshi, S.; Joshi, R. Sensing, signalling, and regulatory mechanism of cold-stress tolerance in plants. Plant Physiol. Biochem. 2023, 197, 107646. [Google Scholar] [CrossRef] [PubMed]
  20. Kamali, S.; Singh, A. Genomic and Transcriptomic Approaches to Developing Abiotic Stress-Resilient Crops. Agronomy 2023, 13, 2903. [Google Scholar] [CrossRef]
  21. Jan, N.; Qazi, H.A.; Raja, V.; John, R. Proteomics: A tool to decipher cold tolerance. Theor. Exp. Plant Physiol. 2019, 31, 183–213. [Google Scholar] [CrossRef]
  22. Hashiguchi, A.; Ahsan, N.; Komatsu, S. Proteomics application of crops in the context of climatic changes. Food Res. Int. 2010, 43, 1803–1813. [Google Scholar] [CrossRef]
  23. Santanoo, S.; Vongcharoen, K.; Banterng, P.; Vorasoot, N.; Jogloy, S.; Roytrakul, S.; Theerakulpisut, P. Physiological and Proteomic Responses of Cassava to Short-Term Extreme Cool and Hot Temperature. Plants 2022, 11, 2307. [Google Scholar] [CrossRef] [PubMed]
  24. Ning, Y.; Liu, Z.; Liu, J.; Qi, R.; Xia, P.; Yuan, X.; Xu, H.; Chen, L. Comparative transcriptomics analysis of tolerant and sensitive genotypes reveals genes involved in the response to cold stress in bitter gourd (Momordica charantia L.). Sci. Rep. 2024, 14, 16564. [Google Scholar] [CrossRef]
  25. Li, J.; Li, H.; Quan, X.; Shan, Q.; Wang, W.; Yin, N.; Wang, S.; Wang, Z.; He, W. Comprehensive analysis of cucumber C-repeat/dehydration-responsive element binding factor family genes and their potential roles in cold tolerance of cucumber. BMC Plant Biol. 2022, 22, 270. [Google Scholar] [CrossRef] [PubMed]
  26. Cox, J.; Hein, M.Y.; Luber, C.A.; Paron, I.; Nagaraj, N.; Mann, M. Accurate proteome-wide label-free quantification by delayed normalization and maximal peptide ratio extraction, termed MaxLFQ. Mol. Cell. Proteomics 2014, 13, 2513–2526. [Google Scholar] [CrossRef]
  27. Su, L.; Xie, Y.; He, Z.; Zhang, J.; Tang, Y.; Zhou, X. Network response of two cherry tomato (Lycopersicon esculentum) cultivars to Cadmium stress as revealed by transcriptome analysis. Ecotoxicol. Environ. Saf. 2021, 222, 112473. [Google Scholar] [CrossRef] [PubMed]
  28. Su, H.; Zhang, Y.; Liu, Y.; Lu, R.; Gao, A.; Han, Q.; Wen, B.; Hu, B.; Yang, P. Enhancing Bioavailability of Fertilizer through an Amyloid-Like Protein Coating. Adv. Mater. 2023, 35, e2300829. [Google Scholar] [CrossRef]
  29. Yuan, Z.; Wang, J.; Qu, Q.; Zhu, Z.; Xu, M.; Zhao, M.; Sun, C.; Peng, H.; Huang, X.; Dong, Y.; et al. Celastrol Combats Methicillin-Resistant Staphylococcus aureus by Targeting Δ1-Pyrroline-5-Carboxylate Dehydrogenase. Adv. Sci. 2023, 10, e2302459. [Google Scholar] [CrossRef]
  30. Wei, X.; Wu, D.; Li, J.; Wu, M.; Li, Q.; Che, Z.; Cheng, X.; Cheng, Q.; Yin, F.; Zhang, H.; et al. Myeloid beta-arrestin 2 depletion attenuates metabolic dysfunction-associated steatohepatitis via the metabolic reprogramming of macrophages. Cell Metab. 2024, 36, 2281–2297. [Google Scholar] [CrossRef]
  31. Yang, T.; Huang, Y.; Liao, L.; Wang, S.; Zhang, H.; Pan, J.; Huang, Y.; Li, X.; Chen, D.; Liu, T.; et al. Sucrose-associated SnRK1a1-mediated phosphorylation of Opaque2 modulates endosperm filling in maize. Mol. Plant. 2024, 17, 788–806. [Google Scholar] [CrossRef]
  32. Kazemi-Shahandashti, S.S.; Maali-Amiri, R. Global insights of protein responses to cold stress in plants: Signaling, defence, and degradation. J. Plant Physiol. 2018, 226, 123–135. [Google Scholar] [CrossRef]
  33. Yan, L.; Shah, T.; Cheng, Y.; Lü, Y.; Zhang, X.K.; Zou, X.L. Physiological and molecular responses to cold stress in rapeseed (Brassica napus L.). J. Integr. Agric. 2019, 18, 2742–2752. [Google Scholar] [CrossRef]
  34. Jahed, K.R.; Saini, A.K.; Sherif, S.M. Coping with the cold: Unveiling cryoprotectants, molecular signaling pathways, and strategies for cold stress resilience. Front. Plant Sci. 2023, 14, 1246093. [Google Scholar] [CrossRef]
  35. Wang, T.; Ye, C.; Wang, M.; Chu, G. Identification of cold-stress responsive proteins in Anabasis aphylla seedlings via the iTRAQ proteomics technique. J. Plant Interact. 2017, 12, 505–519. [Google Scholar] [CrossRef]
  36. Chen, J.; Zhou, G.; Dong, Y.; Qian, X.; Li, J.; Xu, X.; Huang, H.; Xu, L.; Li, L. Screening of Key Proteins Affecting Floral Initiation of Saffron Under Cold Stress Using iTRAQ-Based Proteomics. Front. Plant Sci. 2021, 12, 644934. [Google Scholar] [CrossRef]
  37. Bai, L.W.; Liu, J.; Dai, L.F.; Deng, Q.W.; Chen, Y.L.; Xie, J.K.; Luo, X.D. Identification and characterisation of cold stress-related proteins in Oryza rufipogon at the seedling stage using label-free quantitative proteomic analysis. Funct. Plant Biol. 2021, 48, 542–555. [Google Scholar] [CrossRef]
  38. Niu, Z.; Liu, L.; Pu, Y.; Ma, L.; Wu, J.; Hu, F.; Fang, Y.; Li, X.; Sun, W.; Wang, W.; et al. iTRAQ-based quantitative proteome analysis insights into cold stress of Winter Rapeseed (Brassica rapa L.) grown in the field. Sci. Rep. 2021, 11, 23434. [Google Scholar] [CrossRef]
  39. Yang, Y.; Saand, M.A.; Abdelaal, W.B.; Zhang, J.; Wu, Y.; Li, J.; Fan, H.; Wang, F. iTRAQ-based comparative proteomic analysis of two coconut varieties reveals aromatic coconut cold-sensitive in response to low temperature. J. Proteomics 2020, 220, 103766. [Google Scholar] [CrossRef]
  40. Takahashi, D.; Li, B.; Nakayama, T.; Kawamura, Y.; Uemura, M. Plant plasma membrane proteomics for improving cold tolerance. Front. Plant Sci. 2013, 4, 90. [Google Scholar] [CrossRef]
  41. Zhao, X.; Wei, Y.; Zhang, J.; Yang, L.; Liu, X.; Zhang, H.; Shao, W.; He, L.; Li, Z.; Zhang, Y.; et al. Membrane Lipids’ Metabolism and Transcriptional Regulation in Maize Roots Under Cold Stress. Front. Plant Sci. 2021, 12, 639132. [Google Scholar] [CrossRef]
  42. Iqbal, Z.; Memon, A.G.; Ahmad, A.; Iqbal, M.S. Calcium Mediated Cold Acclimation in Plants: Underlying Signaling and Molecular Mechanisms. Front. Plant Sci. 2022, 13, 855559. [Google Scholar] [CrossRef]
  43. Ding, Y.; Yang, H.; Wu, S.; Fu, D.; Li, M.; Gong, Z.; Yang, S. CPK28-NLP7 module integrates cold-induced Ca2+ signal and transcriptional reprogramming in Arabidopsis. Sci. Adv. 2022, 8, eabn7901. [Google Scholar] [CrossRef]
  44. Chen, X.; Gao, Z.; Yu, Z.; Ding, Q.; Qian, X.; Zhang, C.; Zhu, C.; Wang, Y.; Zhang, C.; Li, Y.; et al. BcWRKY53 promotes chlorophyll biosynthesis and cold tolerance of non-heading Chinese cabbage under cold stress. Plant Physiol. Biochem. 2025, 219, 109398. [Google Scholar] [CrossRef]
  45. Li, B.; Wang, W. Salicylic acid induces tolerance of Vitisriparia × V. labrusca to chilling stress by altered photosynthetic, antioxidant mechanisms and expression of cold stress responsive genes. Plant Signal. Behav. 2021, 16, 1973711. [Google Scholar] [CrossRef]
  46. Zhang, H.; Guo, J.; Chen, X.; Zhou, Y.; Pei, Y.; Chen, L.; ul Haq, S.; Zhang, M.; Gong, H.; Chen, R. Transcription factor CabHLH035 promotes cold resistance and homeostasis of reactive oxygen species in pepper. Hortic. Plant J. 2024, 10, 823–836. [Google Scholar] [CrossRef]
  47. Wang, H.; Li, Z.; Yuan, L.; Zhou, H.; Hou, X.; Liu, T. Cold acclimation can specifically inhibit chlorophyll biosynthesis in young leaves of Pakchoi. BMC Plant Biol. 2021, 21, 172. [Google Scholar] [CrossRef]
  48. Liu, L.; Zhang, P.; Feng, G.; Hou, W.; Liu, T.; Gai, Z.; Shen, Y.; Qiu, X.; Li, X. Salt priming induces low-temperature tolerance in sugar beet via xanthine metabolism. Plant Physiol. Biochem. 2023, 201, 107810. [Google Scholar] [CrossRef]
  49. Bian, H.; Zhou, Q.; Du, Z.; Zhang, G.; Han, R.; Chen, L.; Tian, J.; Li, Y. Integrated Transcriptomics and Metabolomics Analysis of the Fructan Metabolism Response to Low-Temperature Stress in Garlic. Genes 2023, 14, 1290. [Google Scholar] [CrossRef]
  50. Pu, Y.; Liu, L.; Wu, J.; Zhao, Y.; Bai, J.; Ma, L.; Yue, J.; Jin, J.; Niu, Z.; Fang, Y.; et al. Transcriptome Profile Analysis of Winter Rapeseed (Brassica napus L.) in Response to Freezing Stress, Reveal Potentially Connected Events to Freezing Stress. Int. J. Mol. Sci. 2019, 20, 2771. [Google Scholar] [CrossRef]
  51. Yamada, K.; Osakabe, Y. Sugar compartmentation as an environmental stress adaptation strategy in plants. Semin. Cell Dev. Biol. 2018, 83, 106–114. [Google Scholar] [CrossRef]
  52. Yue, C.; Cao, H.L.; Wang, L.; Zhou, Y.H.; Huang, Y.T.; Hao, X.Y.; Wang, Y.C.; Wang, B.; Yang, Y.J.; Wang, X.C. Effects of cold acclimation on sugar metabolism and sugar-related gene expression in tea plant during the winter season. Plant Mol. Biol. 2015, 88, 591–608. [Google Scholar] [CrossRef]
  53. Mallem, H.; Nakkab, S.; Houyou, Z. Biochemical Mechanisms in Durum Wheat (Triticum durum Desf.) under Abiotic Stress, Grown in a Hydroponic System. Russ. J. Plant Physiol. 2024, 71, 7. [Google Scholar] [CrossRef]
  54. Jankovska-Bortkevič, E.; Jurkonienė, S.; Gavelienė, V.; Šveikauskas, V.; Mockevičiūtė, R.; Vaseva, I.; Todorova, D.; Žižytė-Eidetienė, M.; Šneideris, D.; Prakas, P. Dynamics of Polyamines, Proline, and Ethylene Metabolism Under Increasing Cold in Winter Oilseed Rape. Int. J. Mol. Sci. 2023, 24, 11402. [Google Scholar] [CrossRef] [PubMed]
  55. Lv, J.; Feng, Y.; Jiang, L.; Zhang, G.; Wu, T.; Zhang, X.; Xu, X.; Wang, Y.; Han, Z. Genome-wide identification of WOX family members in nine Rosaceae species and a functional analysis of MdWOX13-1 in drought resistance. Plant Sci. 2023, 328, 111564. [Google Scholar] [CrossRef] [PubMed]
  56. Ghosh, U.K.; Islam, M.N.; Siddiqui, M.N.; Cao, X.; Khan, M.A.R. Proline, a multifaceted signalling molecule in plant responses to abiotic stress: Understanding the physiological mechanisms. Plant Biol. 2022, 24, 227–239. [Google Scholar] [CrossRef] [PubMed]
  57. Cai, P.; Lan, Y.; Gong, F.; Li, C.; Xia, F.; Li, Y.; Fang, C. Comparative physiology and transcriptome response patterns in cold-tolerant and cold-sensitive varieties of Solanum melongena. BMC Plant Biol. 2024, 24, 256. [Google Scholar] [CrossRef]
  58. Wei, T.-L.; Wang, Z.-X.; He, Y.-F.; Xue, S.; Zhang, S.-Q.; Pei, M.-S.; Liu, H.-N.; Yu, Y.-H.; Guo, D.-L. Proline synthesis and catabolism-related genes synergistically regulate proline accumulation in response to abiotic stresses in grapevines. Sci. Hortic. 2022, 305, 111373. [Google Scholar] [CrossRef]
  59. Dvořák, P.; Krasylenko, Y.; Zeiner, A.; Šamaj, J.; Takáč, T. Signaling Toward Reactive Oxygen Species-Scavenging Enzymes in Plants. Front. Plant Sci. 2021, 11, 618835. [Google Scholar] [CrossRef]
  60. Zhou, L.; Ullah, F.; Zou, J.; Zeng, X. Molecular and Physiological Responses of Plants that Enhance Cold Tolerance. Int. J. Mol. Sci. 2025, 26, 1157. [Google Scholar] [CrossRef]
  61. Wang, Y.; Wang, J.; Sarwar, R.; Zhang, W.; Geng, R.; Zhu, K.-M.; Tan, X.-L. Research progress on the physiological response and molecular mechanism of cold response in plants. Front. Plant Sci. 2024, 15, 1334913. [Google Scholar] [CrossRef]
  62. Tian, Y.; Feng, Y.; Wang, Y.; Deng, Q.; Luo, X.; Zhang, F.; Zhang, L.; Jiang, B.; Liu, Q. The overexpression of DgPR1 enhances chrysanthemum cold tolerance through the ROS-mediated pathway. Plant Sci. 2025, 356, 112493. [Google Scholar] [CrossRef]
  63. ul Haq, S.; Khan, A.; Ali, M.; Khattak, A.M.; Gai, W.-X.; Zhang, H.-X.; Wei, A.-M.; Gong, Z.-H. Heat Shock Proteins: Dynamic Biomolecules to Counter Plant Biotic and Abiotic Stresses. Int. J. Mol. Sci. 2019, 20, 5321. [Google Scholar] [CrossRef]
  64. Sadura, I.; Janeczko, A. Are Heat Shock Proteins Important in Low-Temperature-Stressed Plants? A Minireview. Agronomy 2024, 14, 1296. [Google Scholar] [CrossRef]
  65. Zhao, J.; Yan, X.; Huang, W.; Liu, C.; Hao, X.; Gao, C.; Deng, M.; Wen, J. LbHSP17.9 Participated in the Regulation of Cold Stress in Cut Lily Flowers. Horticulturae 2024, 10, 287. [Google Scholar] [CrossRef]
  66. Zhang, N.; Zhao, H.; Shi, J.; Wu, Y.; Jiang, J. Functional characterization of class I SlHSP17.7 gene responsible for tomato cold-stress tolerance. Plant Sci. 2020, 298, 110568. [Google Scholar] [CrossRef] [PubMed]
Figure 1. Characteristics of the identified DAPs in two bitter gourd genotypes. (A) PCA analysis of two bitter gourd genotype samples at different cold stages. (B) Number of DAPs in different comparisons, yellow bars represent up-regulated DAPs, and green bars represent down-regulated DAPs. (C) Venn diagram of DAPs in CS0_vs_CS24, CS0_vs_CS6, CT0_vs_CT24, and CT0_vs_CT6 comparisons. (D) Expression Profiles of the 18 common DAPs from the Venn Diagram, yellow bars represent up-regulated DAPs, and green bars represent down-regulated DAPs. (E) Heat map of the up-regulated DAPs in 18 common DAPs.
Horticulturae 12 00123 g001
Figure 2. Gene Ontology (GO) enrichment analysis of DAPs. (A) Functional classification of DAPs from CT0_vs_CT6, CT0_vs_CT24, CS0_vs_CS6, and CS0_vs_CS24 comparisons. The top and bottom x-axis represent the percentage of proteins and the number of proteins in each category, respectively. The y-axis represents the names of GO terms. The colors denote the following: green, the biological process; blue, the cellular component; red, the molecular function. (B) Stacked bar plot showing the number of up- (yellow) and down-regulated (green) DAPs within the three major GO terms in CT0_vs_CT6, CT0_vs_CT24, CS0_vs_CS6, and CS0_vs_CS24 comparison. The x-axis represents the number of DAPs, and the y-axis represents each comparison. (C) Expression profile heatmap of up-regulated DAPs across the three GO terms.
Horticulturae 12 00123 g002
Figure 3. KEGG pathway enrichment analysis of DAPs across CT0_vs_CT6, CT0_vs_CT24, CS0_vs_CS6, and CS0_vs_CS24 comparisons. Circles from inner to outer represent: 1. The annotation of the pathway; 2. Quantity of DAPs mapped to the pathway, where red and green bars denote up- and down-regulated proteins, respectively; 3. Total number of proteins annotated to the pathway; 4. KEGG enrichment pathway ID.
Horticulturae 12 00123 g003
Figure 4. Heatmap of Differentially Abundant Heat Shock Protein (HSP), L-ascorbate peroxidase (APX), Catalase isozyme (CAT), phospholipid hydroperoxide glutathione peroxidase (GSH-Px), Peroxidase (POD), and Superoxide dismutase (SOD) Profiles.
Horticulturae 12 00123 g004
Figure 5. Cluster and functional enrichment analysis of DAPs across comparisons. (A) K-means cluster analysis of DAPs identified in the CS0_vs_CT0, CS6_vs_CT6, and CS24_vs_CT24 comparisons. The y-axis represents the Log2Flodchange of each comparison. (B) Venn diagram illustrating the overlap between DAPs in profiles 2, 4, 6, and the up-regulated DAPs from the CT0_vs_CT6 and CT0_vs_CT24 comparisons. (C) Expression patterns of the 145 selected DAPs in CS genotypes under cold stress. (D) GO and (E) KEGG enrichment analysis of the 145 selected DAPs.
Horticulturae 12 00123 g005
Figure 6. Heatmap of DAPs identified by K-means cluster analysis.
Horticulturae 12 00123 g006
Figure 7. Dynamic changes in starch, glucose, total chlorophyll, and proline content in leaves of CS and CT plants in response to cold stress. * mean significant differences (p ≤ 0.05) among two genotypes.
Horticulturae 12 00123 g007
Disclaimer/Publisher’s Note: The statements, opinions and data contained in all publications are solely those of the individual author(s) and contributor(s) and not of MDPI and/or the editor(s). MDPI and/or the editor(s) disclaim responsibility for any injury to people or property resulting from any ideas, methods, instructions or products referred to in the content.