Article

Palmitoleic Acid Enhances the Tolerance of Lager Yeast to Oxidation Stress by Regulating the Multilevel Defense System

1
Shandong Provincial Key Laboratory of Food Biological Fermentation, Tsingtao Brewery Co., Ltd., Qingdao 266061, China
2
The State Key Laboratory of Microbial Technology, Shandong University, Jinan 266237, China
3
College of Food Science and Engineering, Ocean University of China, Qingdao 266003, China
*
Authors to whom correspondence should be addressed.
Fermentation 2026, 12(9), 436; https://doi.org/10.3390/fermentation12090436
Submission received: 22 August 2026 / Revised: 7 September 2026 / Accepted: 9 September 2026 / Published: 14 September 2026
(This article belongs to the Collection Yeast Biotechnology)

Abstract

Oxidative stress is a major physiological constraint on industrial lager yeast, compromising fermentation efficiency and flavor quality. Unsaturated fatty acids are known to influence membrane fluidity, but whether exogenous fatty acid supplementation can actively reprogram the yeast defense system, beyond serving as a passive membrane component, remains unclear. Here, we compared the effects of four fatty acids (palmitic, palmitoleic, oleic, and linoleic acid) on oxidative stress tolerance and fermentation performance in industrial lager yeast, under a defined chemical oxidative challenge (2.0 mM H2O2) in 15 °P wort, combining physiological assays with targeted gene-expression and untargeted metabolomic analyses; the dose was selected from a 0–2.0 mM gradient, with an ethanol-vehicle control included throughout. Among the fatty acids tested, palmitoleic acid (POA) most markedly enhanced oxidative stress tolerance, maintaining 91% cell viability, restoring intracellular pH to 6.1 by 24 h after transient acidification, and reducing ROS accumulation by 41.2%. Mechanistically, POA upregulated the antioxidant system, increasing catalase and glutathione peroxidase activities by 35.6% and 85.5%, respectively, and restoring glutathione levels by 35.5%. Metabolic profiling revealed a global reconfiguration, including a 2.6-fold increase in the stress-protectant proline and elevated pantothenate and coenzyme A levels, accompanied by a shift in the volatile profile toward esters, which rose from 26.1% to 60.3% of the total pool, alongside a 52.1% increase in total volatiles that did not reach significance after correction for multiple testing (q = 0.070); sensory evaluation confirmed higher fruity-estery intensity and lower soapy and staling notes in the POA beer. These findings identify POA as an active metabolic modulator, not merely a passive structural lipid, pointing to a non-transgenic nutritional strategy whose industrial value now requires validation under high-gravity, pilot-scale, and serial-repatching conditions.

1. Introduction

Driven by the demand for process efficiency, high-gravity brewing has become the prevailing mode of operation in modern fermentation. Conversely, this strategy exacts a substantial physiological cost on yeast cells, primarily in the form of oxidative stress [1]. Excessive accumulation of reactive oxygen species (ROS) does not simply damage cellular lipids and proteins; rather, it perturbs core metabolic processes and disrupts intracellular redox homeostasis [2]. Consequently, yeast cells reallocate resources from ethanol and flavor biosynthesis toward stress survival, which in turn diminishes fermentation kinetics and degrades the sensory properties of the final product [3]. Accordingly, precise control of the intracellular redox state to preserve metabolic robustness under stress has emerged as a central challenge in fermentation engineering.
Current strategies to mitigate oxidative damage predominantly rely on genetic engineering, including the heterologous expression of antioxidant enzymes [4]. Although these approaches can be effective, the stringent regulatory landscape governing genetically modified organisms (GMOs) constrains their industrial deployment [5]. In parallel, exogenous protectants such as trehalose have been introduced [6]. Nevertheless, they frequently trigger the “glucose effect,” suppressing carbon uptake and slowing cell growth [7]. Accordingly, in contrast to genetic modification or simple osmoprotectants, optimization of lipid nutritional regulation has emerged as a safer and increasingly favored strategy [8]. This is because fatty acids are essential constituents of the cell envelope and bioactive precursors [9]. The contribution of unsaturated fatty acids to membrane fluidity and integrity is well established [10]. However, among these lipids, palmitoleic acid (POA) functions as a critical determinant of membrane fluidity, being one of the primary monounsaturated fatty acids (MUFAs) synthesized by the rate-limiting enzyme OLE1. Yet this framework is reductionist and does not capture the systemic influence of lipids on intracellular metabolic networks. Thus, a critical knowledge gap remains: does exogenous fatty acid supplementation, specifically palmitoleic acid (POA), act only as a passive membrane building block, or does it function as an active metabolic modulator that signals a global reconfiguration of the yeast defense system [11]. Specifically, how POA coordinates the crosstalk between the physical cell-envelope barrier and intracellular redox–metabolic networks remain unresolved.
Exogenous fatty acid supplementation has been explored as a nutritional strategy to enhance yeast stress tolerance in several fermentation contexts. For instance, supplementation with oleic acid has been reported to improve membrane integrity and ethanol tolerance in Saccharomyces cerevisiae during high-gravity fermentation, while linoleic acid has been shown to influence sterol biosynthesis and anaerobic growth under oxygen-limited conditions [12]. Similarly, studies on wine yeast have demonstrated that the fatty acid profile of the fermentation medium directly shapes both stress resilience and volatile ester formation during fermentation [11]. However, most of these studies have focused on individual fatty acids in isolation, without systematically comparing saturated versus unsaturated species of differing chain length and desaturation degree, leaving the relative contribution of specific fatty acid structures to stress tolerance poorly defined.
To rigorously isolate the structure–function relationship underlying this putative regulatory role, a systematic comparison across fatty acids with defined structural differences is required. We therefore selected palmitic acid (C16:0, saturated), palmitoleic acid (C16:1, monounsaturated), oleic acid (C18:1, monounsaturated), and linoleic acid (C18:2, polyunsaturated) as a structurally graded panel, spanning chain length, degree of unsaturation, and double-bond position, to dissect whether POA’s protective effect stems specifically from its unique acyl-chain structure rather than from unsaturation or chain length alone.
In this study, we investigated whether exogenous fatty acids can improve oxidative stress tolerance in an industrial lager yeast. Oxidative stress was imposed chemically, by adding H2O2 to standard-gravity (15 °P) wort, so as to isolate the oxidative component of brewing stress under defined and reproducible conditions; this model does not reproduce the combined ethanol, osmotic and nutrient-limitation stresses of a genuine high-gravity fermentation, a restriction to which we return in the section on limitations and future work. We supplemented the wort with palmitic acid, palmitoleic acid, linoleic acid and oleic acid and compared their effects. We measured physiological parameters related to oxidative stress and fermentation performance, and then combined these data with targeted gene-expression and metabolomic analyses to clarify how these fatty acids reshape yeast stress responses. This integrated approach allowed us to identify the fatty acid that gave the best overall improvement in both oxidative tolerance and ester aroma formation. The results provide a mechanistic basis for using lipid nutrition, rather than genetic modification, to improve the oxidative robustness of brewing yeast, and they define the additional validation that would be required before industrial adoption.

2. Materials and Methods

2.1. Materials

The industrial lager yeast strain Saccharomyces pastorianus QingDao-02 was obtained from the Microbiological Culture Center of Tsingtao Brewery Co., Ltd. (Qingdao, China). Palmitoleic acid (POA), palmitic acid (PA), oleic acid (OA), and linoleic acid (LA; all of ≥99% purity) were purchased from Sigma-Aldrich (St. Louis, MO, USA). The BCA (bicinchoninic acid) protein assay kit, and assay kits for GSH, SOD, CAT, GSH-Px, and GR were purchased from Beyotime Biotechnology (Shanghai, China). All standards were acquired from Sigma-Aldrich (St. Louis, MO, USA), the reagents of chromatographic grade were obtained from Fisher Scientific (Fair Lawn, NJ, USA) and all other chemicals were of analytical grade and purchased from Aladdin (Shanghai, China).

2.2. Yeast Culture and Fermentation Conditions

Barley malt (Yongshuntai (Baoying) Malt Co., Ltd., Jiangsu, China) was mashed with water at a solid-to-liquid ratio of 1:4.5 (starting temperature 45 °C) using the following program: 48 °C for 30 min; ramped at 1 °C/min for 15 min; 63 °C for 40 min; ramped at 1 °C/min for 9 min; 72 °C for 20 min, until the iodine test showed no color reaction; and 78 °C for 10 min. The filtered wort was boiled for 60–80 min with hops added at 0.03% of total mass, filtered again, and adjusted to 15 °P with an Abbe refractometer [13].
Yeast cells were activated in 40 mL YPD medium at 28 °C, 180 rpm for 16–20 h, then expanded in 15 °P wort for 24 h at 28 °C. This culture was used to inoculate 150 mL of 15 °P wort (250 mL conical flask) at 1.2 × 10⁷ CFU/mL, and fermentation proceeded statically at 11 °C. Stock solutions of palmitic acid (C16:0), palmitoleic acid (C16:1), linoleic acid (C18:2) and oleic acid (C18:1) (Sigma-Aldrich, purity >99%) were prepared in absolute ethanol at 100 mM and added to the fermentation medium immediately after inoculation at a final concentration of 0.5 mM. This concentration was selected from a preliminary dose–response experiment (POA at 0, 0.1, 0.25, 0.5, 1.0 and 2.0 mM), in which cell viability and intracellular ROS were measured 72 h after oxidative challenge (Supplementary Table S2). Because the fatty acid stocks were prepared in ethanol, the carrier reached 0.5% (v/v) in every supplemented culture; an ethanol-vehicle control receiving the same volume of ethanol without fatty acid was therefore included in all experiments (Supplementary Table S3).
The experimental groups were: Control (15 °P wort only); Palmitic Acid Group (0.5 mM); Palmitoleic Acid Group (0.5 mM); Linoleic Acid Group (0.5 mM); Oleic Acid Group (0.5 mM); and Ethanol-vehicle Group (0.5% v/v absolute ethanol, no fatty acid). All fermentations were conducted statically at 11 °C in loosely capped 250 mL Erlenmeyer flasks; the initially air-saturated wort became progressively oxygen-limited as fermentation proceeded, but the strictly anaerobic, pressurized conditions of an industrial cylindroconical vessel were not reproduced. Oxidative stress was induced by adding H2O2 to a final concentration of 2.0 mM at OD600 ≈ 1.0 (mid-exponential phase), and fermentation continued for 24 h thereafter. Cells were then harvested at logarithmic phase (OD600 0.8–1.0) for intracellular assays.

2.3. Determination of Yeast Biomass and Microstructure

The biomass was determined using the dry weight method [14]. Yeast cells were collected and dried at 80 °C for 48 h in an oven (DHG-9070 A, Yiheng Technical Co., Ltd., Shanghai, China), followed by cooling in a desiccator and weighing. The microstructure was examined according to the previously described method [15]. Briefly, the collected yeast cells were fixed overnight at 4 °C with 2.5% glutaraldehyde. The fixed cells were rinsed with PBS and subsequently dehydrated using a graded ethanol series (30, 50, 70, 80, 90, 95, and 100%). After drying and gold coating, the samples were observed using a Zeiss EV018 SEM system (Carl Zeiss, Oberkochen, Germany).

2.4. Measurement of Intracellular pH and Ethanol Concentration

Intracellular pH was determined using the fluorescent probe 5(6)-carboxyfluorescein diacetate (CFDA) as previously described [8]. Briefly, yeast cells were gathered at the logarithmic growth phase (after approximately 16 h of cultivation), washed with a morpholine ethane sulfonic acid (MES) buffer, and resuspended before being mixed with the CFDA solution. Fluorescence intensity was tested at an emission wavelength of 518 nm and excitation wavelengths of 488 nm and 441 nm. The 488/441 nm ratio was converted into intracellular pH by means of a calibration curve constructed with cells equilibrated in buffers of defined pH between 4.0 and 7.0; the relationship was linear across this range (ratio = 0.452 × pH − 1.007, R2 = 0.998; Supplementary Table S7A). Rather than a single end-point value, intracellular pH was recorded at 0, 3, 6, 12, 24 and 48 h after the addition of H2O2. Extracellular pH was measured in cell-free supernatants with a calibrated glass electrode, and vacuolar pH was determined in parallel at 24 h. Vacuolar pH was determined with BCECF-AM using the same radiometric approach as the cytosolic CFDA assay. Because probe loading could in principle be affected by oxidative stress, cells pre-treated with 2.0 mM H2O2 for 1 h (matching the main experiments) were calibrated in parallel with untreated cells; the two calibration curves did not differ significantly in slope or intercept (ANCOVA, p = 0.13 and p = 0.19, respectively; Supplementary Table S7D), confirming that oxidative stress did not alter probe performance.
Ethanol concentration was quantified by gas chromatography (Agilent 7890B, Agilent Technologies, Santa Clara, CA, USA) with flame ionization detection [16]. Degassed samples were mixed with n-propanol (internal standard, 2% v/v) and filtered (0.45 μm). Separation was performed on a DB-WAXetr column (30 m × 0.32 mm × 0.5 μm) with the following temperature program: 40 °C (2 min), 10 °C/min to 100 °C, and 40 °C/min to 230 °C (hold 5 min). Quantification was based on peak area ratios relative to the internal standard.

2.5. Analysis of Intracellular Trehalose and Glycerol Content

Yeast cells were harvested from 20 mL cultures by centrifugation. The biomass was divided into two portions for dry cell weight (DCW) determination and intracellular metabolite extraction, respectively [17]. For metabolite extraction, the cells were disrupted using a JC-WB06 microwave digestion system (Jingce Electronic Technology Co., Ltd., Jinan, China) at 600 W for 1 min, with three independent replicates. After centrifugation, the supernatant was clarified via a 0.22 μm nylon membrane filter, and a 10 μL aliquot of the filtered supernatant was then subjected to HPLC analysis.
Trehalose and glycerol were quantified using an Agilent 1260 Infinity II HPLC system (Agilent Technologies, Santa Clara, CA, USA) equipped with a refractive index detector and a Hypersil NH2 column (4.6 × 250 mm, 5 μm). The mobile phase consisted of acetonitrile/water (70:30, v/v), with the column maintained at 30 °C. The flow rate was 1.0 mL/min, and the total run time was 15 min. Quantification was based on calibration curves generated from the respective trehalose and glycerol standards. The intracellular contents were normalized to DCW and expressed as mg/g DCW.

2.6. Measurement of Intracellular Antioxidant Enzyme Activities and Intracellular Environment

Antioxidant-related parameters were assessed in yeast cells harvested at the logarithmic phase. Approximately six million cells were collected by centrifugation, rinsed with PBS on three separate occasions, and disrupted with 0.5-mm glass beads over seven alternating cycles of 30-s vortexing and 1-min ice-bath cooling [18]; the resulting supernatant was assayed for intracellular GSH content and the enzymatic activities of CAT, GSH-Px, SOD, and GR using commercial kits following the manufacturers’ instructions, with total protein quantified in parallel by the BCA method for normalization. Intracellular ROS accumulation was assessed independently with the DCFH-DA fluorescent probe. After two rinses in ice-chilled PBS, log-phase cells received a 20-min dark incubation with the probe at ambient temperature, after which they were rewashed, resuspended, and read on a microplate reader (Ex 488 nm/Em 525 nm), with fluorescence values expressed relative to sample optical density.

2.7. Analysis of Gene Expression and Composition Related to the Yeast Cell Membrane and Wall

Samples were harvested at the logarithmic growth phase (after approximately 16 h of cultivation) for analysis of membrane fatty acid and ergosterol profiles. Fatty acids were extracted and methylated as previously described [19], then analyzed by GC-MS with a flame ionization detector and an HP-INNOWax capillary column (30 m × 250 μm × 0.25 μm). Samples were injected in split mode (20:1) at 250 °C with helium as carrier gas. The column was held at 100 °C for 5 min, ramped at 5 °C/min to 250 °C, held for 10 min, and then raised to 260 °C. The unsaturation index (UI) was calculated as described by Cui et al. [20]. Ergosterol was extracted and quantified following Jin et al. [15].
Total RNA was extracted and reverse-transcribed with the PrimeScript RT reagent kit per the manufacturer’s protocol. qRT-PCR was performed with SYBR Green Master Mix on a Bio-Rad CFX96 system. Five candidate reference genes (ALG9, ACT1, TAF10, UBC6, PDA1) were screened across all treatment groups; Ct values varied by ≤0.70 cycles (CV 0.61–1.19%), and ALG9 differed by only 0.07 cycles between control and POA groups (Supplementary Table S4). Expression was normalized to the geometric mean of the three most stable genes (ALG9, ACT1, TAF10) following Büchner et al. [21]; normalization to ALG9 alone changed values by <10% and did not alter gene ranking. Primer specificity was confirmed by single melting-curve peaks and single products of expected size; amplification efficiencies were determined from standard curves of serially diluted cDNA (Supplementary Table S1), consistent with MIQE guidelines [22]. Relative expression was calculated by the 2−ΔΔCT method. Primer sequences, amplification efficiencies and standard-curve correlation coefficients are given in Supplementary Table S1.

2.8. Metabolomics Analysis for Beer Fermentation

Metabolites were extracted following a modified version of a previously described procedure [23]. Lyophilized samples (100 mg) were mixed with 400 μL of a methanol–water solution (4:1, v/v), with L-2-chlorophenylalanine (0.02 mg/mL) serving as the internal standard, homogenized in a cryogenic tissue grinder for 6 min and then subjected to low-temperature sonication for 30 min. The resulting mixture was left to stand at −20 °C, after which the supernatant was obtained by centrifugation and used for LC-MS analysis.
Analysis was performed on a Q Exactive HF-X UHPLC-MS/MS system fitted with an HSS T3 column (100 mm × 2.1 mm, 1.8 μm) [24]. A 2 μL sample was injected, using two mobile-phase solvents, A (0.1% formic acid in water/acetonitrile, 95:5, v/v) and B (0.1% formic acid in acetonitrile/isopropanol/water, 47.5:47.5:5, v/v), delivered at a constant flow rate of 0.4 mL/min and a column temperature of 40 °C over an 8-min run; the full time-dependent gradient program is detailed in Table S5. Mass spectra were acquired in dual-polarity mode (m/z 70–1050; spray voltage ±3500 V; ion-transfer tube 325 °C; auxiliary gas heater 425 °C; sheath gas flow 50 psi; auxiliary gas flow 13 psi; collision energy 20–40–60 V; resolution 60,000/7500 for MS1/MS2). Pooled QC samples were run every six injections, with internal-standard RSD below 10%.

2.9. Sensory Evaluation

Beers from the control and POA groups were evaluated at the end of fermentation by a panel of 20 assessors from the sensory laboratory of Tsingtao Brewery Co., Ltd., all of whom had received training in beer sensory analysis. Samples were degassed, coded with three-digit random numbers and served at 10 ± 1 °C in identical dark glasses under red light. A triangle test was first performed in accordance with ISO 4120 to establish whether the two beers could be distinguished. Quantitative descriptive analysis was then carried out on four attributes—fruity/estery character, soapy or waxy character, stale aldehyde-like off-flavour, and overall acceptability—each rated on a nine-point intensity scale. Every assessor evaluated the samples in duplicate, and attribute scores are reported as panel means.

2.10. Statistical Analysis

Data were analyzed and visualized in Excel 2020 (Microsoft, Redmond, WA, USA), Origin 2024b (OriginLab, Northampton, MA, USA), and GraphPad Prism 8.0 (GraphPad Software, San Diego, CA, USA). All fermentations used three independent biological replicates (n = 3), each from a separate yeast culture and fermentation batch; analytical measurements were performed in technical triplicate per biological replicate. Values are reported as mean ± SD (n = 3). Group differences were assessed by one-way ANOVA with Tukey’s HSD test. Raw p values for the 16 planned POA-versus-control comparisons (Figure 1, Figure 2, Figure 3 and Figure 4) were corrected for multiple testing by the Barber–Samworth procedure [25]; an adjusted q < 0.05 was considered significant. Raw and adjusted values for each comparison are listed in Supplementary Table S6. Effect sizes, expressed as percentage differences between group means, and the underlying means, SDs and sample sizes are reported in the figures and Supplementary Tables.

3. Results

3.1. Fatty Acids Affect Yeast Microstructure, Biomass, Intracellular pH Homeostasis, and Ethanol Concentration Under Oxidative Stress

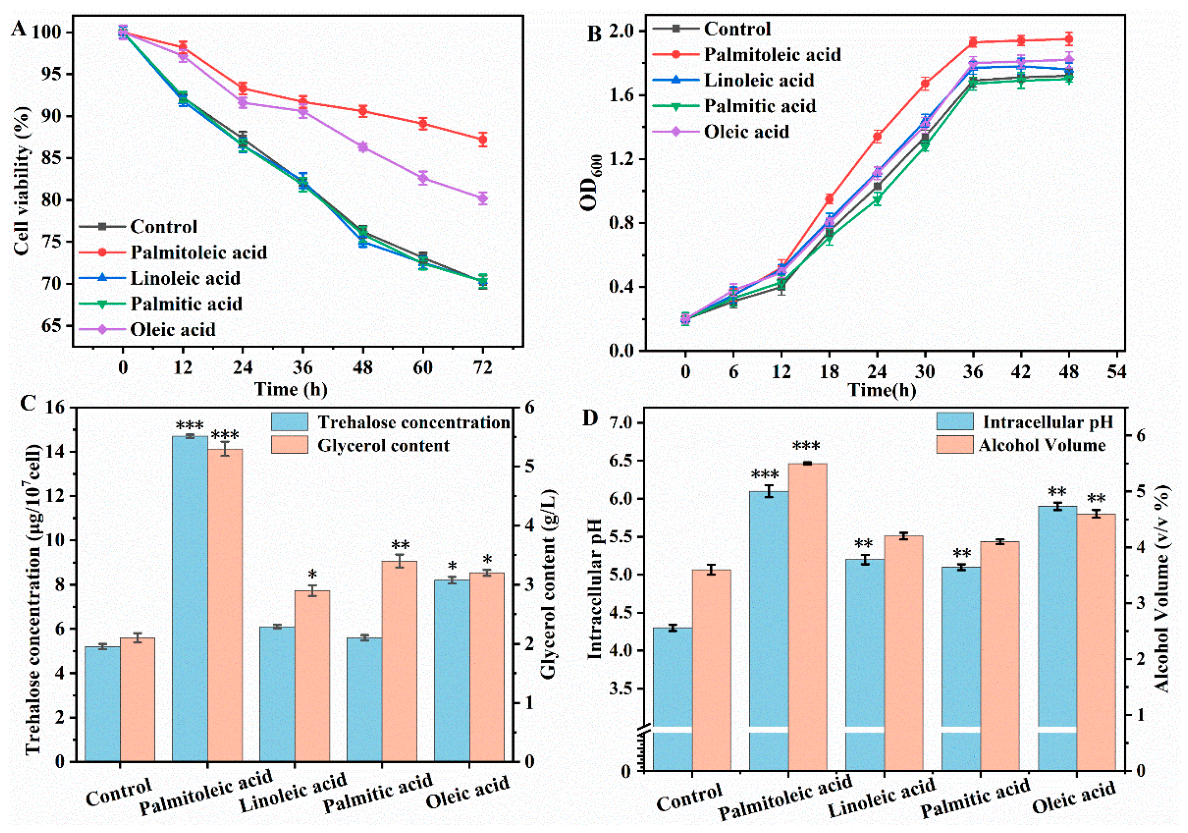
The concentration of POA used throughout this work was first established in a dose–response experiment. Viability measured 72 h after the oxidative challenge increased from 54.9% in the absence of POA to 68.3% at 0.1 mM, 80.4% at 0.25 mM, and peaked at 91.1% at 0.5 mM, before declining at higher concentrations (76.7% at 1.0 mM and 58.5% at 2.0 mM). Intracellular ROS levels mirrored this pattern, reaching a minimum of 58.3% of the unstressed control at 0.5 mM and rising to 166.4% at 2.0 mM (Supplementary Table S2). This biphasic response supported the selection of 0.5 mM as the working concentration for all subsequent experiments; as this dose–response series was performed as an independent experiment, its absolute viability values are not directly comparable with those reported in Figure 1A. Because fatty acids were delivered in absolute ethanol, an ethanol-vehicle control was also included. Cultures treated with 0.5% (v/v) ethanol alone were indistinguishable from the untreated control across all measured parameters (Supplementary Table S3), indicating that the effects reported below are attributable to the fatty acids themselves.
Fatty acid supplementation protected yeast cells against oxidative stress, reducing cell mortality and sustaining growth (Figure 1A,B). POA conferred the strongest protection, with viability reaching 87% at 72 h compared with 71% in the control; oleic acid showed an intermediate effect (~80%), while linoleic and palmitic acid tracked closely with the control (Figure 1A). POA-treated cultures also reached the highest final biomass, with OD600 reaching ~1.9 at 48 h compared with ~1.7 in the control (Figure 1B). Among intracellular stress markers quantified at 24 h, POA treatment produced the largest increase in compatible solutes, raising trehalose approximately threefold (~15 compared with ~5 µg/107 cells in the control) and glycerol 2.5-fold (~5 compared with ~2 g/L in the control); oleic and palmitic acid produced smaller increases, and linoleic acid the weakest (Figure 1C). POA treatment also best preserved intracellular pH and fermentation capacity: at 24 h, POA-treated cells maintained a near-neutral cytosolic pH (~6.1) and the highest ethanol yield (~5.5% v/v), followed by oleic acid (pH ~5.9, ~4.6% v/v) and linoleic/palmitic acid (pH ~5.1–5.2, ~4.5–5.1% v/v), while the control showed the lowest pH (~4.3) and ethanol yield (~3.6% v/v; Figure 1D).
Because a single end-point cannot establish that intracellular pH is stable, pH was monitored over 48 h (Supplementary Table S7B). Both groups acidified during the first 12 h, falling from pH 5.7 to 4.6 in the control and from 5.7 to 5.1 in POA-treated cells, then diverged: the control continued to acidify, reaching pH 4.3 at 24 h and 4.2 at 48 h, whereas POA-treated cells recovered to pH 6.1 at 24 h and held pH 6.0 at 48 h. This divergence was not attributable to the extracellular environment, as extracellular pH at 24 h was comparable between the two groups (3.7 in the POA group and 3.9 in the control). Vacuolar pH was also higher in POA-treated cells than in the control (5.2 and 4.1, respectively), consistent with preserved H+-ATPase activity in cells retaining higher ATP levels (Figure 2F).

3.2. POA Affects Cell Intracellular Redox Homeostasis Under Oxidative Stress

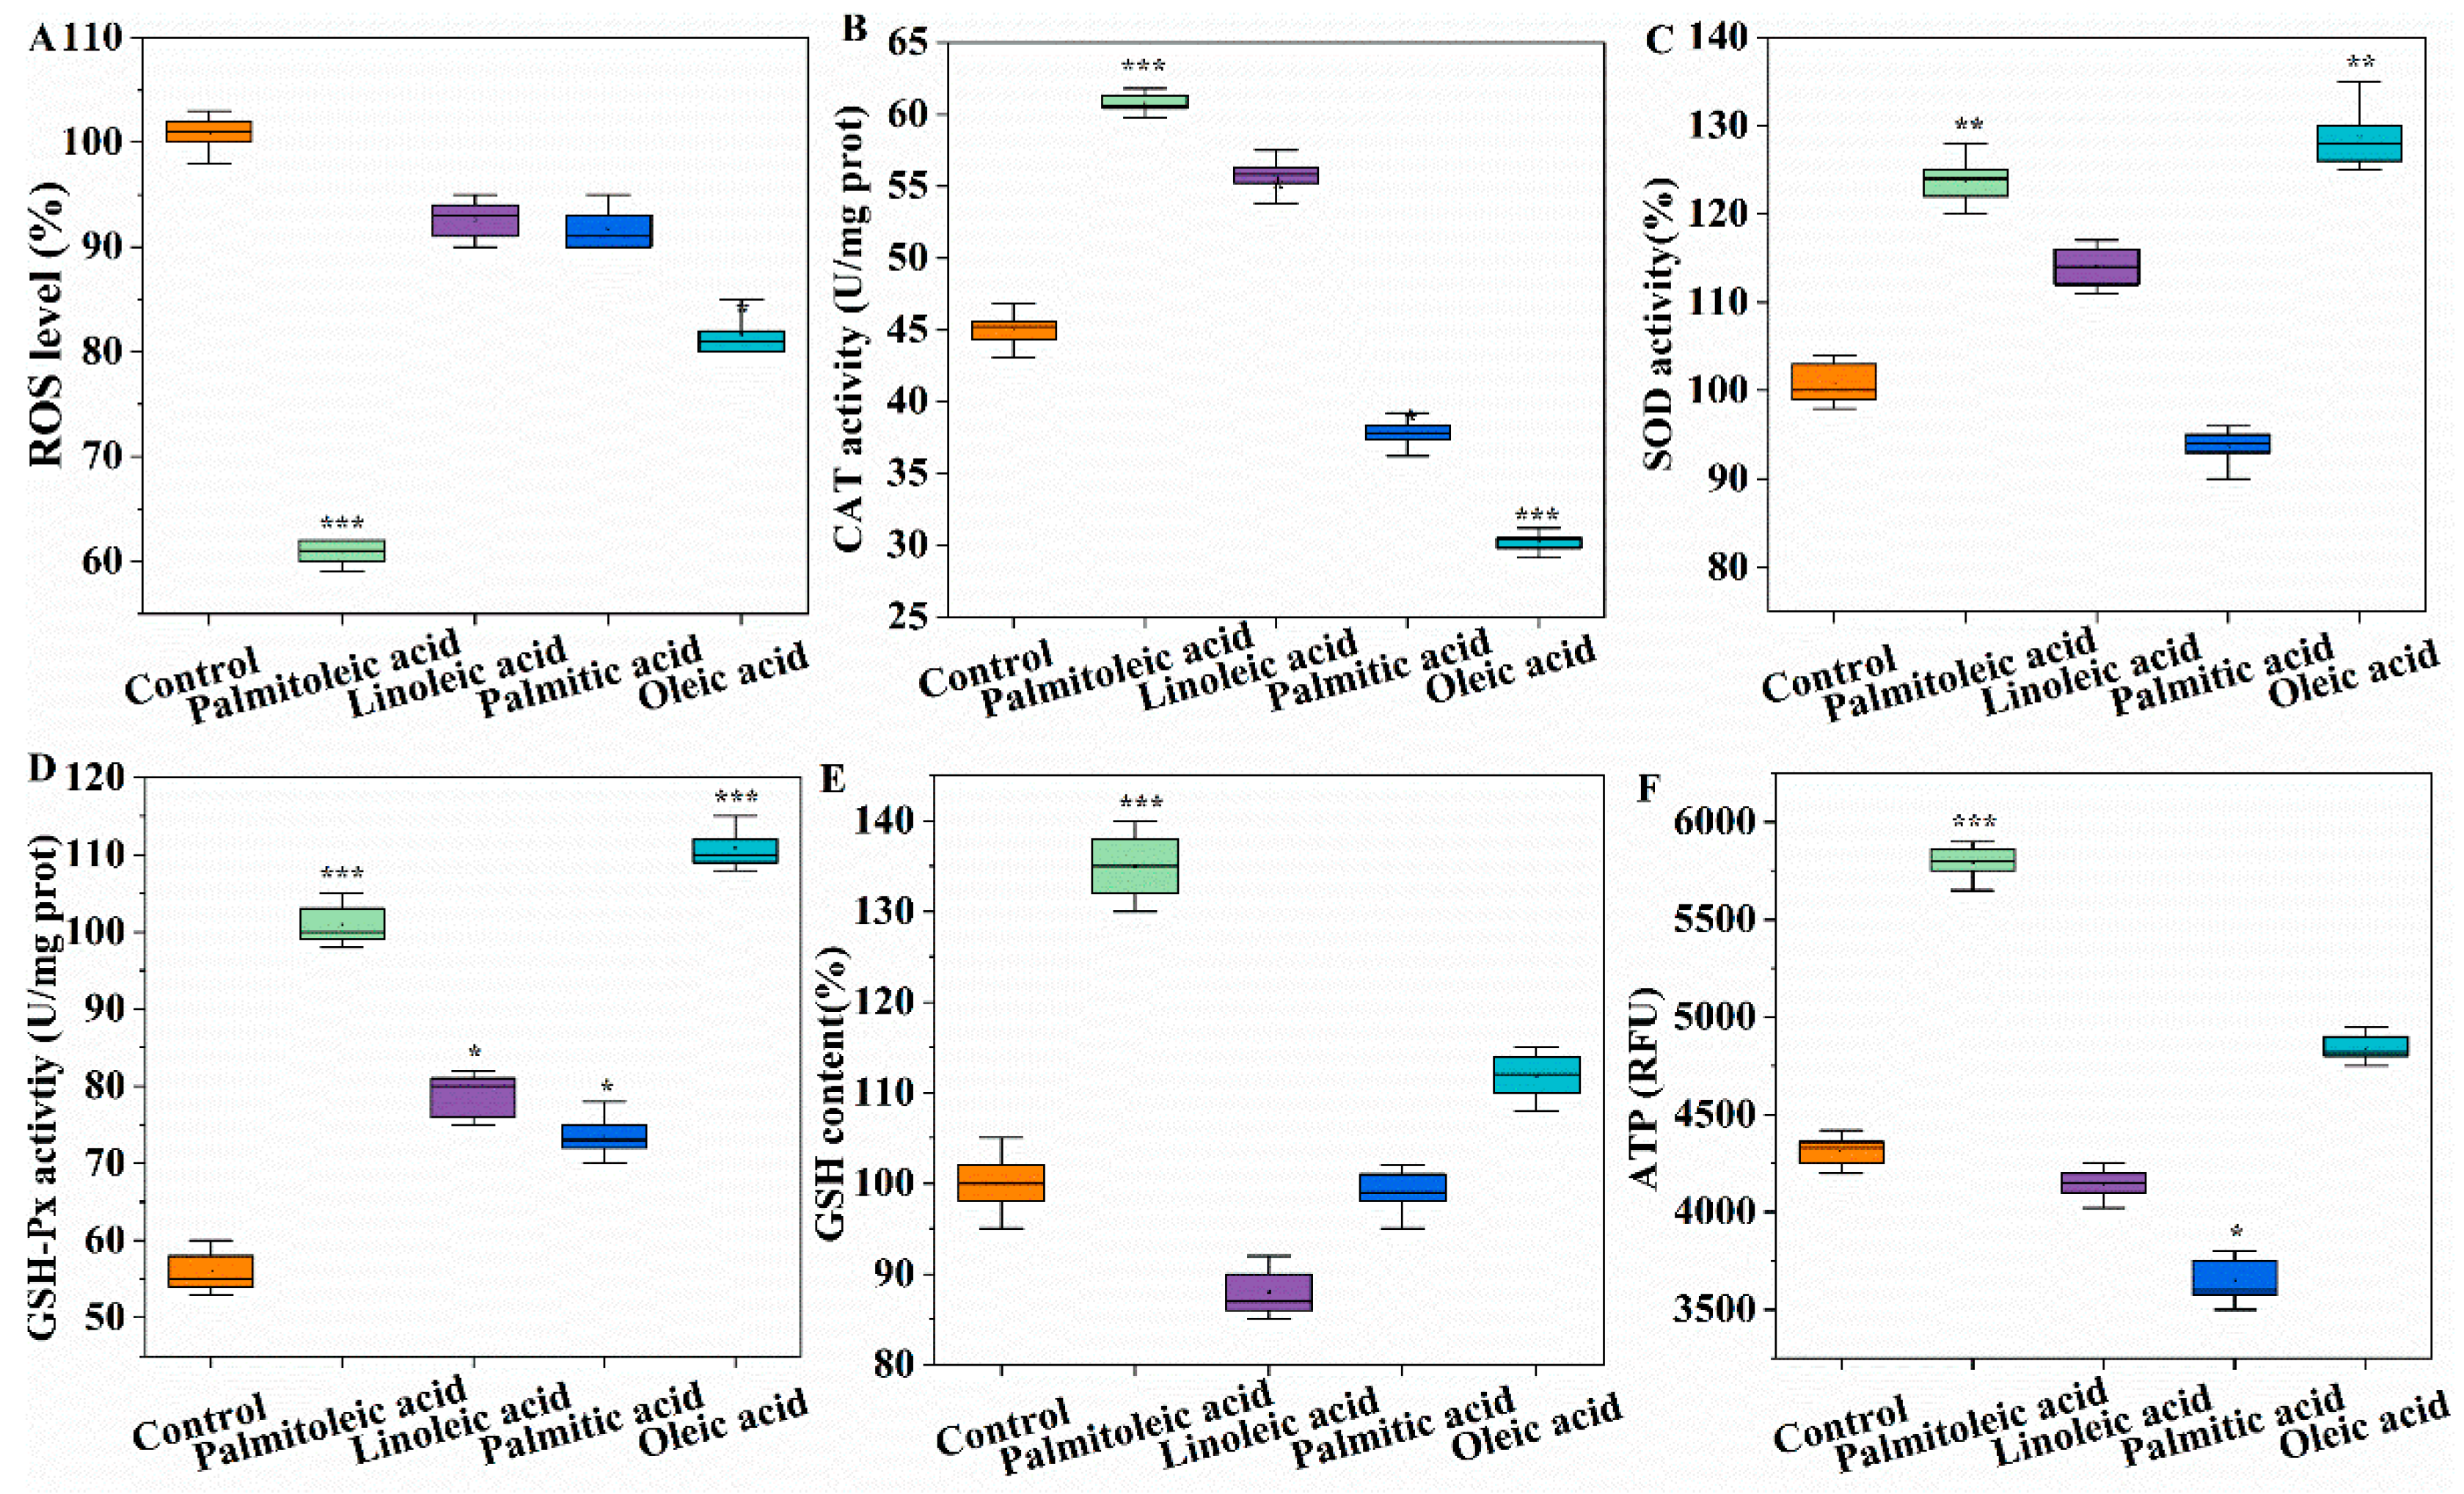
To test whether POA actively remodels the redox landscape, we quantified reactive oxygen species (ROS) and the status of the antioxidant defense system. POA treatment markedly attenuated the oxidative burst, lowering intracellular ROS levels by 41.2% relative to the control (Figure 2A). Similarly, OA conferred a protective effect, reducing ROS by 20.6%, whereas the other fatty acids were less effective. At the mechanistic level, POA induced a comprehensive upregulation of enzymatic defenses. Specifically, POA supplementation significantly increased catalase (CAT) activity by 35.6% (Figure 2B) and glutathione peroxidase (GSH-Px) activity by 85.5% (Figure 2D) compared to the control. Consistently, superoxide dismutase (SOD) activity was also upregulated, exhibiting a 22.5% increase relative to the control (Figure 2C).
Beyond enzymatic regulation, POA reinforced the non-enzymatic antioxidant pool and cellular energy status. Intracellular glutathione (GSH) levels in the POA group were markedly restored, rising 35.5% above the depleted levels of the control (Figure 2E). Furthermore, although oxidative stress typically impairs mitochondrial function, the POA group maintained significantly higher ATP levels, which were 36.5% higher than those of the control (Figure 2F), indicating that POA supplementation preserves mitochondrial bioenergetics under stress. Collectively, these findings indicate that POA coordinates a multi-tiered defense program that integrates enzymatic activation, GSH replenishment, and ATP preservation to prevent oxidative collapse. All differences described in this section remained significant after correction for multiple testing (Supplementary Table S6), including the difference in cell viability shown in Figure 1A.

3.3. Changes in the Yeast Cell Membrane and Cell Wall Under Oxidative Stress

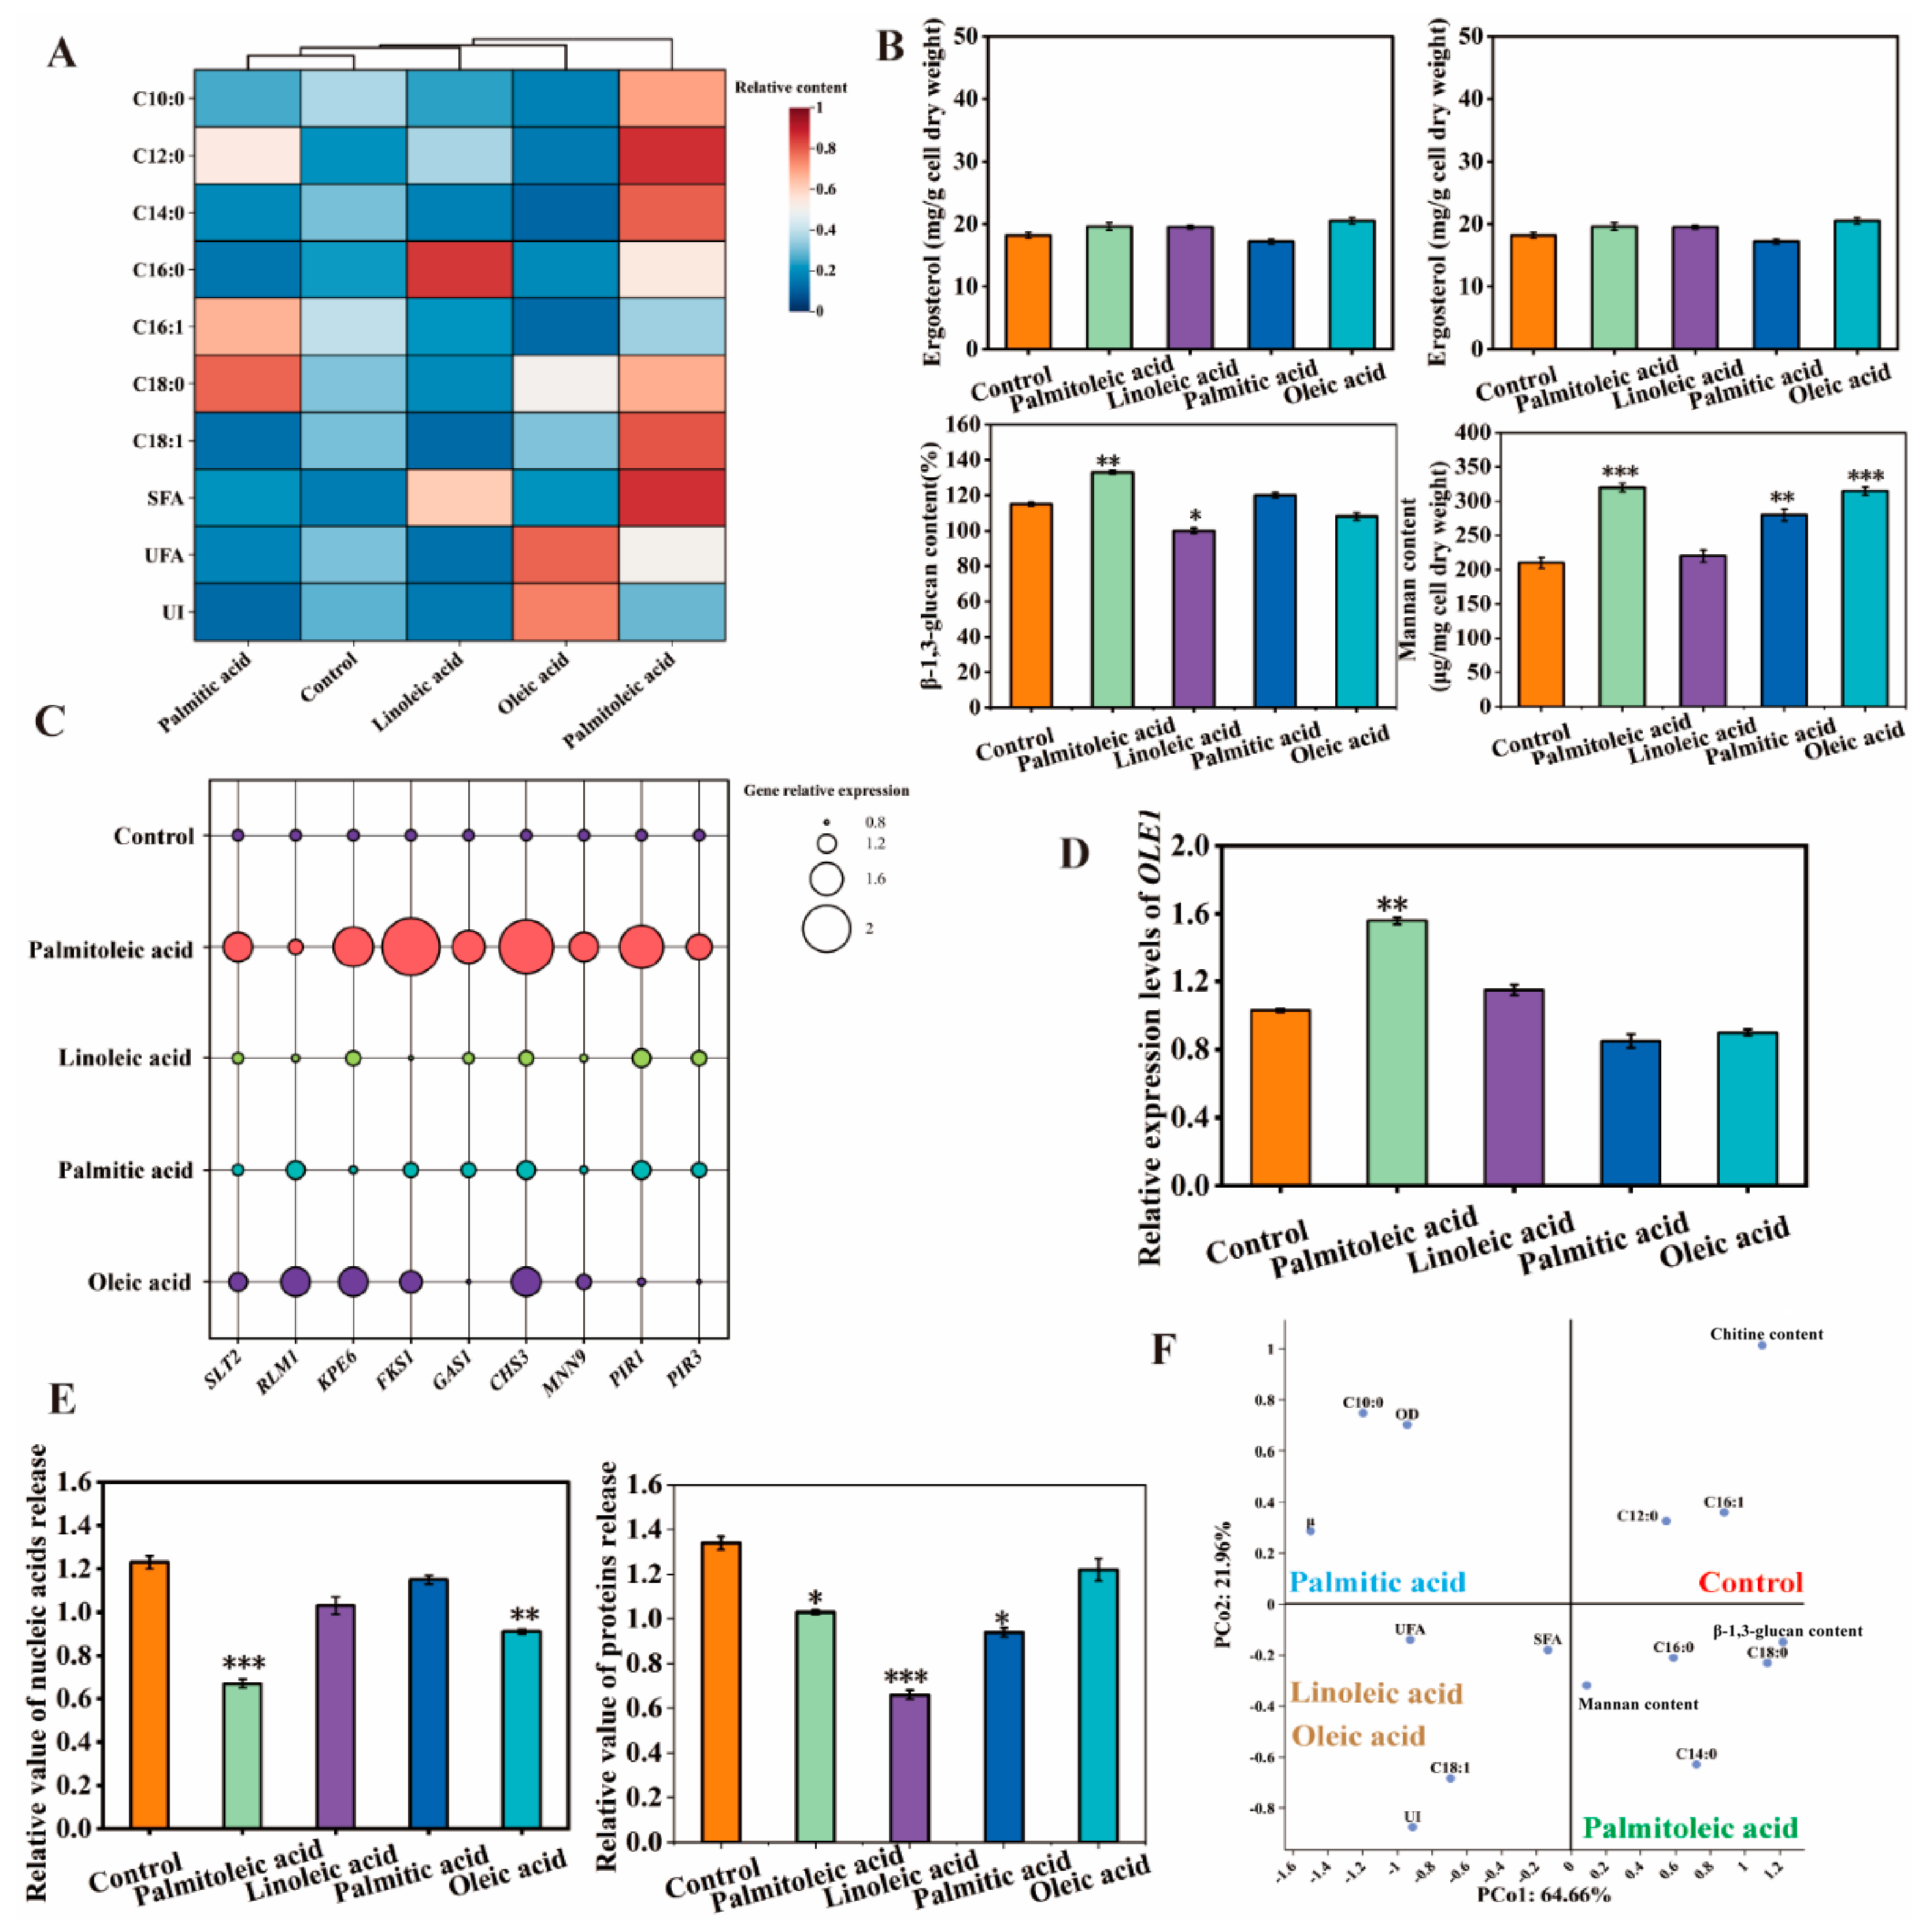
To characterize the effects of POA on cellular structural components, membrane fatty acid composition, cell wall polysaccharide content, and the expression of synthesis-related genes were analyzed in detail. As shown in Figure 3A, POA treatment altered the composition of membrane-associated fatty acids. Compared with the control, six major fatty acids, including palmitic acid, stearic acid, oleic acid, linoleic acid, and two additional unsaturated fatty acids, showed visibly higher relative abundance in the POA group. Because the heatmap in Figure 3A displays row-normalized relative intensities on a 0–1 scale rather than raw abundances, these differences are reported qualitatively rather than as fold-change values. Consistently, the contents of major cell wall polysaccharides were markedly elevated following POA supplementation (Figure 3B). β-1,3-glucan content increased by 15.6% (p < 0.005), mannan content by 52.4% (p < 0.001), and chitin content by 35.1% (p < 0.001) relative to the control. Ergosterol content showed no significant difference between groups (p > 0.05).
At the transcriptional level, POA treatment upregulated genes associated with cell wall biosynthesis (Figure 3C). SLT2 expression increased 1.5-fold (p < 0.05) and RLM1 increased 1.1-fold (p < 0.01) relative to the control. The structural polysaccharide synthesis genes FKS1 and GAS1 also showed significant increases, by approximately 2.3-fold and 1.6-fold, respectively (p < 0.05). Genes related to membrane lipid synthesis were similarly upregulated (Figure 3D). Among these, OLE1, a key gene in fatty acid synthesis, showed the largest increase, rising approximately 1.6-fold relative to the control (p < 0.001). Exact p and Benjamini–Hochberg-adjusted q values for these comparisons are reported in Supplementary Table S6; all remained significant after correction. Because the reference gene ALG9 might itself respond to oxidative stress or fatty acid supplementation, fold changes were recalculated against the geometric mean of ALG9, ACT1, and TAF10. The recalculated values differed from those obtained with ALG9 alone by less than 10% and left the gene ranking unchanged (Supplementary Table S4).
The functional impact of these changes was reflected in membrane integrity assays (Figure 3E). Under oxidative stress, POA treatment reduced intracellular component leakage. Nucleic acid leakage decreased from approximately 1.25 in the control to 0.68 in the POA group, a reduction of about 45.6%. Protein leakage was similarly reduced in the POA group, indicating enhanced cellular integrity. Principal component analysis further revealed a clear separation between POA-treated and control samples along PC1, which accounted for 64.66% of total variance (Figure 3F), confirming the overall difference in cellular characteristics between groups. Together, POA treatment produced coordinated changes in membrane lipid composition, cell wall polysaccharide accumulation, and synthesis-related gene expression, accompanied by decreased nucleic acid and protein leakage.

3.4. Influence of Different Fatty Acids on the Volatiles in Fermentation

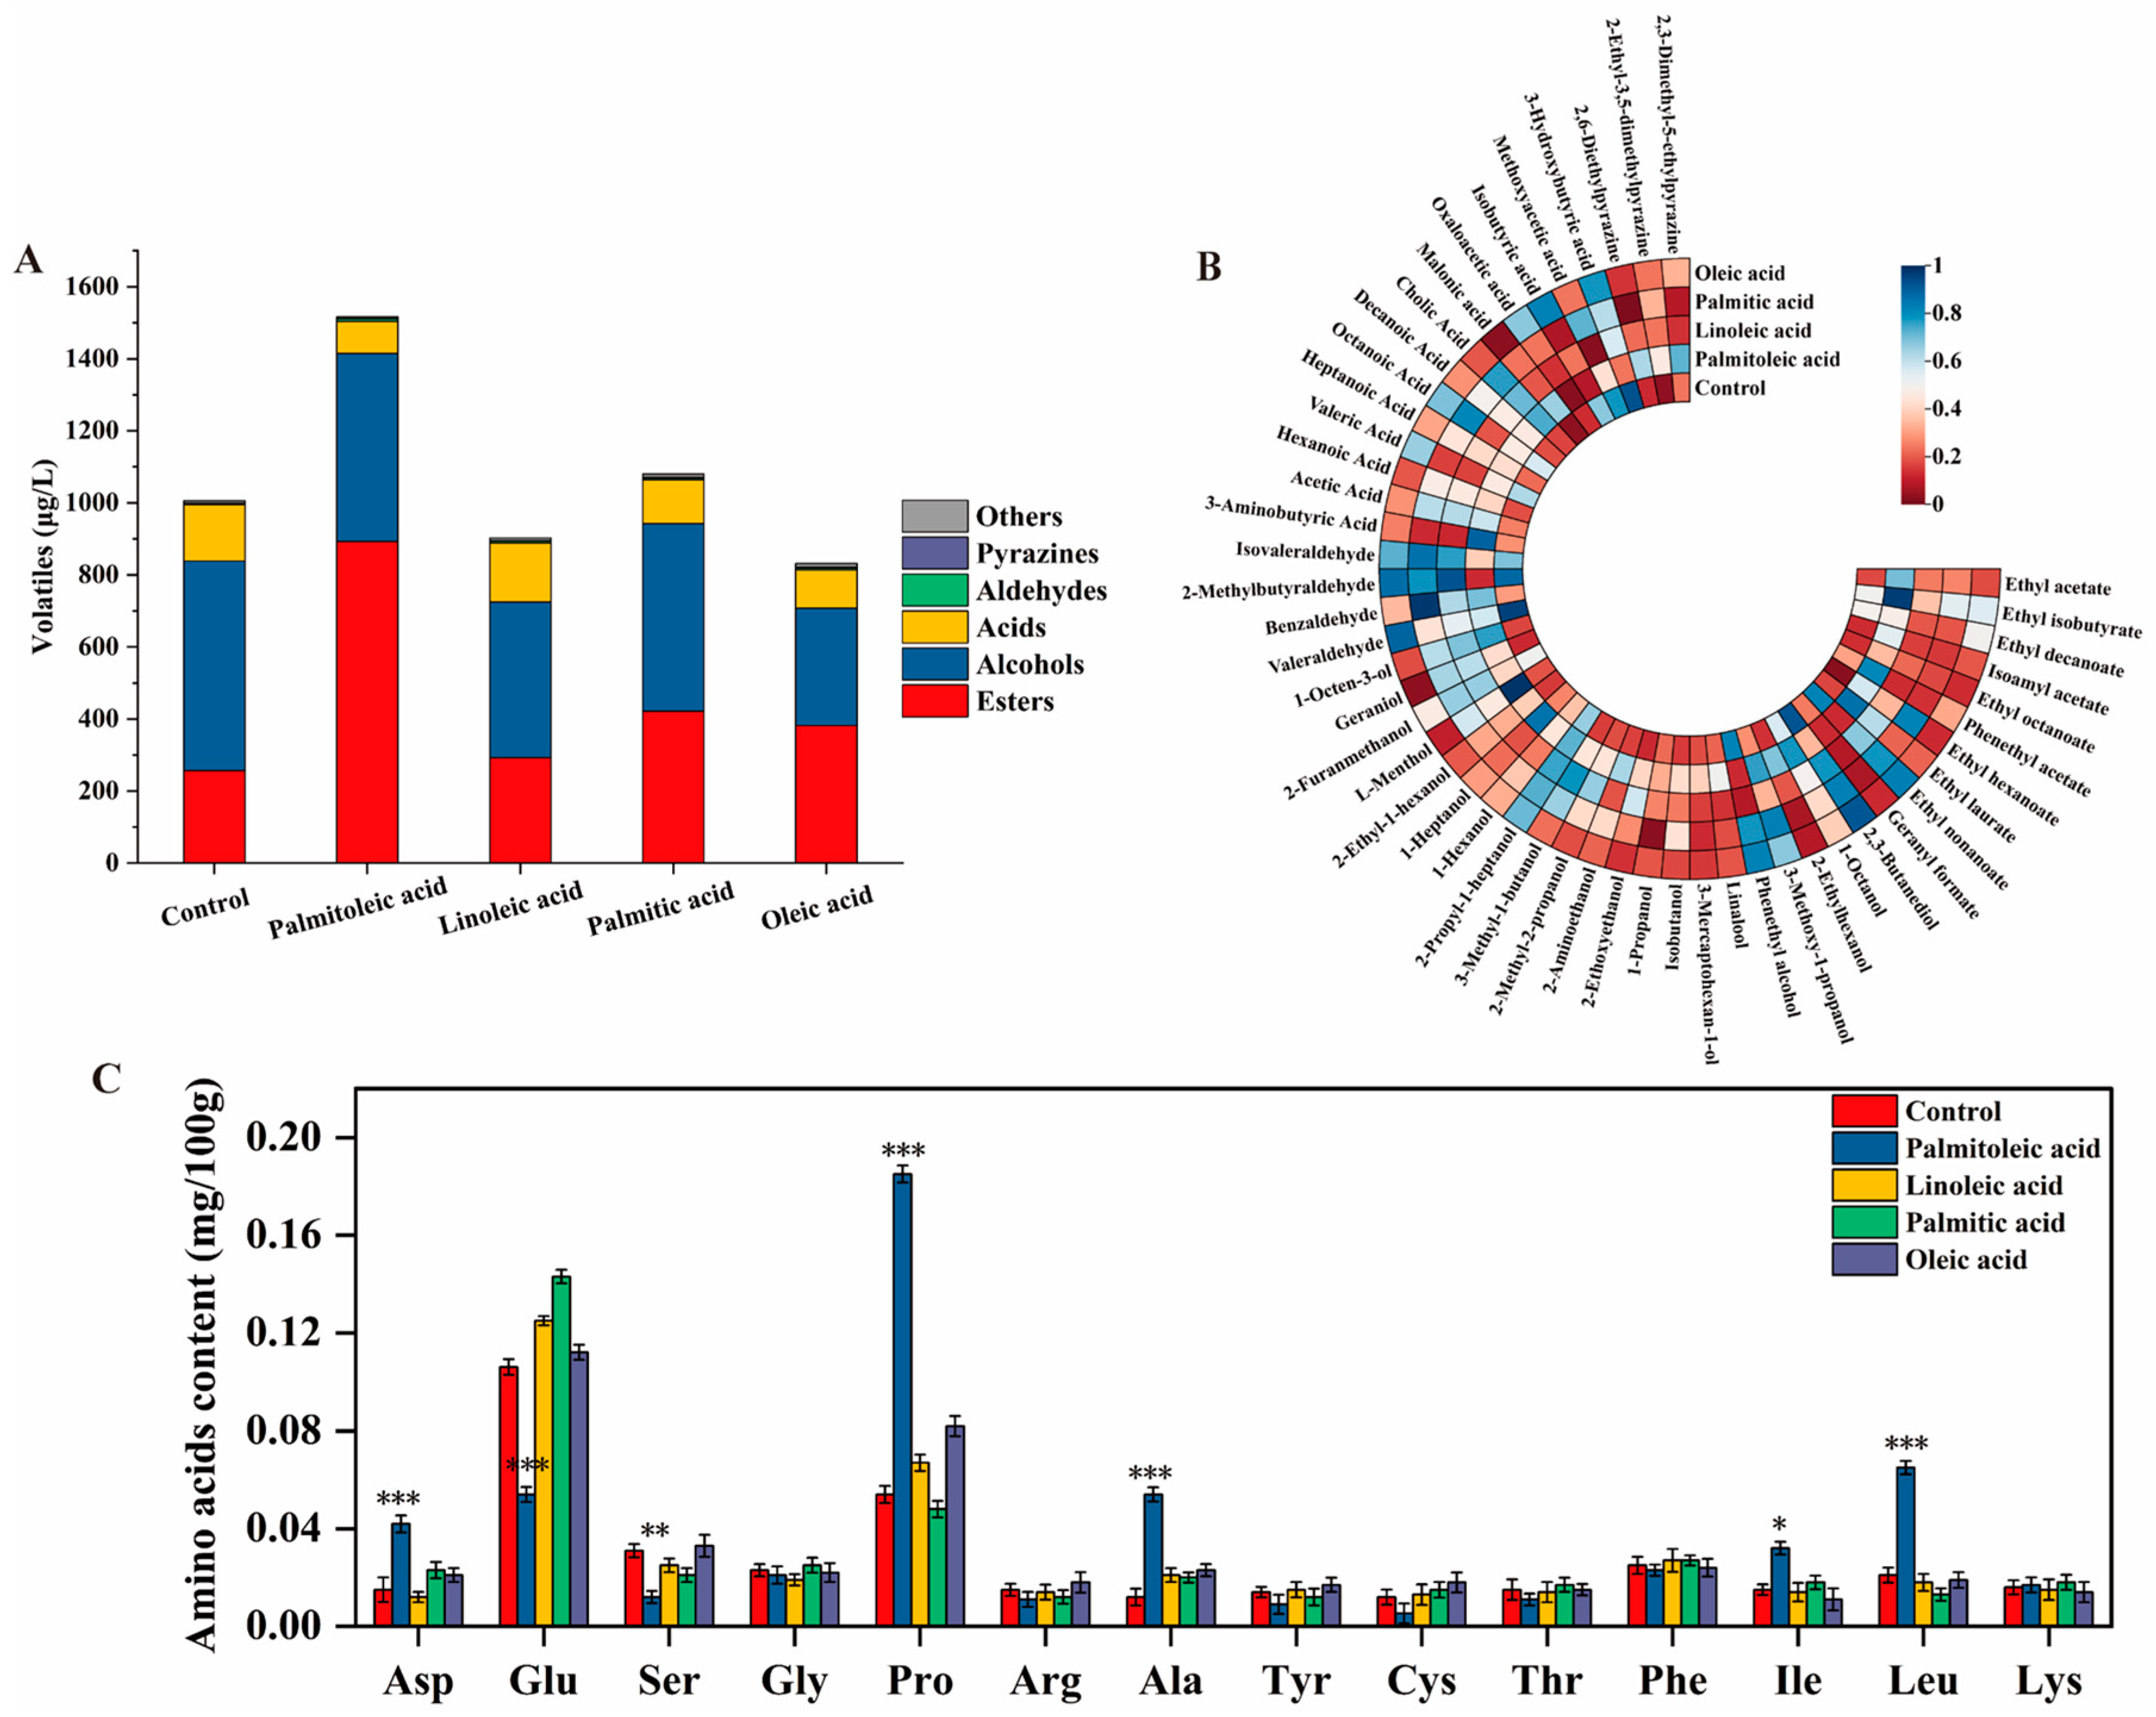
To assess the impact of lipid regulation on fermentation quality, we quantified volatile aroma compounds and free amino acids. POA supplementation markedly increased the production of volatile flavor compounds (Figure 4A). The POA group reached the highest total volatile concentration, 1502.3 μg/L, a 52.1% increase over the control (987.6 μg/L). This difference was consistent across the three biological replicates but did not reach statistical significance after correction for the 16 planned comparisons (raw p = 0.070, q = 0.070), and is therefore reported as a trend; the conclusions below rest on the change in composition rather than on the absolute increase. Critically, POA induced a qualitative shift toward ester formation. In the POA group, esters were the predominant class, reaching 905.4 μg/L and accounting for 60.3% of the total volatile profile, compared with only 26.1% (257.3 μg/L) in the control. By contrast, the LA group showed a higher proportion of alcohols (50.7% of the total), indicating a distinct metabolic trajectory.
Correlation analysis supported this specificity. POA showed strong positive correlations with desirable acetate esters, including ethyl acetate (r = 0.85) and ethyl hexanoate (r = 0.82). LA, in contrast, correlated with aldehydes such as benzaldehyde (r = 0.70), which are often linked to lipid oxidation and off-flavors. These coefficients are descriptive: no threshold was applied to classify an association as strong or weak, and the relationships indicate trends rather than causal links. Notably, the redirection of carbon toward esters did not come at the expense of ethanol; the POA group also produced the highest ethanol concentration (5.5% v/v vs. 3.6% v/v in the control; Figure 1D), indicating that ester formation was supported by an overall improvement in fermentative performance rather than by diversion of carbon away from ethanol.
Amino acid profiling revealed extensive remodeling of the nitrogen pool (Figure 4C). POA treatment caused a marked increase in proline content, to 0.18 mg/100 g, a 2.6-fold rise relative to the control (0.05 mg/100 g), indicating a strong stress-response signature. POA also enriched amino acids linked to central carbon metabolism and flavor formation. Branched-chain amino acids, particularly leucine and isoleucine, were clearly elevated; these serve as direct Ehrlich-pathway precursors for fruity acetate esters. Alanine and aspartic acid also increased significantly; because these are derived from pyruvate and oxaloacetate, respectively, their accumulation reflects enhanced flux through glycolysis and the TCA cycle. Together, these results indicate that POA coordinates a multi-dimensional metabolic program, coupling the build-up of the stress-protectant proline with the supply of flavor precursors (leucine) and central metabolic intermediates (alanine, aspartic acid), thereby enhancing fermentation robustness and sensory quality simultaneously.

3.5. Sensory Validation of the Volatile Shift

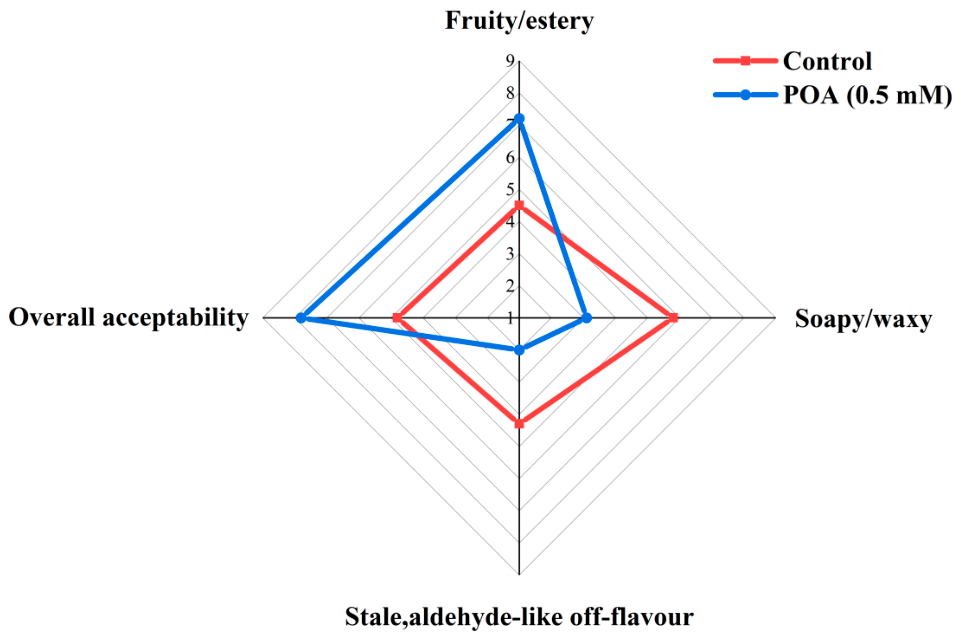
Chemical measurements alone cannot establish that a change in the volatile profile is desirable, so the two beers were assessed by a trained panel. In a triangle test, 15 of 20 assessors correctly identified the odd sample, a result well beyond the threshold for significance (p < 0.001), confirming that the beers were perceptibly different. Quantitative descriptive analysis showed that the POA beer scored higher for fruity and estery character (7.2 versus 4.5 on the nine-point scale) and lower for soapy or waxy character (3.1 versus 5.8) and for stale, aldehyde-like off-flavour (2.0 versus 4.3), while overall acceptability rose from 4.8 to 7.8 (Figure 5). These results support the interpretation that the shift toward esters is a favourable one, and indicate that 0.5 mM POA does not introduce the soapy notes that free fatty acids can impart at higher concentrations. Odour activity values were not calculated for individual compounds, since aroma thresholds in a beer matrix are strongly matrix-dependent; the panel data are presented instead as direct evidence of sensory relevance.

3.6. Overall Analysis of Metabolomic Responses

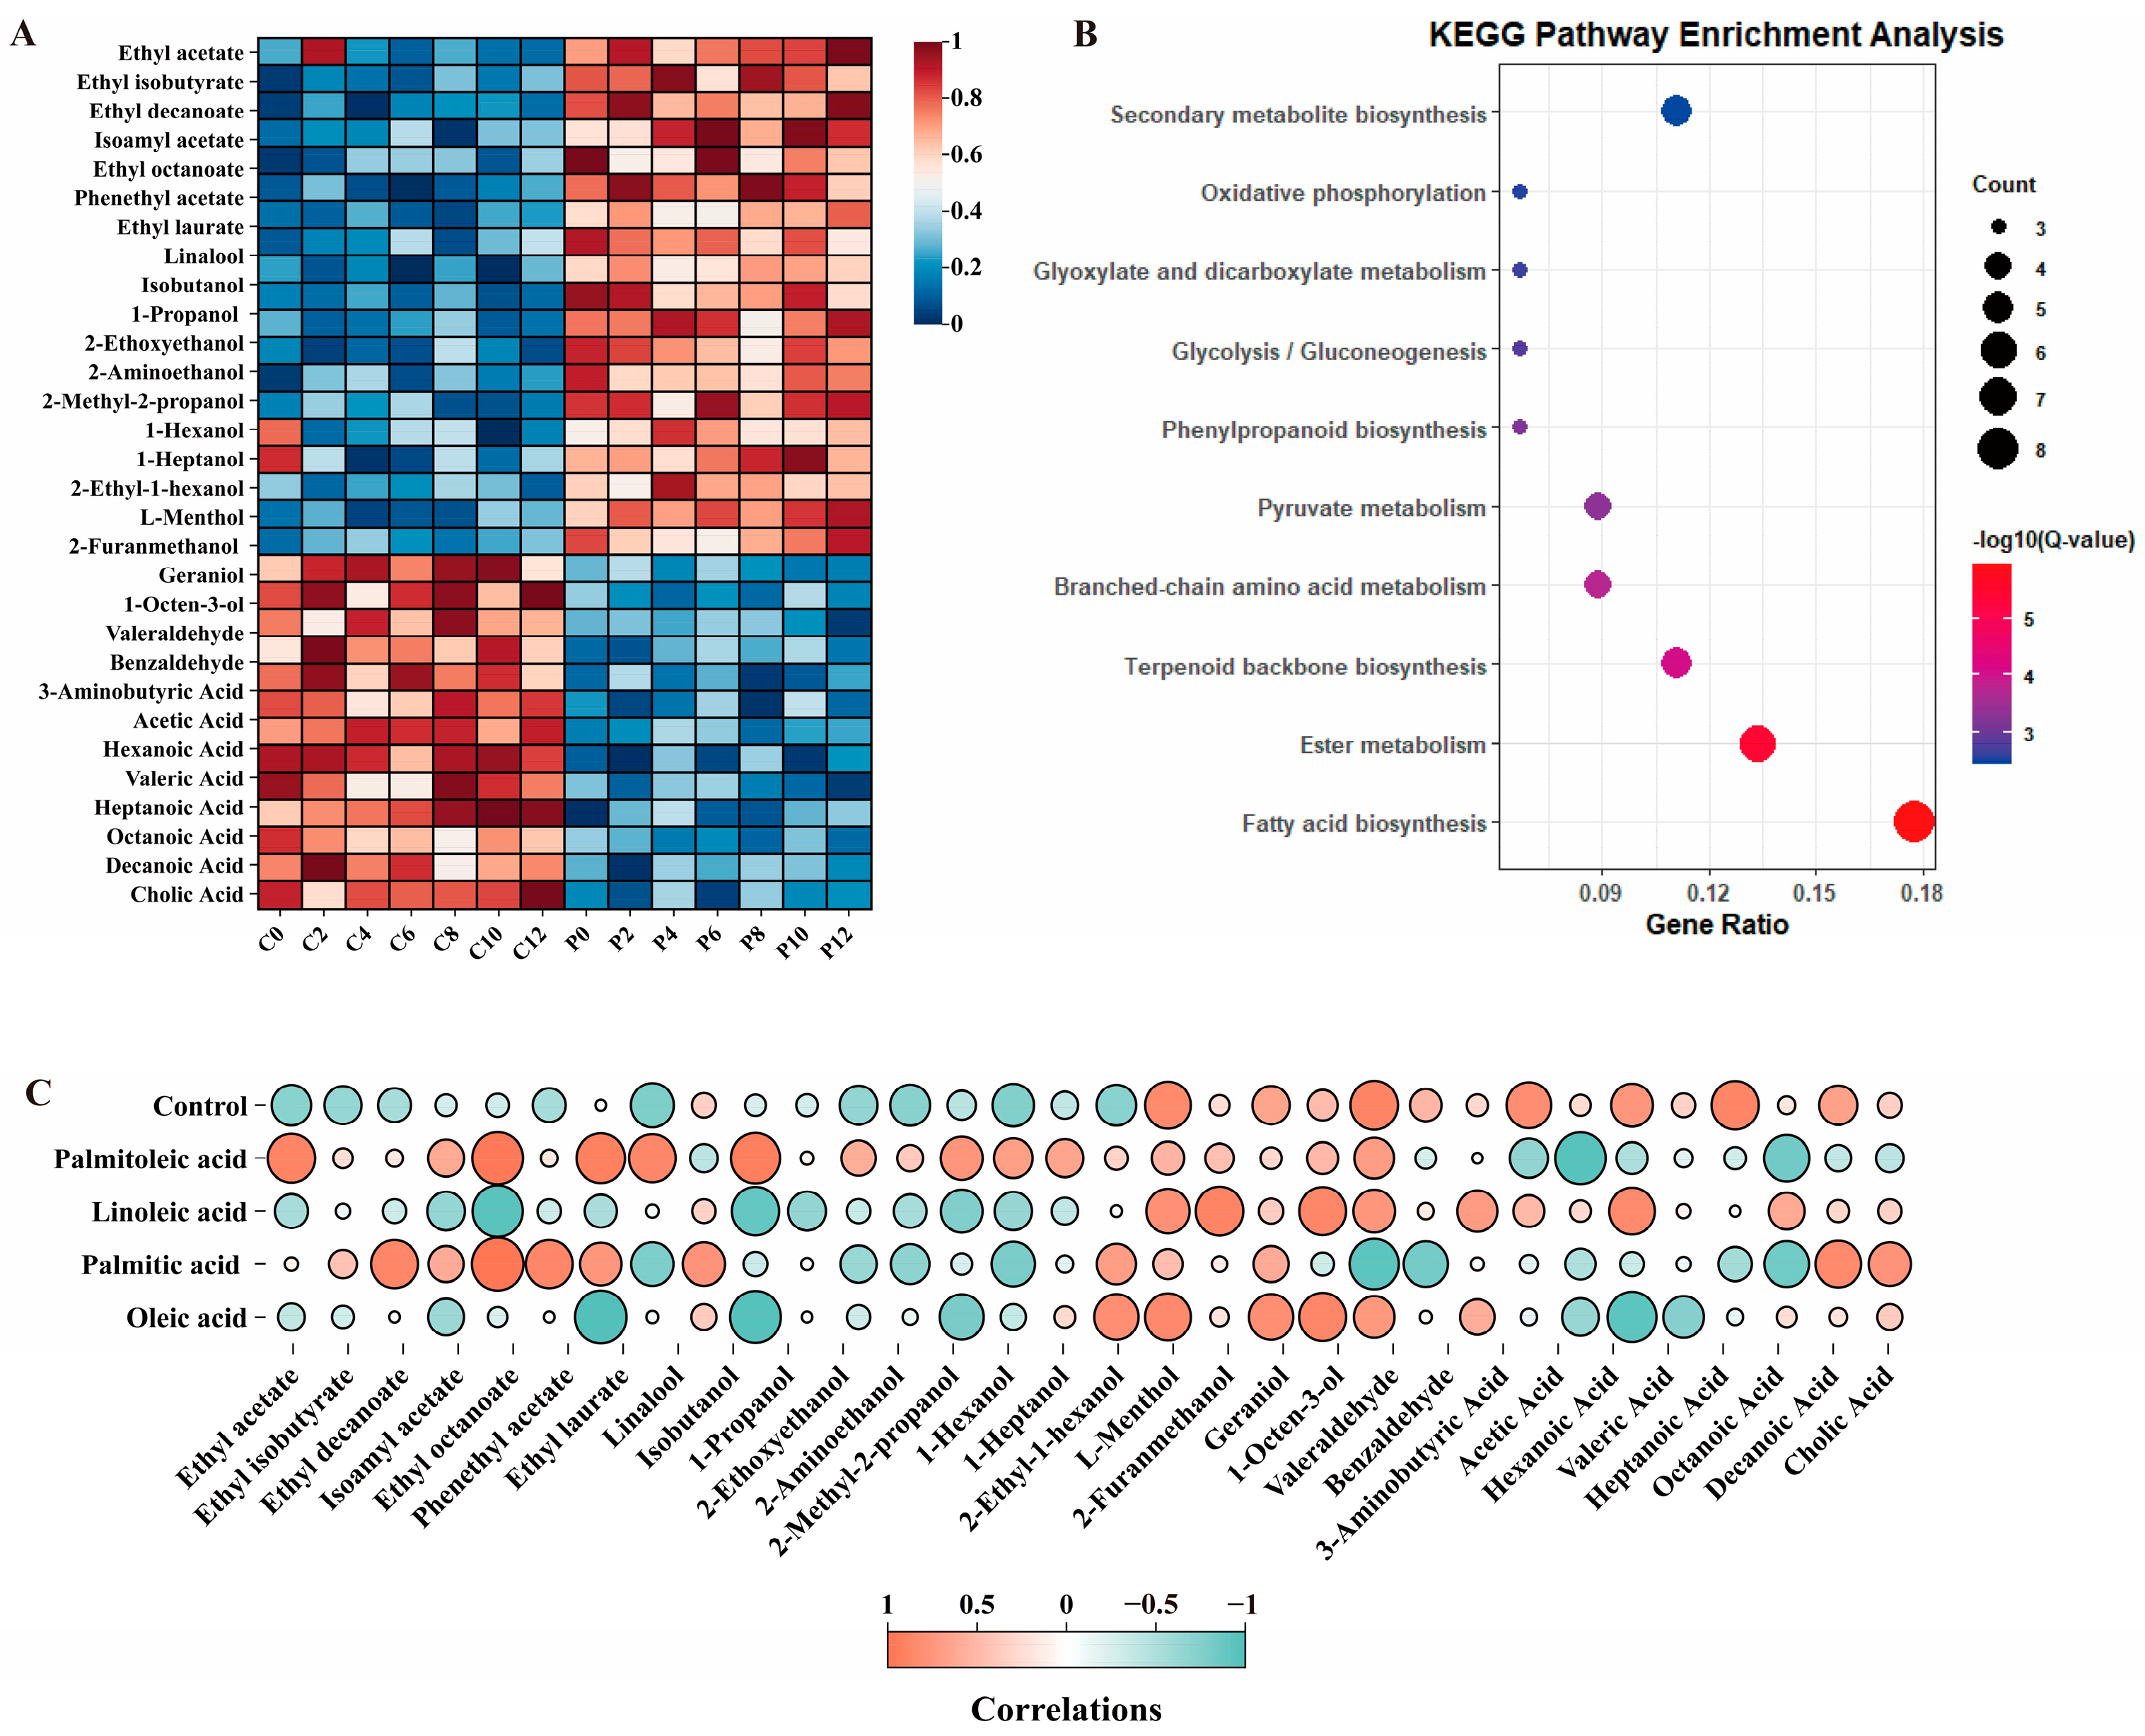
Time-resolved metabolomic profiling revealed clear differences between the Control and POA groups (Figure 6A). During late fermentation (D8–12), metabolite levels declined sharply in the Control group, producing extensive low-abundance regions (blue zones) on the heatmap. In contrast, the POA group maintained high levels of volatile metabolites (red zones) through the end of fermentation. These patterns indicate that POA sustains metabolic flux and reduces the decline in metabolic activity caused by oxidative stress.
KEGG pathway enrichment analysis identified the pathways distinguishing the two groups (Figure 6B). Fatty acid biosynthesis was the most significantly enriched pathway, followed by ester metabolism and terpenoid backbone biosynthesis. Branched-chain amino acid metabolism, pyruvate metabolism, glycolysis/gluconeogenesis, glyoxylate and dicarboxylate metabolism, phenylpropanoid biosynthesis, oxidative phosphorylation, and secondary metabolite biosynthesis were also enriched. Two features of this ranking are notable. First, ester metabolism was enriched alongside fatty acid biosynthesis, linking the lipid response to the aroma profile described in Section 3.4. Second, branched-chain amino acid metabolism supplies Ehrlich-pathway precursors for acetate esters, while enrichment of pyruvate metabolism, glycolysis/gluconeogenesis, and oxidative phosphorylation indicates that central carbon and energy metabolism were sustained, not curtailed, under oxidative stress. Cofactor supply is addressed separately in Section 3.7: pantothenic acid and coenzyme A were quantified at the metabolite level (Figure 7), but no cofactor-biosynthesis pathway appeared among the enriched terms in Figure 6B, so CoA availability is not presented here as an enrichment result. The fatty acid–metabolite correlation matrix further clarified the specific effect of POA (Figure 6C). POA showed strong positive correlations with most acetate esters, including ethyl acetate and isoamyl acetate. Polyunsaturated fatty acids such as linoleic acid showed weaker, or even negative, correlations. Together, these relationships suggest that POA establishes a metabolic network supporting both cell survival and enhanced aroma-compound production.

3.7. Metabolic Pathways Enrichment Analysis

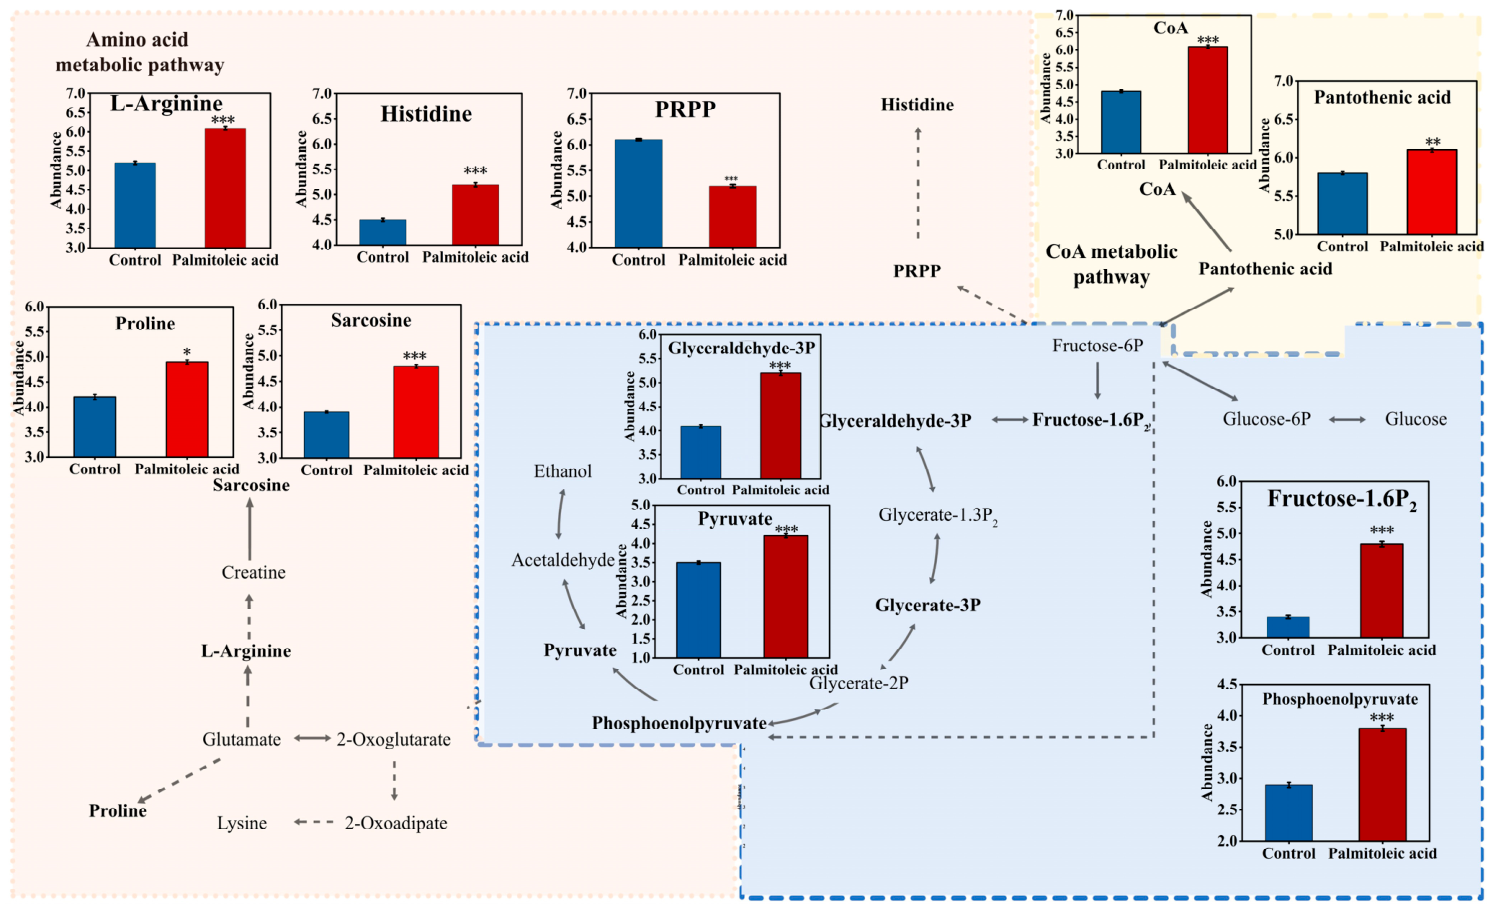
To identify the key metabolic modules regulated by POA, we mapped the differentially expressed metabolites (DEMs) onto the global metabolic network (Figure 7). The differentially abundant metabolites fell into three modules: central carbon metabolism, amino acid metabolism centred on arginine and proline, and the pantothenate–coenzyme A route. Within the central carbon metabolism module, POA treatment markedly increased glycolytic flux. As shown in the top panel of Figure 7, the relative abundances of key glycolytic intermediates were consistently higher in the POA group than in the control. Specifically, glyceraldehyde-3-phosphate increased by 26.8%, fructose-1,6-bisphosphate by 41.2%, phosphoenolpyruvate (PEP) by 31.0%, and pyruvate by 20.0%. This accumulation of pyruvate indicates an enhanced supply of carbon skeletons for downstream amino acid biosynthesis and mitochondrial respiration.
In the amino acid and cofactor modules, POA induced distinct metabolic reconfigurations. Within arginine and proline metabolism, proline, L-arginine and the stress-protectant sarcosine all increased, a pattern consistent with an increased flux from glutamate toward proline; the depletion of the glutamate pool measured in the amino acid profile (Figure 4C) is in stoichiometric agreement with this interpretation. Histidine also accumulated, whereas its precursor 5-phosphoribosyl-1-pyrophosphate (PRPP) decreased, which is compatible with PRPP being drawn into histidine synthesis. In the pantothenate–coenzyme A route, both pantothenic acid and coenzyme A (CoA) increased, indicating improved availability of the cofactor required for the acyl-transfer reactions that underlie ester formation. Collectively, these results indicate that POA actively reconfigures the metabolic network to sustain high-flux energy generation and to promote the accumulation of specific stress-protective metabolites.

4. Discussion

Our results demonstrate that palmitoleic acid (POA) confers superior tolerance to oxidative stress compared with other fatty acids, maintaining 87% cell viability and supporting robust growth. Previous studies have shown that trehalose accumulation, although protective, often imposes a metabolic burden that inhibits glucose uptake and slows cell growth [7,26], and earlier work has proposed that diverting carbon flux toward protective carbohydrates competes with central carbon metabolism. Our metabolomic data suggest that POA circumvents this trade-off: POA markedly enhanced glycolytic flux (increased G3P, PEP, and pyruvate), providing sufficient carbon skeletons for both protective solutes (proline, trehalose) and energy generation (ATP), and thereby avoiding the metabolic stagnation often associated with conventional osmoprotectants.
An unexpected finding was the 1.6-fold increase in OLE1 transcript abundance in POA-treated cells. This appears counterintuitive, as exogenous unsaturated fatty acids are known to repress OLE1 transcription via the membrane-bound transcription factors Mga2p and Spt23p [27,28], and OLE1 expression is normally driven by oxygen availability for endogenous UFA synthesis [29]. We regard this as an observation requiring explanation rather than evidence for a new regulatory mode. Three explanations are compatible with our data: (i) H2O2 peroxidizes existing unsaturated acyl chains, and OLE1 induction may compensate for this loss, outweighing feedback repression by supplied POA; (ii) POA-treated cultures grew faster and reached higher biomass, so part of the difference may reflect a larger proportion of dividing cells rather than a per-cell transcriptional change; (iii) a technical origin is unlikely, since the ethanol-vehicle control gave an OLE1 level of 0.95-fold relative to the control and normalization against three reference genes reproduced the same fold change. Distinguishing between these possibilities will require OLE1 promoter–reporter assays and direct measurement of Mga2p processing, which were not undertaken here. Structurally, our data are consistent with a model in which POA incorporation alters membrane fluidity, which is sensed by cell wall integrity sensors (most likely Wsc/Mid family proteins) and accompanied by upregulation of cell wall remodeling and membrane synthesis genes [30]—consistent with reports that membrane rigidification under stress impairs transporter function and the proton motive force [31]. In contrast to work emphasizing ergosterol as the primary regulator of membrane rigidity, our data indicate that monounsaturated fatty acids can independently drive this remodeling [32], simultaneously inducing cell wall thickening (β-1,3-glucan, mannan) and membrane renewal via OLE1 upregulation—a dual structural barrier against oxidative attack [33,34].
The antioxidant response induced by POA was coordinated across SOD, CAT, and GSH-Px, resembling the systemic defense network observed under high-oxygen adaptation [35] rather than the induction of isolated enzymes typical of limited stress responses. Given that H2O2-driven mitochondrial impairment can generate secondary superoxide via electron leakage, the elevated SOD activity we observed likely mitigates this endogenous burden in addition to the exogenous H2O2 challenge, with the resulting H2O2 efficiently cleared by elevated CAT and GSH-Px. This nutritional route was not compared experimentally with genetically engineered strains overexpressing CAT [19], and we do not claim it is superior; its practical appeal lies instead in avoiding the regulatory constraints applying to genetically modified brewing yeast. This biphasic dose–response is consistent with a lipotoxicity mechanism that becomes dominant once membrane and antioxidant capacity is exceeded. Below 0.5 mM, POA is likely esterified efficiently into membrane phospholipids, producing an adaptive gain in membrane fluidity that supports antioxidant enzyme induction (Figure 2 and Figure 3). Above this threshold, POA uptake presumably outpaces esterification and β-oxidation, so free fatty acid accumulates and, acting as an endogenous detergent, over-fluidizes and permeabilizes the plasma and mitochondrial membranes; this would dissipate the proton motive force and uncouple oxidative phosphorylation, increasing electron leakage from Complexes I/III and thereby raising, not lowering, mitochondrial ROS [2,36]. As a monounsaturated fatty acid, excess POA is also a more abundant substrate for autoxidation and H2O2-driven lipid peroxidation, while the SOD–CAT–GSH-Px system becomes saturated rather than further induced—together shifting the net balance from protective to pro-oxidant [18]. This model, consistent with hormetic dose–responses reported for other exogenous unsaturated fatty acids, remains to be directly tested by measuring the free POA pool, mitochondrial membrane potential, and lipid peroxidation markers (e.g., malondialdehyde) at 1.0–2.0 mM.
Stress-tolerant yeast often diverts metabolism away from aroma formation, generating off-flavors [36]. POA treatment instead enhanced both stress survival and ester synthesis (notably ethyl acetate), consistent with enrichment of ester and branched-chain amino acid metabolism (Figure 6B), elevated pantothenic acid and CoA levels (Figure 7), and increased availability of Ehrlich pathway precursors (leucine, isoleucine) [37]. Unlike stress conditions that typically downregulate central carbon metabolism [7,38], POA maintained elevated pyruvate levels feeding both the TCA cycle and amino acid biosynthesis, while increased CoA availability favoured ester formation—apparently through mobilization of the cell’s endogenous biosynthetic machinery rather than exogenous nitrogen supplementation as used in prior approaches [39].
Exogenous fatty acid supplementation nonetheless carries a risk of off-flavors: at high concentrations POA can impart soapy or waxy notes, and H2O2-induced lipid peroxidation may generate staling aldehydes such as trans-2-nonenal. Aldehyde-class volatiles did not increase uniformly in the POA group (Figure 4B)—some (benzaldehyde, valeraldehyde) rose modestly while others (isovaleraldehyde, 2-methylbutyraldehyde) remained at or below control levels—suggesting any pro-oxidative lipid peroxidation was partial and compound-specific at the tested dosage. This is consistent with the trained-panel results (Section 3.5), where POA beer scored lower for soapy/waxy character (3.1 versus 5.8) and stale, aldehyde-like notes (2.0 versus 4.3), and higher for overall acceptability (7.8 versus 4.8), though sensory outcomes at higher dosages or production scale remain to be established.
Several limitations qualify these conclusions. The acute chemical challenge (2.0 mM H2O2) is defined and reproducible but differs from the slow, multifactorial oxidative burden of high-gravity brewing, which combines elevated ethanol, osmotic stress, nutrient limitation and extended fermentation; the wort used here (13–15 °P) was of standard rather than high gravity, so our findings support that POA reinforces oxidative-stress defences in lager yeast rather than demonstrating improved high-gravity fermentation. Fermentations were also performed at laboratory scale (150 mL, single pitching), which does not capture the hydrodynamics, anaerobiosis, wort complexity, and serial repitching of industrial fermentation; whether POA uptake and protection persist under these conditions remains untested. The metabolomic analysis did not quantify several metabolites central to our proposed mechanisms—acetyl-CoA, the NADPH/NADP+ couple, lipid peroxidation markers (malondialdehyde, 4-hydroxynonenal), trehalose-6-phosphate, and short-chain volatile acids—so several mechanistic links remain inferential rather than directly measured. Finally, practical feasibility is not yet established: the cost, dispersion, thermal stability and carry-over of food-grade POA (approximately 127 mg/L wort at 0.5 mM) have not been assessed, its effect on foam stability (a known concern for free fatty acids [40]) was not measured, regulatory status varies by jurisdiction, and the sensory evaluation involved a single laboratory-scale panel with no head-to-head comparison against engineered strains. We therefore present POA supplementation as a mechanistically supported, non-transgenic strategy that merits pilot-scale evaluation, rather than as a validated industrial process.

5. Conclusions

This study systematically elucidates how exogenous palmitoleic acid (POA) confers oxidative-stress tolerance in industrial lager yeast, acting not only as a nutrient but also as a systemic metabolic modulator. We show that POA coordinates a multi-level defense program that integrates structural reinforcement, redox homeostasis, and metabolic reprogramming. At the structural level, POA induces a dual “lipid–gene” reinforcement mechanism. It directly optimizes membrane fluidity and, in parallel, is associated with increased expression of genes involved in cell wall integrity (SLT2, RLM1, KRE6, FKS1, GAS1, CHS3, MNN9, PIR1, PIR3) and membrane lipid biosynthesis OLE1, thereby strengthening the cell envelope. At the metabolic level, POA restores central carbon flux through the Embden–Meyerhof–Parnas (EMP) pathway and raises pantothenic acid and coenzyme A levels, securing a sustained supply of ATP and cofactors. This energetic sufficiency supports a specific, rather than generalized, antioxidant defense centered on catalase (CAT) and glutathione (GSH). Under the conditions tested here, POA also avoided the trade-off between stress resistance and flavour quality that is commonly reported. By coupling the accumulation of the stress-protectant proline with an enhanced supply of leucine, a precursor of isoamyl acetate, POA redirects metabolic flux toward the synthesis of desirable fruity esters even under oxidative stress. Taken together, these findings provide a theoretical and practical basis for leveraging lipid nutrition to engineer robust fermentation phenotypes, offering the brewing industry a non-transgenic route to improving yeast viability and flavour stability that should now be validated under genuine high-gravity conditions, at pilot scale and across successive repitchings before it is recommended for industrial use.


Supplementary Materials

The following supporting information can be downloaded at https://www.mdpi.com/article/10.3390/fermentation12090436/s1: Table S1: Primer sequences used for qRT-PCR; Table S2: Effect of POA concentration on cell viability and intracellular ROS, measured 72 h after challenge with 2.0 mM H2O2; Table S3: Ethanol-vehicle control. All fatty acid stocks were prepared in absolute ethanol, giving a final carrier concentration of 0.5% (v/v); Table S4: Stability of five candidate reference genes across treatment groups (mean Ct, n = 3); Table S5. Time-dependent gradient elution program used for UHPLC-MS/MS metabolomic analysis; Table S6: Raw and Benjamini–Hochberg-adjusted p values for the 16 planned POA-versus-control comparisons; Table S7: Validation of the intracellular pH measurement; Table S8: Triangle test (ISO 4120) of the finished beers.

Author Contributions

Conceptualization, G.H. and S.H.; methodology, G.H.; software, M.W.; validation, G.H., J.Y. and M.W.; formal analysis, G.H.; investigation, S.H.; resources, H.Y.; data curation, G.H.; writing—original draft preparation, G.H.; writing—review and editing, G.H.; visualization, M.W.; supervision, Q.Q.; project administration, G.H.; funding acquisition, H.Y. All authors have read and agreed to the published version of the manuscript.

Funding

This work was supported by Shandong Provincial Key Laboratory of Food Biological Fermentation; Taishan Industrial Experts Program (NO. tscx202408034). Shandong Provincial Postdoctoral Innovation Program (NO. SDCX-ZG-202603150).

Institutional Review Board Statement

Ethical review and approval were waived for this study because the sensory evaluation involved routine, non-invasive tasting of a legally produced, commercially available beer product by trained adult staff volunteers from the company’s own sensory laboratory, as part of their normal quality-evaluation duties. No personal health information, biological samples, or identifying data were collected from participants, and the procedure posed no more than minimal risk.

Informed Consent Statement

Informed consent was obtained from all subjects involved in the study.

Data Availability Statement

Data will be made available on request.

Conflicts of Interest

Authors G.H., J.Y., H.Y. and S.H. were employed by the company Tsingtao Brewery Co., Ltd. The remaining authors (Q.Q. and M.W.) declare that the research was conducted in the absence of any commercial or financial relationships that could be construed as a potential conflict of interest.

Abbreviations

The following abbreviations are used in this manuscript:
BCECF-AM2′,7′-bis-(2-carboxyethyl)-5-(and-6)-carboxyfluorescein acetoxymethyl ester
ANCOVAAnalysis of Covariance
HPLChigh-performance liquid chromatography
GC-MSgas chromatography–mass spectrometry
RTreverse transcription
qRT-PCRquantitative real-time polymerase chain reaction
Ctcycle threshold
CVcoefficient of variation
MIQEminimum information for publication of quantitative real-time PCR experiments
LC-MSliquid chromatography–mass spectrometry
QCquality control
ISOInternational Organization for Standardization
ANOVAAnalysis of Variance
KEGGKyoto Encyclopedia of Genes and Genomes

References

  1. da Silveira, F.A.; de Oliveira Soares, D.L.; Bang, K.W.; Balbino, T.R.; de Moura Ferreira, M.A.; Diniz, R.H.S.; de Lima, L.A.; Brandão, M.M.; Villas-Bôas, S.G.; da Silveira, W.B. Assessment of ethanol tolerance of Kluyveromyces marxianus CCT 7735 selected by adaptive laboratory evolution. Appl. Microbiol. Biotechnol. 2020, 104, 7483–7494. [Google Scholar] [CrossRef] [Scilit] [PubMed]
  2. Jiménez-Martí, E.; Gomar-Alba, M.; Palacios, A.; Ortiz-Julien, A.; del Olmo, M.-L. Towards an understanding of the adaptation of wine yeasts to must: Relevance of the osmotic stress response. Appl. Microbiol. Biotechnol. 2011, 89, 1551–1561. [Google Scholar] [CrossRef] [Scilit] [PubMed]
  3. Lairón-Peris, M.; Routledge, S.J.; Linney, J.A.; Alonso-Del-Real, J.; Spickett, C.M.; Pitt, A.R.; Guillamón, J.M.; Barrio, E.; Goddard, A.D.; Querol, A. Lipid composition analysis reveals mechanisms of ethanol tolerance in the model yeast Saccharomyces cerevisiae. Appl. Environ. Microbiol. 2021, 87, e00440-21. [Google Scholar] [CrossRef] [Scilit] [PubMed]
  4. Narayanan, A.; Pullepu, D.; Reddy, P.K.; Uddin, W.; Kabir, M.A. Defects in protein folding machinery affect cell wall integrity and reduce ethanol tolerance in S. cerevisiae. Curr. Microbiol. 2016, 73, 38–45. [Google Scholar] [CrossRef] [Scilit] [PubMed]
  5. Li, K.; Zhang, J.W.; Liu, C.G.; Mehmood, M.A. Elucidating the molecular mechanism of TEMPOL-mediated improvement on tolerance under oxidative stress in Saccharomyces cerevisiae. Chem. Eng. Sci. 2020, 211, 115306. [Google Scholar] [CrossRef] [Scilit]
  6. Shen, D.; He, X.; Weng, P.; Liu, Y.; Wu, Z. A review of yeast: High cell-density culture, molecular mechanisms of stress response and tolerance during fermentation. FEMS Yeast Res. 2022, 22, foac050. [Google Scholar] [CrossRef] [Scilit] [PubMed]
  7. Takagi, H. Molecular mechanisms and highly functional development for stress tolerance of the yeast Saccharomyces cerevisiae. Biosci. Biotechnol. Biochem. 2021, 85, 1017–1037. [Google Scholar] [CrossRef] [Scilit] [PubMed]
  8. Wang, P.M.; Zheng, D.Q.; Chi, X.Q.; Qian, C.D.; Liu, T.Z.; Zhang, X.Y.; Du, F.G.; Sun, P.Y.; Qu, A.M.; Wu, X.C. Relationship of trehalose accumulation with ethanol fermentation in industrial Saccharomyces cerevisiae yeast strains. Bioresour. Technol. 2014, 152, 371–376. [Google Scholar] [CrossRef] [Scilit] [PubMed]
  9. Samakkarn, W.; Ratanakhanokchai, K.; Soontorngun, N. Reprogramming of the ethanol stress response in Saccharomyces cerevisiae by the transcription factor Znf1 and its effect on the biosynthesis of glycerol and ethanol. Appl. Environ. Microbiol. 2021, 87, e00588-21. [Google Scholar] [CrossRef] [Scilit] [PubMed]
  10. Li, X.; Cen, N.; Liu, L.; Chen, Y.; Yang, X.; Yu, K.; Guo, J.; Liao, X.; Shi, B. Collagen peptide provides Saccharomyces cerevisiae with robust stress tolerance for enhanced bioethanol production. ACS Appl. Mater. Interfaces 2020, 12, 53879–53890. [Google Scholar] [CrossRef] [Scilit] [PubMed]
  11. Liu, P.T.; Duan, C.Q.; Yan, G.L. Comparing the effects of different unsaturated fatty acids on fermentation performance of Saccharomyces cerevisiae and aroma compounds during red wine fermentation. Molecules 2019, 24, 538. [Google Scholar] [CrossRef] [Scilit] [PubMed]
  12. Mbuyane, L.L.; Bauer, F.F.; Divol, B. The metabolism of lipids in yeasts and applications in oenology. Food Res. Int. 2021, 141, 110142. [Google Scholar] [CrossRef] [Scilit] [PubMed]
  13. Pereira, P.R.; Freitas, C.S.; Paschoalin, V.M.F. Saccharomyces cerevisiae biomass as a source of next-generation food preservatives: Evaluating potential proteins as a source of antimicrobial peptides. Compr. Rev. Food Sci. Food Saf. 2021, 20, 4450–4479. [Google Scholar] [CrossRef] [Scilit] [PubMed]
  14. Liu, M.; Liu, X.; Li, Y. Soybean peptides’ cryoprotective effects on Saccharomyces cerevisiae fermenting power in frozen dough and maintenance of the Chinese steamed bread qualities. J. Food Process. Preserv. 2020, 44, e14572. [Google Scholar] [CrossRef] [Scilit]
  15. Jin, X.; Yang, H.; Coldea, T.E.; Xu, Y.; Zhao, H. Metabonomic analysis reveals enhanced growth and ethanol production of brewer’s yeast by wheat gluten hydrolysates and potassium supplementation. LWT—Food Sci. Technol. 2021, 145, 111387. [Google Scholar] [CrossRef] [Scilit]
  16. Zhou, Y.; Yang, H.; Zong, X.; Cui, C.; Mu, L.; Zhao, H. Effects of wheat gluten hydrolysates fractionated by different methods on the growth and fermentation performances of brewer’s yeast under high gravity fermentation. Int. J. Food Sci. Technol. 2018, 53, 812–818. [Google Scholar] [CrossRef] [Scilit]
  17. Yang, H.; Zong, X.; Cui, C.; Mu, L.; Zhao, H. Wheat gluten hydrolysates separated by microporous resins enhance the stress tolerance in brewer’s yeast. Food Chem. 2018, 268, 162–170. [Google Scholar] [CrossRef] [Scilit] [PubMed]
  18. Kang, X.; Gao, Z.; Zheng, L.; Zhang, X.; Li, H. Regulation of Lactobacillus plantarum on the reactive oxygen species related metabolisms of Saccharomyces cerevisiae. LWT—Food Sci. Technol. 2021, 147, 111492. [Google Scholar] [CrossRef] [Scilit]
  19. Qin, L.; Dong, S.; Yu, J.; Ning, X.; Xu, K.; Zhang, S.J.; Xu, L.; Li, B.Z.; Li, J.; Yuan, Y.J.; et al. Stress-driven dynamic regulation of multiple tolerance genes improves robustness and productive capacity of Saccharomyces cerevisiae in industrial lignocellulose fermentation. Metab. Eng. 2020, 61, 160–170. [Google Scholar] [CrossRef] [Scilit] [PubMed]
  20. Cui, N.; Pozzobon, V.; Guerin, C.; Perré, P. Effect of increasing oxygen partial pressure on Saccharomyces cerevisiae growth and antioxidant and enzyme productions. Appl. Microbiol. Biotechnol. 2020, 104, 7815–7826. [Google Scholar] [CrossRef] [Scilit] [PubMed]
  21. Büchner, K.; Vidal, L.; Kerpes, R.; Becker, T. Establishing Reference Genes for Pichia pastoris Quantitative Real-Time Polymerase Chain Reaction Analyses. Methods Mol. Biol. 2026, 2697, 119–135. [Google Scholar] [CrossRef] [Scilit] [PubMed]
  22. Bustin, S.A.; Ruijter, J.M.; van den Hoff, M.J.B.; Kubista, M.; Pfaffl, M.W.; Shipley, G.L.; Tran, N.; Milavec, M.; Burns, M.J.; Huggett, J.F.; et al. MIQE 2.0: Revision of the Minimum Information for Publication of Quantitative Real-Time PCR Experiments Guidelines. Clin. Chem. 2025, 71, 634–651. [Google Scholar] [CrossRef] [Scilit] [PubMed]
  23. Meng, L.; Liu, H.L.; Lin, X.; Hu, X.P.; Teng, K.R.; Liu, S.X. Enhanced multi-stress tolerance and glucose utilization of Saccharomyces cerevisiae by overexpression of the SNF1 gene and varied beta isoform of Snf1 dominates in stresses. Microb. Cell Factories 2020, 19, 134. [Google Scholar] [CrossRef] [Scilit] [PubMed]
  24. Zhu, G.; Yin, N.; Luo, Q.; Liu, J.; Chen, X.; Liu, L.; Wu, J. Enhancement of sphingolipid synthesis improves osmotic tolerance of Saccharomyces cerevisiae. Appl. Environ. Microbiol. 2020, 86, e02911-19. [Google Scholar] [CrossRef] [Scilit] [PubMed]
  25. Barber, R.F.; Samworth, R.J. False discovery rate control with compound p-values. J. R. Stat. Soc. Ser. B Stat. Methodol. 2026, qkag116. [Google Scholar] [CrossRef] [Scilit]
  26. Sanyal, S.K.; Kanwar, P.; Fernandes, J.L.; Mahiwal, S.; Yadav, A.K.; Samtani, H.; Pandey, G.K. Arabidopsis mitochondrial voltage-dependent anion channels are involved in maintaining reactive oxygen species homeostasis, oxidative and salt stress tolerance in yeast. Front. Plant Sci. 2020, 11, 50. [Google Scholar] [CrossRef] [Scilit] [PubMed]
  27. Larsen, F.B.; Kragelund, B.B.; Lindorff-Larsen, K.; Heidarsson, P.O.; Hartmann-Petersen, R. Proteasomal control of transcription factors: Mechanisms, regulation and dysregulation. Cell. Mol. Life Sci. 2026, 83, 142. [Google Scholar] [CrossRef] [Scilit] [PubMed]
  28. Chellappa, R.; Kandasamy, P.; Oh, C.S.; Jiang, Y.; Vemula, M.; Martin, C.E. The membrane proteins, Spt23p and Mga2p, play distinct roles in the activation of Saccharomyces cerevisiae OLE1 gene expression. J. Biol. Chem. 2001, 276, 43548–43556. [Google Scholar] [CrossRef] [Scilit] [PubMed]
  29. Ribeiro, R.A.; Bourbon-Melo, N.; Sá-Correia, I. The cell wall and the response and tolerance to stresses of biotechnological relevance in yeasts. Front. Microbiol. 2022, 13, 953479. [Google Scholar] [CrossRef] [Scilit] [PubMed]
  30. Zhang, X.; Zhang, Y.; Li, H. Regulation of trehalose, a typical stress protectant, on central metabolisms, cell growth and division of Saccharomyces cerevisiae CEN.PK113-7D. Food Microbiol. 2020, 89, 103459. [Google Scholar] [CrossRef] [Scilit] [PubMed]
  31. Ibrahim, H.R.; Isono, H.; Miyata, T. Potential antioxidant bioactive peptides from camel milk proteins. Anim. Nutr. 2018, 4, 273–280. [Google Scholar] [CrossRef] [Scilit] [PubMed]
  32. González, J.; Castillo, R.; García-Campos, M.A.; Noriega-Samaniego, D.; Escobar-Sánchez, V.; Romero-Aguilar, L.; Alba-Lois, L.; Segal-Kischinevzky, C. Tolerance to oxidative stress in budding yeast by heterologous expression of catalases a and t from Debaryomyces hansenii. Curr. Microbiol. 2020, 77, 4000–4015. [Google Scholar] [CrossRef] [Scilit] [PubMed]
  33. Godinho, C.P.; Prata, C.S.; Pinto, S.N.; Cardoso, C.; Bandarra, N.M.; Fernandes, F.; Sá-Correia, I. Pdr18 is involved in yeast response to acetic acid stress counteracting the decrease of plasma membrane ergosterol content and order. Sci. Rep. 2018, 8, 7860. [Google Scholar] [CrossRef] [Scilit] [PubMed]
  34. Lam, F.H.; Ghaderi, A.; Fink, G.R.; Stephanopoulos, G. Engineering alcohol tolerance in yeast. Science 2014, 346, 71–75. [Google Scholar] [CrossRef] [Scilit] [PubMed]
  35. Ribeiro, R.A.; Godinho, C.P.; Vitorino, M.V.; Robalo, T.T.; Fernandes, F.; Rodrigues, M.S.; Sá-Correia, I. Crosstalk between yeast cell plasma membrane ergosterol content and cell wall stiffness under acetic acid stress involving Pdr18. J. Fungi 2022, 8, 103. [Google Scholar] [CrossRef] [Scilit] [PubMed]
  36. Liu, G.; Bi, X.; Tao, C.; Fei, Y.; Gao, S.; Liang, J.; Bai, W. Comparative transcriptomics analysis of Zygosaccharomyces mellis under high-glucose stress. Food Sci. Hum. Wellness 2021, 10, 54–62. [Google Scholar] [CrossRef] [Scilit]
  37. Lin, N.X.; He, R.Z.; Xu, Y.; Yu, X.W. Augmented peroxisomal ROS buffering capacity renders oxidative and thermal stress cross-tolerance in yeast. Microb. Cell Factories 2021, 20, 131. [Google Scholar] [CrossRef] [Scilit] [PubMed]
  38. Techo, T.; Jindarungrueng, S.; Tatip, S.; Limcharoensuk, T.; Pokethitiyook, P.; Kruatrachue, M.; Auesukaree, C. Vacuolar H+-ATPase is involved in preventing heavy metal-induced oxidative stress in Saccharomyces cerevisiae. Environ. Microbiol. 2020, 22, 2403–2418. [Google Scholar] [CrossRef] [Scilit] [PubMed]
  39. Fang, Z.; Chen, Z.; Wang, S.; Shi, P.; Shen, Y.; Zhang, Y.; Xiao, J.; Huang, Z. Overexpression of OLE1 enhances cytoplasmic membrane stability and confers resistance to cadmium in Saccharomyces cerevisiae. Appl. Environ. Microbiol. 2016, 83, e02319-16. [Google Scholar] [CrossRef] [Scilit] [PubMed]
  40. Bossaerts, L.; Allard, E.; Langenaeken, N.A.; Wouters, A.G.B.; Courtin, C.M. Enhancing bubble formation and foam properties in non-alcoholic beer: The potential of iso-alpha-acids and protein hydrolysates. Food Hydrocoll. 2026, 181, 113014. [Google Scholar] [CrossRef] [Scilit]
Figure 1. Effects of fatty acids on cell viability, growth, intracellular substance contents, intracellular pH, and ethanol production. (A) Changes in cell viability; (B) Cell growth curves; (C) Intracellular trehalose concentration (unit: μg/107 cells) and glycerol content (unit: g/L); (D) Intracellular pH and ethanol volume percentage (v/v) in different fatty acid treatment groups and the control group. Error bars indicate the standard deviations. *, p < 0.05; **, p < 0.01; ***, p < 0.001; comparisons without asterisks indicate no significant differences (p > 0.05).
Fermentation 12 00436 g001
Figure 2. Effects of different fatty acids on cellular oxidative stress and energy metabolism-related indicators. The impact of different fatty acids on intracellular reactive oxygen species (ROS) levels (A), catalase (CAT) activity (B), superoxide dismutase (SOD) activity (C), glutathione peroxidase (GSH-Px) activity (D), glutathione (GSH) content (E), and adenosine triphosphate (ATP) content (F) in yeast cells. Error bars indicate the standard deviations. *, p < 0.05; **, p < 0.01; ***, p < 0.001; comparisons without asterisks indicate no significant differences (p > 0.05).
Fermentation 12 00436 g002
Figure 3. Effects of different fatty acids on the composition of yeast cell membrane and cell wall and gene expression. (A) Effects of different fatty acids on the content of key substances in the yeast cell membrane; (B) Effects of different fatty acids on the content of key substances in the yeast cell wall; (C) Effects of different fatty acids on the expression of key genes in the yeast cell wall; (D) Effects of different fatty acids on the expression of key genes in the yeast cell membrane wall; (E) Effects of different fatty acids treatment on cell membrane integrity; (F) Identification of key factors affecting the yeast cell wall and cell membrane. Error bars indicate the standard deviations. *, p < 0.05; **, p < 0.01; ***, p < 0.001; comparisons without asterisks indicate no significant differences (p > 0.05).
Fermentation 12 00436 g003
Figure 4. Effects of different fatty acids on volatiles and amino acid content. (A) Effect of different fatty acids on the content of volatile flavor compounds in fermented beer; (B) Composition of volatile flavor compounds in beer; (C) Effect of different fatty acids on the amino acid content in beer. Error bars indicate the standard deviations. *, p < 0.05; **, p < 0.01; ***, p < 0.001; comparisons without asterisks indicate no significant differences (p > 0.05).
Fermentation 12 00436 g004
Figure 5. Quantitative descriptive analysis of the finished beers (nine-point scale, panel means).
Fermentation 12 00436 g005
Figure 6. Effects of exogenous fatty acid supplementation on beer fermentation. (A) Impact of POA supplementation (P0–P12) and no fatty acid supplementation (C0–C12) on beer flavor compounds. The color gradient from blue to red indicates correlation strength from negative to positive; (B) Bubble chart of KEGG pathway enrichment analysis, with the x-axis representing Gene Ratio and the y-axis representing -log10(Q-value). Bubble color corresponds to -log10(Q-value) intensity, while bubble size indicates Count values; (C) Correlation analysis between different fatty acids and volatile flavor compounds. The color gradient from blue to red represents the transition from negative to positive correlation, with solid and hollow circles indicating different correlation significance levels. Error bars indicate the standard deviations.
Fermentation 12 00436 g006
Figure 7. Schematic of the physiological and metabolomic profiles of yeast cells regulated by POA addition under oxidative stress. Boxplots show the normalized values of metabolites in central carbon metabolism, arginine and proline metabolism, and the pantothenate–coenzyme A route that were significantly regulated in the POA group relative to the control group. Boxplots filled in red indicated the POA group, and the boxplots filled in blue indicated the control group. Metabolic pathways were shown in black bold characters. *, p < 0.05; **, p < 0.01; ***, p < 0.001.
Fermentation 12 00436 g007
Disclaimer/Publisher’s Note: The statements, opinions and data contained in all publications are solely those of the individual author(s) and contributor(s) and not of MDPI and/or the editor(s). MDPI and/or the editor(s) disclaim responsibility for any injury to people or property resulting from any ideas, methods, instructions or products referred to in the content.