Use of Nanoparticle Enhanced Phase Change Material for Cooling of Surface Acoustic Wave Sensor


Abstract
:1. Introduction
2. Modeling
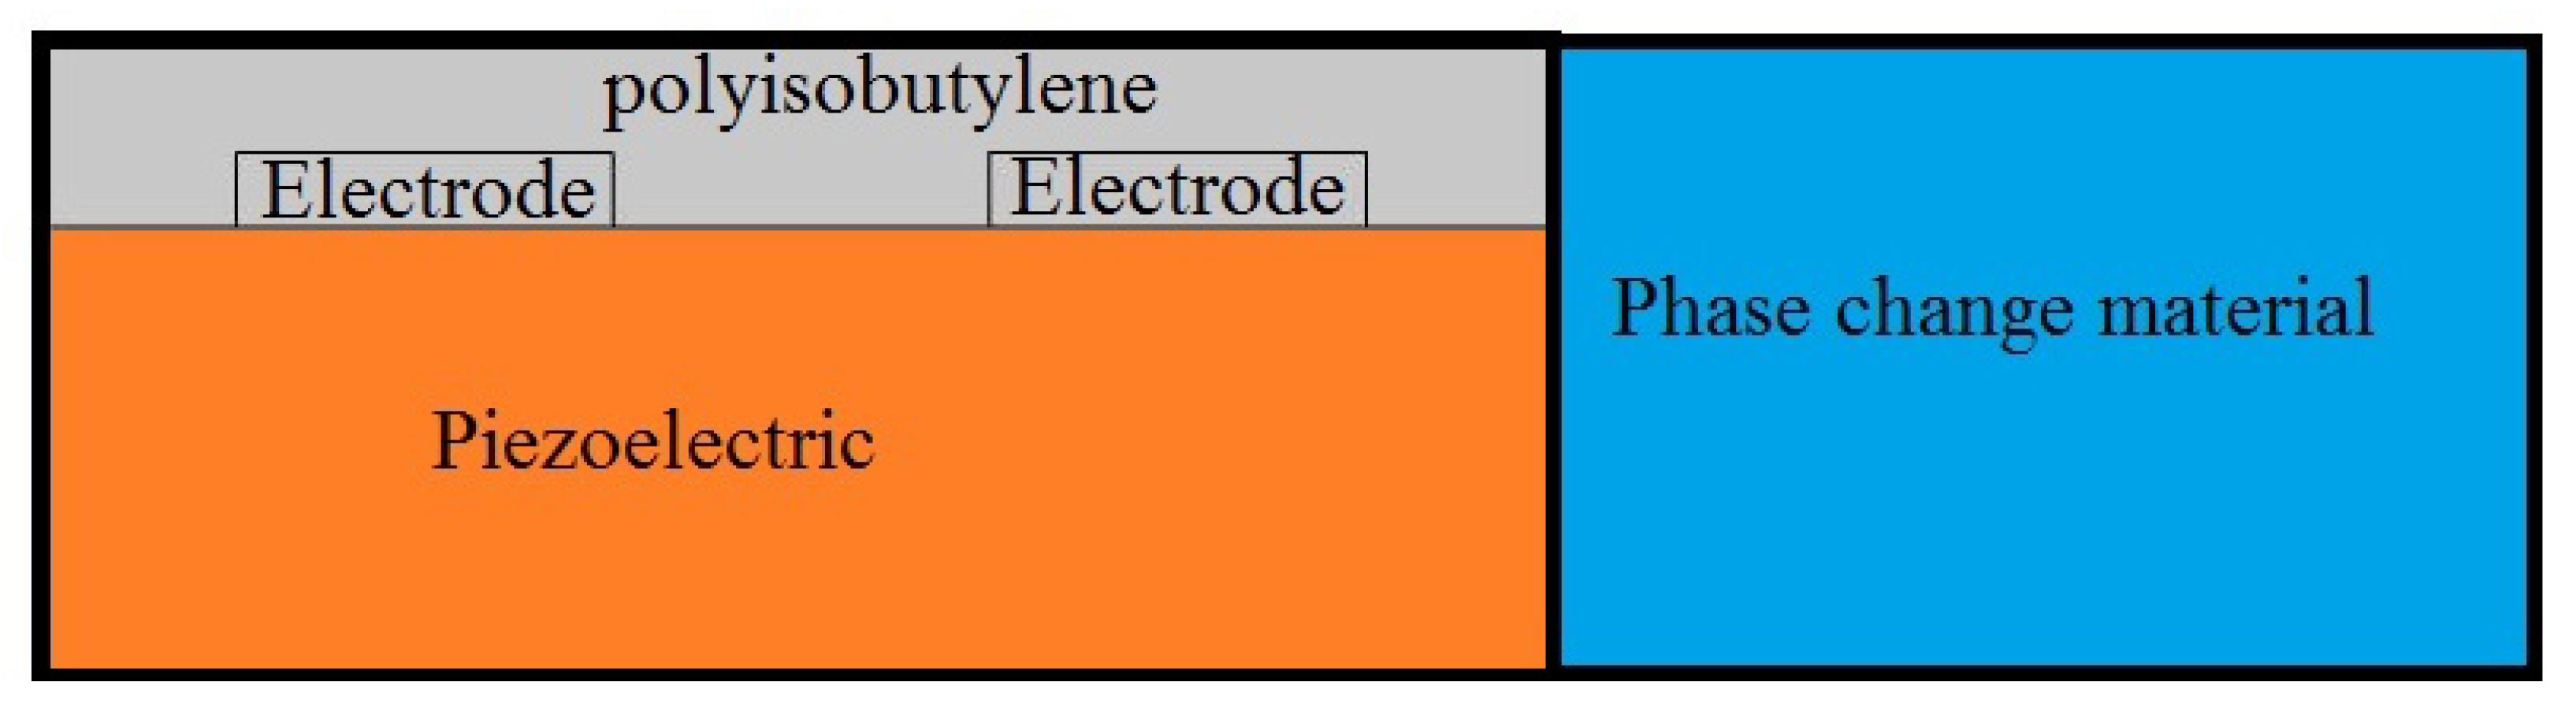
2.1. Cooling Part
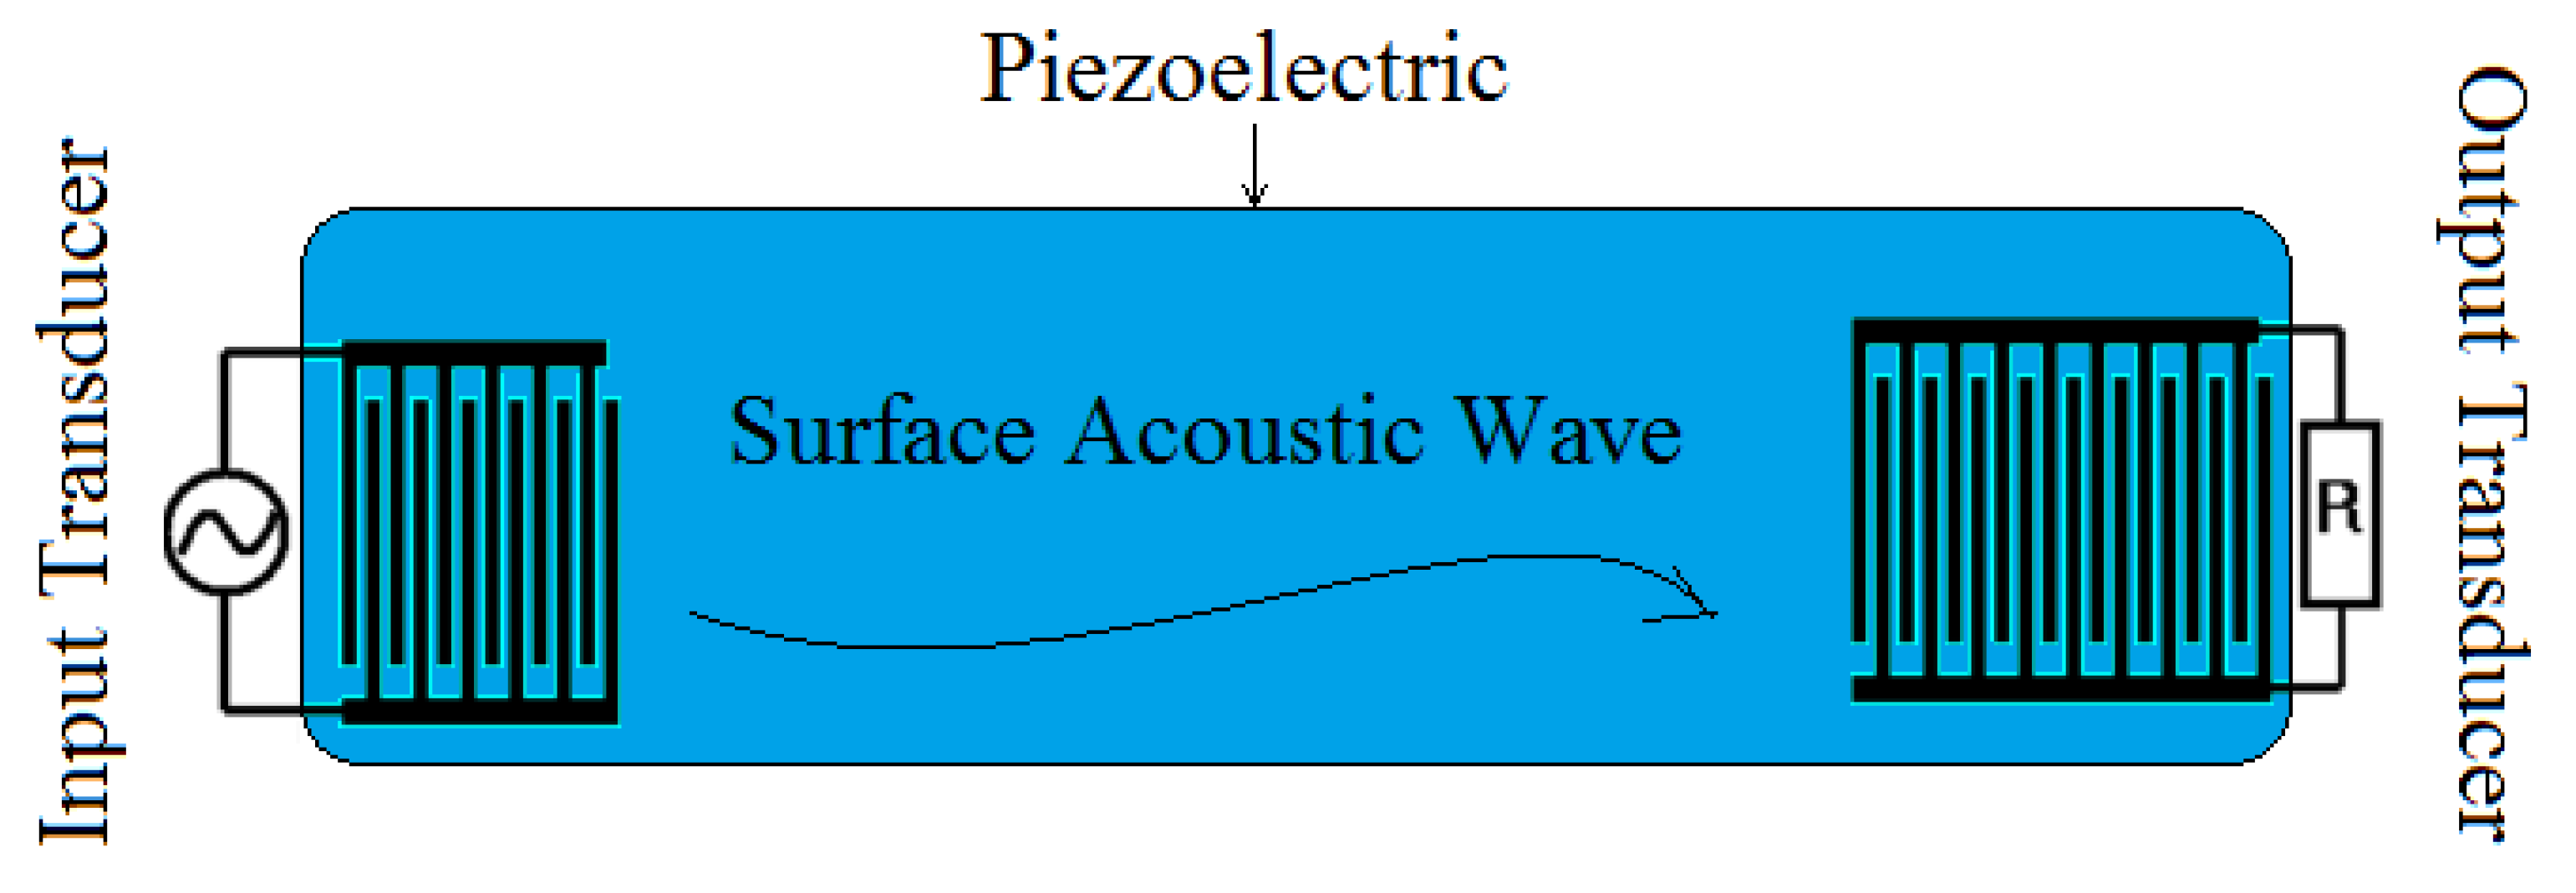
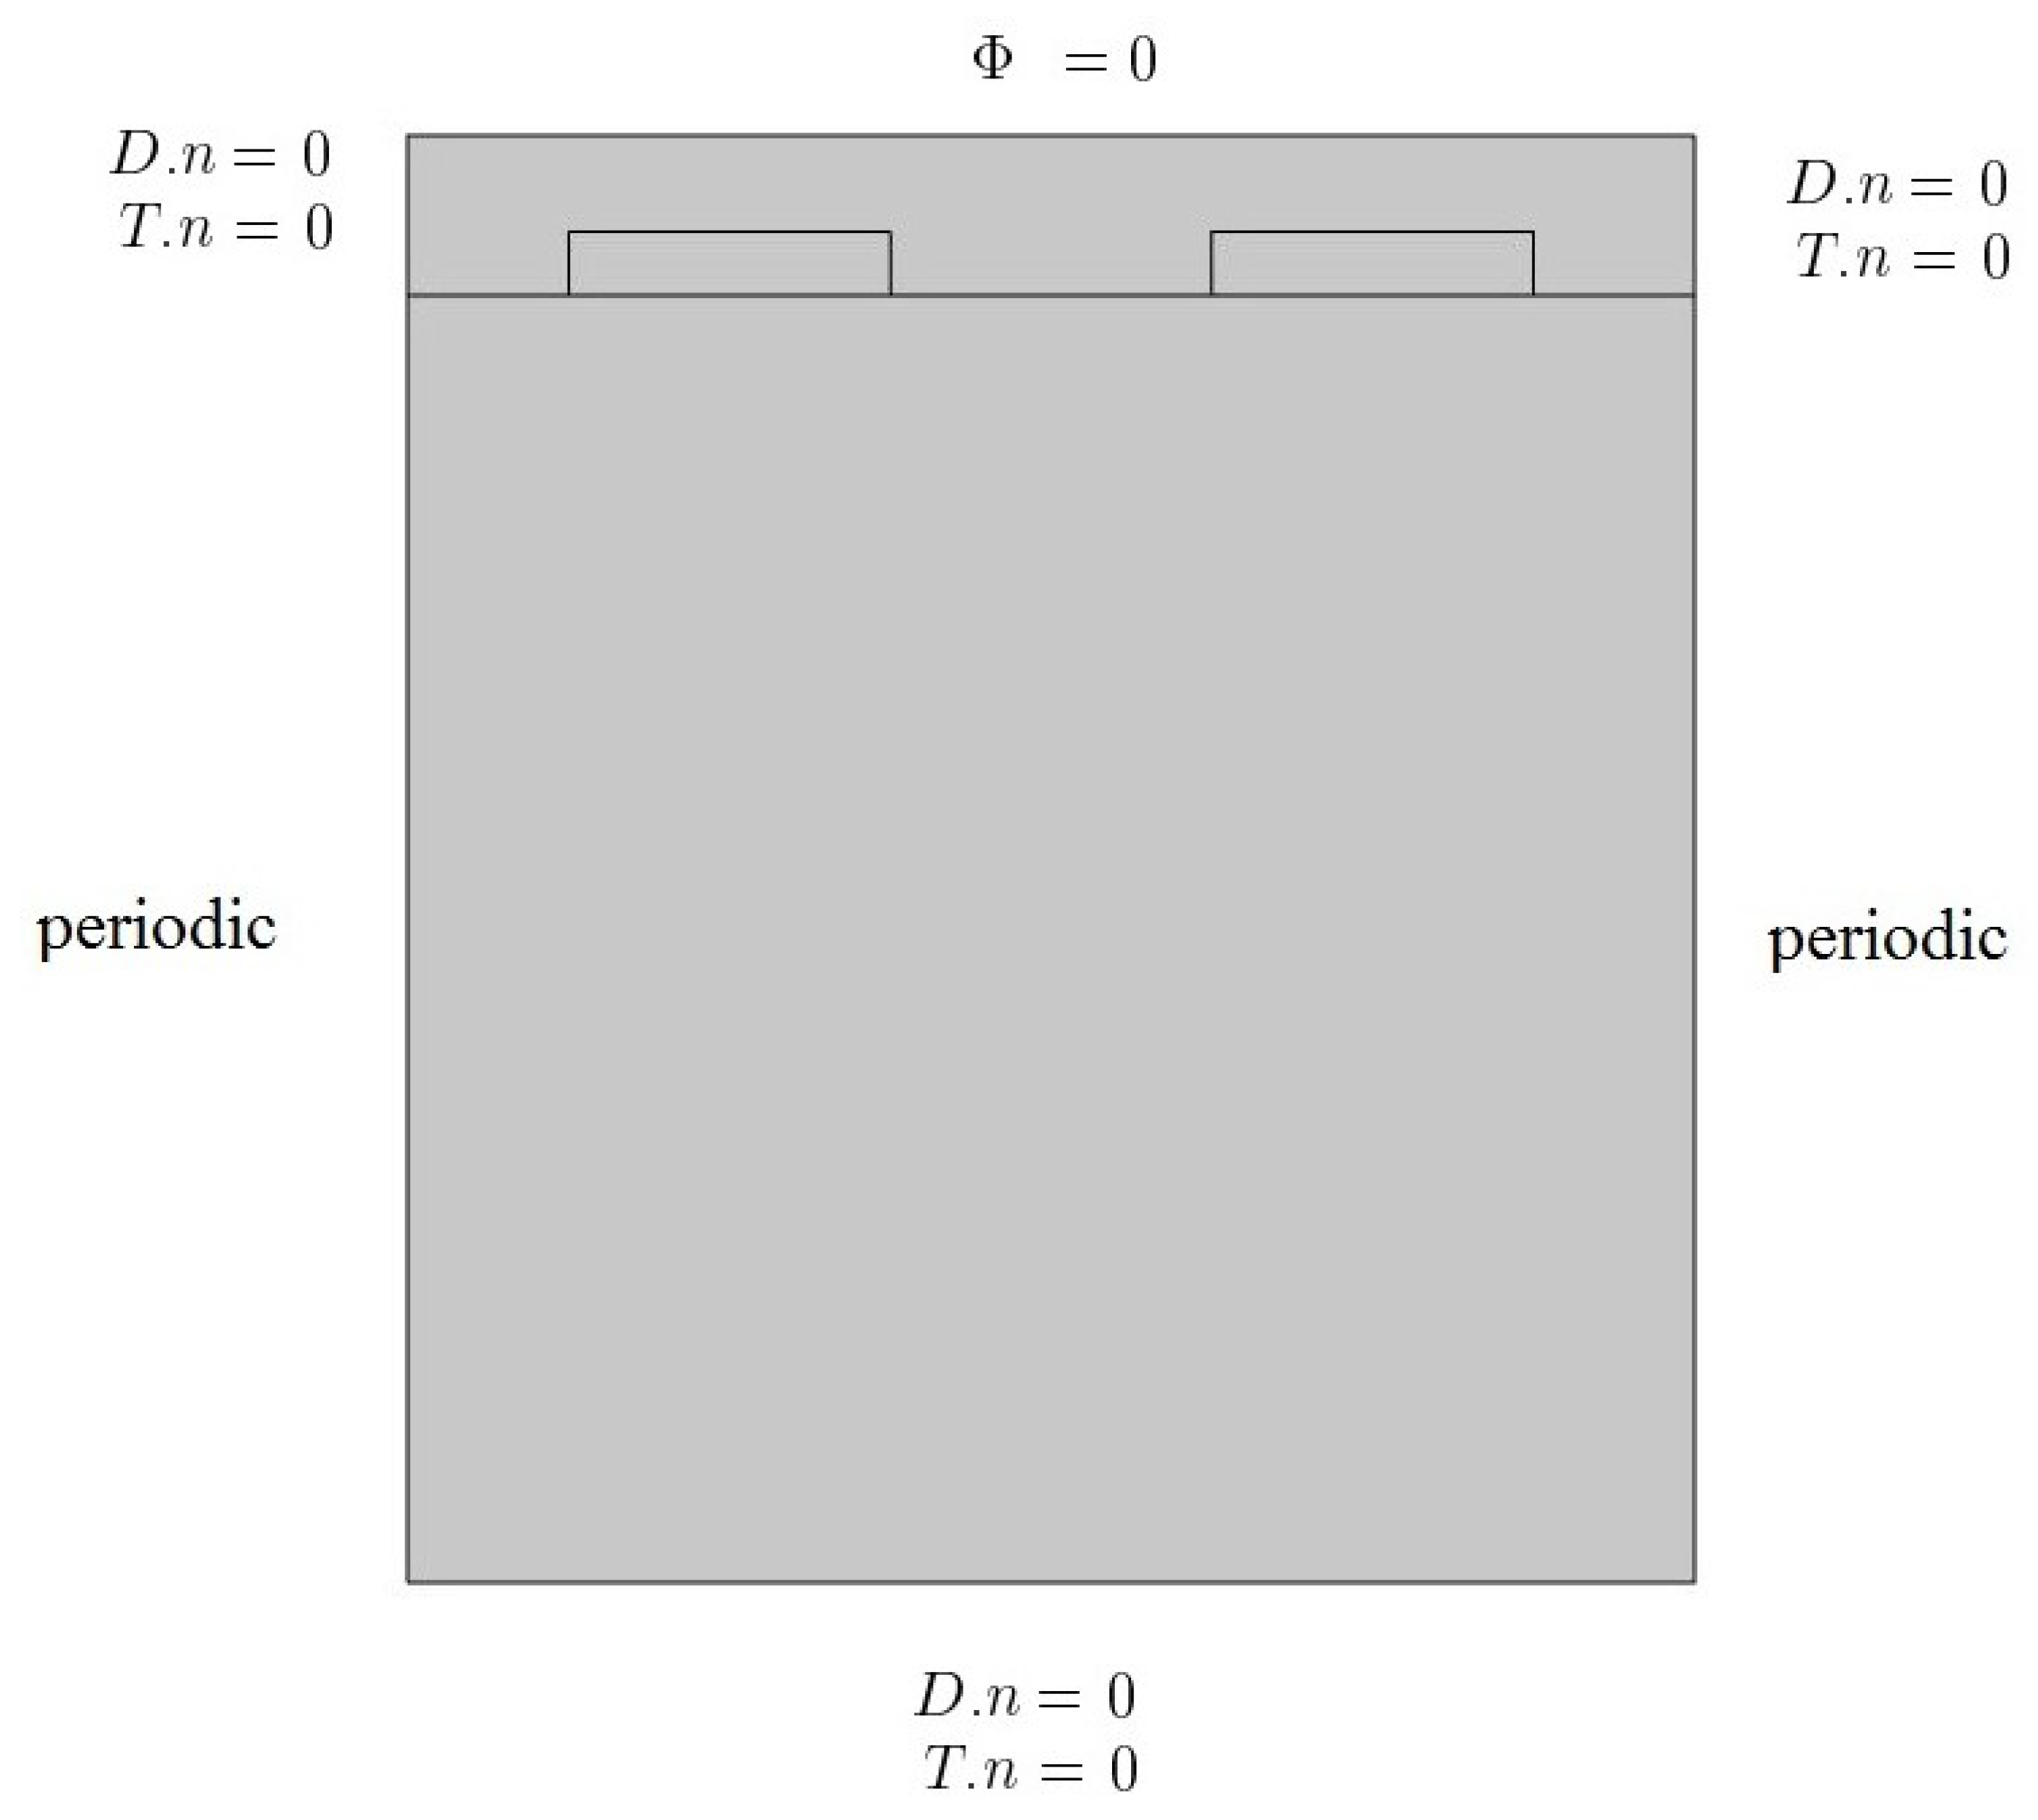
2.2. Surface Acoustic Wave in Electrical Part
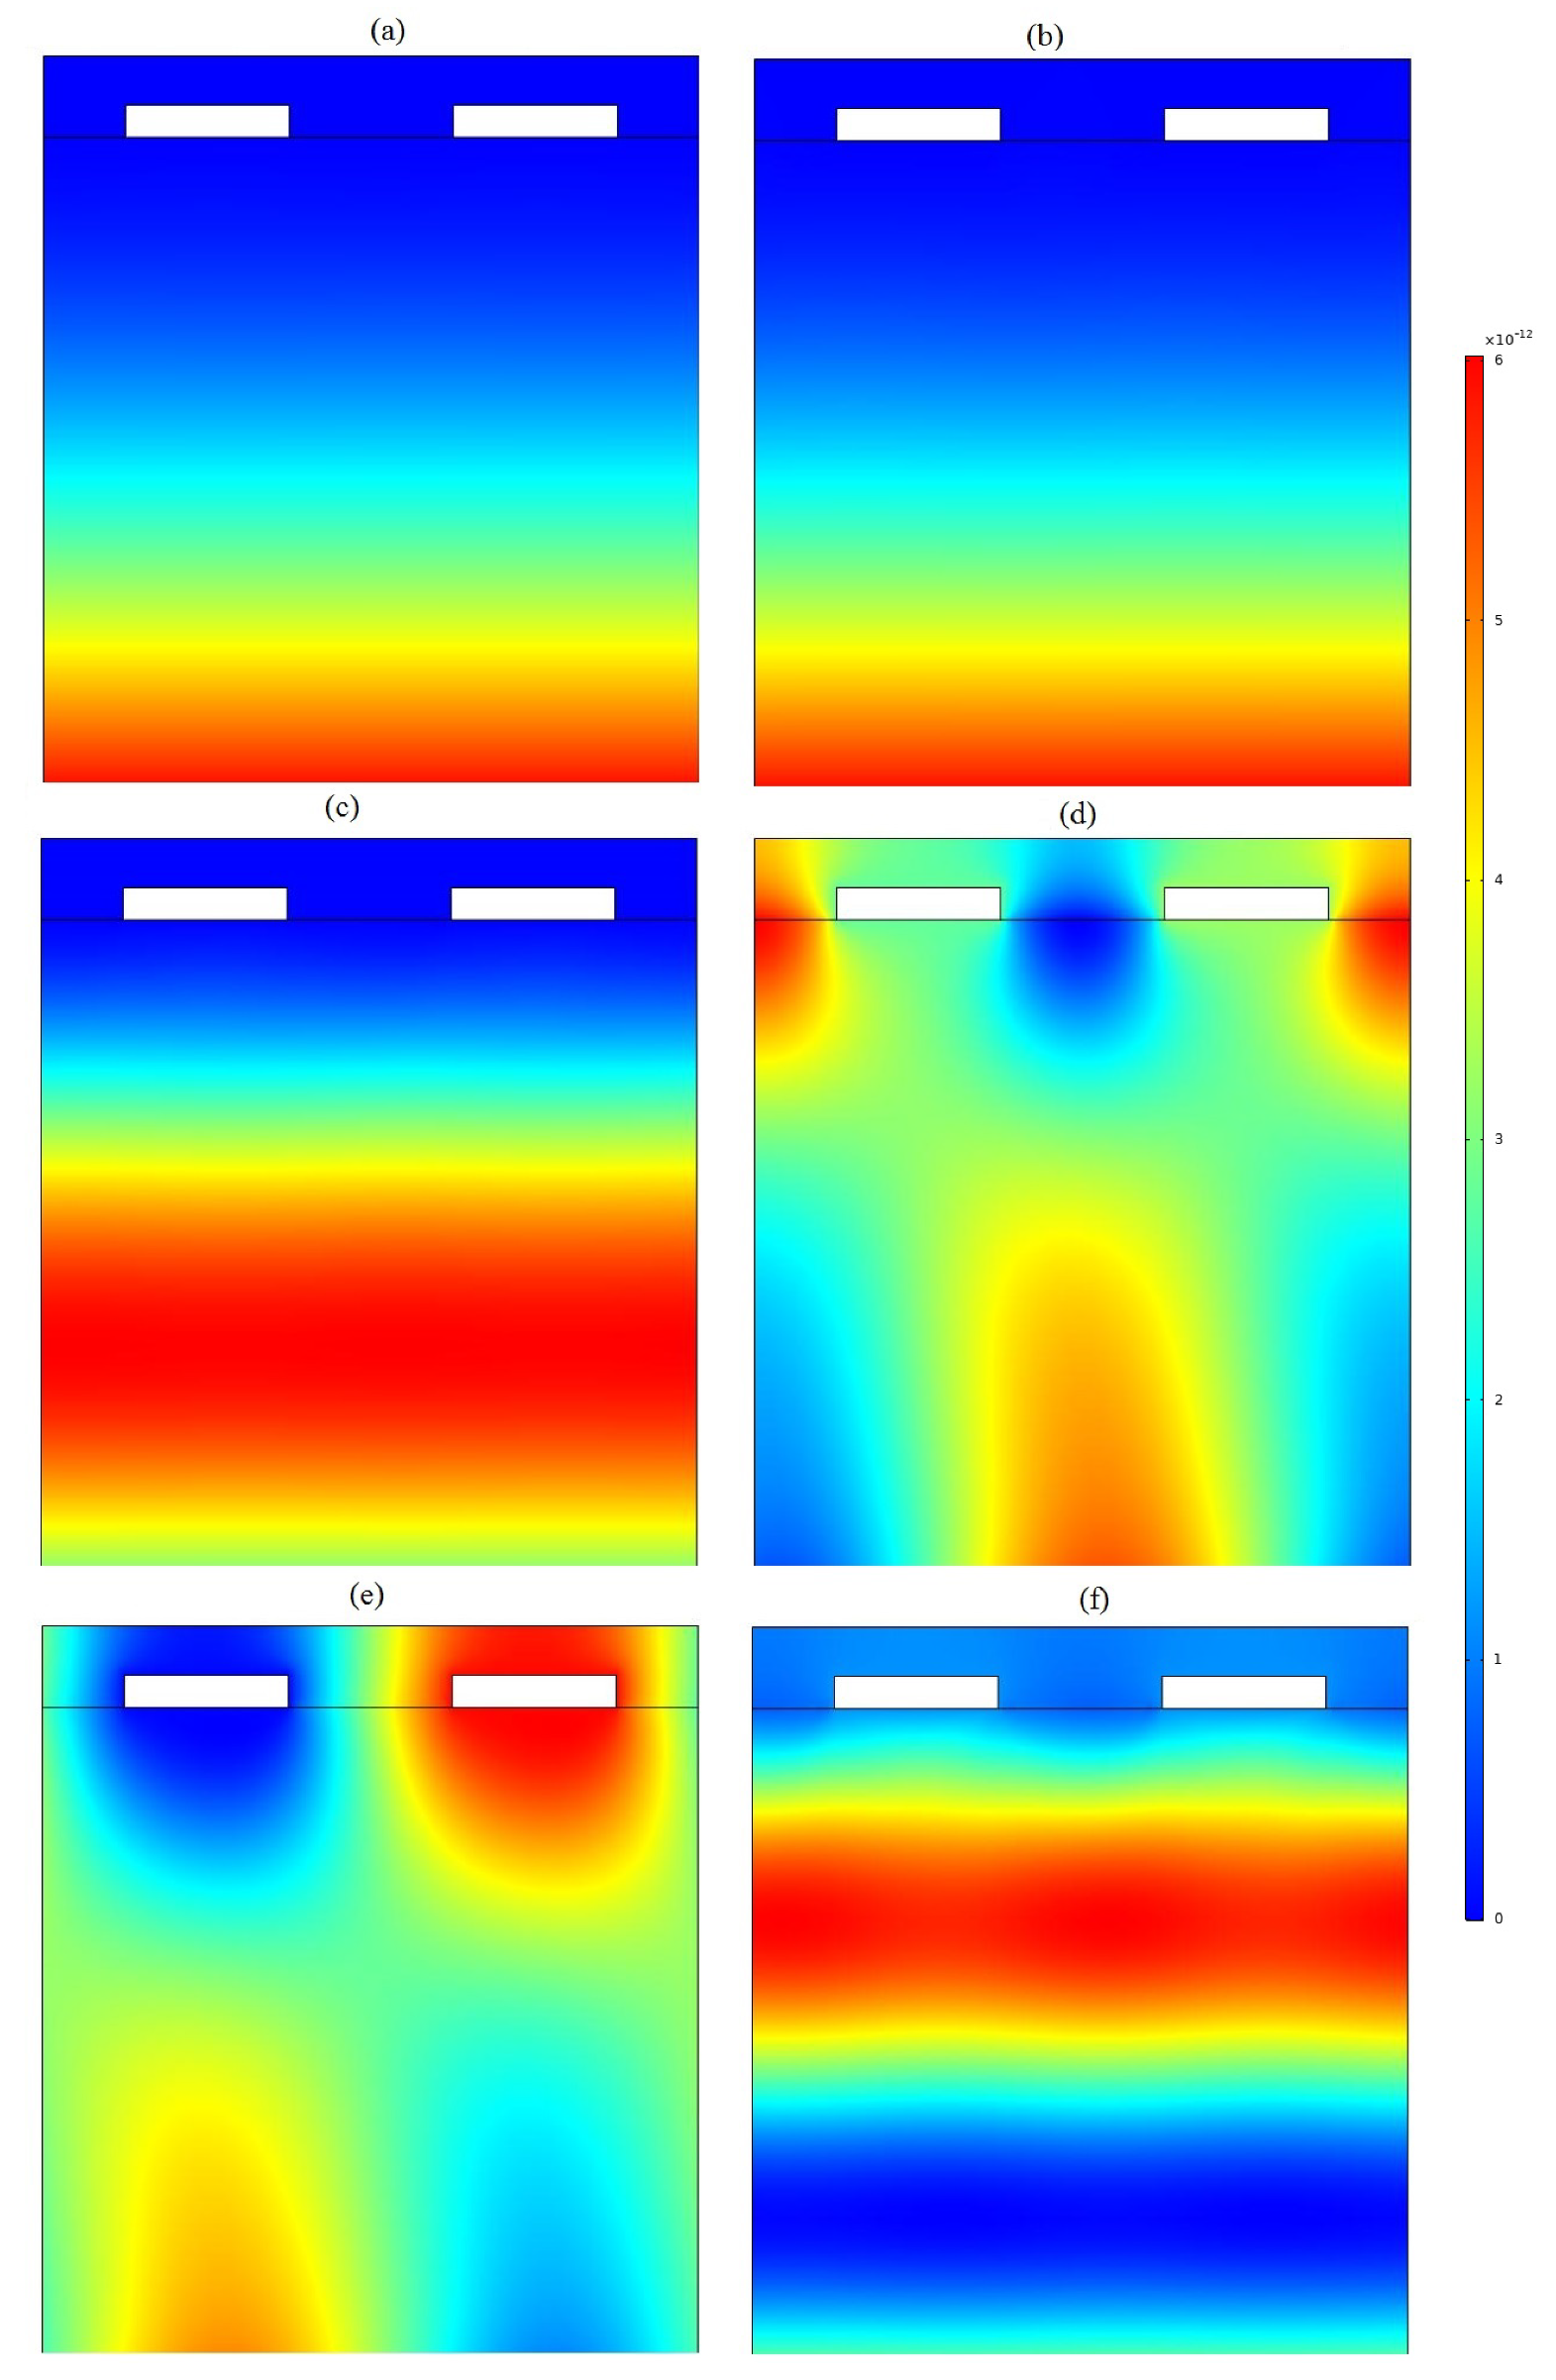
3. Results
4. Conclusions
Funding
Institutional Review Board Statement
Informed Consent Statement
Data Availability Statement
Conflicts of Interest
Nomenclature
| C | Constant pressure specific heat (J·kg·K) |
| g | Gravity constant (m·s) |
| l | Length of the cavity |
| H | Height of the cavity |
| latent heat of melting (J·kg) | |
| k | Coefficient of the thermal conductivity (W·m·K) |
| Nu | Nusselt number |
| p | pressure (Pa) |
| Pr | Prandtl number |
| Ra | Rayleigh number |
| Ste | Stefan number |
| T | temperature (K) |
| u | x-velocity component (m·s) |
| v | y-velocity component (m·s) |
| x | x-Cartesian coordinate (m) |
| y | y-Cartesian coordinate (m) |
| Greek symbols | |
| Dynamic viscosity (kg·sm) | |
| Coefficient of thermal diffusivity (m·s) | |
| Coefficient of thermal expansion (K) | |
| Weight ratio of the nanoparticle inside NEPCM | |
| Density (kg·m) | |
| Subscript | |
| b | Bulk properties |
| c | cold surface |
| f | base fluid |
| h | Hot surface |
References
- Wang, Y.; Tao, X.; Tao, R.; Zhou, J.; Fu, Y.Q. Acoustofluidics along inclined surfaces based on AlN/Si Rayleigh surface acoustic waves. Sens. Actuators Phys. 2020, 306, 111967. [Google Scholar] [CrossRef]
- Kong, D.; Nishio, K.; Kurosawa, M.K. Surface acoustic wave propulsion system with acoustic radiation force. Sens. Actuators Phys. 2020, 309, 111943. [Google Scholar] [CrossRef]
- Dryburgh, P.; Smith, R.J.; Marrow, P.; Lainé, S.J.; Li, W. Determining the crystallographic orientation of hexagonal crystal structure materials with surface acoustic wave velocity measurements. Ultrasonics 2020, 108, 106171. [Google Scholar] [CrossRef] [PubMed]
- Jiang, T.; Li, C.; Han, Q. Surface acoustic waves in 2D-phononic crystal of laminated pillars on a semi-infinite ZnO substrate. Phys. Lett. A 2019, 383, 125956. [Google Scholar] [CrossRef]
- Alagoz, S.; Apak, Y. Removal of spoiling materials from solar panel surfaces by applying surface acoustic waves. J. Clean. Prod. 2020, 253, 119992. [Google Scholar] [CrossRef]
- Weser, R.; Winkler, A.; Weihnacht, M.; Menzel, S.; Schmidt, H. The complexity of surface acoustic wave fields used for microfluidic applications. Ultrasonics 2020, 106, 106160. [Google Scholar] [CrossRef] [PubMed]
- Liang, X.; Lin, B.; Liu, Z. Analysis of velocity calculation methods of laser-induced surface acoustic wave. Ultrasonics 2020, 100, 105985. [Google Scholar] [CrossRef]
- Zhang, Y.; Cai, Y.; Zhou, J.; Xie, Y.; Liu, S. Surface acoustic wave-based ultraviolet photodetectors: A review. Sci. Bull. 2020, 65, 587–600. [Google Scholar] [CrossRef] [Green Version]
- Chan, J.S.; Poh, P.E.; Ismadi, M.-P.; Yeo, L.Y.; Tan, M.K. Enhancing greywater treatment via MHz-Order surface acoustic waves. Water Res. 2020, 169, 115187. [Google Scholar] [CrossRef]
- Hsu, J.-C.; Lin, Y.-D. Microparticle concentration and separation inside a droplet using phononic-crystal scattered standing surface acoustic waves. Sens. Actuators A Phys. 2019, 300, 111651. [Google Scholar] [CrossRef]
- Zhang, H.; Xu, X.-D.; Cheng, L.-P.; Zhang, S.-Y. Experimental studies of a new type of non-contact rotary motors driven by surface acoustic waves. Sens. Actuators A Phys. 2019, 297, 111524. [Google Scholar] [CrossRef]
- Wang, Y.; Chen, D.; Wu, C.; Xie, J. Effect of droplet boundary behaviors on SAW attenuation for potential microfluidic applications. Jpn. J. Appl. Phys. 2019, 58, 037001. [Google Scholar] [CrossRef]
- Li, G.-C.; Yang, P.; Zhang, W.; Wu, Z.; Kou, Z.-H. Enhanced film cooling performance of a row of cylindrical holes embedded in the saw tooth slot. Int. J. Heat Mass Transf. 2019, 132, 1137–1151. [Google Scholar] [CrossRef]
- Lamanna, L.; Rizzi, F.; Bhethanabotla, V.R.; De Vittori, M. Conformable surface acoustic wave biosensor for E-coli fabricated on PEN plastic film. Biosens. Bioelectron. 2020, 163, 112164. [Google Scholar] [CrossRef] [PubMed]
- Qin, F.; Li, B.; Chen, L.; Shang, Z. Laser-induced surface acoustic waves for measurement of elastic constants based on mode conversion. Mater. Chem. Phys. 2020, 242, 122523. [Google Scholar] [CrossRef]
- Aslam, M.Z.; Jeoti, V.; Karuppanan, S.; Pandian, M.S.; Suresh, K. Surface acoustic wave modes characteristics of CMOS compatible SiO2/AlN/SiO2/Si multilayer structure with embedded electrodes. Sens. Actuators A Phys. 2020, 313, 112202. [Google Scholar] [CrossRef]
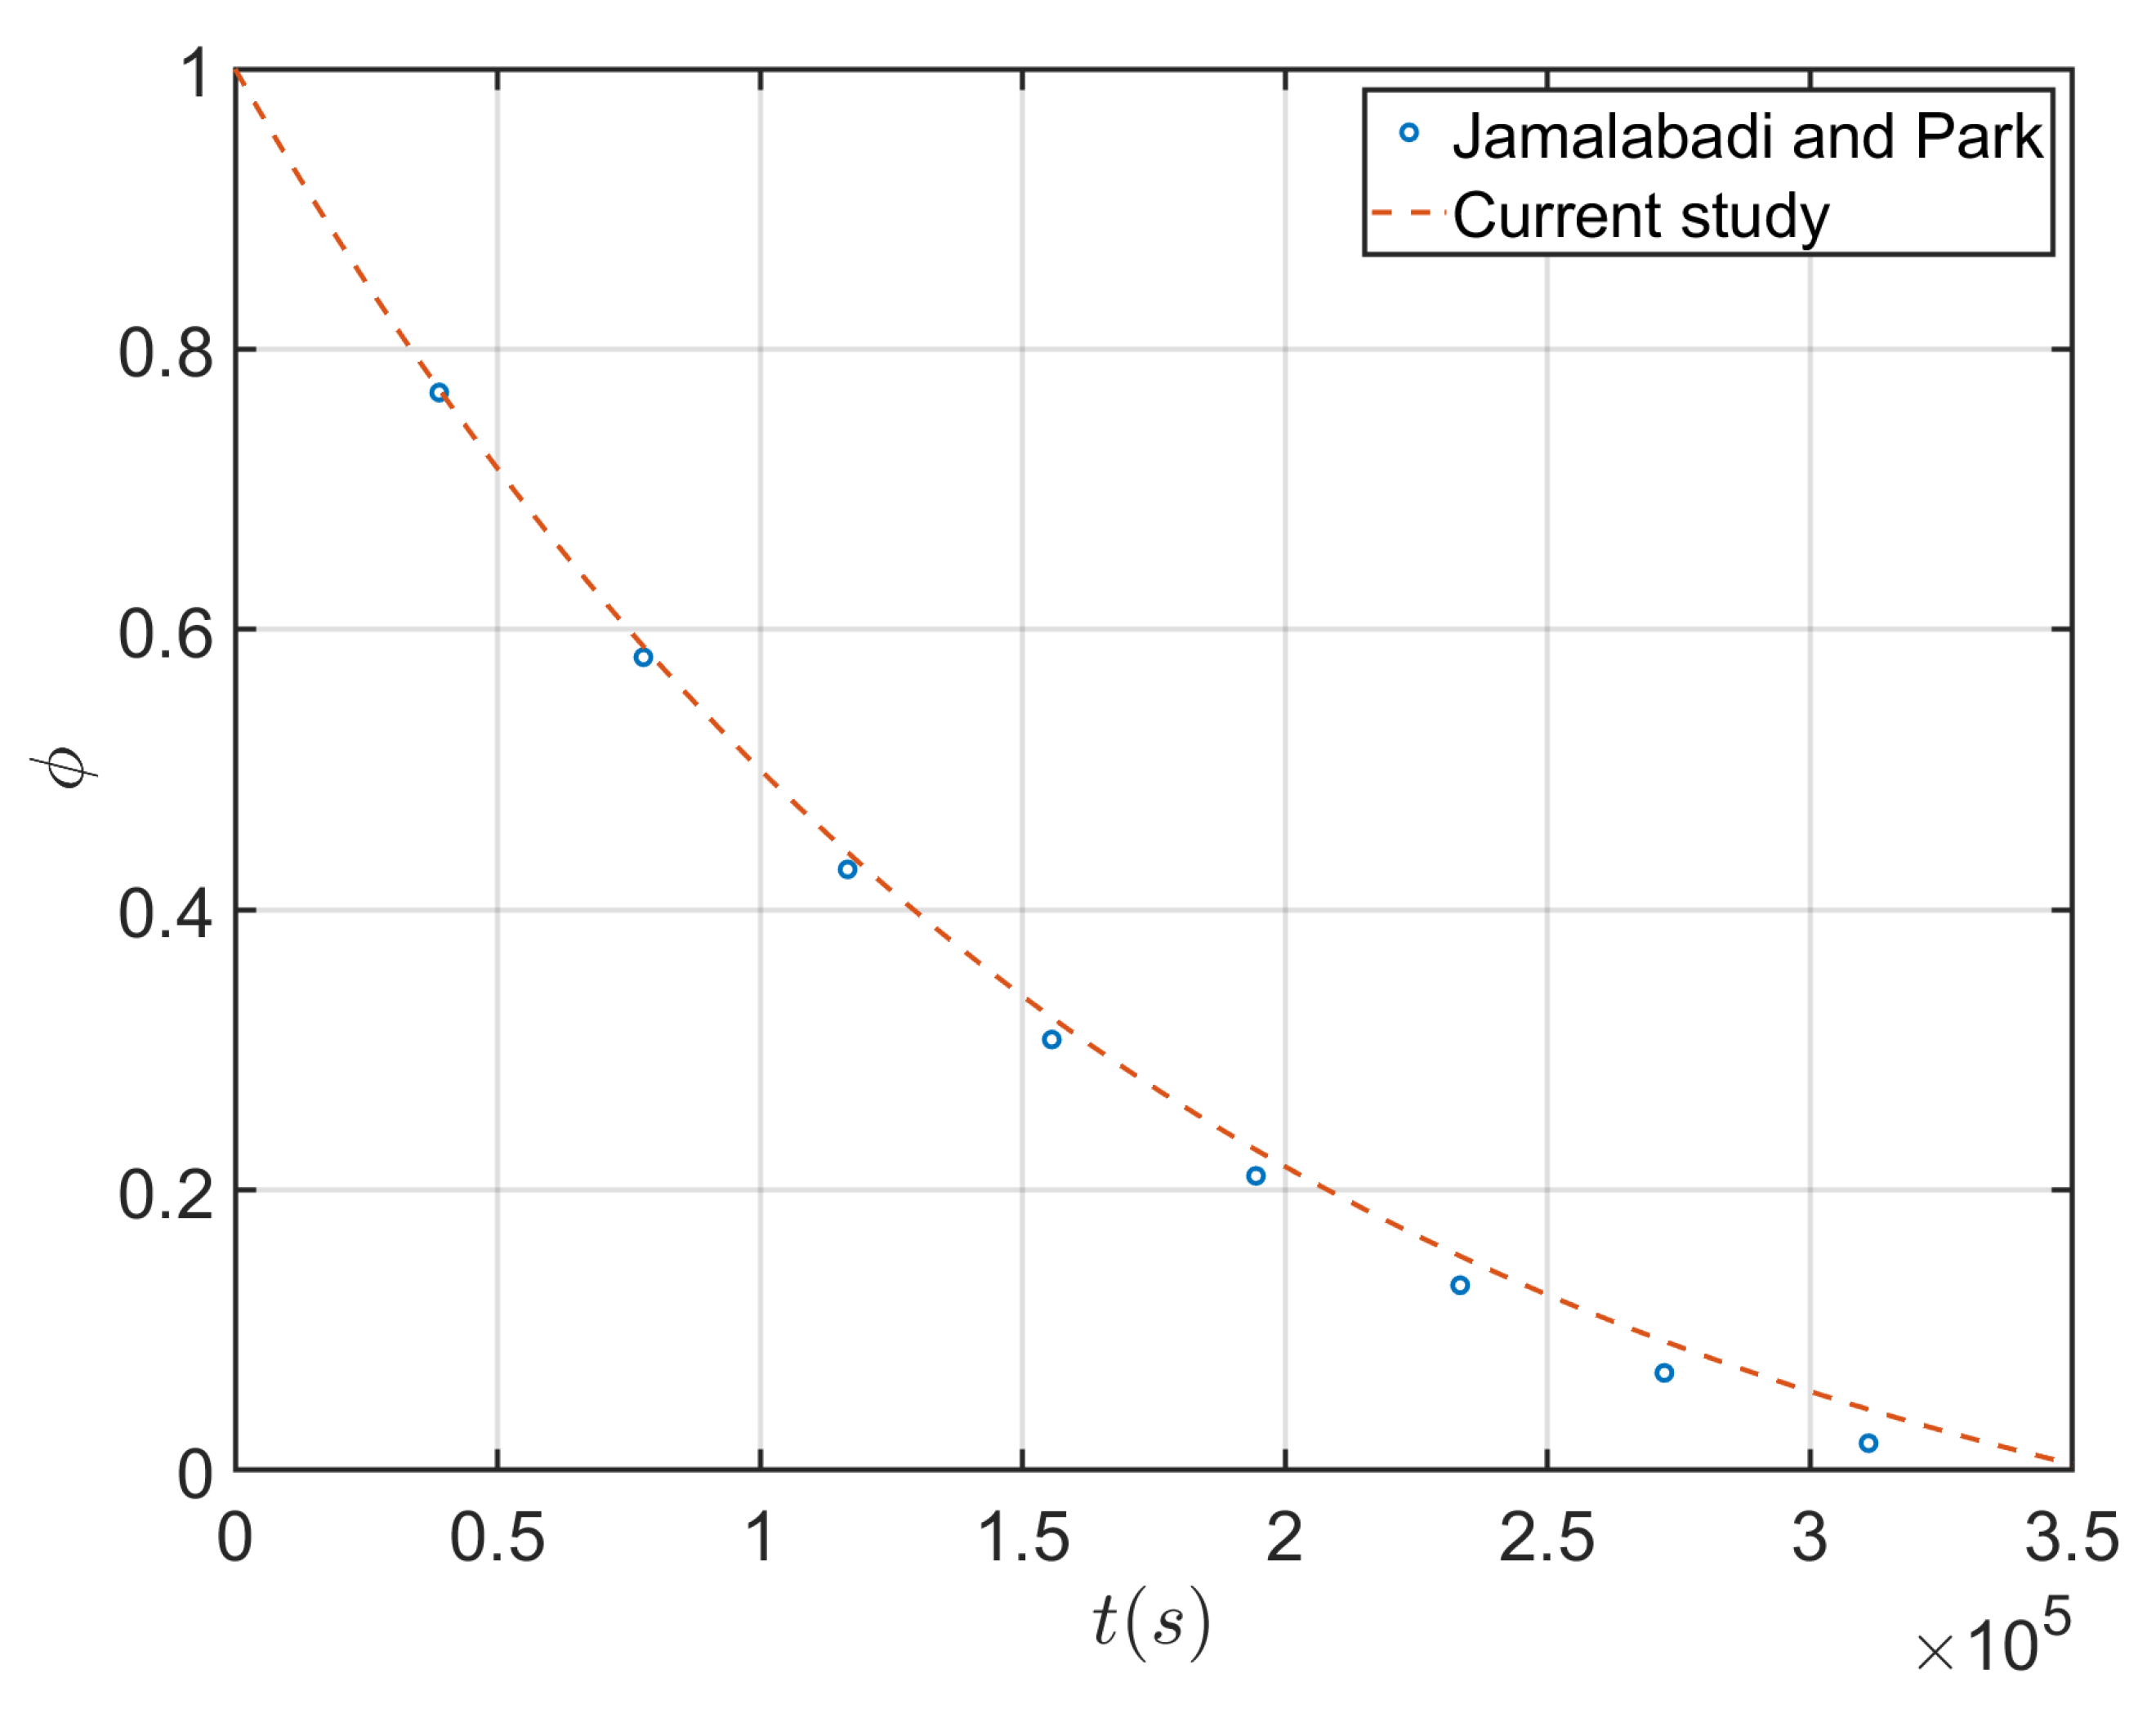
- Jamalabadi, M.Y.A.; Park, J.H. Investigation of Property Variations on Freezing of PCM Containing Nanoparticles. World Appl. Sci. J. 2014, 32, 672–677. [Google Scholar]
- Jamalabadi, M.Y.A.; Park, J.H. Effects of Brownian motion on freezing of PCM containing nanoparticles. Therm. Sci. 2016, 20, 1533–1541. [Google Scholar]
- Jamalabadi, M.Y.A. Rational Design Calculation of Surface Acoustic Wave Gas Sensor. Phys. J. 2020, 6, 62–87. [Google Scholar]
- Jamalabadi, M.Y.A. MD Simulation of Brownian Motion of Buckminsterfullerene Trapping in nano—Optical Tweezers. Int. J. Opt. Appl. 2015, 5, 161–167. [Google Scholar]
- Mohammad, A.J.; Mohammad, S.; Abdullah, A.; Truong, N.; Enio, B.F. Entropy Generation in Thermal Radiative Loading of Structures with Distinct Heaters. Entropy 2017, 19, 506. [Google Scholar]


| Nanofluid Property | Formula |
|---|---|
| k | |
| Material | k | C | ||||
|---|---|---|---|---|---|---|
| W/m·K | kJ/kg·K | kg/m | (K) | J/kg | ||
| fluid TH29 | 0.53 | 2.2 | 1530 | 2 | 187 | 5.33 |
| solid TH29 | 1.09 | 1.4 | 1719 | 187 | ||
| Cu | 400 | 0.383 | 8954 |
| Parameter | Expression | Explanation |
|---|---|---|
| T | 25 [C] | Environment temperature |
| 0.918 [g/cm] | Density of polyisobutylene | |
| 10 [GPa] | Young’s modulus of polyisobutylene | |
| 0.48 | Poisson’s ratio of polyisobutylene | |
| 2.2 | Relative permittivity of polyisobutylene | |
| 3488 [m/s] | Rayleigh wave velocity | |
| W | 4 | Width of unit cell |
| Estimated SAW frequency | ||
| 0.5 | polyisobutylene thickness |
| Property | Units | Value |
|---|---|---|
| Eigenfrequency | Hz | 2.4664 |
| Participation factor, normalized, X-translation | - | −2.4946 |
| Participation factor, normalized, Y-translation | - | 7.0013 |
| Participation factor, normalized, Z-rotation | - | 1.4234 |
| Effective modal mass, X-translation Effective modal mass | kg | 6.2228 |
| Y-translation (kg) Effective modal mass | kg | 4.9018 |
| Effective modal mass, Z-rotation | kg·m | 2.0260 |
| Eigenfrequency | Hz | 4.0749 |
| Participation factor, normalized, X-translation | - | −6.9887 |
| Participation factor, normalized, Y-translation | - | −2.4954 |
| Participation factor, normalized, Z-rotation | - | 4.0343 |
| Effective modal mass, X-translation Effective modal mass | kg | 4.8841 |
| Y-translation (kg) Effective modal mass | kg | 6.2272 |
| Effective modal mass, Z-rotation | kg·m | 1.6275 |
| Eigenfrequency | Hz | 7.3261 |
| Participation factor, normalized, X-translation | - | −8.2315 |
| Participation factor, normalized, Y-translation | - | −2.1961 |
| Participation factor, normalized, Z-rotation | - | 2.4716 |
| Effective modal mass, X-translation Effective modal mass | kg | 6.7758 |
| Y-translation (kg) Effective modal mass | kg | 4.8227 |
| Effective modal mass, Z-rotation | kg·m | 6.1090 |
| Eigenfrequency | Hz | 8.7055 |
| Participation factor, normalized, X-translation | - | 1.0546 |
| Participation factor, normalized, Y-translation | - | −7.1771 |
| Participation factor, normalized, Z-rotation | - | −1.9653 |
| Effective modal mass, X-translation Effective modal mass | kg | 1.1122 |
| Y-translation (kg) Effective modal mass | kg | 5.1511 |
| Effective modal mass, Z-rotation | kg·m | 3.8625 |
| Eigenfrequency | Hz | 8.7667 |
| Participation factor, normalized, X-translation | - | −3.5058 |
| Participation factor, normalized, Y-translation | - | −4.8362 |
| Participation factor, normalized, Z-rotation | - | 4.8769 |
| Effective modal mass, X-translation Effective modal mass | kg | 1.2291 |
| Y-translation (kg) Effective modal mass | kg | 2.3389 |
| Effective modal mass, Z-rotation | kg·m | 2.3784 |
| Eigenfrequency | Hz | 1.1328 |
| Participation factor, normalized, X-translation | - | −3.9139 |
| Participation factor, normalized, Y-translation | - | 3.1356 |
| Participation factor, normalized, Z-rotation | - | −5.0336 |
| Effective modal mass, X-translation Effective modal mass | kg | 1.5319 |
| Y-translation (kg) Effective modal mass | kg | 9.8321 |
| Effective modal mass, Z-rotation | kg·m | 2.5337 |
Publisher’s Note: MDPI stays neutral with regard to jurisdictional claims in published maps and institutional affiliations. |
© 2021 by the author. Licensee MDPI, Basel, Switzerland. This article is an open access article distributed under the terms and conditions of the Creative Commons Attribution (CC BY) license (http://creativecommons.org/licenses/by/4.0/).
Share and Cite
Abdollahzadeh Jamalabadi, M.Y. Use of Nanoparticle Enhanced Phase Change Material for Cooling of Surface Acoustic Wave Sensor. Fluids 2021, 6, 31. https://doi.org/10.3390/fluids6010031
Abdollahzadeh Jamalabadi MY. Use of Nanoparticle Enhanced Phase Change Material for Cooling of Surface Acoustic Wave Sensor. Fluids. 2021; 6(1):31. https://doi.org/10.3390/fluids6010031
Chicago/Turabian StyleAbdollahzadeh Jamalabadi, Mohammad Yaghoub. 2021. "Use of Nanoparticle Enhanced Phase Change Material for Cooling of Surface Acoustic Wave Sensor" Fluids 6, no. 1: 31. https://doi.org/10.3390/fluids6010031
APA StyleAbdollahzadeh Jamalabadi, M. Y. (2021). Use of Nanoparticle Enhanced Phase Change Material for Cooling of Surface Acoustic Wave Sensor. Fluids, 6(1), 31. https://doi.org/10.3390/fluids6010031