Abstract
The Abdominal Aortic Aneurysm (AAA) is a local dilation of the abdominal aorta and it is a cause for serious concern because of the high mortality associated with its rupture. Consequently, the understanding of the phenomena related to the creation and the progression of an AAA is of crucial importance. In this work, the complicated interaction between the blood flow and the AAA wall is numerically examined using a fully coupled Fluid-Structure Interaction (FSI) method. The study investigates the possible link between the dynamic behavior of an AAA and the blood viscosity variations attributed to the haematocrit value, while it also incorporates the pulsatile blood flow, the non-Newtonian behavior of blood and the hyperelasticity of the arterial wall. It was found that blood viscosity has no significant effect on von Mises stress magnitude and distribution, whereas there is a close relation between the haematocrit value and the Wall Shear Stress (WSS) magnitude in AAAs. This WSS variation can possibly alter the mechanical properties of the arterial wall and increase its growth rate or even its rupture possibility. The relationship between haematocrit and dynamic behavior of an AAA can be helpful in designing a patient specific treatment.
1. Introduction
Abdominal Aortic Aneurysm (AAA) is a cardiovascular disorder that is a cause for serious concern worldwide. AAA is a local dilation of the abdominal aorta, mostly found in the infrarenal segment, usually over 3 cm in diameter and are most of the time reported in men aged 65 or older that are smokers [1]. This problem, like many of the problems health professionals are confronted with, calls for an interdisciplinary approach. Engineers can tackle medical problems by employing methods that are fundamental to engineering practice to comprehend and modify biological systems to assist in the diagnosis and therapy of human diseases.
Little is understood about the complete mechanism of AAA creation. Understanding the phenomena related to the creation of an AAA, progression and behavior are of crucial importance since AAA patients’ mortality appears significantly high, especially for developed countries [2]. Namely, an AAA’s rupture is lethal in up to 90% of cases [3] but rarely presents any symptoms until its occurrence [1,4] making its detection challenging. Determining AAA’s risk factors, or any factors that lead to the generation, growth and evolution of AAAs can lead to its more effective prevention or cure. The maximum aneurysm size is often picked as a rupture risk index, although many small AAAs do also rupture [5]. Stresses on the aneurismal wall are believed to be a better rupture risk index and offers better data for surgical evaluation [6,7]. Aneurysm rupture may occur when this wall stress surpasses the aneurismal wall failure strength.
Risk factors for the development or even rupture of AAAs include multiple biochemical processes occurring in parts of the aortic wall, erosion of the endothelium of the arterial wall [8], along with physiological haemodynamic abnormalities that alter the interaction of the blood flow with the arterial wall. It is accepted that cardiovascular diseases in general—and more specifically, AAAs—are affiliated with blood viscosity [9]. The current study investigates the possible link between dynamic behavior of an AAA and changes in blood viscosity due to variations of the haematocrit (), which in turn is defined as the volumetric percentage of red blood cells in blood [10]. This association between blood viscosity and AAA haemodynamics rarely appears in literature [11]. Inserting a clinical parameter in the study enables us to correlate the AAA’s behavior with a common medical index. Previous research by Kanaris et al. [12] revealed that variations of blood haematocrit can turn out to be noteworthy in haemodynamics (e.g., WSS).
In this work the complicated interaction between the blood flow and the AAA wall is numerically examined by using a fully coupled Fluid-Structure Interaction (FSI) method. It is common place that coupling the fluid dynamics component of the simulation with the solid domain simulation is essential to reach more representative results of the overall AAA behavior [13,14,15,16]. In the past, the application of CFD (without FSI) in blood flow simulation in patient-specific geometries has led to significant advances in the understanding of how the haemodynamic quantities of interest affect or are affected by the vessel wall geometry and boundary conditions [17]. Over the last decade CFD was successfully used in the simulation of blood flow, examination of potential surgical treatment options, simulation of medical devices, etc. However, CFD-only blood flow always incorporates the assumption that the blood vessel walls are rigid, which is not always a realistic approach. As vascular walls are flexible, they tend to deform due to haemodynamic forces; wall deformation would then alter the blood flow patterns, which in turn alter the fluid dynamic itself. This behavior makes the study of an AAA a purely FSI problem.
Wall Shear Stress (WSS) should also be considered when studying AAAs. WSS is a significant parameter of haemodynamics as it can alter the arterial wall properties [6]. These alterations may have great impact on the AAA wall as they can reduce its resistance and consequently accelerate its rupture [18,19]. When simulating blood flows, the importance of imposing a pulsatile boundary condition for the mass flow is proved [20] to play key part in subsequent results, especially in dynamic phenomena like AAA wall behavior.
Previous research has revealed that the non-Newtonian nature of blood shall not be ignored as it plays a great role in determining various characteristics of the flow, predominantly [12,21,22]. The present study incorporates a non-Newtonian model for blood using the Casson model [10], integrating simultaneously with the viscosity modelling the haematocrit dependency on the AAA behavior [10]. Summarizing the above, we conclude that while existing literature does consider some of the aforementioned issues, such as the following,
- the pulsatile blood flow [20],
- the non-Newtonian behavior of blood [21],
- the hyperelasticity of the arterial wall [23,24],
in most of the AAA studies, not all of them are included simultaneously.
This study incorporates all the above issues to investigate the possible link between the dynamic behavior of an abdominal aortic aneurysm (AAA) and the blood viscosity variations due to different haematocrit values. This is accomplished by using simulation tools that implement a Fluid-Structure Interaction (FSI) method. Specifically, for a typical range of haematocrit values we will numerically estimate the values of blood pressure, the equivalent stress (von Mises stress or equivalent tensile stress) of the AAA wall and the WSS.
2. Methodology
2.1. About FSI
Multiphysics simulation is a crucial tool, which attempts to accurately predict complex phenomena that will occur where multiple types of coupled physics (structure, fluid, thermal etc.) interact. It is a well-established method in product engineering, as it drives development processes and can influence engineering simulation efforts, as its strategic value is being recognized.
Those multiphysics problems are usually solved with a multi-field approach, where physics are treated each as an independent field with its own variables. Different fields “interact” by exchanging information via “interfaces”, which are special types of boundary conditions. One very well-known type of multiphysics problems is the Fluid-Structure Interaction (FSI) which occurs when a fluid interacts with a solid structure causing deformation in the structure and, as a result, altering the flow of the fluid itself. A solution based on FSI is required for biomedical flows involving compliant blood vessels and valves.
A coupled system is defined as one where physically or computationally heterogeneous mechanical components interact dynamically [17]. This system is a group of functionally related components which are forming a “collective entity”. FSI is focused on understanding the system response due to an excitation or change in boundary conditions. Different physical phenomena associated with the system components usually are nonlinear and act on different time scales and spatial domains. Consequently, each component needs to be described by appropriate theoretical models along with the inherent coupling mechanisms between different fields.
To effectively approach these types of complex systems, it is required that they are “broken-down” or partitioned. Partitioning is the process of spatial separation, “decomposition” of a discrete model into interacting components referred to as “partitions”. Decomposition is usually driven by physical or functional considerations: a physical subsystem can be the fluid—the blood—which can be approached by field equations in computational fluid dynamics (CFD) and another physical subsystem can be the blood vessel, which will be approached as a structural model. In a coupled multiphysics problem, multiple physics models or phenomena are handled simultaneously. In this case, different discretization techniques are applied on individual subdomains on different spatial domains, or individual field variables (e.g., pressure applied by blood on a vessel wall) represent different but mutually interacting physical phenomena.
2.2. Geometry
The AAA studied is positioned just below the renal bifurcation. Normal aortic diameters vary widely and are strongly influenced by several factors (e.g., gender, age etc.) [25,26]. A simplified geometry was selected as a benchmark to emulate a real-life AAA for this current parametric and methodological study. The non-affected part of the model was assumed to have a diameter of 20 mm [25,26,27]. The aortic sac was modelled asymmetrically to match representative abnormalities. The maximum aneurismal diameter was set to 55 mm, which falls in the lower threshold zone for high rupture risk and subsequently is a strong candidate for surgical treatment [28,29]. The total length of the geometry designed is L = 90 mm. ANSYS DesignModeler (ANSYS, Inc., Canonsburg, PA, USA) was used to create the simplified representation of an AAA. The AAA model geometry used in the simulations is presented in Figure 1 and Figure 2, while the geometric dimensions of the simplified AAA model are shown in Table 1.
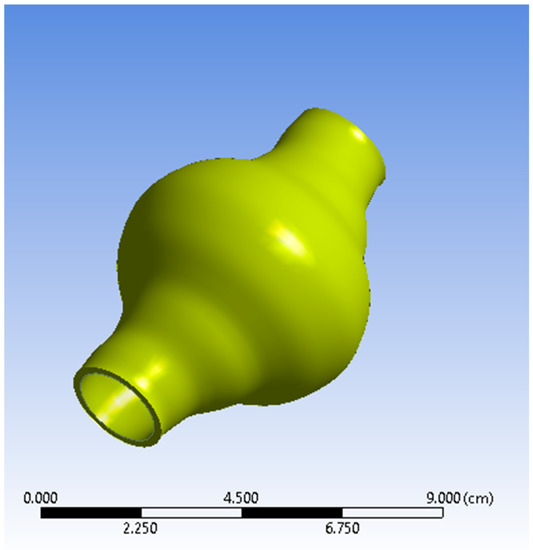
Figure 1.
View of the Abdominal Aortic Aneurysm (AAA) wall (solid domain).
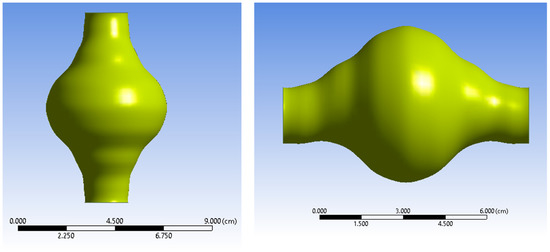
Figure 2.
Two views of the AAA fluid domain.

Table 1.
Geometrical parameters of the Abdominal Aortic Aneurysm (AAA) model.
2.3. Governing Equations and Boundary Conditions
The governing equations for the fluid flow are the Navier-Stokes equations for incompressible non-Newtonian flow. The momentum equations (Equation (1)) are expressed in the Arbitrary Lagrangian-Eulerian form (ALE) for the fluid domain [23,30]:
where is the velocity vector of the moving mesh boundary interface, is the blood density, 1050 , and the body forces per unit volume. The fluid stress tensor () is defined as Equation (2):
where is the strain rate tensor and the dynamic viscosity. The strain rate tensor is expressed via Equation (3):
and is the shear rate defined as Equation (4):
So, Equation (2) can be rewritten as follows:
Among the various proposed models for relating blood viscosity and shear rate [10], the Casson model was preferred since its constants can be expressed as a function of haematocrit, [31]. The viscosity of blood, , is modelled via Equation (6) [32]:
where is the yield stress and is the asymptotic viscosity value, characteristic for high shear rate values. The yield stress is a measure of the relative resistance of blood to the flow at very low shear rate values, caused by red blood cell aggregates [10]. It is known [10] that there is a strong correlation between blood viscosity and haematocrit (). A proposed model, which relates the aforementioned terms of Equation (6) with the value of [10], is used in this case:
where is the viscosity of blood plasma, and
is the critical haematocrit value, below which the yield stress () influence becomes insignificant. Usually, ranges between 4 and 8, whereas A is a constant that ranges between 0.6 × 10⁻⁷ and 1.2 × 10⁻⁷ Pa. In this study, the values selected for A and were 0.9 × 10⁻⁷ Pa and 6, respectively (Figure 3).
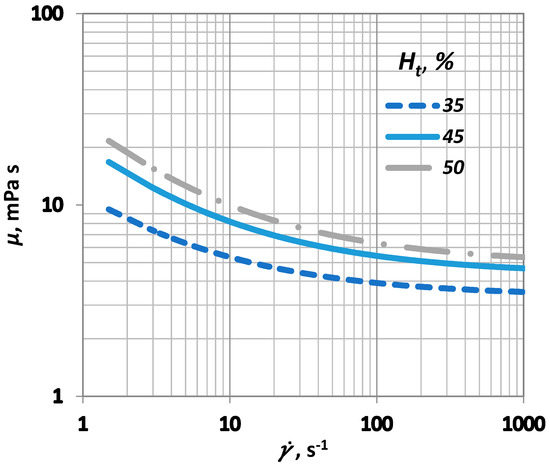
Figure 3.
Influence of shear rate () on blood viscosity () for various values.
As for the solid domain, i.e., the arterial wall, the governing equation follows the movement of the solid material on a moving coordinate system. The solid elastodynamics are described by Equation (9):
where is the stress tensor on the arterial wall, , the arterial wall force per unit volume, , the arterial wall density, 2000 and , the arterial wall local acceleration. The model used to describe the arterial wall properties was the Mooney-Rivlin model [33,34] that perceives the arterial wall as a nonlinear, isotropic and hyperelastic material using a simplified model of the strain density function (Equation (10)):
where is the strain energy, the first invariant of the left Cauchy-Green tensor and the values = 17.4 , = 188.1 were obtained from Raghavan & Vorp [35].
For boundary conditions, a pulsatile inlet was reproduced from [36] (Figure 4). Additionally, a corresponding pulsatile pressure profile was implemented at the outlet as a normal traction boundary condition (Figure 5) [36]. The heart rate period was = 1 s and the Womersley number, calculated for the inlet, was , a normal value for a human aorta in normal conditions [37]. The solid domain was fixed at the inlet and the outlet and it was assumed that this immobility does not influence the AAA wall displacement significantly. On the outer surface of the arterial wall the absolute pressure was set to atmospheric.
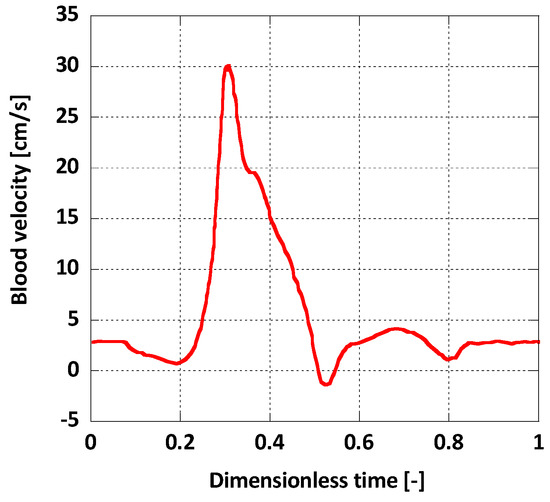
Figure 4.
Inlet boundary condition.
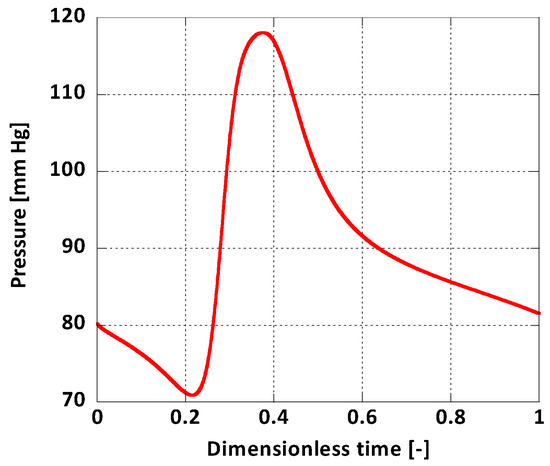
Figure 5.
Outlet boundary condition.
As for the FSI boundary conditions, it was assumed that the displacement of the interface is the same for the fluid and solid domains. For the fluid part, the interface was designated as a no-slip wall. The interaction on the surface is described by Equations (11)–(13) [38]:
where is the displacement for each domain and is the normal vector of the corresponding boundary surface, along with the corresponding subscripts w, for the arterial wall and b for the blood flow.
3. CFD Modelling
The coupled FSI simulations were performed using a commercial CFD code, the ANSYS Workbench® software (v. 19, ANSYS Inc., Canonsburg, PA, USA). More precisely, the fluid domain was solved using ANSYS CFX® and the solid domain was solved in ANSYS Mechanical. The coupling was performed by the ANSYS Workbench® coupling component. At the beginning of each time step, ANSYS CFX calculates the field variables for the fluid domain and passes the resulting pressure loads on the interface to the ANSYS Mechanical, which in turn solves the finite element model (FEM) for the solid domain. These stagger loops in the same timestep are reinitialized with the new deformed mesh that occurs from the solid deformation (Figure 6).
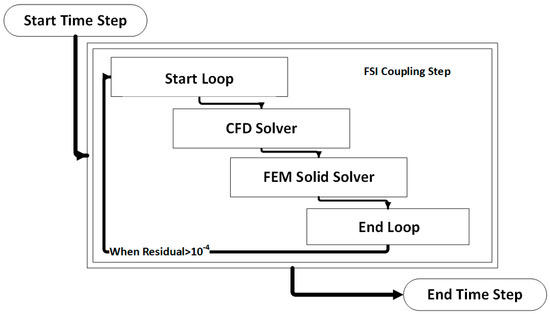
Figure 6.
Visual representation of an FSI coupling timestep.
Hexahedral elements were used for the discretization of the fluid domain shown in Figure 7. Adequate inflation was applied near the wall. The solid domain was discretized using 20-node elements suitable for hyperelastic modelling in a one-layer layout, (Figure 8) as this is common practice in similar solid mechanical models. Optimum grid density for the fluid domain was selected by performing a grid dependency study. The fluid domain was discretized in 402,800 cells.
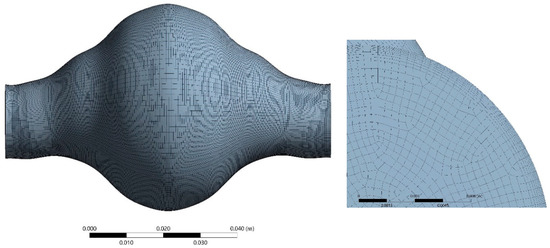
Figure 7.
Space discretization of the fluid domain.
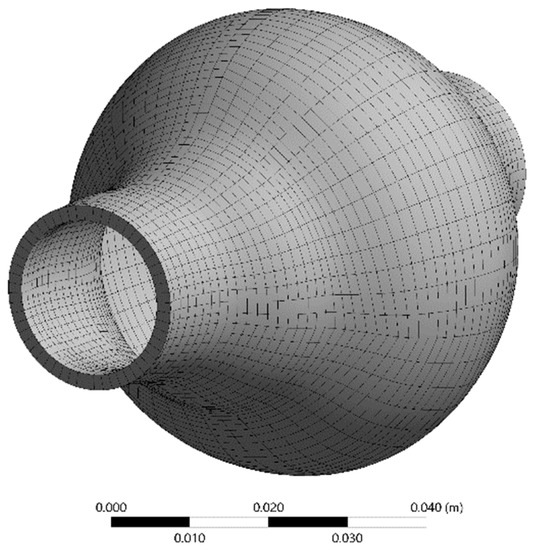
Figure 8.
Space discretization of the solid domain.
For the fluid domain, the finite volume method and a fully coupled solver for the pressure and velocity, provided by ANSYS CFX®, are used. The number of iterations ensure that mass and momentum residual values are less than 10−12, while the data transfer between the two FSI components continues until the relevant residuals reached an acceptable value (i.e., 10−4). The DNS method for laminar flow was employed for the solution, as the flow in the AAA demonstrated no turbulent characteristics (Remax = 1900) [39]. For the space and time integration, the second-order upwind and backward Euler methods were used, respectively, whereas for the solid domain a three-dimensional Finite Element Method (FEM) was employed. The physical time step () was set to a constant value, which in our case was = 0.0005 s to comply with the selected convergence criteria. All simulations were performed in a custom-made cluster for parallel computing (HPC) consisting of 32 AMD Opteron (AMD Inc., Santa Clara, CA, USA) cores and 128 GB RAM. The simulation time required for one full cardiac pulse was about 50 h.
Several values were tested. In this study, results of two extreme haematocrit values (30%, 50%) are presented and discussed.
4. Results
4.1. Blood flow in the AAA
The FSI simulations provide both qualitative and quantitative results that predict blood flow patterns in the AAA (Figure 9). Blood flow in the AAA sac gets significantly decelerated due to the enlarged diameter of the vessel. The temporal variation of blood velocity in the aneurysm follows the inlet boundary velocity profile. The maximum velocity value on the plane cutting the AAA in half at the level of the largest diameter is one order of magnitude lower than the maximum velocity at the inlet. Reverse flow and recirculation zones are present during a full pulse. The pressure distribution in the AAA is highly uniform and oscillates between the two extreme boundary values (Figure 6). The pressure drop between the two endings of the AAA is minimal (~30 Pa) for both cases.
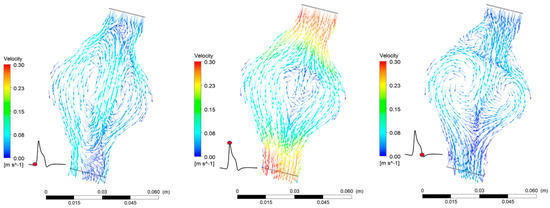
Figure 9.
Flow patterns in the AAA during one pulse for = 30%.
4.2. AAA Wall Displacement
Results revealed that total displacement of the aneurismal wall is strongly depended on location. Namely, as shown in Figure 10, displacement is bigger near the areas where diameter variations are more pronounced. Maximum displacement during one pulse occurs when t/T = 0.373. No differences appear for the total wall displacement when the results between the two cases are compared. The maximum displacement is 3.90 mm for both cases.
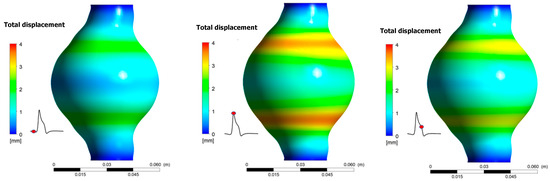
Figure 10.
Total displacement of the aneurismal wall during one pulse for Ht = 30%.
4.3. von Mises Stress () Distribution on AAA Wall
As expected, there is a strong correlation between the arterial wall displacement and the distribution of von Mises stress. Von Mises stress is a value used to predict yielding of materials under complex loading and it can be represented in an expression that uses the different components of a stress tensor. As stated in the literature [40], the von Mises stress, , can be calculated by Equation (14):
where are the principal stresses in three-dimensional problems.
It is revealed (Figure 11) that peak values appear at the area of maximum deformation of the arterial. Maximum values for both cases occur at t/T = 0.373. Peak appears in the same regions as maximum displacement appears. It was again revealed that, for the two values tested, the magnitude was not affected. For both = 30% and = 50% the peak value was 219.4 kPa. Moreover, for the areas that experience the highest stresses, nearly doubles in the course of one pulse cycle.
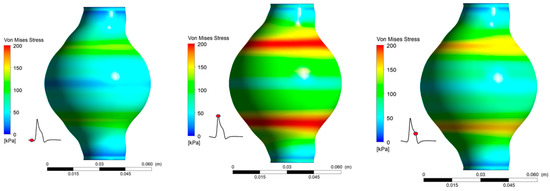
Figure 11.
von Mises Stress distribution during one pulse for Ht = 30%.
By taking the average value of on the arterial wall during one full pulse cycle, it is possible to visually compare the differences on wall dynamics caused by the change in blood viscosity due to variations (Figure 12). As deduced from Figure 12, the average is practically the same for the two cases tested.
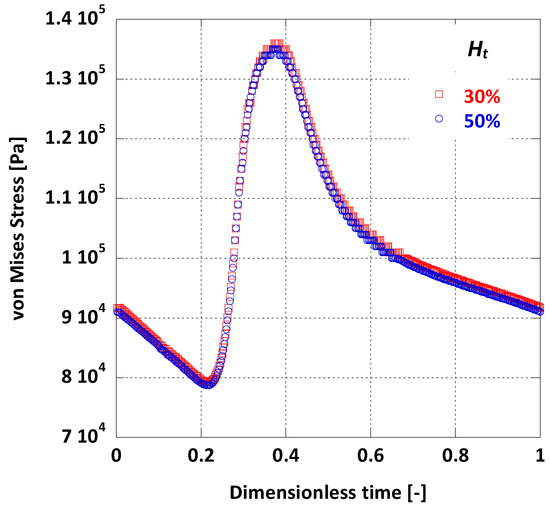
Figure 12.
Effect of Ht on the surface averaged on the AAA wall.
4.4. WSS in the AAA
WSS values vary significantly between the two cases tested and are highly influenced by both the location in the AAA and the elapsed time. It is also found that WSS depends strongly on blood viscosity, as an increase in causes an increase in calculated peak WSS value. The results show that greatly affects WSS magnitude (Figure 13). It is notable that near the AAA endings, where the aortic diameter has normal values, WSS attains values over 0.7 Pa, which may, according to [12], be in the normal range of WSS for healthy individuals. It is evident that low WSS values are caused by the relatively slow flow of the blood in the AAA. This low flow velocity appears in areas where the diameter gets larger than normal.
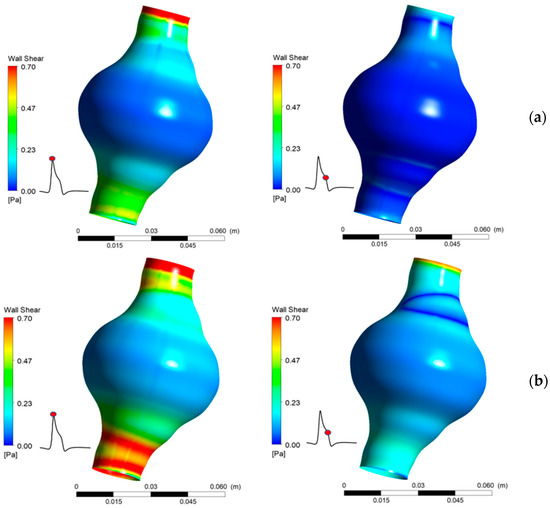
Figure 13.
Comparison of WSS for two values of Ht (a) 30%, (b) 50%.
When comparing the area averaged WSS values for the two cases (Figure 14) it is notable that there is a major difference in WSS magnitude. For the lower value the average WSS does not climb over 0.3 Pa during the whole pulse cycle, whereas for = 50%, WSS always appears remarkably higher. It is obvious that a nearly 40% decrease in haematocrit can probably cause as much as 70% decrease in WSS values. This is also evident by another risk index, the mean time-averaged WSS (TAWSS); for the AAA in this model and for = 50%, TAWSS = 0.16 Pa, while for = 30%, TAWSS drops to 0.06 Pa.
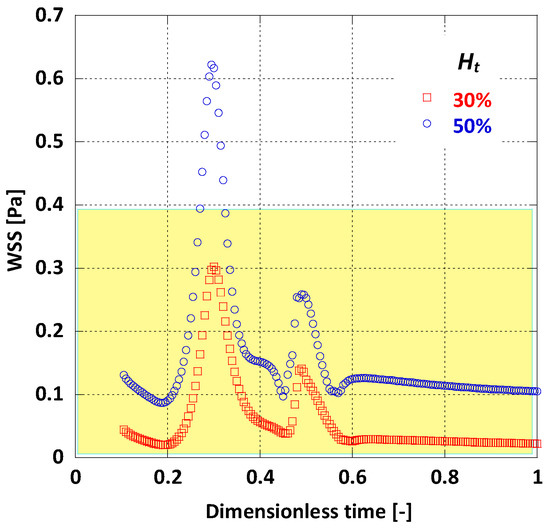
Figure 14.
Effect of Ht on the average WSS.
5. Discussion
This study proposes a possible link between haematocrit variations in blood and WSS values in AAAs.
It is reported [12,18] that WSS values less than 0.4 Pa (Figure 15) can result in plaque build-up in the arterial wall. This, in turn, can cause serious abnormalities in the arterial wall’s physical and mechanical properties, resulting in an increase of AAA’s growth rate, rise in its rupture risk, or change of its post-surgery behavior. The negative outcome of low WSS values on the arterial wall is a result of complex mechanical and biochemical phenomena, possibly linked to atherosclerosis [41,42,43,44]. More precisely, O’Leary et al. [45] imply causal relation between plaque affected areas and high rupture risk in AAAs. This interaction might be responsible for the adverse clinical situation of patients suffering from AAAs and, at the same time, have lower than normal [9].
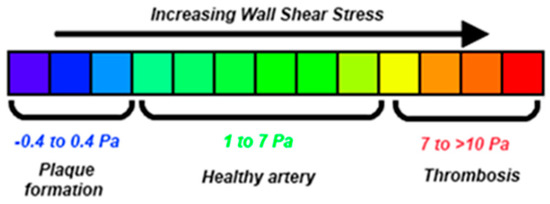
Figure 15.
Variations of WSS in human arteries [18].
This hypothesis is widely accepted in literature; namely, the mechanism of generation and progression of AAAs, and even its rupture risk can be linked to low-WSS induced alterations of the arterial wall [46,47,48,49,50].
Blood viscosity has a clear effect on WSS as depicted in the results section. Wang & Li [11] have examined the influence of blood viscosity in AAAs and their conclusions agree qualitatively with the present study.
Overall, this study presents results that are in agreement with previous work on AAAs. Namely, von Mises stress values, along with WSS in the aneurismal sac, coincide qualitatively with previous computational research [14,51]. Furthermore, a qualitative agreement exists with clinical research on AAAs regarding the total displacement of the aneurismal wall during one pulse [52].
The present study, like any computational study, includes simplifications and is bound by their limitations. Firstly, an idealized AAA shape with a single and uniform wall thickness was chosen for the sake of simplicity instead of an actual, highly asymmetric patient-specific AAA geometry. The reasoning behind this decision was to avoid introducing highly non-linear effects caused by the imperfections of a real artery, which would in turn introduce noise in the results and make drawing conclusions harder. Having said that, further research is needed to reveal the effect of patient-specific geometric irregularities (combined with the haematocrit changes) on the results of this study (i.e., WSS distribution and magnitude, von Mises stresses). As for the arterial wall modelling, a uniform, isotropic, single-layer material was used; this assumption inserts an extra limitation to the model. While this is not realistic, the introduction of more complex materials would not change the effect of Ht, only its magnitude. The effect of this limitation can get minimized by including an even more realistic arterial wall model (e.g., multi-layered approach for the arterial wall) and possibly run a Design of Experiments (DOE) set of simulations to better understand the interaction, which however is out of the scope of this work. For similar reasons, this study considers that, regardless of the values of haematocrit in blood, the pulsatile flow of remains identical, in magnitude and frequency. Moreover, the AAA was positioned at a significant distance downstream from the aortic arch so that any secondary swirling flow is considered negligible. Lastly, fixed artery inlet and outlet were considered in this model for computational simplicity; alternatively, a different boundary condition on the solid domain could be used.
6. Conclusions
This work provides a qualitative insight on the way haematocrit could affect AAA’s mechanics and haemodynamics. It takes into account the pulsatile blood flow, the non-Newtonian behavior of the blood and the hyperelasticity of the arterial wall. Coupled CFD & FEM simulations revealed that the variation in blood viscosity does not have a significant effect on AAA’s wall solid dynamics as well as on magnitude and distribution. However, our results show that there is a strong relation between value and the shear stress acting on the arterial wall. As illustrated in Figure 16, lower Ht values result in lower viscosity values and consequently in lower WSS values, which in turn promote plaque formation on the aneurismal wall. This could be one of the causal paths describing the effect of low haematocrit values on AAA morbidity.
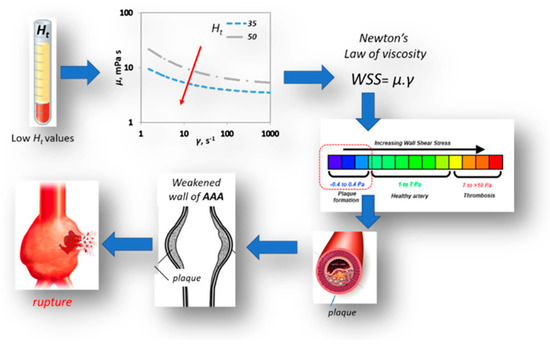
Figure 16.
Effect of Ht on AAA rupture.
Further research is needed in the investigation of the link between and the behaviour of AAAs. This FSI approach could be applied in patient specific treatment in order to offer a more robust assessment on the phenomena that may relate low with adverse AAA morbidity.
Author Contributions
S.V.P. had the initial conception of this work and organized it; Y.G.S. designed the CFD/FSI simulations acquired and analyzed the data and interpreted the results; A.G.K. has provided insights on the improvement of computational performance for the required simulations; Y.G.S., A.A.M. and S.V.P. drafted the paper; A.A.M. and S.V.P. reviewed and edited the manuscript.
Funding
This research received no external funding.
Conflicts of Interest
All authors state that there is no conflict of interest. This work is not affiliated with STFC.
Nomenclature
| A | Yield stress constant, Pa |
| C1 | Mooney-Rivlin constant 1, N/cm2 |
| C2 | Mooney-Rivlin constant 2, N/cm2 |
| Dmax | Maximum aneurismal diameter, mm |
| Di | Internal inlet AAA diameter, mm |
| d | FSI interface displacement, m |
| FSI interface velocity, m/s | |
| FSI interface acceleration, m/s2 | |
| f | Arterial wall force per volume, N/m3 |
| Ht | Haematocrit, % |
| k | Arterial wall thickness, mm |
| L | Total length of the AAA, mm |
| P | Pressure, Pa |
| Re | Reynolds number, dimensionless |
| t | Time, s |
| T | Heart rate period, s |
| u | Velocity, m/s |
| Wo | Womersley number, dimensionless |
| WSS | Wall shear stress, Pa |
| Greek letters | |
| Shear rate, s−1 | |
| Δt | Timestep, s |
| μ | Viscosity, Pa·s |
| ρ | Density, kg/m3 |
| von Mises stress, Pa | |
| τ | Shear stress, Pa |
| τy | Yield stress, Pa |
| Ψ | Strain energy density, J/m3 |
References
- Keisler, B.; Carter, C. Abdominal aortic aneurysm. Am. Fam. Physician 2015, 91, 538–543. [Google Scholar] [PubMed]
- Singh, K.; Bønaa, K.H.; Jacobsen, B.K.; Bjørk, L.; Solberg, S. Prevalence of and risk factors for abdominal aortic aneurysms in a population-based study: The Tromsø Study. Am. J. Epidemiol. 2001, 154, 236–244. [Google Scholar] [CrossRef] [PubMed]
- Assar, A.N.; Zarins, C.K. Ruptured abdominal aortic aneurysm: A surgical emergency with many clinical presentations. Postgrad. Med. J. 2009, 85, 268–273. [Google Scholar] [CrossRef] [PubMed]
- Chervu, A.; Clagett, G.P.; Valentine, R.J.; Myers, S.I.; Rossi, P.J. Role of physical examination in detection of abdominal aortic aneurysms. Surgery 1995, 117, 454–457. [Google Scholar] [CrossRef]
- Vorp, D.A. Biomechanics of abdominal aortic aneurysm. J. Biomech. 2007, 40, 1887–1902. [Google Scholar] [CrossRef] [PubMed]
- Fillinger, M.F.; Marra, S.P.; Raghavan, M.L.; Kennedy, F.E. Prediction of rupture risk in abdominal aortic aneurysm during observation: Wall stress versus diameter. J. Vasc. Surg. 2003, 37, 724–732. [Google Scholar] [CrossRef] [PubMed]
- Georgakarakos, E.; Ioannou, C.V.; Kamarianakis, Y.; Papaharilaou, Y.; Kostas, T.; Manousaki, E.; Katsamouris, A.N. The Role of Geometric Parameters in the Prediction of Abdominal Aortic Aneurysm Wall Stress. Eur. J. Vasc. Endovasc. Surg. 2010, 39, 42–48. [Google Scholar] [CrossRef] [PubMed]
- Xenos, M.; Rambhia, S.H.; Alemu, Y.; Einav, S.; Labropoulos, N.; Tassiopoulos, A.; Ricotta, J.J.; Bluestein, D. Patient-Based Abdominal Aortic Aneurysm Rupture Risk Prediction with Fluid Structure Interaction Modeling. Ann. Biomed. Eng. 2010, 38, 3323–3337. [Google Scholar] [CrossRef]
- Diehm, N.; Benenati, J.F.; Becker, G.J.; Quesada, R.; Tsoukas, A.I.; Katzen, B.T.; Kovacs, M. Anemia is associated with abdominal aortic aneurysm (AAA) size and decreased long-term survival after endovascular AAA repair. J. Vasc. Surg. 2007, 46, 676–681. [Google Scholar] [CrossRef] [PubMed]
- Errill, E.W. Rheology of blood. Physiol. Rev. 1969, 49, 863–888. [Google Scholar] [CrossRef] [PubMed]
- Wang, X.; Li, X. Computational simulation of aortic aneurysm using FSI method: Influence of blood viscosity on aneurismal dynamic behaviors. Comput. Biol. Med. 2011, 41, 812–821. [Google Scholar] [CrossRef] [PubMed]
- Kanaris, A.G.; Anastasiou, A.D.; Paras, S.V. Modeling the effect of blood viscosity on hemodynamic factors in a small bifurcated artery. Chem. Eng. Sci. 2012, 71, 202–211. [Google Scholar] [CrossRef]
- Scotti, C.M.; Shkolnik, A.D.; Muluk, S.C.; Finol, E.A. Fluid-structure interaction in abdominal aortic aneurysms: Effects of asymmetry and wall thickness. Biomed. Eng. Online 2005, 4, 64. [Google Scholar] [CrossRef] [PubMed]
- Scotti, C.M.; Jimenez, J.; Muluk, S.C.; Finol, E.A. Wall stress and flow dynamics in abdominal aortic aneurysms: Finite element analysis vs. fluid–structure interaction. Comput. Methods Biomech. Biomed. Eng. 2008, 11, 301–322. [Google Scholar] [CrossRef] [PubMed]
- Leung, J.H.; Wright, A.R.; Cheshire, N.; Crane, J.; Thom, S.A.; Hughes, A.D.; Xu, Y. Fluid structure interaction of patient specific abdominal aortic aneurysms: A comparison with solid stress models. Biomed. Eng. Online 2006, 5, 33. [Google Scholar] [CrossRef]
- Lin, S.; Han, X.; Bi, Y.; Ju, S.; Gu, L. Fluid-Structure Interaction in Abdominal Aortic Aneurysm: Effect of Modeling Techniques. BioMed. Res. Int. 2017, 2017, 7023078. [Google Scholar] [CrossRef]
- Bazilevs, Y.; Takizawa, K.; Tezduyar, T.E. Computational Fluid-Structure Interaction: Methods and Applications; John Wiley & Sons: Hoboken, NJ, USA, 2013; ISBN 978-1-118-48357-2. [Google Scholar]
- Malek, A.M.; Alper, S.L.; Izumo, S. Hemodynamic shear stress and its role in atherosclerosis. JAMA 1999, 282, 2035–2042. [Google Scholar] [CrossRef]
- Boyd, A.J.; Kuhn, D.C.S.; Lozowy, R.J.; Kulbisky, G.P. Low wall shear stress predominates at sites of abdominal aortic aneurysm rupture. J. Vasc. Surg. 2016, 63, 1613–1619. [Google Scholar] [CrossRef]
- Finol, E.A.; Amon, C.H. Blood Flow in Abdominal Aortic Aneurysms: Pulsatile Flow Hemodynamics. J. Biomech. Eng. 2001, 123, 474–484. [Google Scholar] [CrossRef]
- Khanafer, K.M.; Gadhoke, P.; Berguer, R.; Bull, J.L. Modeling pulsatile flow in aortic aneurysms: Effect of non-Newtonian properties of blood. Biorheology 2006, 43, 661–679. [Google Scholar]
- Johnston, B.M.; Johnston, P.R.; Corney, S.; Kilpatrick, D. Non-Newtonian blood flow in human right coronary arteries: Transient simulations. J. Biomech. 2006, 39, 1116–1128. [Google Scholar] [CrossRef] [PubMed]
- Mesri, Y.; Niazmand, H.; Deyranlou, A.; Sadeghi, M.R. Fluid-structure interaction in abdominal aortic aneurysms: Structural and geometrical considerations. Int. J. Mod. Phys. C 2014, 26, 1550038. [Google Scholar] [CrossRef]
- Sharzehee, M.; Khalafvand, S.S.; Han, H.-C. Fluid-structure interaction modeling of aneurysmal arteries under steady-state and pulsatile blood flow: A stability analysis. Comput. Methods Biomech. Biomed. Eng. 2018, 21, 219–231. [Google Scholar] [CrossRef] [PubMed]
- Joh, J.H.; Ahn, H.-J.; Park, H.-C. Reference diameters of the abdominal aorta and iliac arteries in the Korean population. Yonsei Med. J. 2013, 54, 48–54. [Google Scholar] [CrossRef] [PubMed]
- Syed, M.N.; Ahmad, M.M.; Ahmad, M.N.; Hussaini, S.; Muhammad, M.N.; Pir, S.H.A.; Khandheria, B.K.; Tajik, A.J.; Ammar, K.A. Normal Diameter of the Ascending Aorta in Adults: The Impact of Stricter Criteria on Selection of Subjects Free of Disease. J. Am. Coll. Cardiol. 2017, 69, 2075. [Google Scholar] [CrossRef]
- Leotta, D.F.; Paun, M.; Beach, K.W.; Kohler, T.R.; Zierler, R.E.; Strandness, D.E. Measurement of abdominal aortic aneurysms with three-dimensional ultrasound imaging: Preliminary report. J. Vasc. Surg. 2001, 33, 700–707. [Google Scholar] [CrossRef] [PubMed]
- Brown, P.M.; Zelt, D.T.; Sobolev, B. The risk of rupture in untreated aneurysms: The impact of size, gender, and expansion rate. J. Vasc. Surg. 2003, 37, 280–284. [Google Scholar] [CrossRef] [PubMed]
- Lederle, F.A.; Johnson, G.R.; Wilson, S.E.; Ballard, D.J.; William, D.; Jordan, J.; Blebea, J.; Littooy, F.N.; Freischlag, J.A.; Bandyk, D.; et al. Rupture Rate of Large Abdominal Aortic Aneurysms in Patients Refusing or Unfit for Elective Repair. JAMA 2002, 287, 2968–2972. [Google Scholar] [CrossRef]
- Janela, J.; Moura, A.; Sequeira, A. A 3D non-Newtonian fluid–structure interaction model for blood flow in arteries. J. Comput. Appl. Math. 2010, 234, 2783–2791. [Google Scholar] [CrossRef]
- Neofytou, P. Comparison of blood rheological models for physiological flow simulation. Biorheology 2004, 41, 693–714. [Google Scholar]
- Fournier, R.L. Basic Transport Phenomena in Biomedical Engineering, 3rd ed.; CRC Press: New York, NY, USA, 2011; ISBN 978-1-4398-2670-6. [Google Scholar]
- Mooney, M. A Theory of Large Elastic Deformation. J. Appl. Phys. 1940, 11, 582–592. [Google Scholar] [CrossRef]
- Rivlin, R.S. Large elastic deformations of isotropic materials IV. further developments of the general theory. Philos. Trans. R. Soc. Lond. A 1948, 241, 379–397. [Google Scholar] [CrossRef]
- Raghavan, M.L.; Vorp, D.A. Toward a biomechanical tool to evaluate rupture potential of abdominal aortic aneurysm: Identification of a finite strain constitutive model and evaluation of its applicability. J. Biomech. 2000, 33, 475–482. [Google Scholar] [CrossRef]
- Mills, C.J.; Gabe, I.T.; Gault, J.H.; Mason, D.T.; Ross, J.; Braunwald, E.; Shillingford, J.P. Pressure-flow relationships and vascular impedance in man. Cardiovasc. Res. 1970, 4, 405–417. [Google Scholar] [CrossRef] [PubMed]
- Nichols, W.W.; McDonald, D.A.; O’Rourke, M.F. McDonald’s Blood Flow in Arteries: Theoretical, Experimental and Clinical Principles, 5th ed.; Taylor & Francis: Milton Park, UK, 2005; ISBN 978-0-340-80941-9. [Google Scholar]
- Maday, Y. Analysis of coupled models for fluid-structure interaction of internal flows. In Cardiovascular Mathematics: Modeling and Simulation of the Circulatory System; Formaggia, L., Quarteroni, A., Veneziani, A., Eds.; Springer-Verlag: Mailand, Italy, 2009; ISBN 978-88-470-1152-6. [Google Scholar]
- Versteeg, H.K.; Malalasekera, W. An Introduction to Computational Fluid Dynamics: The Finite Volume Method; Pearson Education: London, UK, 2007; ISBN 978-0-13-127498-3. [Google Scholar]
- Von Mises, R. Mechanik der festen Körper im plastisch- deformablen Zustand. Nachr. Ges. Wiss. Gött. Math.-Phys. Kl. 1913, 1913, 582–592. [Google Scholar]
- Shaaban, A.M.; Duerinckx, A.J. Wall shear stress and early atherosclerosis: A review. Am. J. Roentgenol. 2000, 174, 1657–1665. [Google Scholar] [CrossRef] [PubMed]
- Cheng, C.; Tempel, D.; van Haperen, R.; van der Baan, A.; Grosveld, F.; Daemen, M.J.A.P.; Krams, R.; de Crom, R. Atherosclerotic lesion size and vulnerability are determined by patterns of fluid shear stress. Circulation 2006, 113, 2744–2753. [Google Scholar] [CrossRef]
- Hsiai, T.K.; Cho, S.K.; Honda, H.M.; Hama, S.; Navab, M.; Demer, L.L.; Ho, C.-M. Endothelial Cell Dynamics under Pulsating Flows: Significance of High Versus Low Shear Stress Slew Rates (∂τ/∂τ). Ann. Biomed. Eng. 2002, 30, 646–656. [Google Scholar] [CrossRef]
- Millon, A.; Sigovan, M.; Boussel, L.; Mathevet, J.-L.; Louzier, V.; Paquet, C.; Geloen, A.; Provost, N.; Majd, Z.; Patsouris, D.; et al. Low WSS Induces Intimal Thickening, while Large WSS Variation and Inflammation Induce Medial Thinning, in an Animal Model of Atherosclerosis. PLoS ONE 2015, 10, e0141880. [Google Scholar] [CrossRef]
- O’Leary, S.A.; Mulvihill, J.J.; Barrett, H.E.; Kavanagh, E.G.; Walsh, M.T.; McGloughlin, T.M.; Doyle, B.J. Determining the influence of calcification on the failure properties of abdominal aortic aneurysm (AAA) tissue. J. Mech. Behav. Biomed. Mater. 2015, 42, 154–167. [Google Scholar] [CrossRef]
- Chatziprodromou, I.; Tricoli, A.; Poulikakos, D.; Ventikos, Y. Haemodynamics and wall remodelling of a growing cerebral aneurysm: A computational model. J. Biomech. 2007, 40, 412–426. [Google Scholar] [CrossRef] [PubMed]
- Sheidaei, A.; Hunley, S.C.; Zeinali-Davarani, S.; Raguin, L.G.; Baek, S. Simulation of abdominal aortic aneurysm growth with updating hemodynamic loads using a realistic geometry. Med. Eng. Phys. 2011, 33, 80–88. [Google Scholar] [CrossRef]
- Reed, D.; Reed, C.; Stemmermann, G.; Hayashi, T. Are aortic aneurysms caused by atherosclerosis? Circulation 1992, 85, 205–211. [Google Scholar] [CrossRef] [PubMed]
- Boussel, L.; Rayz, V.; McCulloch, C.; Martin, A.; Acevedo-Bolton, G.; Lawton, M.; Higashida, R.; Smith, W.S.; Young, W.L.; Saloner, D. Aneurysm growth occurs at region of low wall shear stress: Patient-specific correlation of hemodynamics and growth in a longitudinal study. Stroke 2008, 39, 2997–3002. [Google Scholar] [CrossRef] [PubMed]
- Xu, C.; Zarins, C.K.; Glagov, S. Aneurysmal and occlusive atherosclerosis of the human abdominal aorta. J. Vasc. Surg. 2001, 33, 91–96. [Google Scholar] [CrossRef] [PubMed]
- Drewe, C.J.; Parker, L.P.; Kelsey, L.J.; Norman, P.E.; Powell, J.T.; Doyle, B.J. Haemodynamics and stresses in abdominal aortic aneurysms: A fluid-structure interaction study into the effect of proximal neck and iliac bifurcation angle. J. Biomech. 2017, 60, 150–156. [Google Scholar] [CrossRef]
- De Heer, L.M.; Budde, R.P.J.; Mali, W.P.T.M.; de Vos, A.M.; van Herwerden, L.A.; Kluin, J. Aortic root dimension changes during systole and diastole: Evaluation with ECG-gated multidetector row computed tomography. Int. J. Cardiovasc. Imaging 2011, 27, 1195–1204. [Google Scholar] [CrossRef]


© 2019 by the authors. Licensee MDPI, Basel, Switzerland. This article is an open access article distributed under the terms and conditions of the Creative Commons Attribution (CC BY) license (http://creativecommons.org/licenses/by/4.0/).