The Past and Present of Discharge Capacity Modeling for Spillways—A Swedish Perspective


Abstract
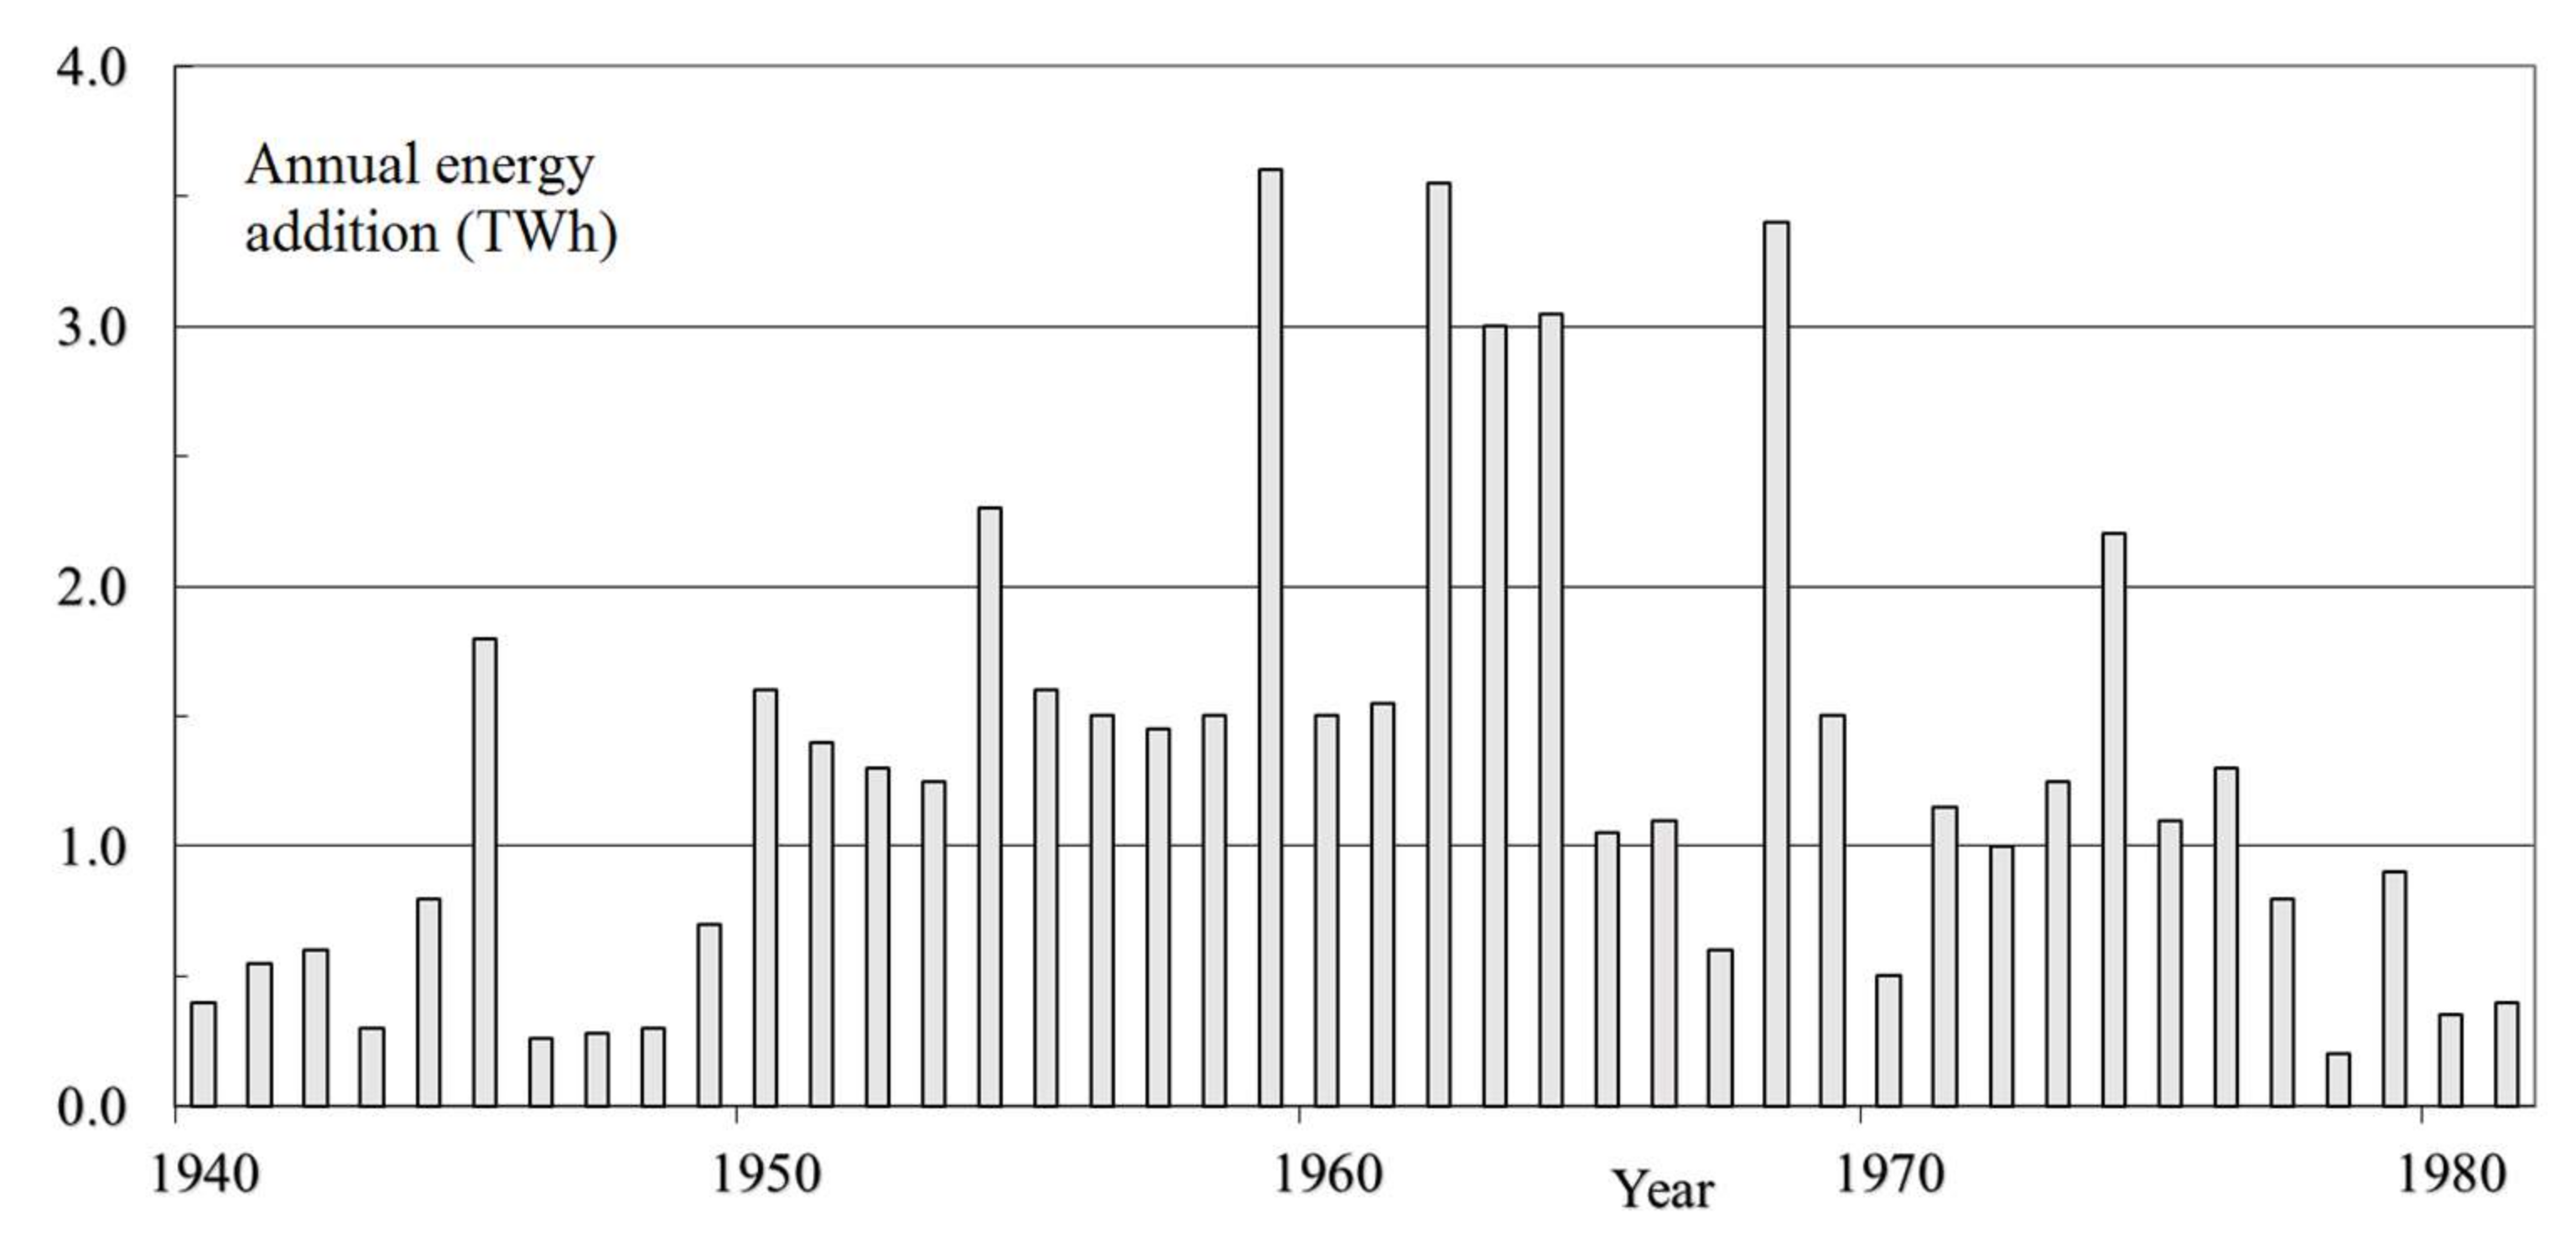
:1. Hydropower Development in Sweden
2. History of Physical Modeling of Dams in Sweden
3. Needs for Dam Refurbishment
4. Examined Spillways
5. Present versus Past Laboratory Tests
6. Source of Errors in Model Tests
6.1. Reservoir Size and Topography
6.2. Error Estimations in Model Tests
6.3. Model Scale and Other Factors
6.4. Measurements of Flow Rate
7. Numerical Modeling
7.1. Comparison between CFD and Model Tests
7.2. Sources of Errors in CFD
8. Concluding Remarks
Author Contributions
Funding
Acknowledgments
Conflicts of Interest
References
- Swedish Power Association. Hydro Power in Sweden; Svenska Kraftverksföreningen: Stockholm, Sweden, 1987. [Google Scholar]
- Flödeskommittén. Guidelines for Determination of Design Floods for Dams; Statens Vattenfallsverk, Svenska Kraftverksföreningen and SMHI: Stockholm/Norrköping, Sweden, 1990. [Google Scholar]
- Yang, J.; Dahlbäck, N.; Johansson, N. The Ajaure dam—Spillway refurbishment for increased design flood. In Proceedings of the XXIX IAHR Congress, Beijing, China, 16–21 September 2001. [Google Scholar]
- Yang, J.; Billstein, M.; Cederström, M.; Viklander, P.; Sjödin, G. Dam safety and rebuilding—A Swedish engineering perspective. In Proceedings of the International Conference on Hydropower, Kunming, China, 23–25 October 2006. [Google Scholar]
- Ekström, I.; Yang, J.; Berg, M. Improving spillway discharge safety at Bergeforsen. In Proceedings of the International Symposium on Modern Technologies & Long-term Behavior of Dams, Zhengzhou, China, 27–29 September 2011. [Google Scholar]
- CTH. Report of Hydraulic Model Tests of Spillway and Log Flume at Höljes Dam; Chalmers University of Technology (CTH): Gothenburg, Sweden, 1958. [Google Scholar]
- Stenström, P.; Yang, J.; Bond, H.; Sjödin, A.; Steiner, R. Increasing the discharge capacity at the Höljes dam in Klarälven, Sweden. In Proceedings of the 25th ICOLD Congress, Brasilia, Brazil, 25–29 May 2009. [Google Scholar]
- Stenström, P.; Yang, J.; Andersson, P.; Henriksson, G. Enlarging the undersized spillway of Höljes dam. In Proceedings of the International Symposium on Modern Technologies & Long-term Behavior of Dams, Zhengzhou, China, 27–29 September 2011. [Google Scholar]
- Yang, J.; Cederström, M. Modification of spillways for higher discharge capacity. J. Hydraul. Res. 2007, 45, 701–709. [Google Scholar]
- Flödeskommittén. Guidelines for Determination of Design Floods for Dams; Svenska kraftnät, Svensk Energi and SveMin: Stockholm, Sweden, 2015. [Google Scholar]
- Yang, J.; Cederström, M. Coping with extreme floods through dam refurbishment—A Swedish practice. In Proceedings of the 22nd ICOLD Congress, Barcelona, Spain, 18 June 2006. [Google Scholar]
- Svensk Energi. Swedish Hydropower Companies’ Guidelines for Dam Safety; Svensk Energi: Stockholm, Sweden, 2008. [Google Scholar]
- Bond, H.; Yang, J.; Cederström, M.; Halvarsson, A. Letsi dam—refurbishment for safe passage of extreme floods, hydraulic considerations. In Proceedings of the WaterPower XIII, Buffalo, NY, USA, 29–31 July 2003. [Google Scholar]
- Yang, J.; Cederström, M. Upgrading of Stornorrfors dam for safe release of extreme floods. In Proceedings of the WaterPower XIV, Austin, TX, USA, 18–22 July 2005. [Google Scholar]
- Yang, J.; Cederström, M. Gallejaur dam safety—hydraulic concerns related to spillway flood discharge. In Proceedings of the Hydrovision 2006, Portland, OR, USA, 31 July–4 August 2006. [Google Scholar]
- Yang, J.; Halvarsson, A.; Bond, H.; Cederström, M. Modification of flood discharge structure for updated design flood at Letsi dam. In Proceedings of the Dam Safety 2006, Boston, MA, USA, 10–14 September 2006. [Google Scholar]
- Ekström, I.; Yang, J.; Mörén, L.; Cederström, M. Adapting Ligga to higher design flood, spillway channel modification through physical & numerical modeling. In Proceedings of the WaterPower XV, Chattanooga, TN, USA, 23–26 July 2007. [Google Scholar]
- Yang, J.; Engström, M.; Nilsson, C.-O. Hydraulic safety of handling extreme floods of at Edensforsen dam, Sweden. In Proceedings of the HydroVision 2010, Charlotte, NC, USA, 27–30 July 2010. [Google Scholar]
- Yang, J.; Stenström, P. Ensuring spillway discharge capacity in case of reservoir floating debris. In Proceedings of the 11th International Conference Fluid Control, Measurements & Visualization, Keelung, Taiwan, 5–9 December 2011. [Google Scholar]
- Yang, J.; Ascila, R.; Nilsson, C.-O. Adding extra spillway discharge capacity, a few dam refurbishment examples in Sweden. In Proceedings of the ICOLD Symposium on Dams in Global Environmental Challenges, Bali, Indonesia, 1–6 June 2014. [Google Scholar]
- Yang, J.; Persson, J.; Moustafa, S. Upgrade of Långströmmen dam for higher safety standard. In Proceedings of the HydroVision International, Portland, OR, USA, 14–17 July 2015. [Google Scholar]
- Yang, J.; Larsson, J.; Nilsson, C.-O. Re-commissioning Storfinnforsen’s bottom outlet after over 60 years’ idling. In Proceedings of the ICOLD Symposium of the 84th Annual Meeting, Johannesburg, South Africa, 15–20 May 2016. [Google Scholar]
- Chadwick, A.; Morfett, J. Hydraulics in Civil and Environmental Engineering; E & FN Spon: London, UK, 1993. [Google Scholar]
- Heller, V. Scale effects in physical hydraulic engineering models. J. Hydraul. Res. 2011, 49, 293–306. [Google Scholar] [CrossRef]
- Teng, P.H.; Yang, J. CFD modelling of two-phase flow of a spillway chute aerator of large width. J. Appl. Water Eng. Res. 2016, 4, 163–177. [Google Scholar] [CrossRef]
- Yang, J.; Teng, P.H.; Xie, Q.C. Modelling of air demand of a spillway aerator with two-phase flow models. In Proceedings of the 2nd International Symposium on Hydraulic Modelling and Measuring Technology, Nanjing, China, 30 May–1 June 2018. [Google Scholar]
- Yang, J.; Liu, T.; Dai, W.H.; Teng, P.H. Transient water-air flow and air demand following an opening outlet gate. Model. Simul. Eng. 2018, 3194935. [Google Scholar] [CrossRef]
- Teng, P.H.; Yang, J. Modeling and prototype testing of flows over flip-bucket aerators. J. Hydraul. Eng. 2018, 144, 04018069. [Google Scholar] [CrossRef]
- Andersson, A.G.; Andreasson, P.; Lundström, T.S. CFD-modelling and validation of free surface flow during spilling of reservoir in down-scale model. Eng. Appl. Comput. Fluid Mech. 2013, 7, 159–167. [Google Scholar] [CrossRef]
- Yang, J. Investigations at Vatnsfell. Int. Water Power Dam Constr. 2007, 59, 28–36. [Google Scholar]
- Margeirsson, B. Computational modeling of flow over a spillway in Vatnsfellsstífla dam in Iceland. Master’s Thesis, Chalmers University of Technology, Gothenburg, Sweden, 2007. [Google Scholar]
- Celik, I.B.; Ghia, U.; Roache, P.J. Procedure for estimation and reporting of uncertainty due to discretization in CFD applications. J. Fluids Eng. Trans. ASME 2008, 130, 078001. [Google Scholar]
- Aydin, M.C.; Ozturk, M. Verification and validation of a computational fluid dynamics (CFD) model for air entrainment at spillway aerators. Can. J. Civil Eng. 2009, 36, 826–836. [Google Scholar] [CrossRef]
- Savage, B.M.; Johnson, M.C. Flow over ogee spillway: Physical and numerical model case study. J. Hydraul. Eng. 2001, 127, 640–649. [Google Scholar] [CrossRef]
- Pelletier, D. Verification, validation, and uncertainty in computational fluids. Can. J. Civil Eng. 2010, 37, 1003–1013. [Google Scholar] [CrossRef]
- Jothiprakash, V.; Bhosekar, V.V.; Deolalikar, P.B. Flow characteristics of orifice spillway aerator: Numerical model studies. ISH J. Hydraul. Eng. 2015, 21, 216–230. [Google Scholar] [CrossRef]
- ANSYS Inc. ANSYS FLUENT Theory Guide; ANSYS Inc.: Canonsburg, PA, USA, 2011. [Google Scholar]
- Zhang, X.D. Three-Dimensional Numerical Simulations of High-Velocity Flow in Spillway Tunnels. Ph.D. Thesis, China Institute of Water Resources and Hydropower Research (IWHR), Beijing, China, 2004. [Google Scholar]
- Valero, D.; Viti, N.; Gualtieri, C. Numerical simulation of hydraulic jumps. Part 1: Experimental results for performance assessment. Water 2019, 11, 36. [Google Scholar] [CrossRef]
- Viti, N.; Valero, D.; Gualtieri, C. Numerical simulation of hydraulic jumps. Part 2: Recent results and future outlook. Water 2019, 11, 28. [Google Scholar] [CrossRef]
- ERCOFTAC. Best Practice Guidelines, Industrial Computational Fluid Dynamics of Single-Phase Flows; ERCOFTAC: London, UK, 2000; ISBN 978-0-9955779-2-3. [Google Scholar]
- ERCOFTAC. Best Practice Guidelines, Computational Fluid Dynamics of Dispersed Multi-Phase Flows; ERCOFTAC: London, UK, 2007; ISBN 978-0-9955779-1-6. [Google Scholar]
- Blocken, B.; Gualtieri, C. Ten iterative steps for model development and evaluation applied to Computational Fluid Dynamics for Environmental Fluid Mechanics. Environ. Model. Softw. 2012, 33, 1–22. [Google Scholar] [CrossRef]
- Chanson, H. Energy Dissipation in Hydraulic Structures; Taylor & Francis Group CRC Press: London, UK, 2015; ISBN 978-1-138-02755-8. [Google Scholar]
- Damion, R. CFD Modelling of Dam Spillway Aerator. Master’s Thesis, Lund University, Lund, Sweden, 2015. [Google Scholar]
- Valero, D.; García-Bartual, R. Calibration of an air entrainment model for CFD spillway applications. In Advances in Hydroinformatics; Gourbesville, P., Cunge, J., Caignaert, G., Eds.; Springer: Singapore, 2016; pp. 571–582. ISBN 978-981-287-614-0. [Google Scholar]
- Bayon, A.; Toro, J.P.; Bombardelli, F.A.; Matos, J.; López-Jiménez, P.A. Influence of VOF technique, turbulence model and discretization scheme on the numerical simulation of the non-aerated, skimming flow in stepped spillways. J. Hydro-Environ. Res. 2017, 19, 137–149. [Google Scholar] [CrossRef]
- Wang, H.; Li, R.; Gualtieri, C.; Yang, H.X.; Feng, J.J. Numerical simulation of hydrodynamics and reaeration over a stepped spillway by the SPH method. Water 2017, 9, 565. [Google Scholar]
- Valero, D.; Bung, D.B.; Crookston, B.M. Energy dissipation of a type III basin under design and adverse conditions for stepped and smooth spillways. J. Hydraul. Eng. 2018, 144, 04018036. [Google Scholar] [CrossRef]
- Yang, J.; Teng, P.H.; Zhang, H.W. Experiments and CFD modelling of high-velocity two-phase flow in a large chute aerator facility. Eng. Appl. Comput. Fluid Mech. 2019, 13, 48–66. [Google Scholar]


| No. | River Name | Dam Name | Dam Type | Year of Completion | Z (m) | Q0 (m3/s) | ξ (%) |
|---|---|---|---|---|---|---|---|
| 1 | Ume älv | Ajaure | R | 1967 | 45 | 950 | 40 |
| 2 | Stornorrfors | Bu/R | 1958 | 20 | 3300 | 35 | |
| 3 | Rusfors | E | 1962 | 22 | 1625 | 27 | |
| 4 | Indalsälven | Midskog | G/E | 1944 | 27 | 2300 | 35 |
| 5 | Bergeforsen | E | 1955 | 29 | 2300 | 45 | |
| 6 | Ångermanälven | Stenkullafors | E | 1983 | 30 | 1250 | 40 |
| 7 | Edensforsen | E | 1956 | 19 | 1400 | >40 | |
| 8 | Skellefte älv | Gallejaur | R/E | 1964 | 55 | 700 | 20 |
| 9 | Klarälven | Höljes | R/E | 1961 | 80 | 1600 | >25 |
| 10 | Ljusnan | Långströmmen | R/E | 1961 | 28 | 1670 | 50 |
| 11 | Halvfari | E/Bu | 1978 | 43 | 650 | 100 | |
| 12 | Lule älv | Letsi | R | 1967 | 85 | 1500 | 25 |
| 13 | Porsi | E | 1962 | 40 | 2700 | 15 | |
| 14 | Vittjärv | G | 1974 | 15 | 2200 | 50 | |
| 15 | Boden | E | 1971 | 21 | 2800 | 20 |
| No. | Dam Name | Year of Completion | Z (m) | No. of Openings | B (m) | H (m) |
|---|---|---|---|---|---|---|
| 1 | Bergeforsen existing spillway | 1955 | 35 | 3 | 45 | 9.25 |
| 2 | Bergeforsen new spillway | 2014 | 35 | 1 | 15 | 10.25 |
| 3 | Boden | 1971 | 21 | 3 | 45 | 10.94 |
| 4 | Edensforsen | 1956 | 19 | 4 | 58.22 | 4.00–7.70 |
| 5 | Gallejur | 1965 | 15 | 2 | 24 | 6.40 |
| 6 | Halvfari | 1978 | 43 | 2 | 12 | 10.00 |
| 7 | Harsprånget | 1952 | 50 | 3 | 60 | 7.60 |
| 8 | Höljes | 1961 | 80 | 2 | 28 | 8.70 |
| 9 | Laxede | 1962 | 24 | 3 | 45 | 10.44 |
| 10 | Letsi | 1967 | 85 | 2 | 30 | 9.70 |
| 11 | Ligga | 1954 | 35 | 3 | 60 | 7.61 |
| 12 | Långbjörn | 1960 | 30 | 3 | 45 | 7.00 |
| 13 | Långströmmen new spillway | 2018 | 28 | 1 | 18 | 6.55 |
| 14 | Midskog | 1944 | 27 | 4 | 58 | 6.25 |
| 15 | Porsi | 1962 | 40 | 3 | 45 | 10.40 |
| 16 | Torpshammar | 1943 | 25 | 2 | 12 | 3.50 |
| 17 | Stenkullafors | 1983 | 30 | 2 | 20 | 10.00 |
| 18 | Stornorrfors | 1958 | 25 | 3 | 57 | 9.60 |
| 19 | Vatnsfell (Iceland) | 2000 | 30 | 1 | 50 | 2.10 |
| No. | Dam Name | Year of Completion | Z (m) | No. of Openings | a (m) | b (m) | H1 (m) |
|---|---|---|---|---|---|---|---|
| 1 | Ajaure | 1967 | 45 | 2 | 10.40 | 10.00 | 16.00 |
| 2 | Satisjaure | 1966 | 30 | 2 | 6.50 | 8.00 | 23.00 |
| 3 | Storfinnforsen | 1953 | 39 | 1 | 3.65 | 5.50 | 37.00 |
| 4 | Torpshammar | 1943 | 25 | 2 | 2.50 | 12.00 | 18.60 |
| Dam Name | Past Model Study | Present Model Study | α (%) | |||
|---|---|---|---|---|---|---|
| Year | Qpast (m3/s) | Year | λ | Qpresent (m3/s) | ||
| Ajaure | 1967 | 1020 | 2000 | 50 | 935 | −8.3 |
| Bergeforsen existing spillway | 1955 | 2300 | 1998 | 50 | 2400 | 4.3 |
| Boden | 1971 | 2760 | 2010 | 50 | 2595 | −6.0 |
| Edensforsen | - | 1350 | 2010 | 50 | 1410 | 4.4 |
| Gallejaur | 1962 | 724 | 2004 | 40 | 720 | −0.6 |
| Halvfari | - | 675 | 2007 | 40 | 650 | −3.7 |
| Harsprånget | 1980 | 2340 | 2003 | 60 | 2600 | 11.1 |
| Höljes | 1958 | 1160 | 2008 | 50 | 1290 | 11.2 |
| Laxede | 1962 | 2615 | 2007 | 60 | 2825 | 8.0 |
| Letsi | 1967 | 1555 | 2002 | 50 | 1525 | −1.9 |
| Ligga | 1980 | 2339 | 2005 | 50 | 2225 | −4.9 |
| Långbjörn | 1986 | 1554 | 2006 | 100 | 1585 | 2.0 |
| Midskog | 1942 | 2305 | 2002 | 50 | 2305 | 0 |
| 1992 | 2375 | −2.9 | ||||
| Porsi | 1961 | 2680 | 2002 | 50 | 2777 | 3.6 |
| Satisjaure | 1962 | 810 | 2003 | 50 | 790 | −2.5 |
| Stenkullafors | 1975 | 1240 | 2003 | 50 | 1250 | 0.8 |
| Storfinnforsen | 1950 | 453 | 2008 | 30 | 449 | −1.0 |
| Stornorrfors | 1950s | 3200 | 2003 | 100 | 3275 | 2.3 |
| Dam Name | Physical Model Tests | CFD Simulations | β (%) | ||
|---|---|---|---|---|---|
| Year | Qmodel (m3/s) | Year | Qcfd (m3/s) | ||
| Bergeforsen (new spillway) | 2010 | 1512 | 2016 | 1505 | −0.5 |
| Höljes | 2008 | 1678 | 2013 | 1715 | 2.2 |
| Gallejaur | 1962 | 724 | 2017 | 720 | −0.6 |
| 2004 | 720 | 0 | |||
| Långströmmen | 2015 | 475 | 2015 | 485 | 2.1 |
| Rusfors | 1962 | 1625 | 2016 | 1598 | −1.7 |
| Storfinnforsen | 1950 | 453 | 2015 | 436 | −3.8 |
| 2008 | 449 | 2.9 | |||
| Torpshammar (2 surface gates) | 2017–2018 | 135 | 2018 | 128 | −3.7 |
| Torpshammar (2 bottom outlets) | 485 | 494 | 1.9 | ||
| Torpshammar (all gates) | 605 | 607 | 0.3 | ||
| Vatnsfell (Iceland) | 1999 | 350 | 2007 | 347 | −1.0 |
| Gate Opening (m) | Qmodel (m3/s) | Qcfd (m3/s) | β (%) |
|---|---|---|---|
| 1.00 | 106 | 108 | 1.9 |
| 2.00 | 200 | 203 | 1.5 |
| 3.00 | 306 | 310 | 1.3 |
| 3.65 | 449 | 436 | −2.9 |
© 2019 by the authors. Licensee MDPI, Basel, Switzerland. This article is an open access article distributed under the terms and conditions of the Creative Commons Attribution (CC BY) license (http://creativecommons.org/licenses/by/4.0/).
Share and Cite
Yang, J.; Andreasson, P.; Teng, P.; Xie, Q. The Past and Present of Discharge Capacity Modeling for Spillways—A Swedish Perspective. Fluids 2019, 4, 10. https://doi.org/10.3390/fluids4010010
Yang J, Andreasson P, Teng P, Xie Q. The Past and Present of Discharge Capacity Modeling for Spillways—A Swedish Perspective. Fluids. 2019; 4(1):10. https://doi.org/10.3390/fluids4010010
Chicago/Turabian StyleYang, James, Patrik Andreasson, Penghua Teng, and Qiancheng Xie. 2019. "The Past and Present of Discharge Capacity Modeling for Spillways—A Swedish Perspective" Fluids 4, no. 1: 10. https://doi.org/10.3390/fluids4010010
APA StyleYang, J., Andreasson, P., Teng, P., & Xie, Q. (2019). The Past and Present of Discharge Capacity Modeling for Spillways—A Swedish Perspective. Fluids, 4(1), 10. https://doi.org/10.3390/fluids4010010