1. Introduction
The condition assessment of high-voltage insulation is a critical component of power system maintenance and reliability management. Degradation of external insulation may lead to partial discharges, flashovers, equipment failures, and interruptions in power supply. Early detection of insulation-related defects is therefore an important prerequisite for condition-based maintenance and risk-informed operation of power infrastructure [
1,
2,
3].
Recent advances in computer vision, machine learning, and robotic inspection systems have significantly increased interest in automated analysis of visual inspection data acquired at power facilities [
4,
5]. In practical inspection workflows, images are used to localize equipment components, identify potentially hazardous conditions, and support maintenance decision-making. As a result, publicly available datasets have become an essential resource for developing, validating, and objectively comparing automated recognition algorithms.
In recent years, several open datasets have been published for insulator detection, segmentation, and defect recognition tasks (
Table 1). Most existing datasets focus on overhead transmission lines and are primarily acquired using unmanned aerial vehicles (UAVs), helicopters, or synthetic simulation environments [
6,
7,
8,
9,
10,
11,
12,
13,
14]. These datasets have significantly contributed to the development of automated insulator recognition methods; however, they are typically characterized by relatively sparse scenes, limited background complexity, and observation conditions that differ substantially from those encountered in power substations.
Only a limited number of publicly available datasets provide pixel-level annotations suitable for instance segmentation tasks. However, these datasets are generally designed for different application scenarios. TTPLA [
11] focuses on the segmentation of transmission towers and power lines rather than insulator strings as independent objects. SYNTHIDIA [
12] provides pixel-level annotations for insulator defect recognition but is entirely synthetic and therefore does not capture the visual complexity of real industrial environments. The Electrical Isolators Image Dataset [
13] contains real inspection images; however, it is focused on distribution networks, where both equipment configurations and visual characteristics differ substantially from those encountered at high-voltage substations.
Furthermore, the majority of existing datasets are based on aerial imagery acquired from UAVs or helicopters. Such datasets predominantly represent overhead transmission-line environments and typically contain comparatively sparse scenes with lower object density and simpler background structures. As a result, they provide limited coverage of the visual conditions encountered during ground-based robotic inspections of substations.
From a computer vision perspective, high-voltage substations represent a distinct visual domain that differs substantially from overhead transmission-line environments. A single image may contain numerous equipment components, support structures, conductors, disconnectors, transformers, and auxiliary devices exhibiting similar geometric and visual characteristics. Under such conditions, insulator strings often occupy only a small fraction of the image area, may be observed from different viewpoints, and are frequently partially occluded by surrounding equipment. In addition, substation scenes are characterized by high object density, strong background heterogeneity, and complex spatial relationships between objects, all of which increase the difficulty of automated detection and segmentation tasks.
The relevance of automated insulation inspection is further increasing in modern power systems with a growing share of power-electronic equipment, including HVDC converter stations, FACTS devices, and high-power inverter-based systems [
15]. Power-electronic switching processes may contribute to harmonic distortion and increased electrical stress on insulation systems, while insulation failures and flashovers may generate overvoltages that threaten sensitive semiconductor components. In this context, automated visual inspection datasets such as UVInsDet can support asset management and condition monitoring in substations where reliable insulation performance is essential for both conventional and power-electronic equipment.
In smart energy infrastructures, visual inspection data should also be considered within the broader context of predictive maintenance. Modern diagnostic systems increasingly move from isolated fault classification toward proactive condition assessment, where visual observations are integrated with heterogeneous data sources, including infrared thermography, ultraviolet discharge measurements, electrical signals, power-quality indicators, and operational metadata. Recent studies demonstrate that multimodal diagnostic frameworks can correlate localized physical anomalies with electrical indicators of equipment degradation and operational losses, thereby supporting predictive maintenance planning rather than only post-fault classification [
16]. In this context, datasets such as UVInsDet provide a visual recognition layer that can support future multimodal diagnostic systems for power infrastructure by enabling reliable localization of insulation components in complex substation scenes.
At the same time, the increasing adoption of ground-based robotic inspection systems creates a growing demand for datasets that reflect realistic operational conditions in substations. Unlike UAV-based inspection platforms, ground robots acquire images from lower viewpoints and under observation geometries that are more strongly influenced by surrounding equipment, occlusions, and background complexity. Consequently, the visual characteristics of robotic inspection imagery differ substantially from those represented in most existing insulator datasets, highlighting the need for dedicated datasets reflecting this operational domain and enabling the development and evaluation of methods specifically designed for substation inspection scenarios.
To address this gap, we present UVInsDet, a real-world dataset for insulator-string detection and instance segmentation collected during robotic inspection campaigns at an operational 220 kV high-voltage substation. The aim of this work is to provide an openly available dataset for insulator-string detection and instance segmentation in real-world high-voltage substation environments and to support the development and objective evaluation of computer vision methods for robotic power-system inspection.
The dataset was acquired using the visible channel of a narrow-angle ultraviolet inspection camera mounted on an unmanned ground-based robotic platform [
17]. The images capture realistic inspection conditions characterized by dense industrial backgrounds, varying illumination, partial occlusions, substantial object-scale variation, and both positive and negative inspection scenarios.
The dataset contains 591 images with 1415 manually annotated insulator-string instances represented by pixel-wise instance segmentation masks. Two classes of insulator strings are included: glass and porcelain. Each insulator string is annotated as a single object instance, reflecting its interpretation in practical inspection and diagnostic workflows. The dataset also includes images without target objects, enabling the development and evaluation of models that are robust to false detections.
The images cover daytime and nighttime inspections, varying weather conditions, and a range of viewing distances and observation angles. Because image acquisition was performed using narrow-angle optics typical of industrial inspection systems, many target objects occupy only a small fraction of the image area. Consequently, the dataset presents additional challenges associated with small-object detection and instance segmentation under realistic operational conditions.
Beyond conventional detection and segmentation tasks, UVInsDet can support research on small-object recognition, robust visual recognition under changing observation conditions, domain adaptation, and the development of intelligent monitoring and inspection systems for power infrastructure. The dataset may also serve as a visual component within future multimodal diagnostic frameworks integrating visible, ultraviolet, infrared, or other inspection modalities. By providing annotations in both LabelMe and COCO formats, UVInsDet offers a reusable resource for the development and evaluation of computer vision methods in robotic inspection of high-voltage substations.
2. Materials and Methods
2.1. Data Acquisition and Imaging Conditions
The images included in the UVInsDet dataset were acquired during routine robotic inspection campaigns conducted at an operational 220 kV high-voltage substation using the MAD (Multi-Spectral Automatic Diagnostic) robot, an unmanned ground-based inspection platform described in detail in [
5,
17]. The platform is a four-wheeled unmanned ground vehicle equipped with a GNSS RTK/IMU-based navigation system running on the open-source ArduRover framework (v.4.5.4) and designed for autonomous inspection of power equipment.
The sensor payload of the robot includes an Ofil Rail HD ultraviolet inspection camera (Ofil Ltd., Ness Ziona, Israel) and a GIT UR-640M infrared/RGB camera (KARNEEV SYSTEMS, Moscow, Russia) mounted on a motorized pan-and-tilt unit [
17]. For the present dataset, image acquisition was performed using only the visible-spectrum RGB channel of the Ofil Rail HD camera. The camera is equipped with a narrow-angle optical system with a field of view of 8 × 4°, which is typical for long-range inspection of substation equipment [
5].
The camera provides data in video format, where ultraviolet discharge events are visualized by colored pixel overlays on the RGB channel when a radiation threshold is exceeded. To obtain pure visible-spectrum images, the recorded video sequences were temporally averaged over 2–5 s at 30 frames per second, effectively suppressing ultraviolet overlays in the resulting RGB images.
Image acquisition was performed using automatic focusing. The spatial resolution of the images is 1280 × 720 pixels, and the files are stored in JPEG format with a color depth of 8 bits per channel. The camera was mounted at an approximate height of 1.5 m above ground level. During inspection, the robot autonomously moved between predefined inspection positions; image acquisition was performed after the robot reached an inspection point, stopped, and completed the camera-targeting procedure. Therefore, the images included in the dataset were not captured while the mobile platform was in motion.
The annotated objects correspond to standard suspension insulator strings composed of cap-and-pin units with a nominal disk diameter of 255 mm. Together with the broad range of acquisition distances, this contributes to substantial variation in object scale and makes the dataset representative of practical robotic inspection scenarios.
The dataset covers a range of illumination conditions, including daytime and nighttime acquisition with artificial lighting. Although weather conditions were not explicitly annotated and are therefore unavailable as structured metadata, the dataset includes images acquired under different environmental conditions, including clear weather, overcast conditions, and light snowfall.
All images were acquired under normal substation operating conditions without artificial simplification of the scene and therefore contain dense arrangements of equipment components, metal structures, and current-carrying parts.
2.2. Data Preparation and Image Selection
The initial image collection was formed from raw data acquired during inspection campaigns. During dataset preparation, images suitable for subsequent annotation were selected. Frames exhibiting pronounced motion blur, critical exposure defects, or other artifacts that hinder visual analysis were excluded. At the same time, images containing partial object occlusions, complex backgrounds, and challenging illumination conditions were retained, as they reflect realistic inspection scenarios and are of practical relevance for computer vision tasks.
All data underwent an anonymization procedure to prevent identification of specific power infrastructure facilities. Images containing any identifying information, such as logos or informational signage, were excluded. The dataset does not contain images of people or any personal data.
The dataset includes images both with and without target objects. Retaining images without insulator strings enables training and evaluation of models that are robust to false detections and corresponds to the natural distribution of scenes encountered during real-world inspections.
2.3. Annotation Protocol
Data annotation was performed manually using the open-source LabelMe tool (v.5.10.0) [
18]. The target object of annotation was defined as an insulator string, with each string annotated as a single instance, regardless of the number of individual insulator units it comprises. For each object, a polygon was created to produce a pixel-wise instance segmentation mask corresponding to the visible portion of the insulator string in the image.
The instance annotations provided in the dataset represent object-level masks of insulator strings and are intended to capture the overall spatial extent of each object rather than the pixel-perfect boundaries of individual insulator elements.
In cases where an insulator string was partially occluded by other objects, only the visible, non-occluded part of the string was annotated. Fully hidden or substantially occluded fragments were not included in the mask. Post insulators and other types of insulating elements were not considered target objects and were therefore not annotated.
Annotation was carried out by two specialists with domain expertise in electric power engineering who had direct on-site experience at the substation and thus observed the target objects not only in images but also in their real operational context. To ensure annotation consistency, the annotators were provided with examples of correct annotations and visual guidelines illustrating mask boundaries and rules for handling partially visible objects. Each image subsequently underwent independent review by another specialist who did not participate in the initial annotation. In cases of disagreement or ambiguity, annotations were revised until a consensus was reached.
2.4. Inter-Annotator Agreement Protocol
To quantitatively assess annotation consistency, an inter-annotator agreement analysis was performed on a randomly selected subset comprising approximately 25% of the entire dataset. Because the subset was selected using random sampling, it naturally included images acquired under different inspection conditions, including challenging scenes with small objects, partial occlusions, dense industrial backgrounds, and varying illumination. Owing to the severe class imbalance of the dataset, the subset also contained approximately 25% of all available porcelain insulator instances.
2.5. Classes and Annotation Structure
The dataset includes two classes of target objects: glass insulator strings and porcelain insulator strings.
The primary annotation format consists of JSON files organized according to the training and test splits of the dataset. In addition, annotations are provided in the COCO format, obtained by converting the original LabelMe annotation files. The dataset includes the conversion script as well as checksum files to enable verification of the conversion process. Separate COCO annotation files are provided for the training and test subsets.
2.6. Dataset Split
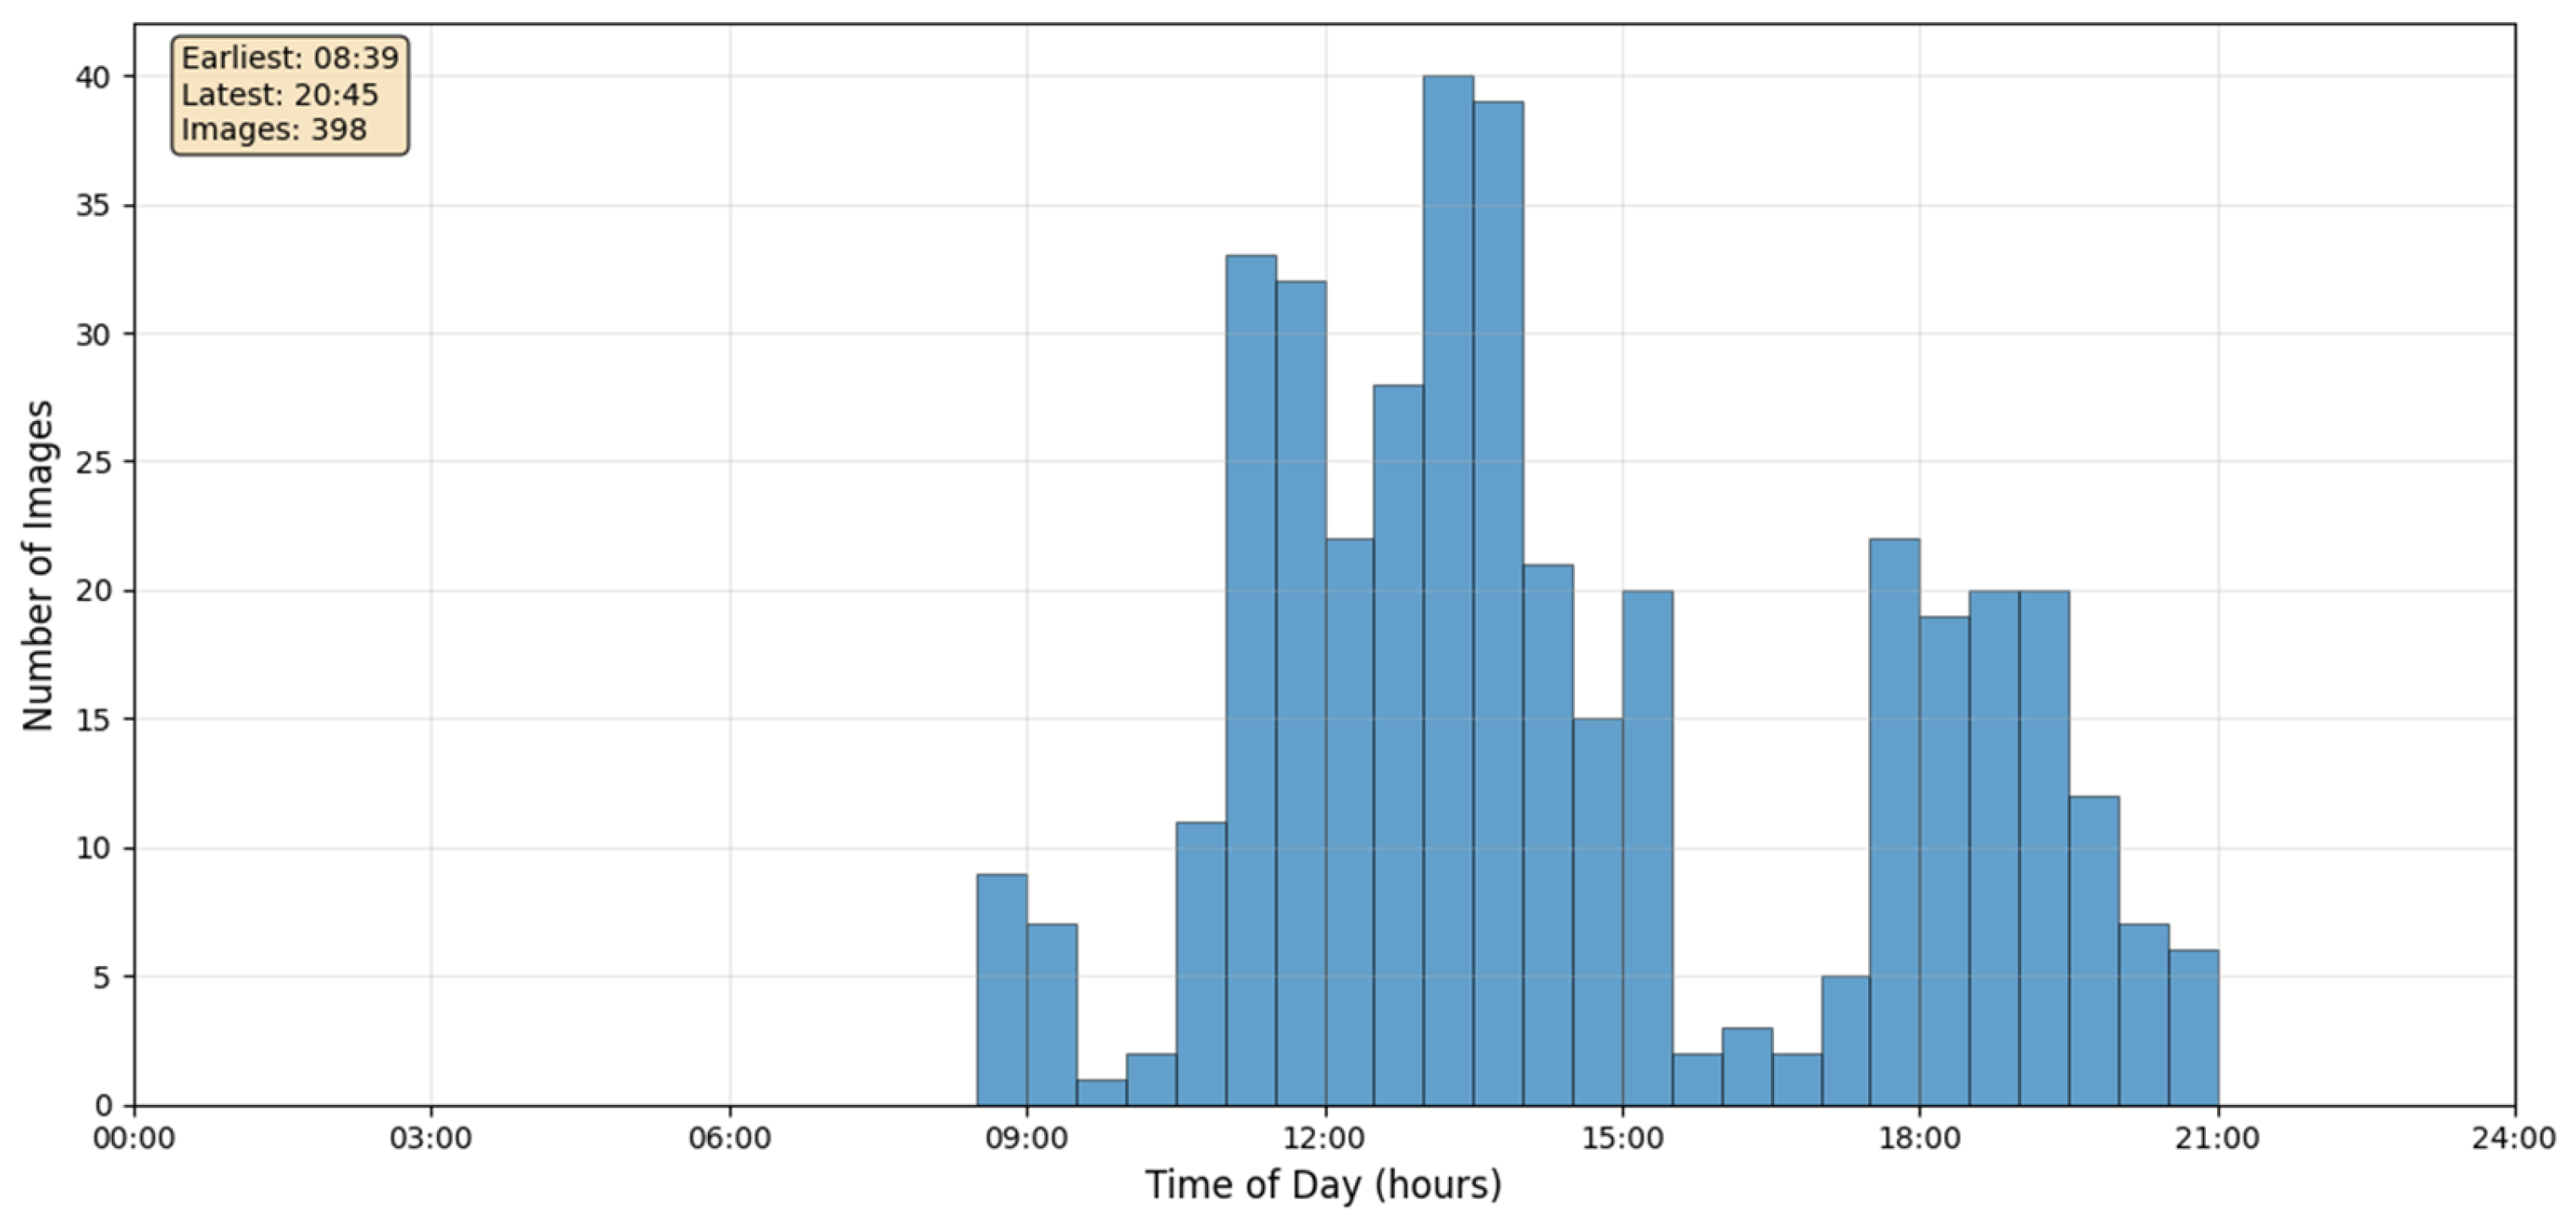
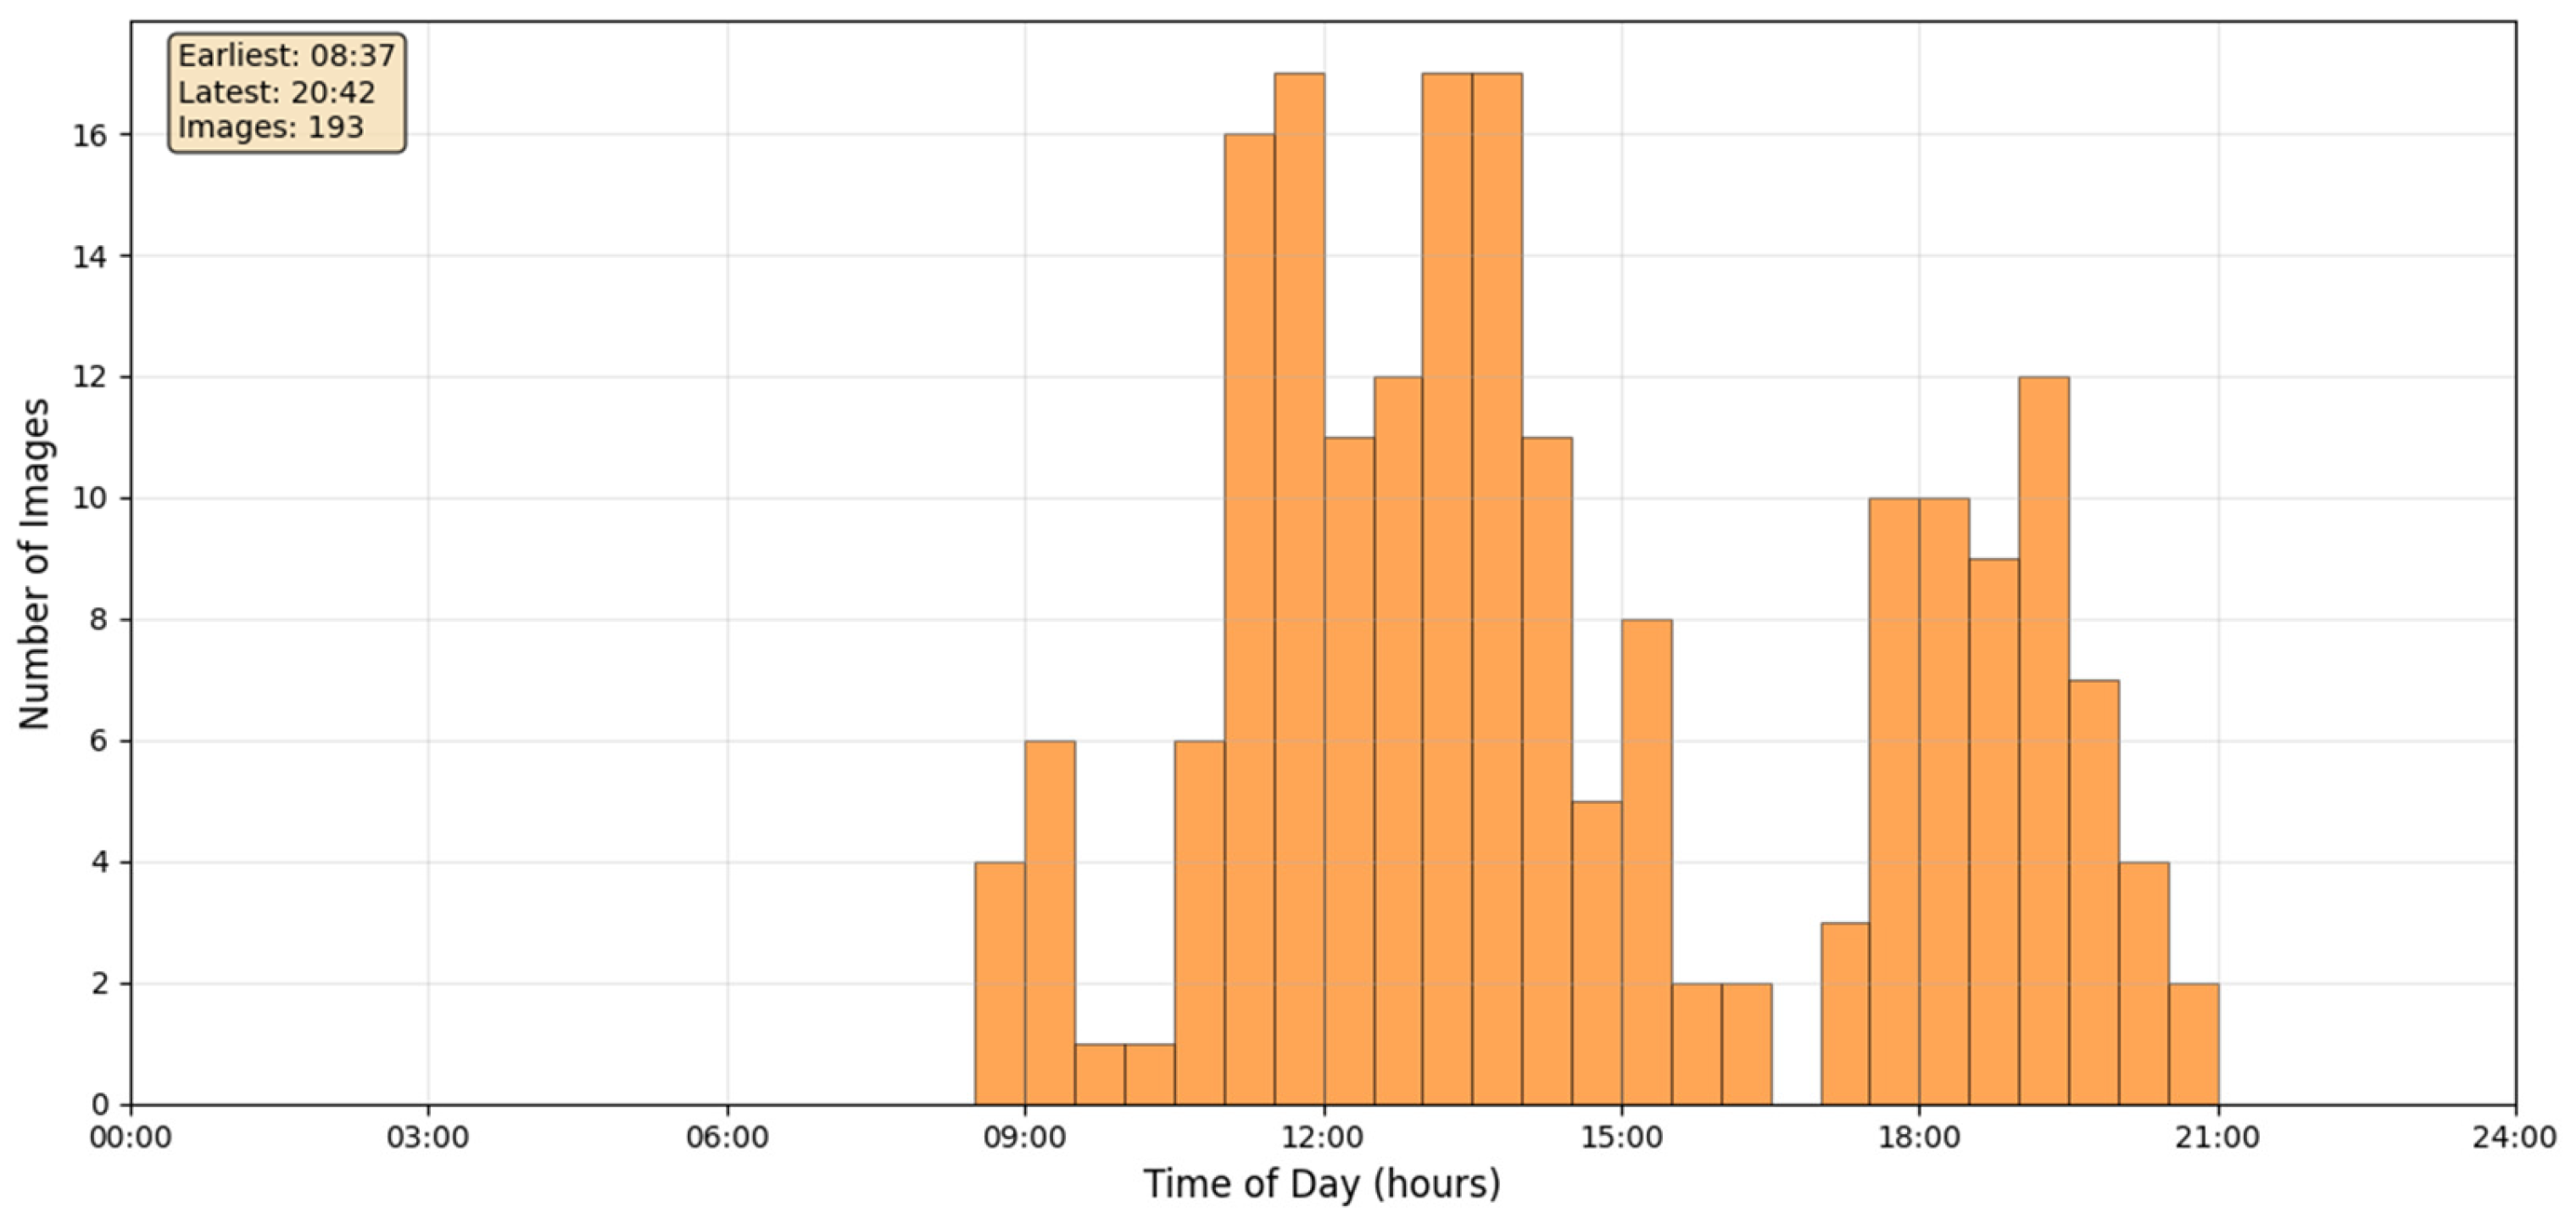
The dataset is divided into training and test subsets. The training subset consists of 398 images, while the test subset contains 193 images. The split was performed while preserving an approximate class distribution and temporal stratification by time of day to ensure representativeness of both subsets.
No separate validation subset is included in the published dataset. During training and evaluation of baseline models, validation data were formed by splitting the training subset.
3. Dataset Description
3.1. Dataset Availability
The complete UVInsDet dataset is publicly available through the Zenodo repository (Record ID 18197601). All materials are released under the Creative Commons Attribution 4.0 International (CC BY 4.0) license, which permits unrestricted use, distribution, and modification of the data provided that appropriate credit is given to the source.
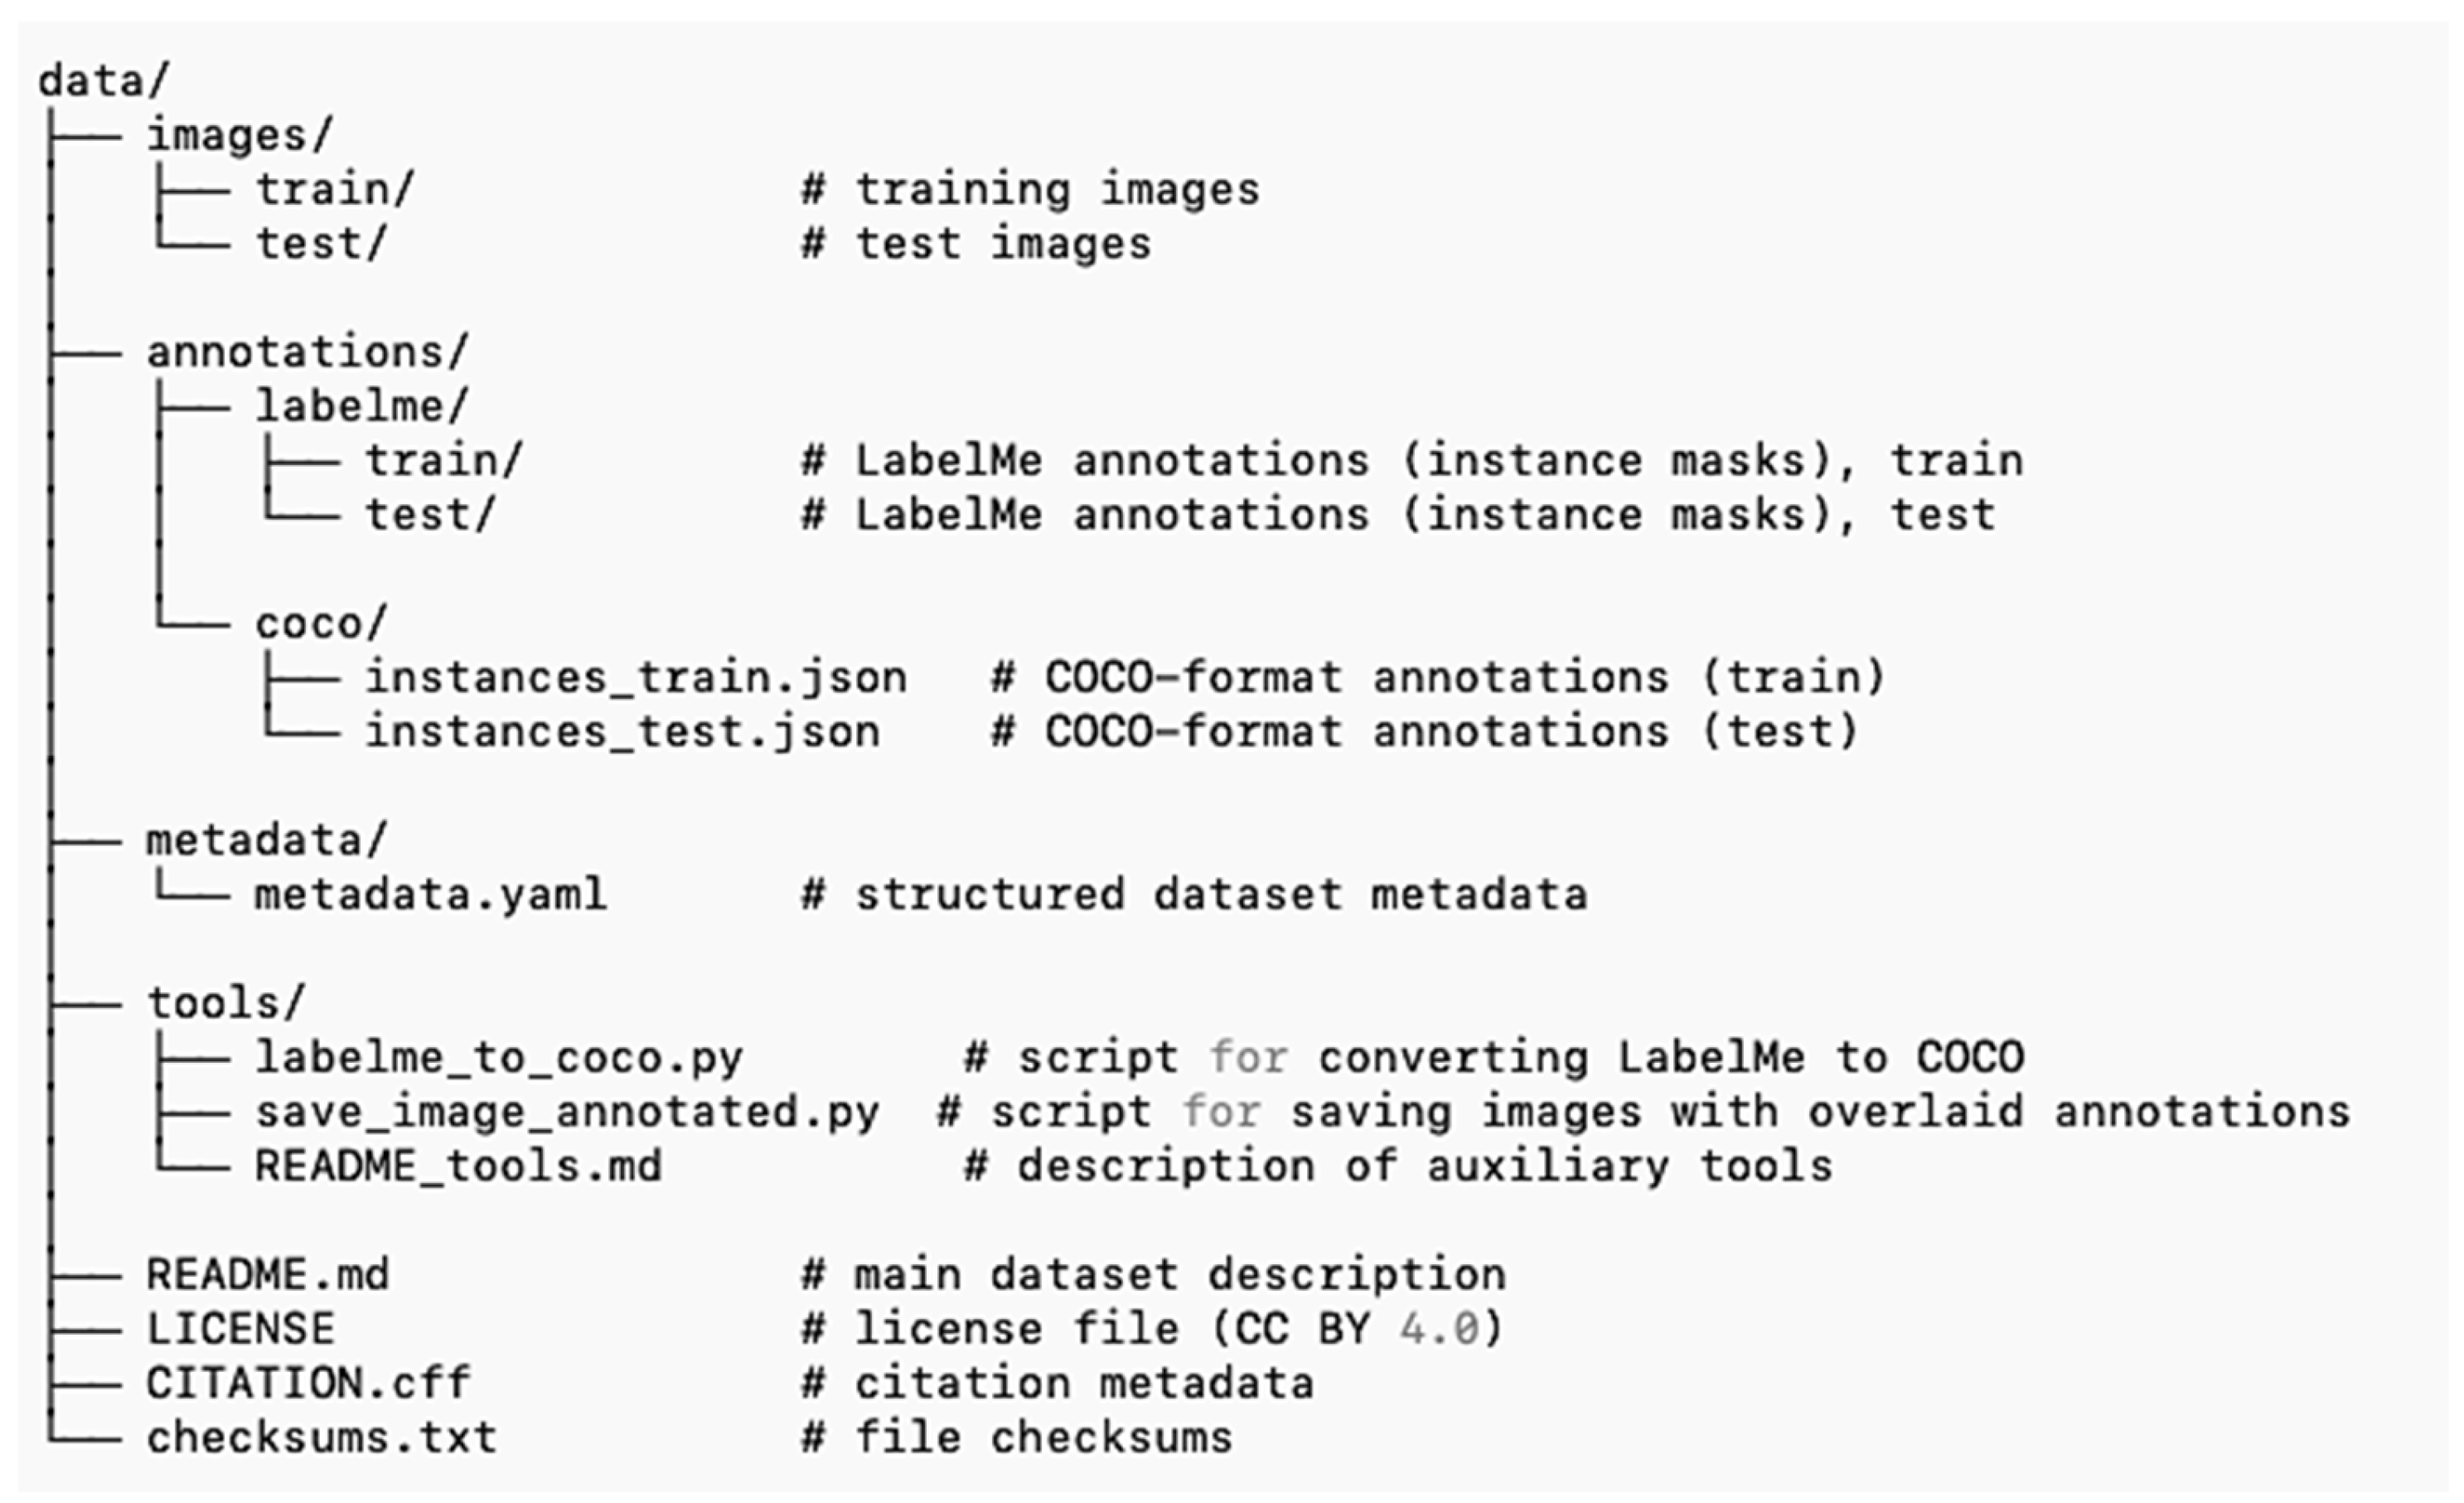
The repository contains images, annotations, metadata files, auxiliary scripts, and documentation required for dataset reuse and experiment reproduction. The overall structure of the dataset archive is shown in
Figure 1.
3.2. Images
The images are stored in the data/images directory and are organized according to the dataset split. The train directory contains images from the training subset, while the test directory contains images from the test subset.
All images are provided in JPEG format with a spatial resolution of 1280 × 720 pixels and a color depth of 8 bits per channel (RGB).
3.3. Annotations
Annotations are provided in two formats. The primary annotation format is LabelMe (JSON). Annotation files are stored in the data/annotations/labelme directory and follow the same directory structure as the image files. Each annotation file contains a set of polygon masks (shapes), where each polygon is represented by a list of points and an associated class label (glass or porcelain).
The annotation target is an insulator string represented as a single object instance. Each polygon corresponds to the visible extent of the annotated insulator string within the image.
To facilitate integration with standard computer vision frameworks, annotations are additionally provided in the COCO format. The converted annotations are stored in the data/annotations/coco directory and include separate files for the training and test subsets (instances_train.json and instances_test.json).
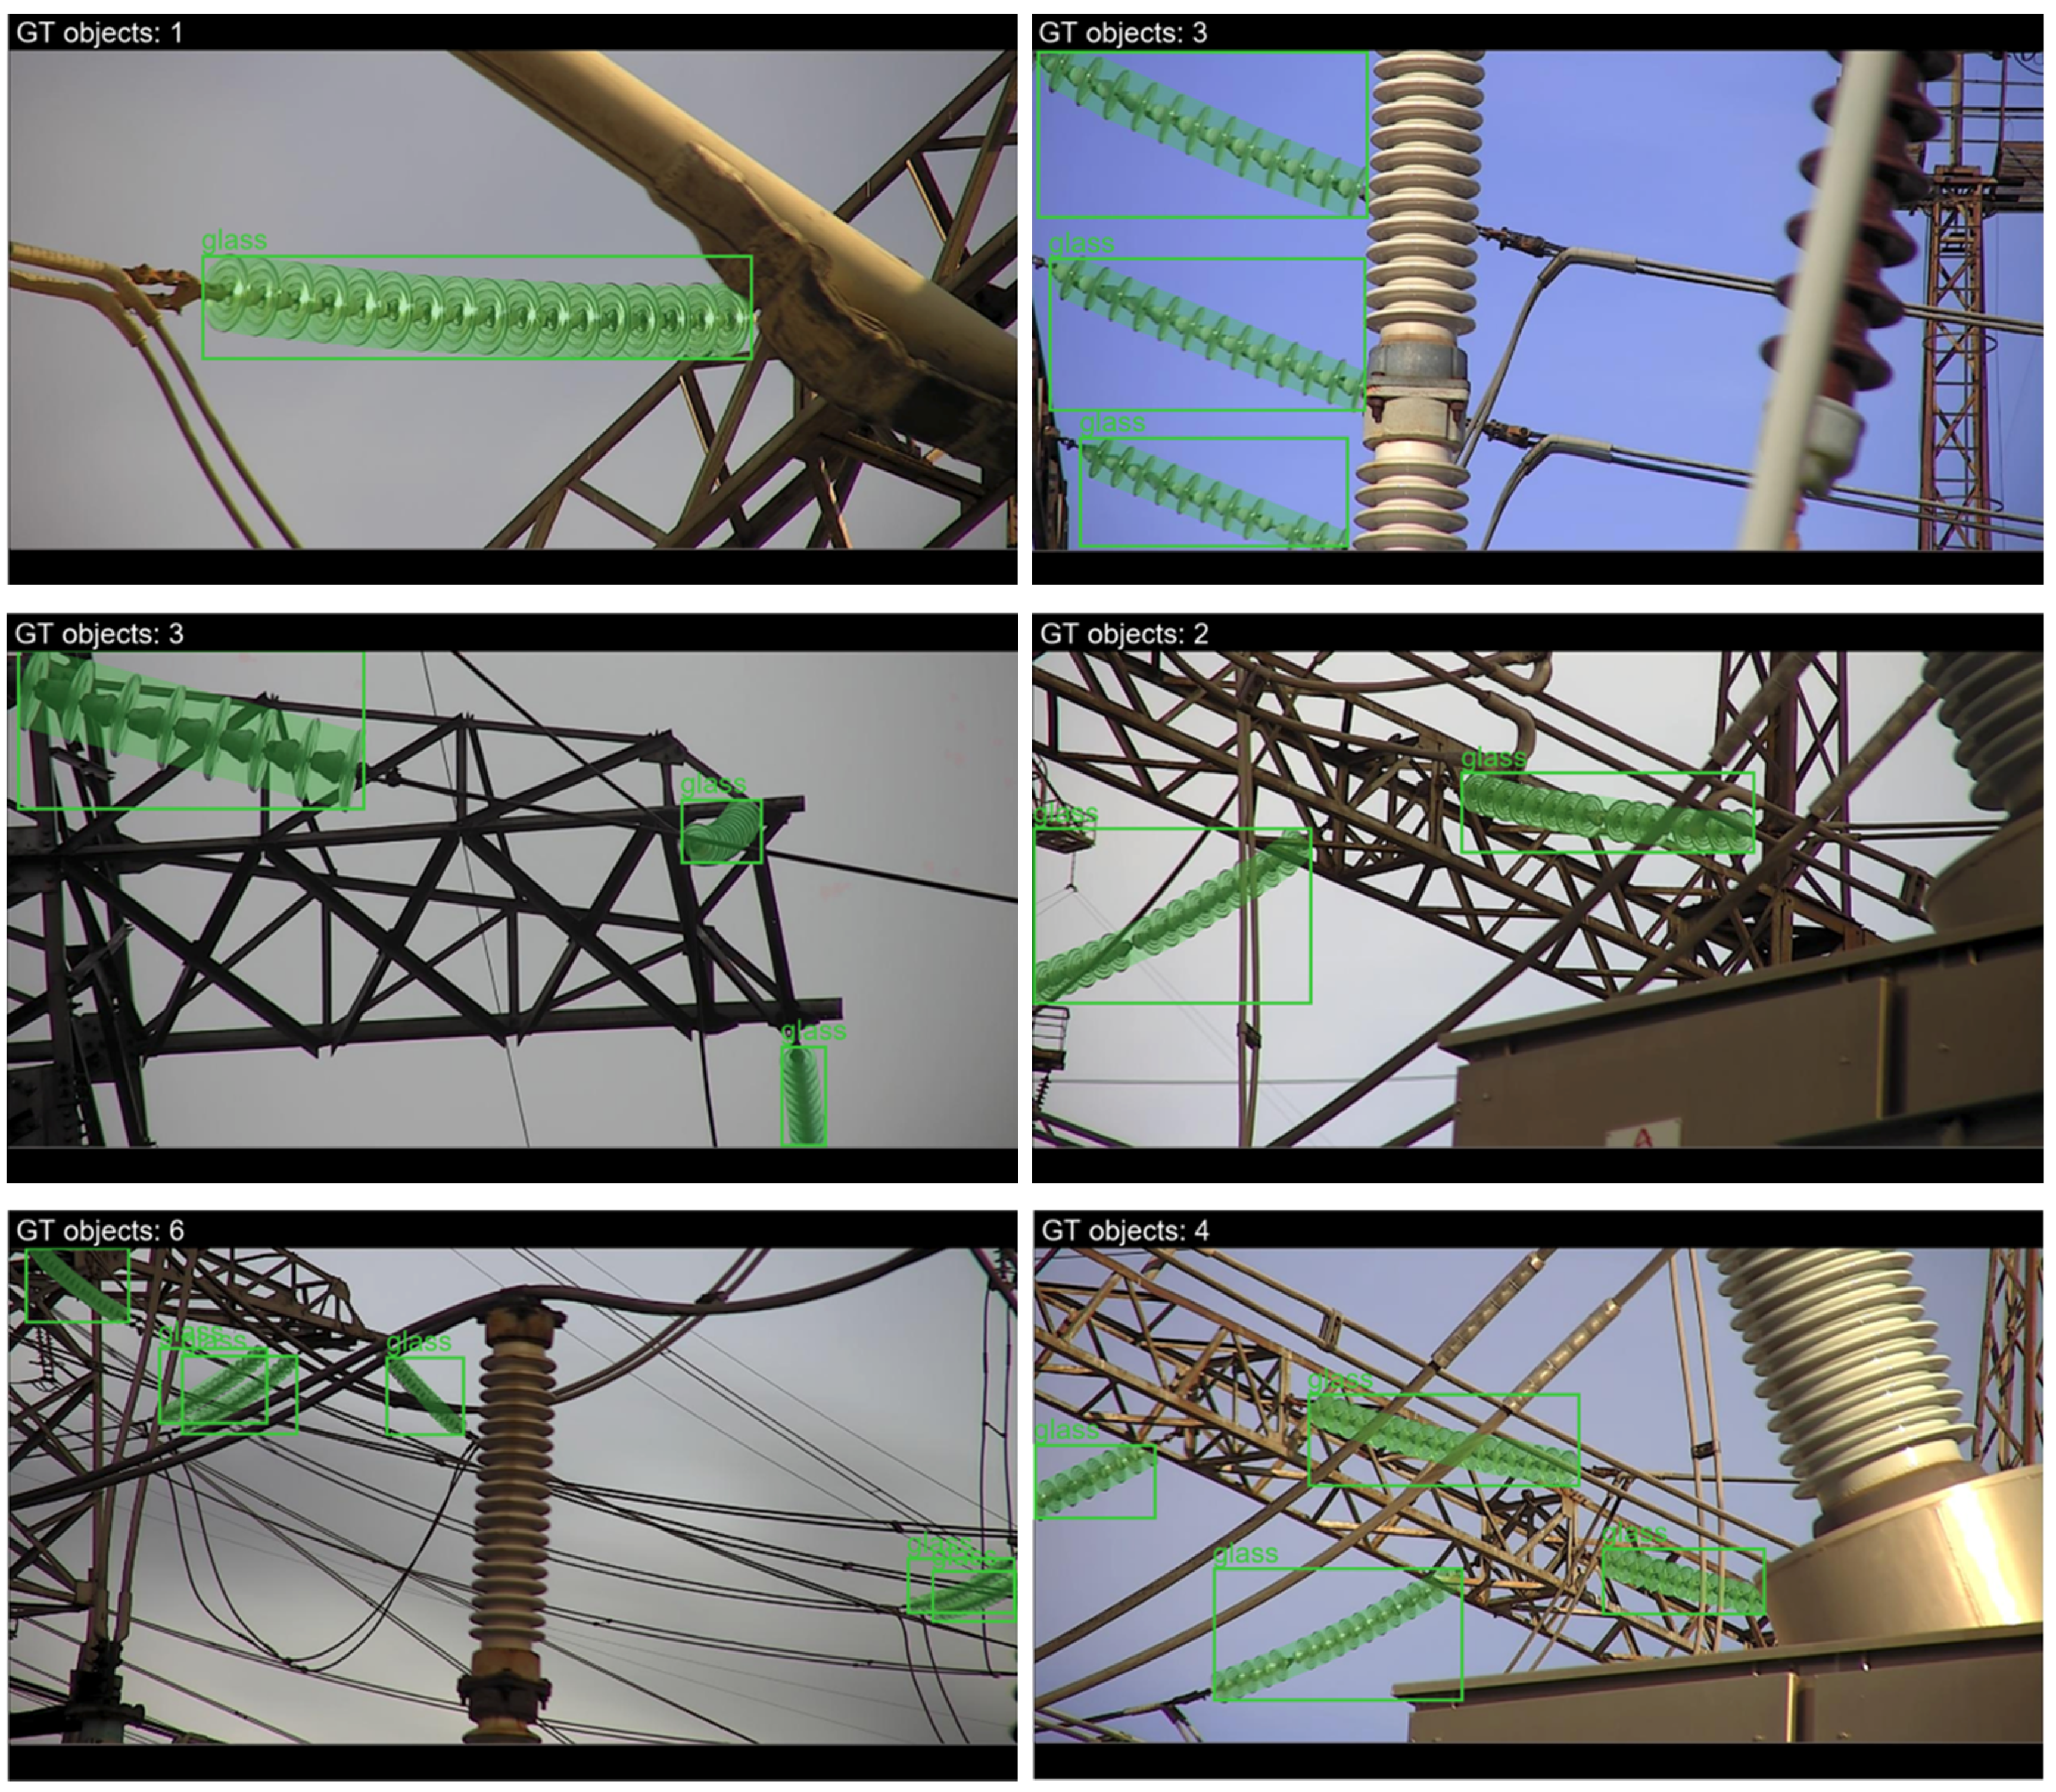
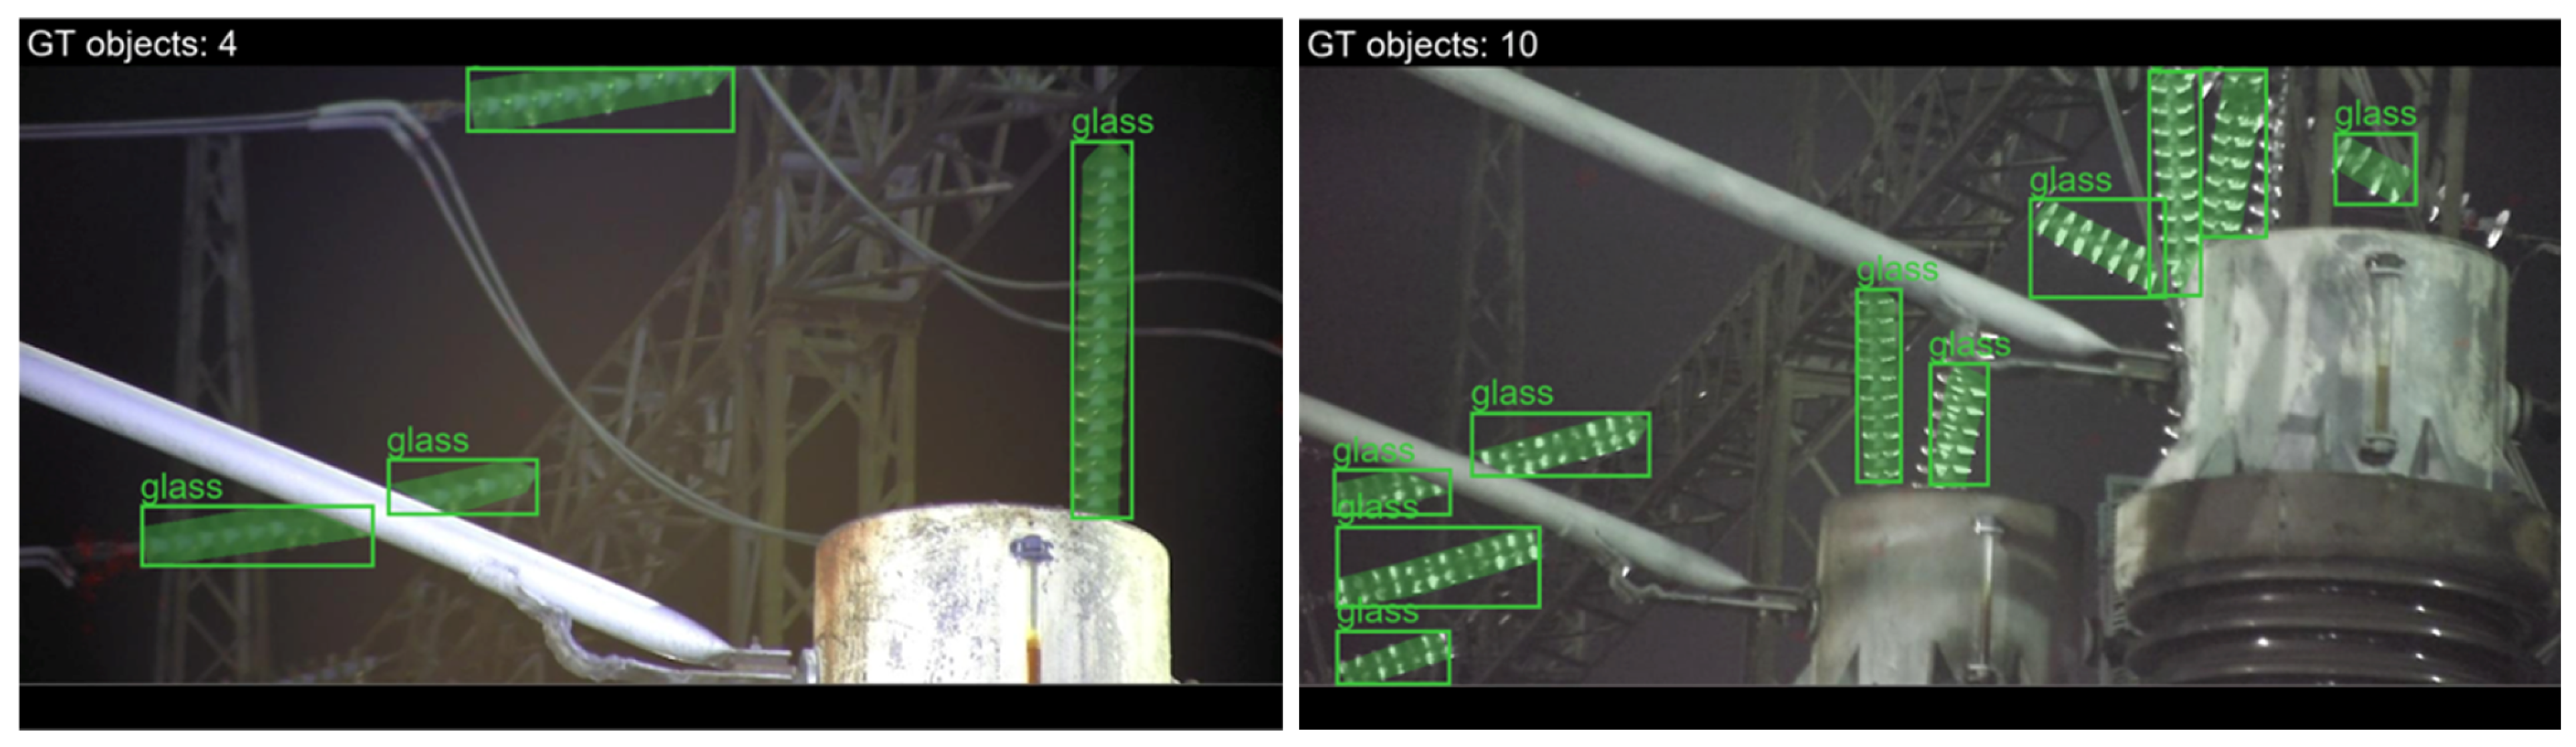
Examples of annotated images illustrating different observation conditions, object scales, and viewpoints are presented in
Figure 2.
3.4. Metadata and Documentation
The root directory of the dataset archive contains a metadata .yaml file providing a structured description of the dataset, including information on data provenance, object classes, annotation types, and dataset organization.
In addition, a README.md file provides usage instructions, licensing information, repository structure descriptions, and links to related resources. The documentation is intended to facilitate dataset reuse by researchers and developers working on computer vision methods for industrial inspection applications.
3.5. Auxiliary Tools
The dataset archive includes auxiliary scripts supporting dataset use and reproducibility. One script converts LabelMe annotations into the COCO format, while another script visualizes annotations by generating images with overlaid segmentation masks.
These tools are distributed together with the dataset and are intended to simplify integration into existing computer vision workflows and facilitate experiment reproducibility.
4. Technical Validation
The technical validation of the UVInsDet dataset is aimed at confirming its structural correctness, annotation reliability, representativeness, and suitability for training and evaluating computer vision models for insulator detection and instance segmentation in complex industrial environments. The statistical characteristics and baseline experiment results presented below are not intended for algorithmic comparison or performance optimization. Instead, they are provided to characterize the dataset and demonstrate its applicability to practical computer vision tasks.
4.1. Data Quality Control
The following quality control procedures were performed during dataset preparation:
File integrity: all image files were successfully opened using standard image viewers. In addition, programmatic verification was performed using open-source software libraries OpenCV (v4.12.0) and Pillow (v.12.0.0).
Annotation consistency: for each image file, a corresponding annotation file exists, and all annotated objects are fully contained within image boundaries.
Annotation quality: manual inspection confirmed the correctness of polygon outlines and class labels.
Subset balance: the distributions of object classes and acquisition conditions (including day/night acquisition) are comparable between the training and test subsets.
4.2. Annotation Consistency Assessment
The obtained inter-annotator agreement reached an IoU of 0.81 and a Dice coefficient of 0.89, indicating a high level of consistency between independent annotations. Remaining discrepancies were subsequently reviewed and resolved through expert consensus before incorporation into the final dataset.
These results support the reliability of the annotation procedure and demonstrate that the provided segmentation masks are sufficiently consistent for use in computer vision tasks involving object detection and instance segmentation.
4.3. Statistical Characteristics of the Dataset
The dataset contains 591 images, of which 398 belong to the training subset and 193 to the test subset. A total of 1415 insulator-string instances are annotated, corresponding to an average of 2.4 objects per image. The class distribution is as follows: glass—1392 objects (98.4%) and porcelain—23 objects (1.6%). In 53 images (9% of the total), no target objects are present.
The observed class imbalance reflects the actual composition of the inspected substation equipment and was intentionally preserved to maintain the realism of the operational inspection scenario. Glass insulator strings constitute the majority of annotated objects, while porcelain strings are represented to a much lesser extent. No artificial balancing procedures were applied.
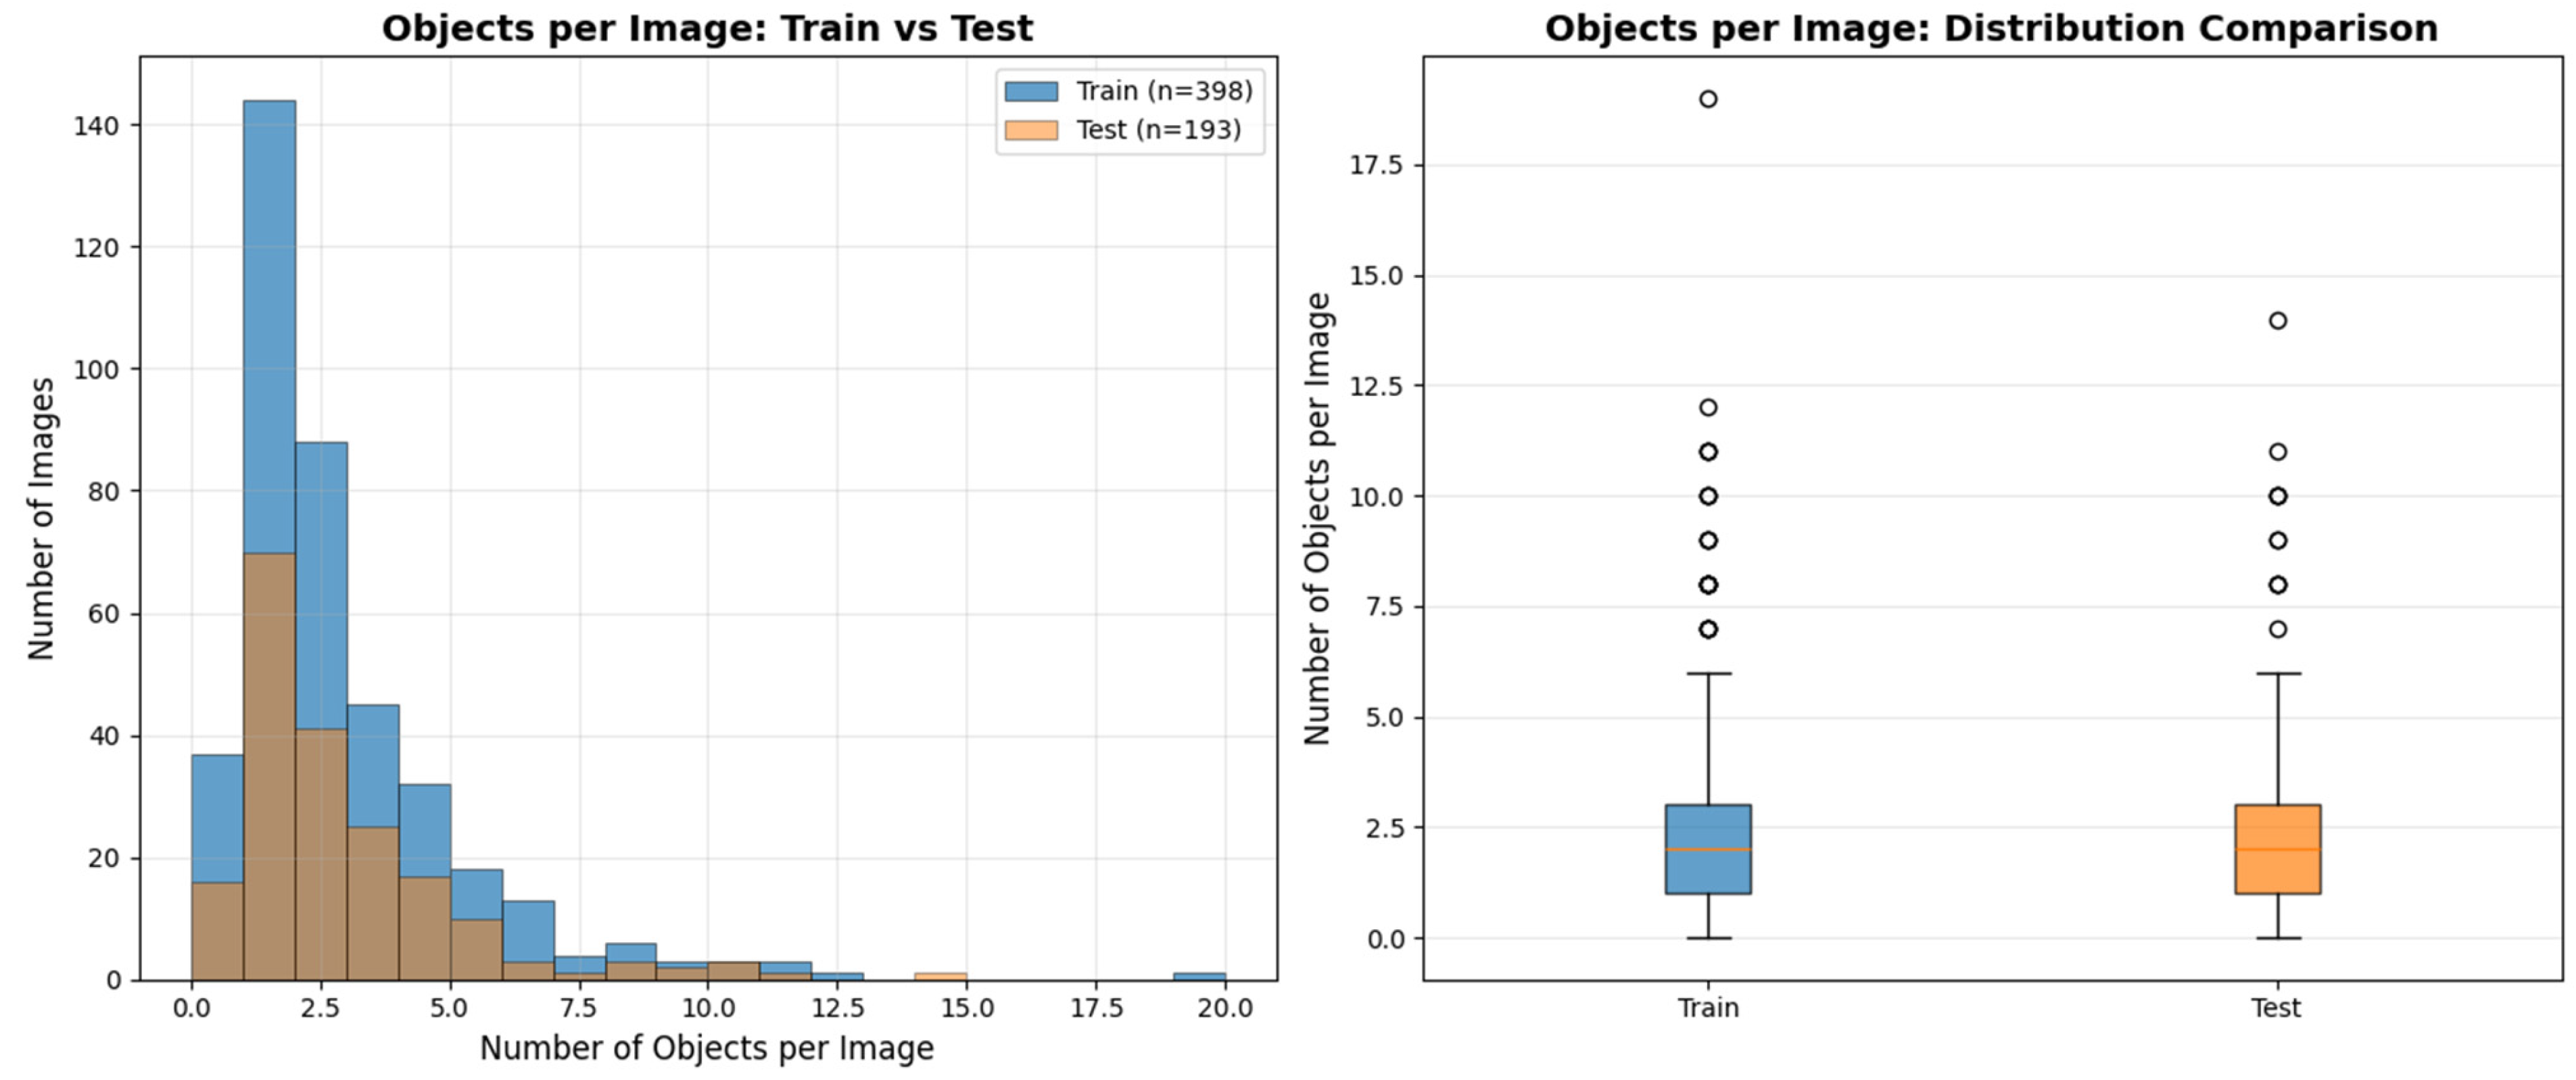
The distribution of the number of objects per image is asymmetric and includes both images containing a single object and scenes with substantially larger numbers of insulator strings (
Figure 3).
The distributions of the number of objects per image in the training and test subsets exhibit comparable shapes and ranges of values, indicating the absence of pronounced structural bias between the subsets. Similar consistency is observed for other key dataset characteristics, including weather conditions, illumination levels, and time of day (
Figure 4 and
Figure 5).
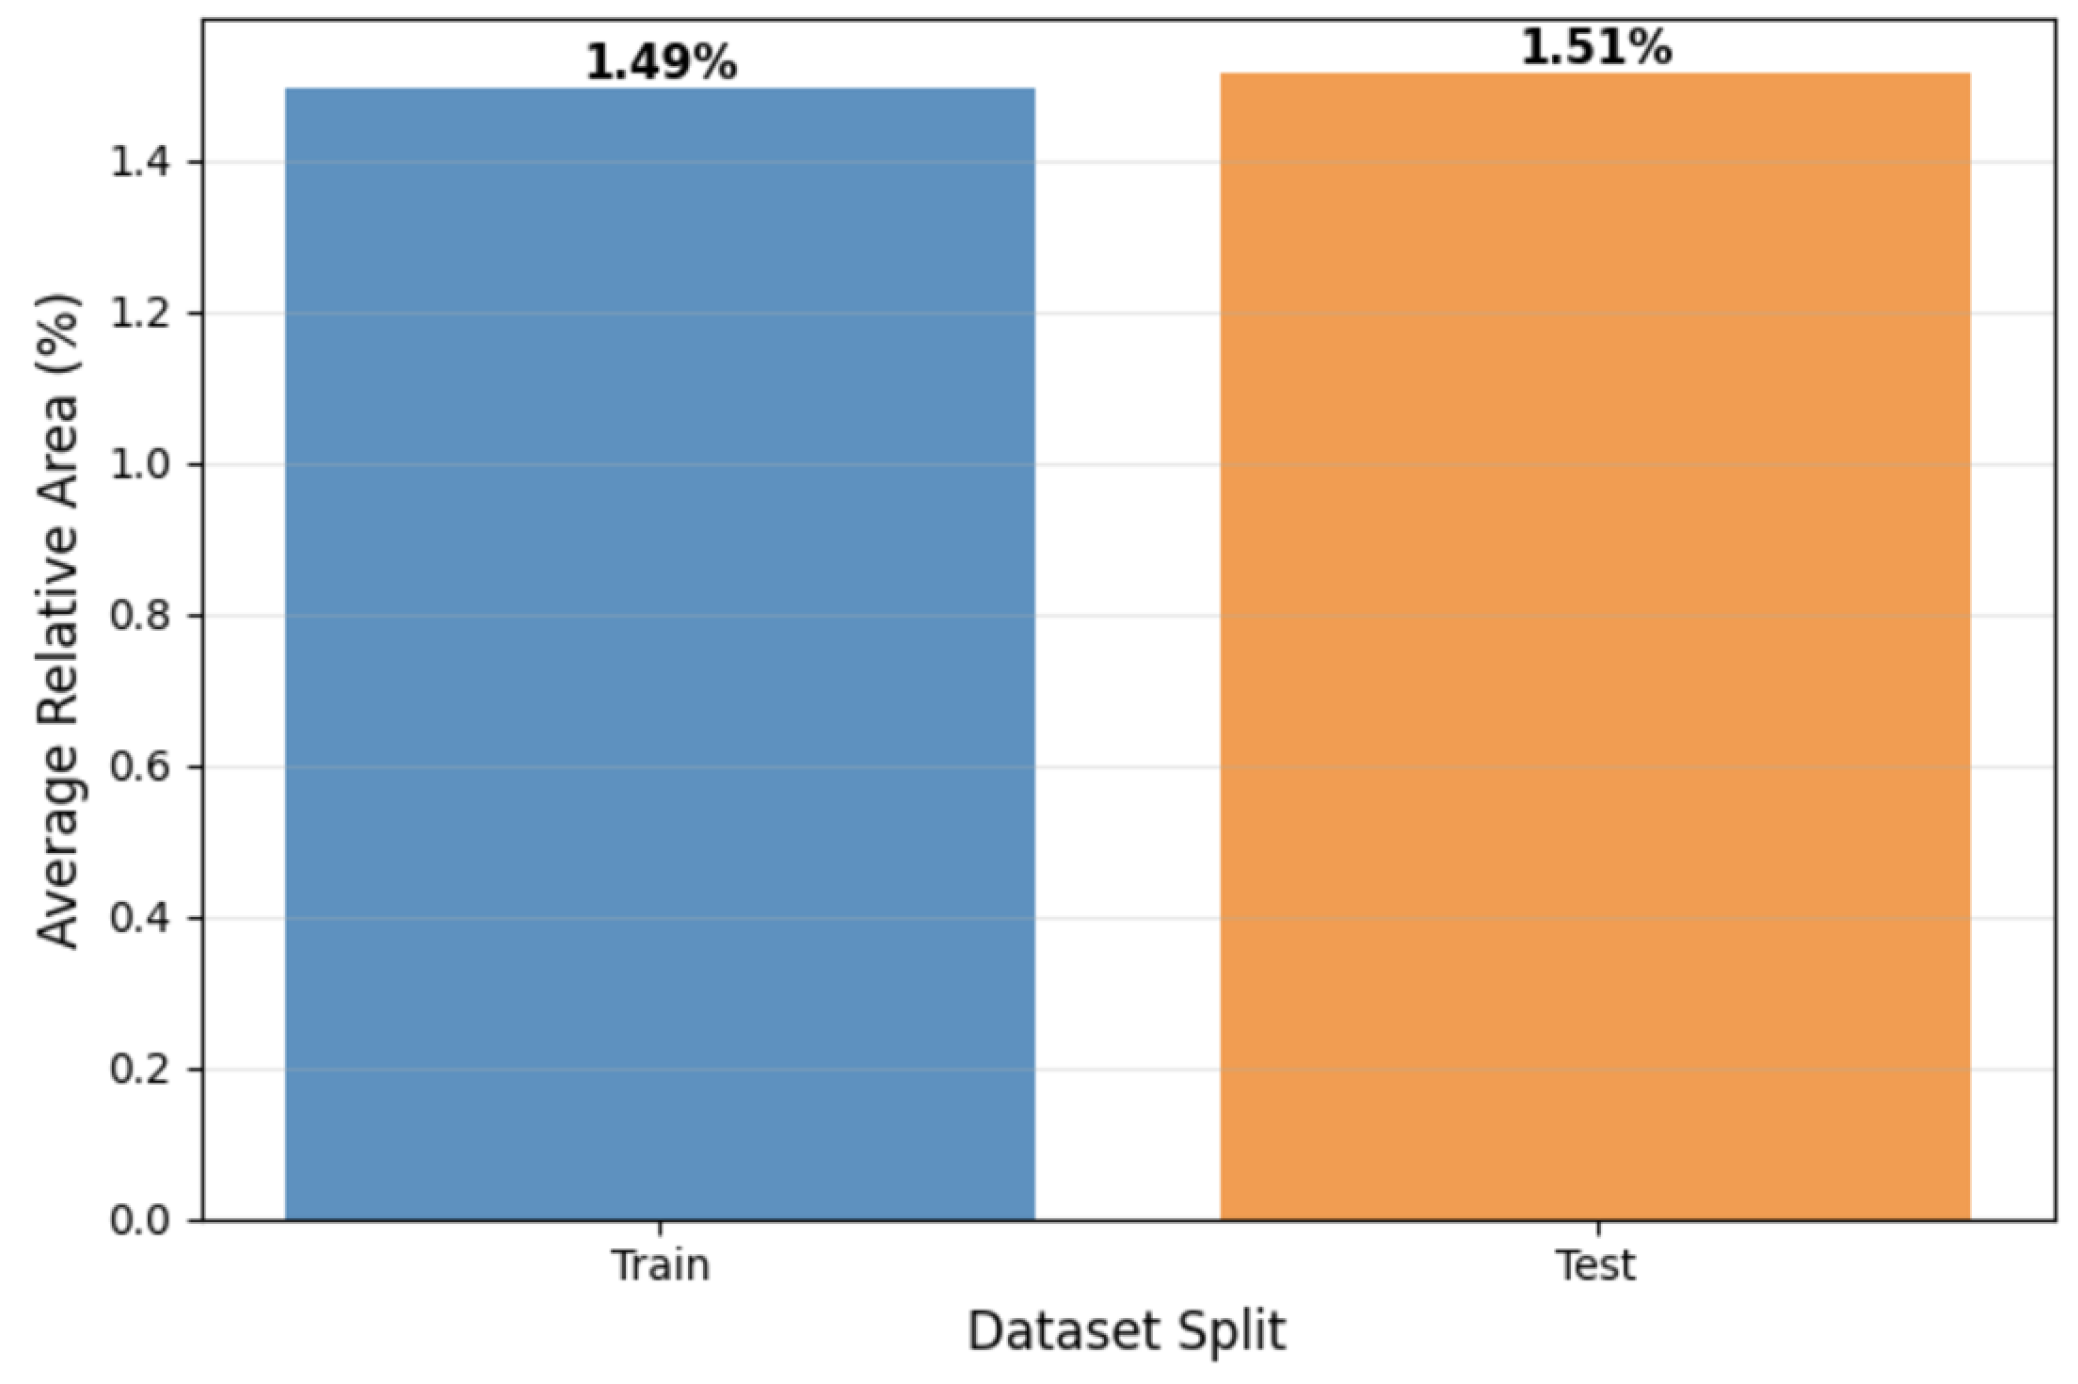
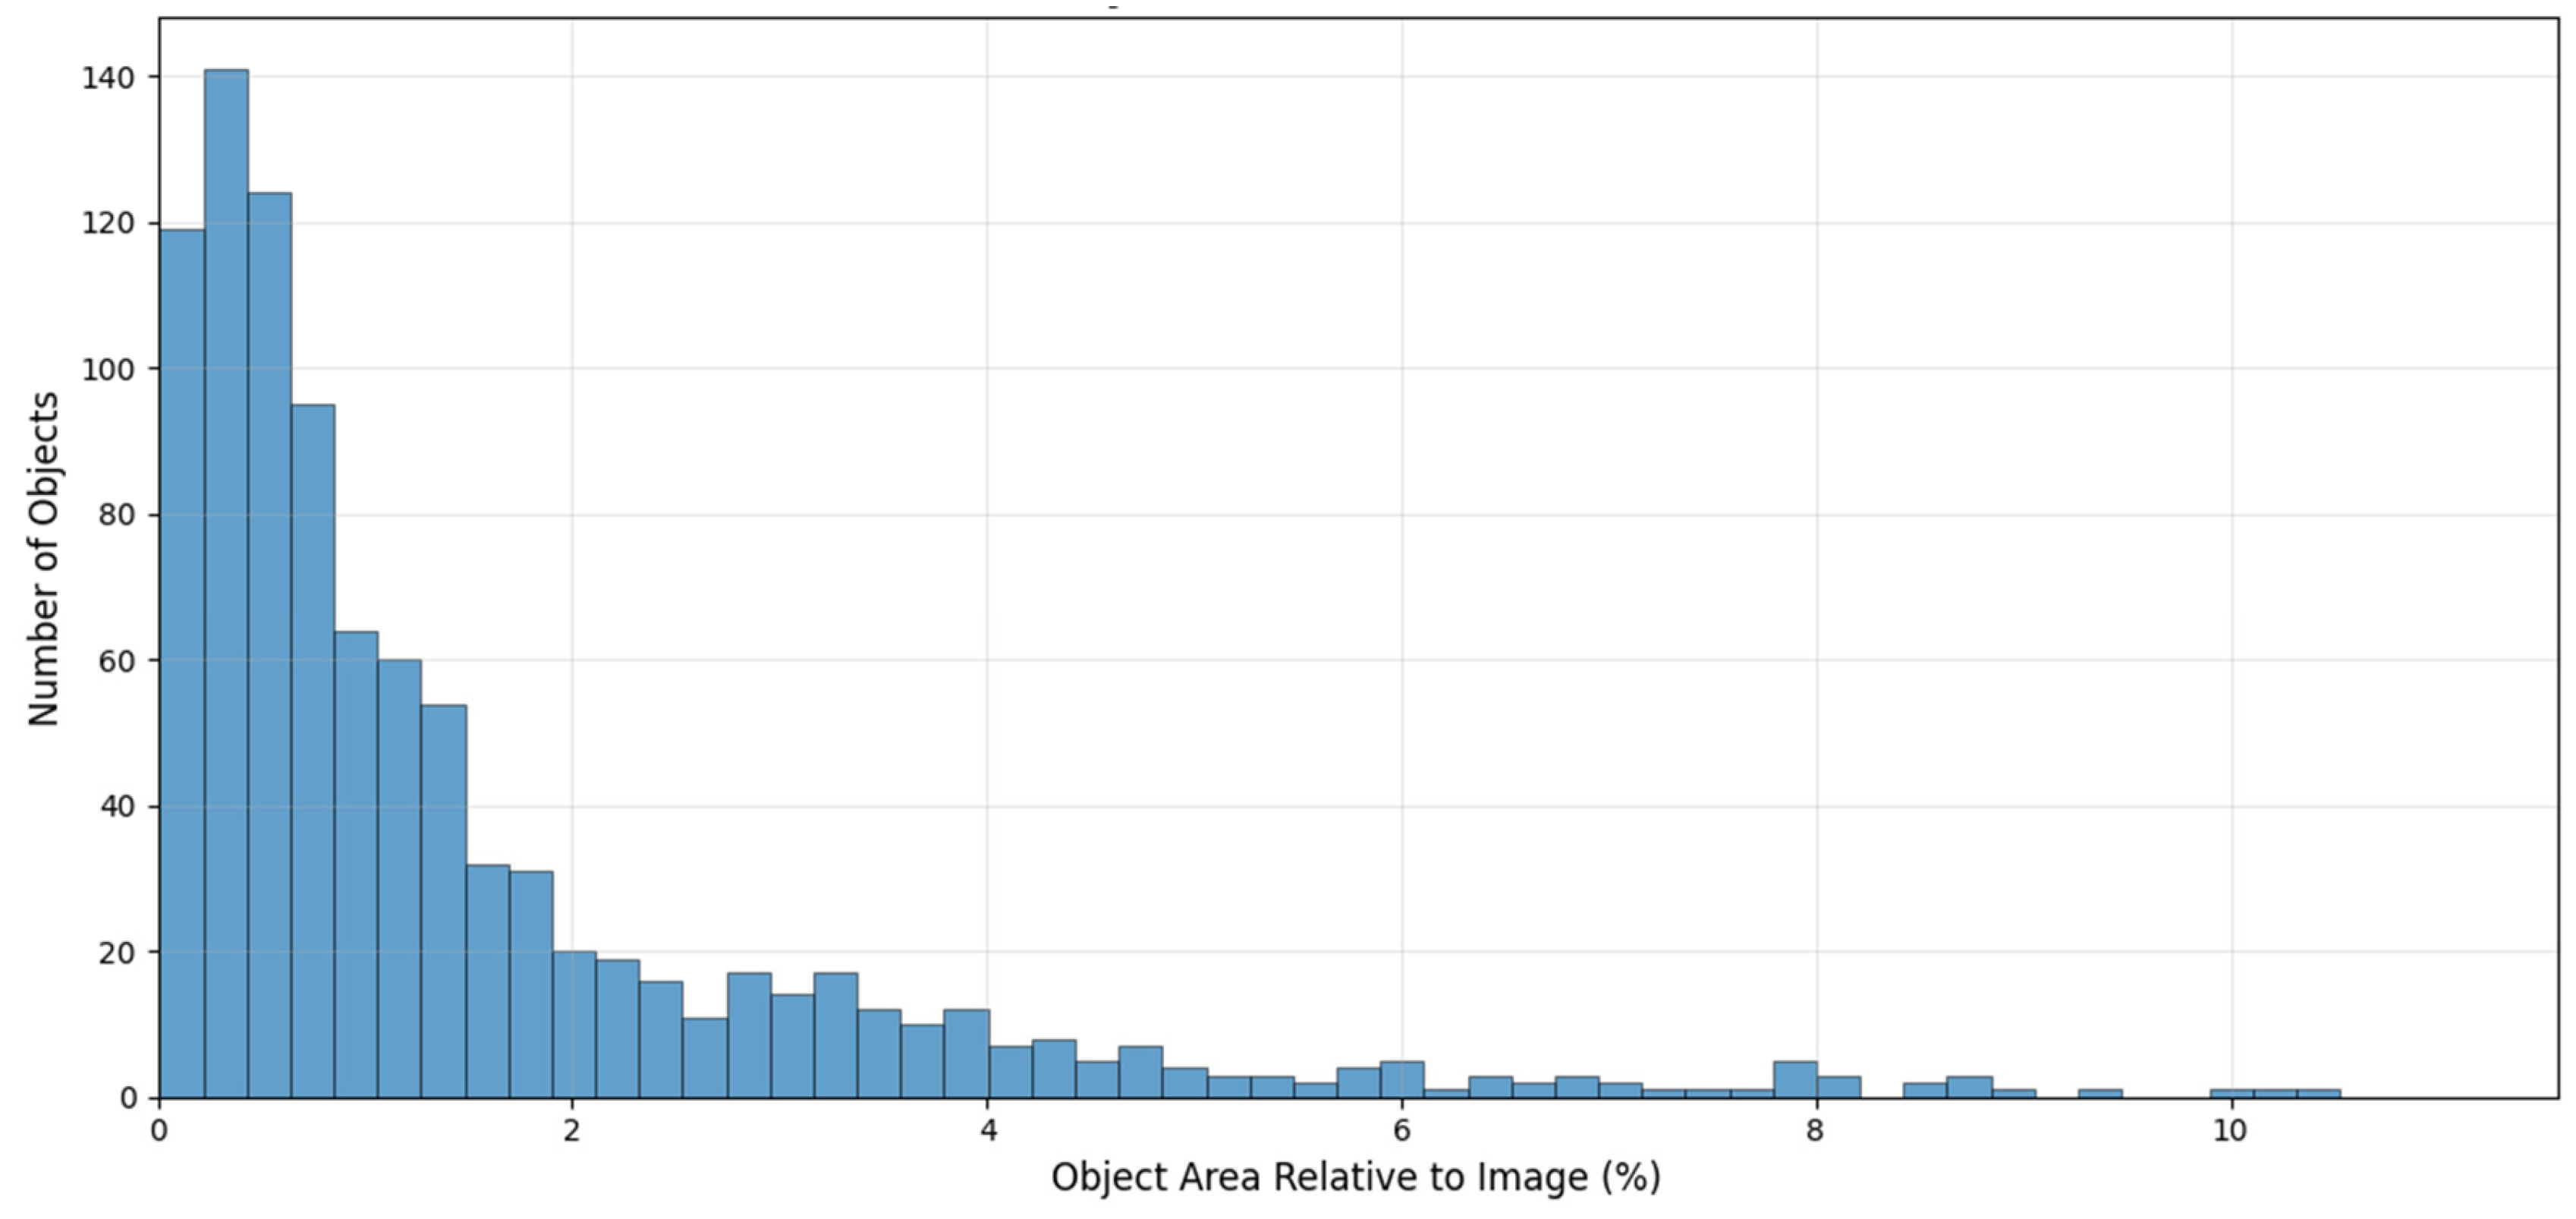
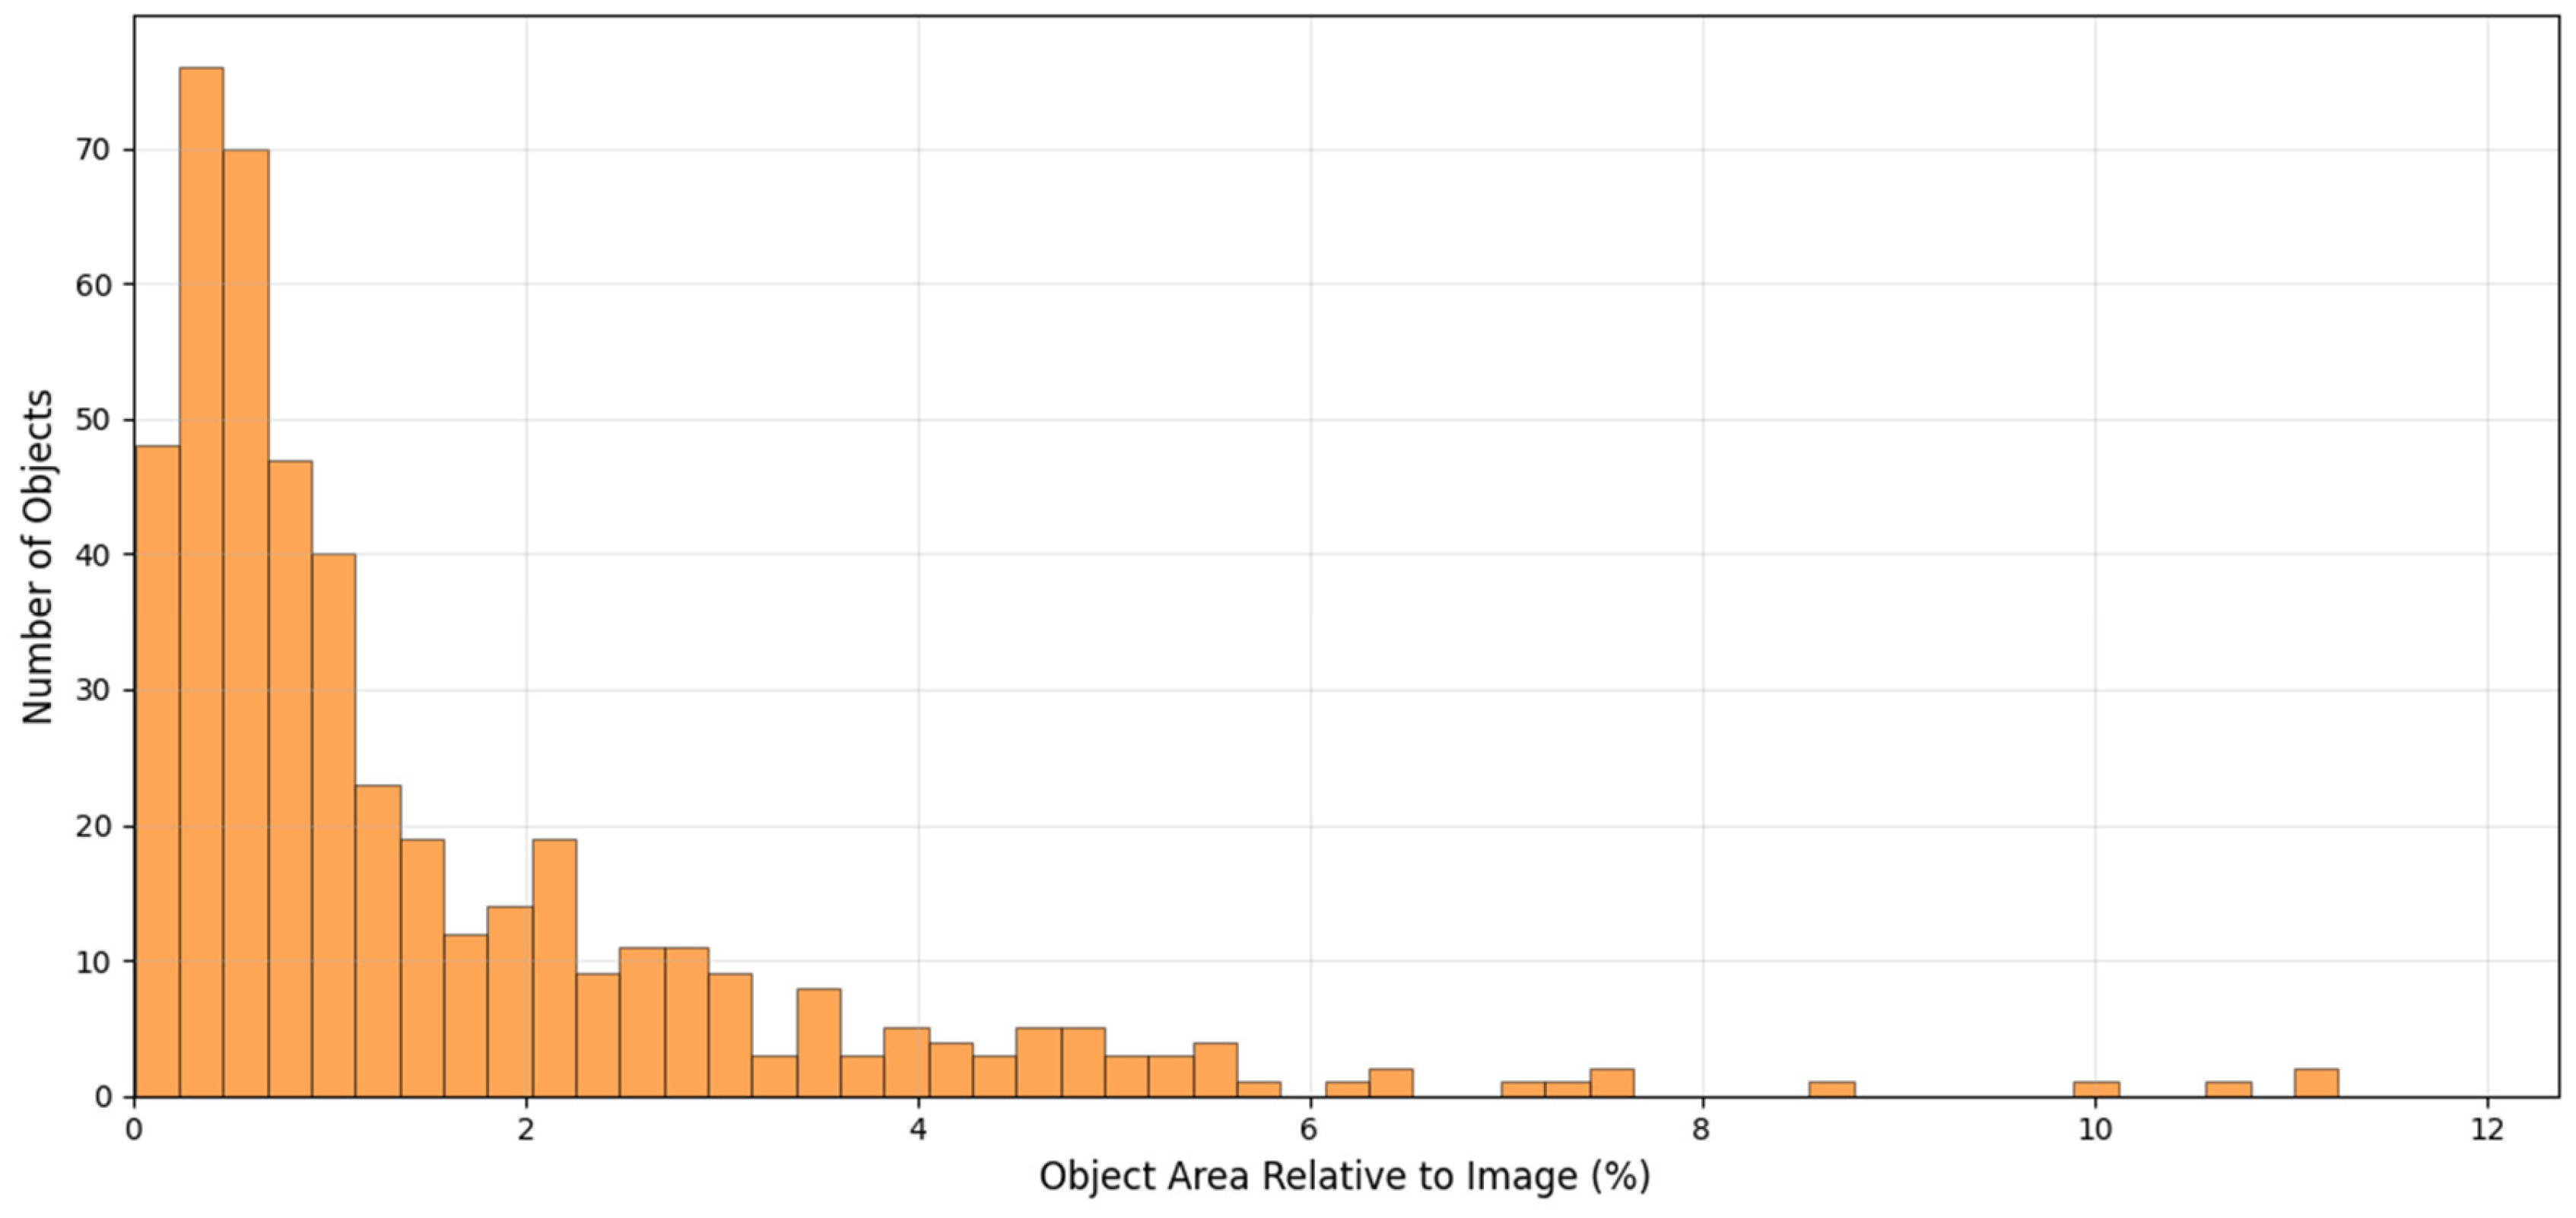
An analysis of relative object areas shows that a substantial proportion of insulator strings occupy only a small fraction of the image area (
Figure 6,
Figure 7 and
Figure 8). For most annotated instances, the relative object area represents only a few percent of the total image area. At the same time, the dataset includes larger objects observed at shorter distances or under more favorable viewing angles.
Such a distribution is characteristic of real substation inspection conditions and highlights the importance of accounting for scale variability when developing and evaluating computer vision models.
The combined statistical characteristics confirm that the training and test subsets have comparable structures and that the distributions of key parameters do not exhibit substantial differences.
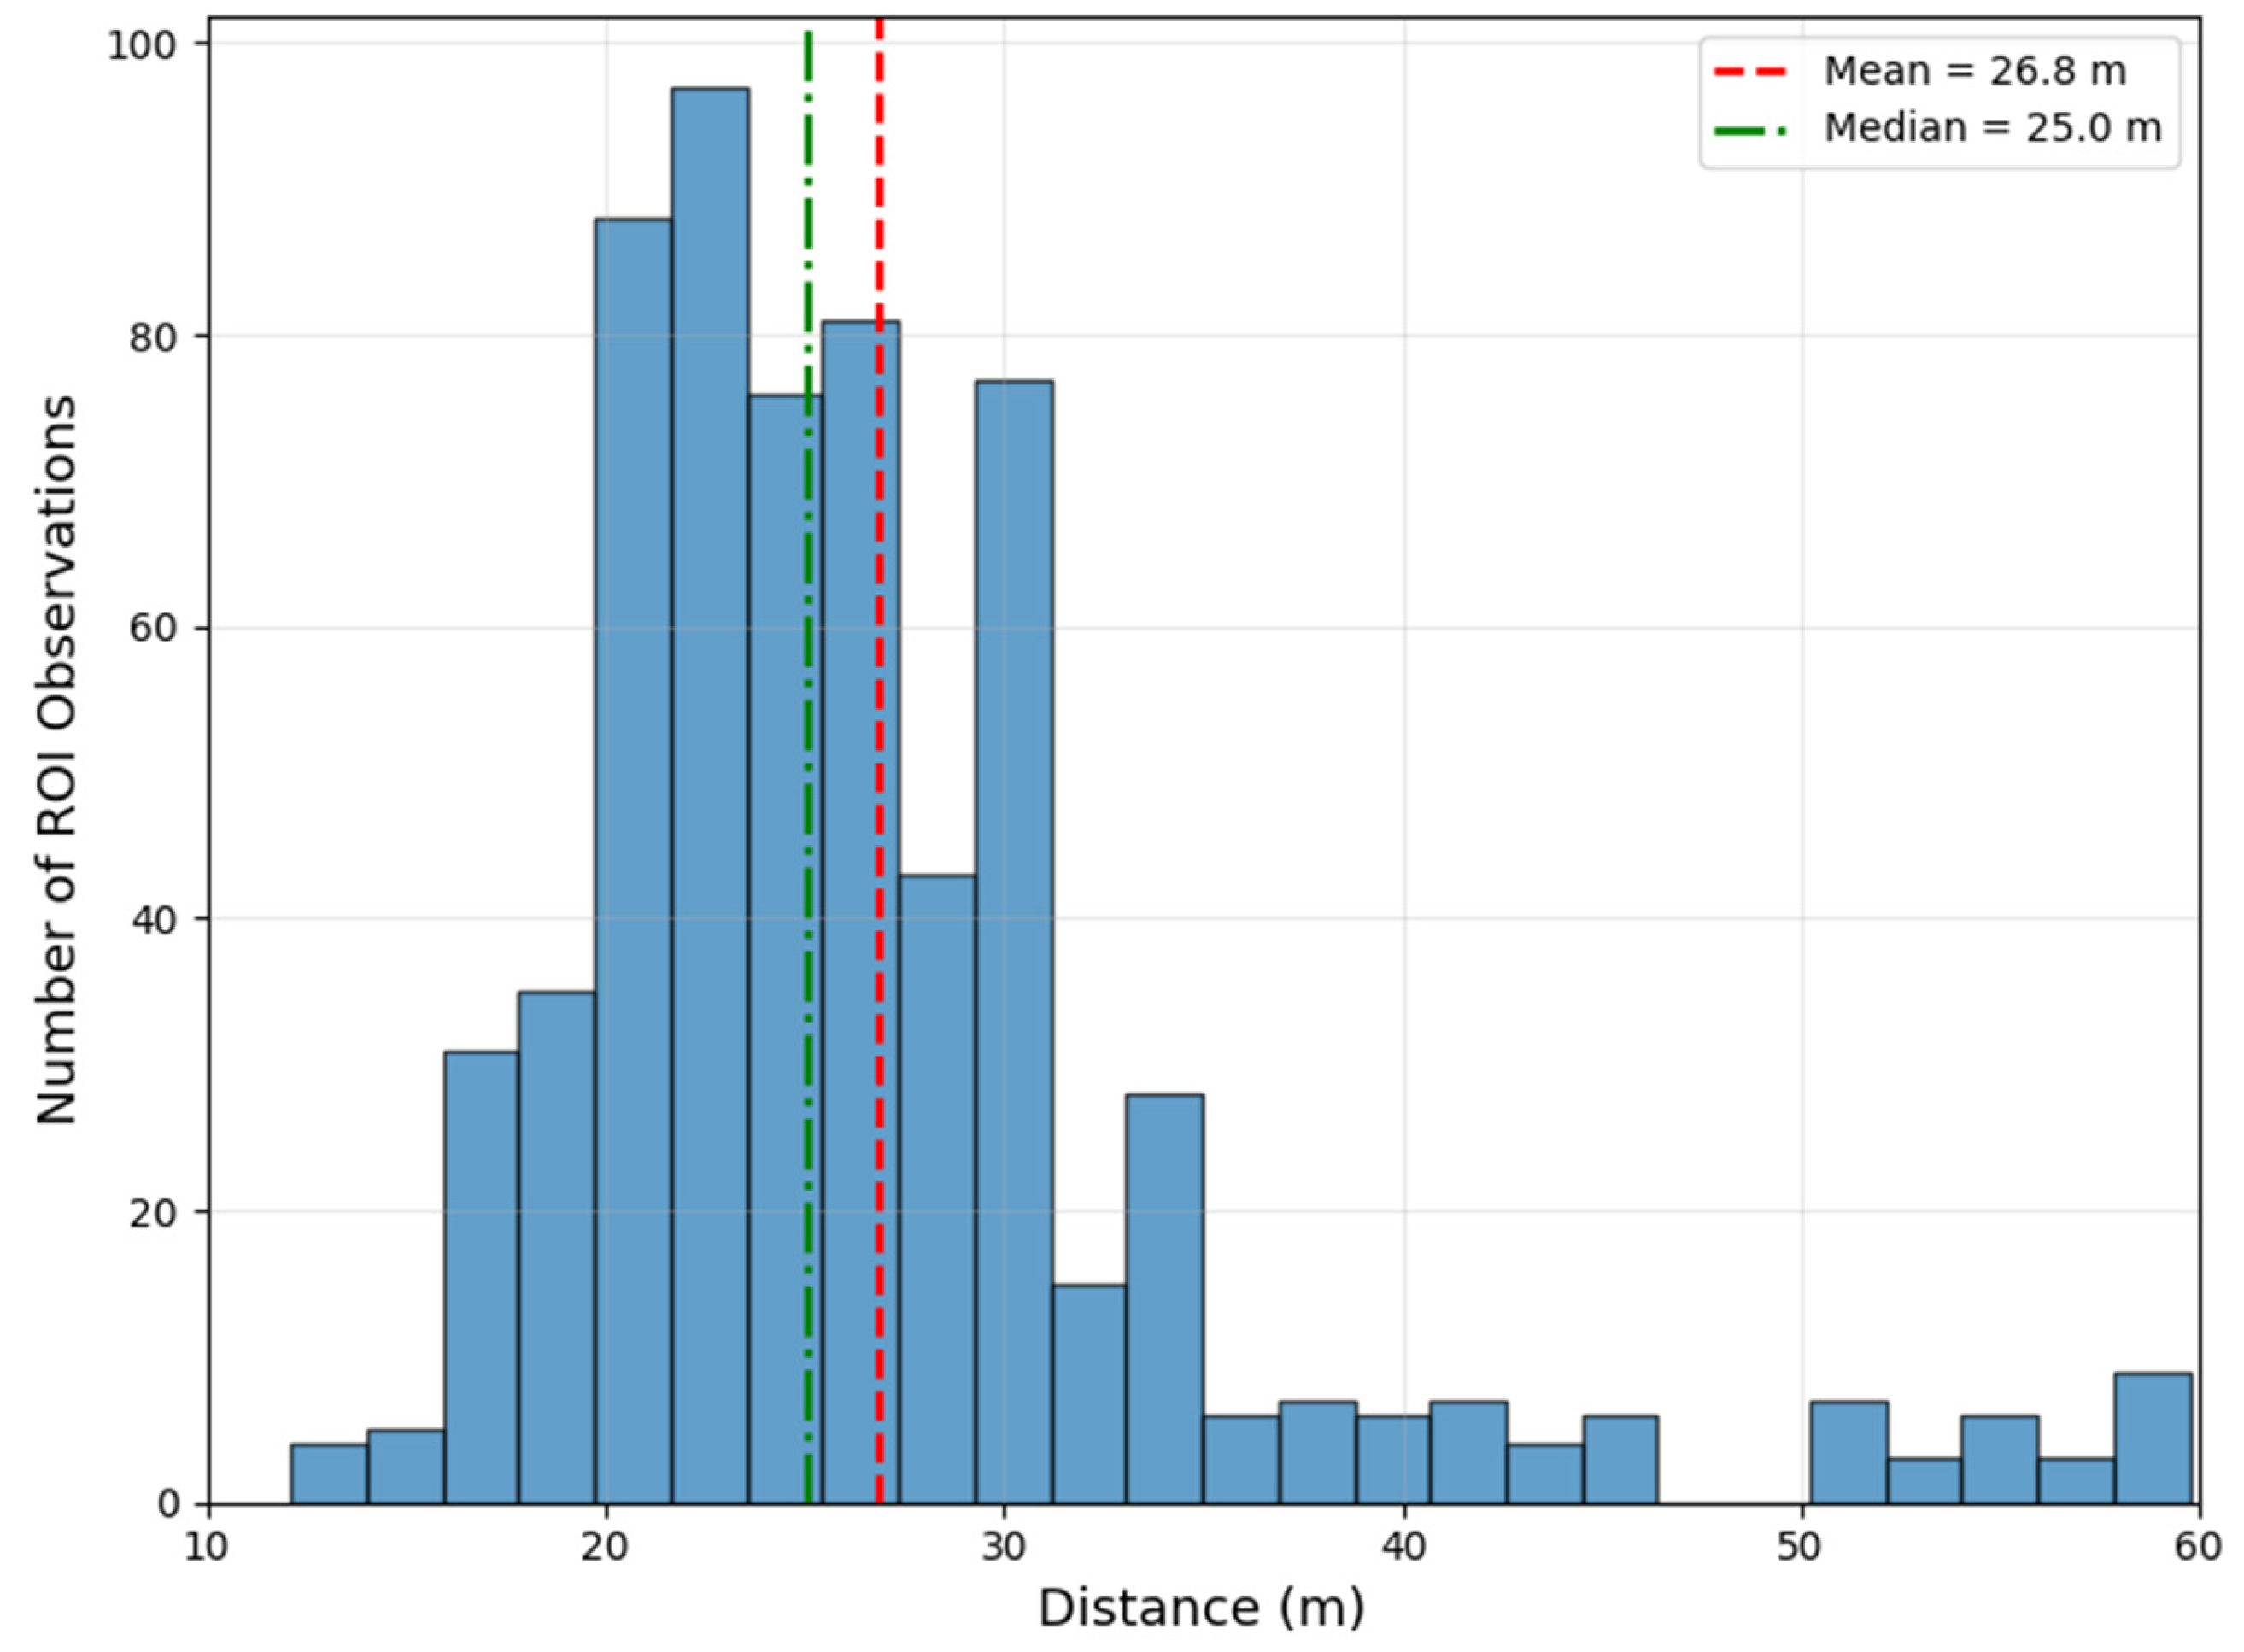
To further characterize the acquisition conditions, internal inspection metadata were analyzed. These metadata are not included in the released dataset but were used here to derive aggregate camera-to-object distance statistics for the annotated insulator-string observations. For the insulator-string class included in UVInsDet, the analyzed metadata correspond to observations of 312 unique physical insulator strings.
The camera-to-object distance ranged from 12.1 m to 59.7 m, with a mean distance of 26.8 m and a median distance of 25.1 m. The interquartile range (21.6–29.6 m) indicates that most observations were acquired at typical robotic inspection distances, while a smaller number of observations correspond to substantially larger inspection distances. This variability directly affects the apparent object scale in the images and therefore contributes to the diversity of detection and instance segmentation scenarios represented in the dataset.
Figure 9 illustrates the distribution of camera-to-object distances derived from the inspection metadata. The distribution is concentrated in the range of approximately 20–30 m, while a long tail extending to nearly 60 m demonstrates the inclusion of long-range inspection scenarios. These acquisition characteristics complement the image-based statistics presented above and provide additional context for interpreting model performance with respect to object scale.
Together with the time-of-day distributions presented in
Figure 4 and
Figure 5, these acquisition statistics characterize the principal sources of variability represented in the dataset.
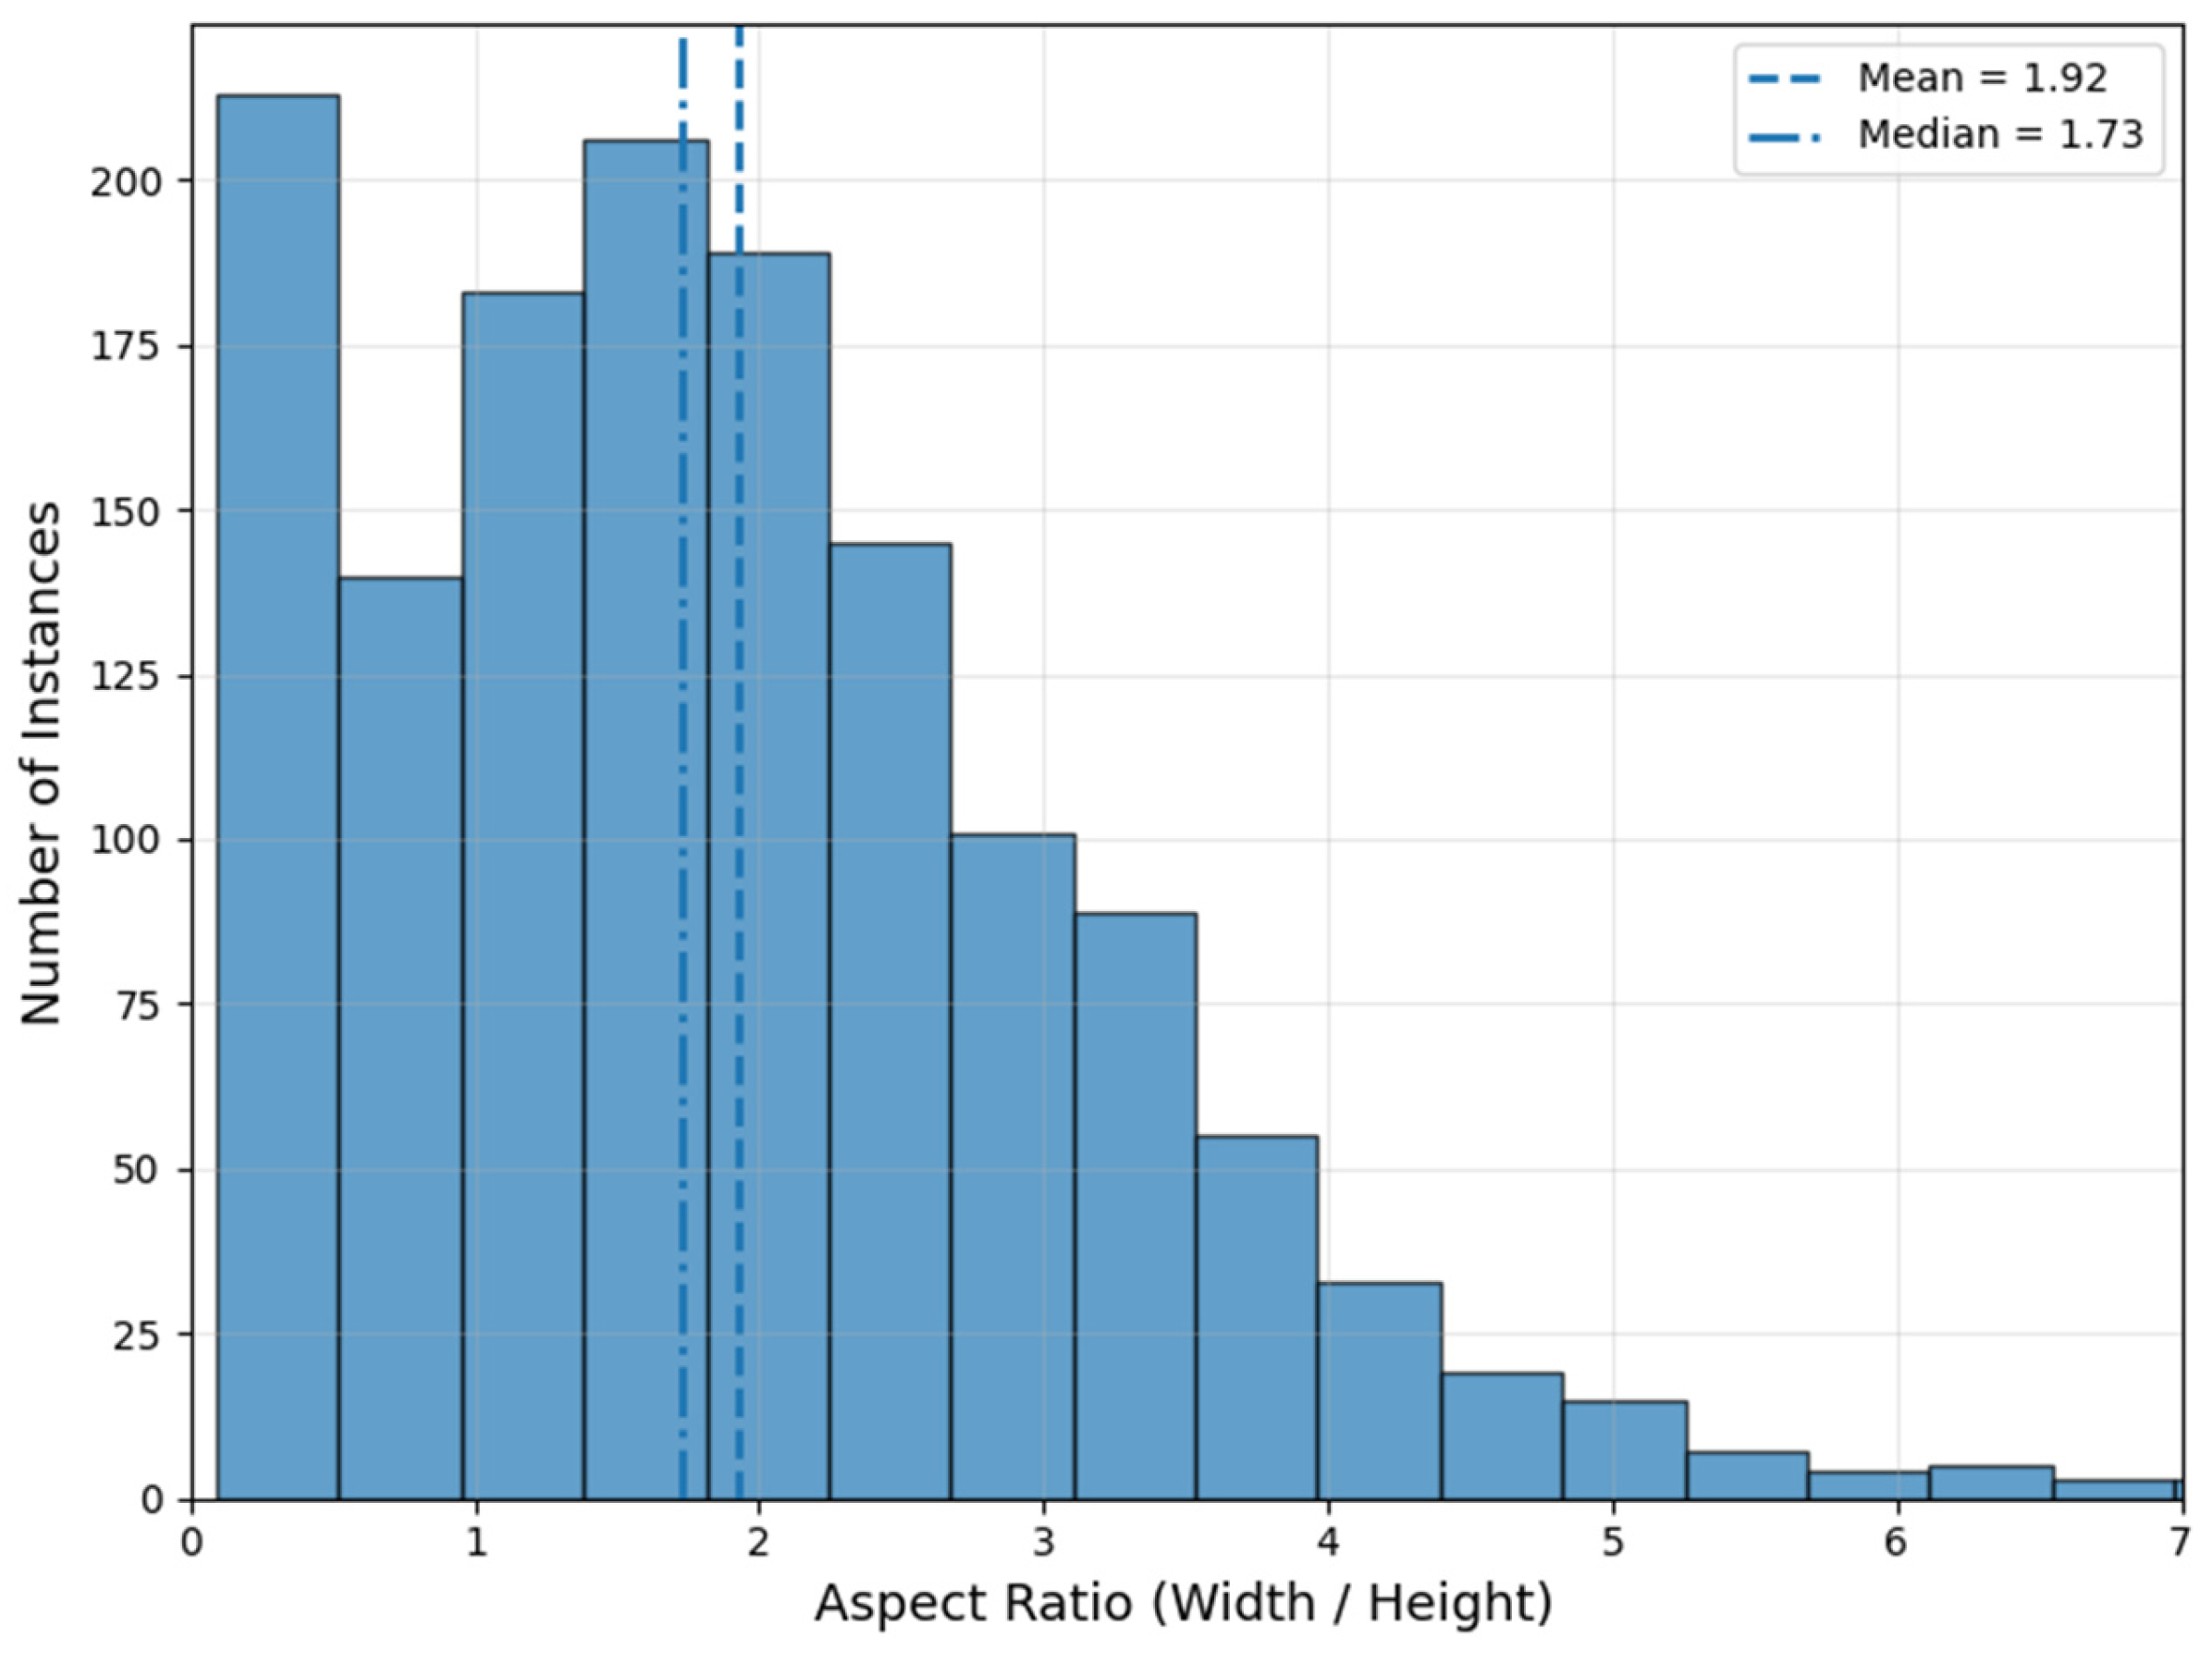
The geometric characteristics of the annotated objects were further analyzed using the aspect ratios of their bounding boxes, computed as the ratio of bounding box width to height. The aspect ratio distribution (
Figure 10) is centered around a median value of 1.73 (mean: 1.92), indicating that most insulator strings occupy elongated image regions rather than approximately square bounding boxes. The interquartile range (0.96–2.64) demonstrates considerable variability in object geometry resulting from differences in insulator-string orientation, perspective, and imaging conditions. A small number of highly elongated instances produce a long right-hand tail in the distribution, reflecting realistic inspection scenarios in which long insulator strings are observed under oblique viewing angles.
4.4. Baseline Evaluation
To demonstrate the suitability of UVInsDet for training and evaluating computer vision methods, a baseline evaluation was conducted using standard object detection and instance segmentation architectures.
The objective of the baseline evaluation was not to establish state-of-the-art performance but to demonstrate that the dataset supports the training and evaluation of contemporary detection and instance segmentation models and to provide reference results for future studies.
The evaluated models included Mask R-CNN and Cascade Mask R-CNN with a ResNet-50 backbone and Feature Pyramid Network (FPN), as well as YOLOv8s-seg as a recent one-stage instance segmentation baseline. Model training was performed using the training subset, while evaluation was conducted exclusively on the test subset. No dataset-specific architectural modifications or hyperparameter optimizations were performed.
The Mask R-CNN and Cascade Mask R-CNN baselines were implemented using the open-source MMDetection framework (v.3.3.0) based on PyTorch (v.2.9.1), whereas the YOLOv8s-seg baseline was implemented using the open-source Ultralytics framework (v.8.4.66). All experiments were performed on a workstation equipped with a single NVIDIA GeForce RTX 3060 GPU.
For the Mask R-CNN and Cascade Mask R-CNN baselines, the ResNet-50 backbones were initialized using publicly available ImageNet-pretrained weights provided through Torchvision, while the remaining model parameters were optimized on the UVInsDet training subset. The models were trained using stochastic gradient descent (SGD) with an initial learning rate of 0.0025, momentum of 0.9, weight decay of 0.0001, a batch size of one image, and a total of 50 training epochs. A linear warm-up schedule followed by a multi-step learning-rate decay was employed during optimization.
The YOLOv8s-seg baseline was initialized using publicly available pretrained weights trained on the COCO dataset and subsequently fine-tuned on the UVInsDet training subset. Training was performed for 50 epochs using the default Ultralytics optimization pipeline with a batch size of four images. The best-performing checkpoint, automatically selected according to the validation performance, was used for the reported evaluation.
Transfer learning was intentionally adopted for all baseline models because the published dataset contains only 398 training images, making training deep neural networks entirely from scratch impractical. All images were processed at their original spatial resolution (1280 × 720 pixels) during both training and inference. Since this corresponds to the native resolution of the released dataset, no additional image scaling was introduced, ensuring consistent experimental conditions across all evaluated architectures.
Several groups of metrics were used for evaluation. First, standard COCO metrics for object detection and instance segmentation were computed, including mAP, AP50, and AP75 for both bounding boxes and segmentation masks (
Table 2). Second, scale-dependent segmentation metrics were analyzed to assess the influence of object size on recognition performance (
Table 3). Third, operationally relevant metrics—including precision, recall, and false alarm probability—were calculated to characterize model behavior under conditions approximating practical deployment scenarios (
Table 4).
Among the evaluated baselines, YOLOv8s-seg achieved the highest overall performance, obtaining the best results for both object detection and instance segmentation according to the standard COCO metrics. The improvement is particularly evident for instance segmentation, demonstrating that the proposed dataset can be effectively used not only with conventional two-stage detectors but also with recent one-stage segmentation architectures.
The cascade architecture demonstrates consistently higher metric values than the baseline Mask R-CNN model for both detection and instance segmentation tasks. This behavior is consistent with previously reported characteristics of cascade-based detectors and indicates the internal consistency of the dataset and its annotations.
Analysis of scale-dependent metrics reveals that object size has a substantial influence on segmentation performance across all evaluated models. According to the COCO standard, objects are classified as small when the bounding box area is less than 322 pixels, medium when the area ranges from 322 to 962 pixels, and large when the area exceeds 962 pixels. Performance consistently increases with object size, reflecting the predominance of small insulator strings in real substation inspection scenes rather than deficiencies in the annotation process.
The metrics reported in
Table 4 complement the standard COCO evaluation by characterizing model behavior under operating conditions that more closely resemble practical deployment. Compared with the two-stage baselines, YOLOv8s-seg achieved the highest precision (0.867) and the lowest false alarm probability (0.133), while exhibiting a slightly lower recall at the selected confidence threshold. This behavior reflects a more conservative operating point on the precision–recall trade-off, producing fewer false detections at the expense of a moderate increase in missed objects. In contrast, the two-stage architectures operated at higher recall levels but generated more false-positive detections.
The reported quantitative results are provided as a reference baseline rather than as optimized benchmarks. No architecture-specific optimization or hyperparameter tuning was performed beyond standard transfer-learning procedures. Consequently, the experiments are intended to validate the suitability of the UVInsDet dataset for training and evaluating contemporary detection and instance segmentation models under realistic substation inspection conditions while providing reproducible reference results for future methodological studies.
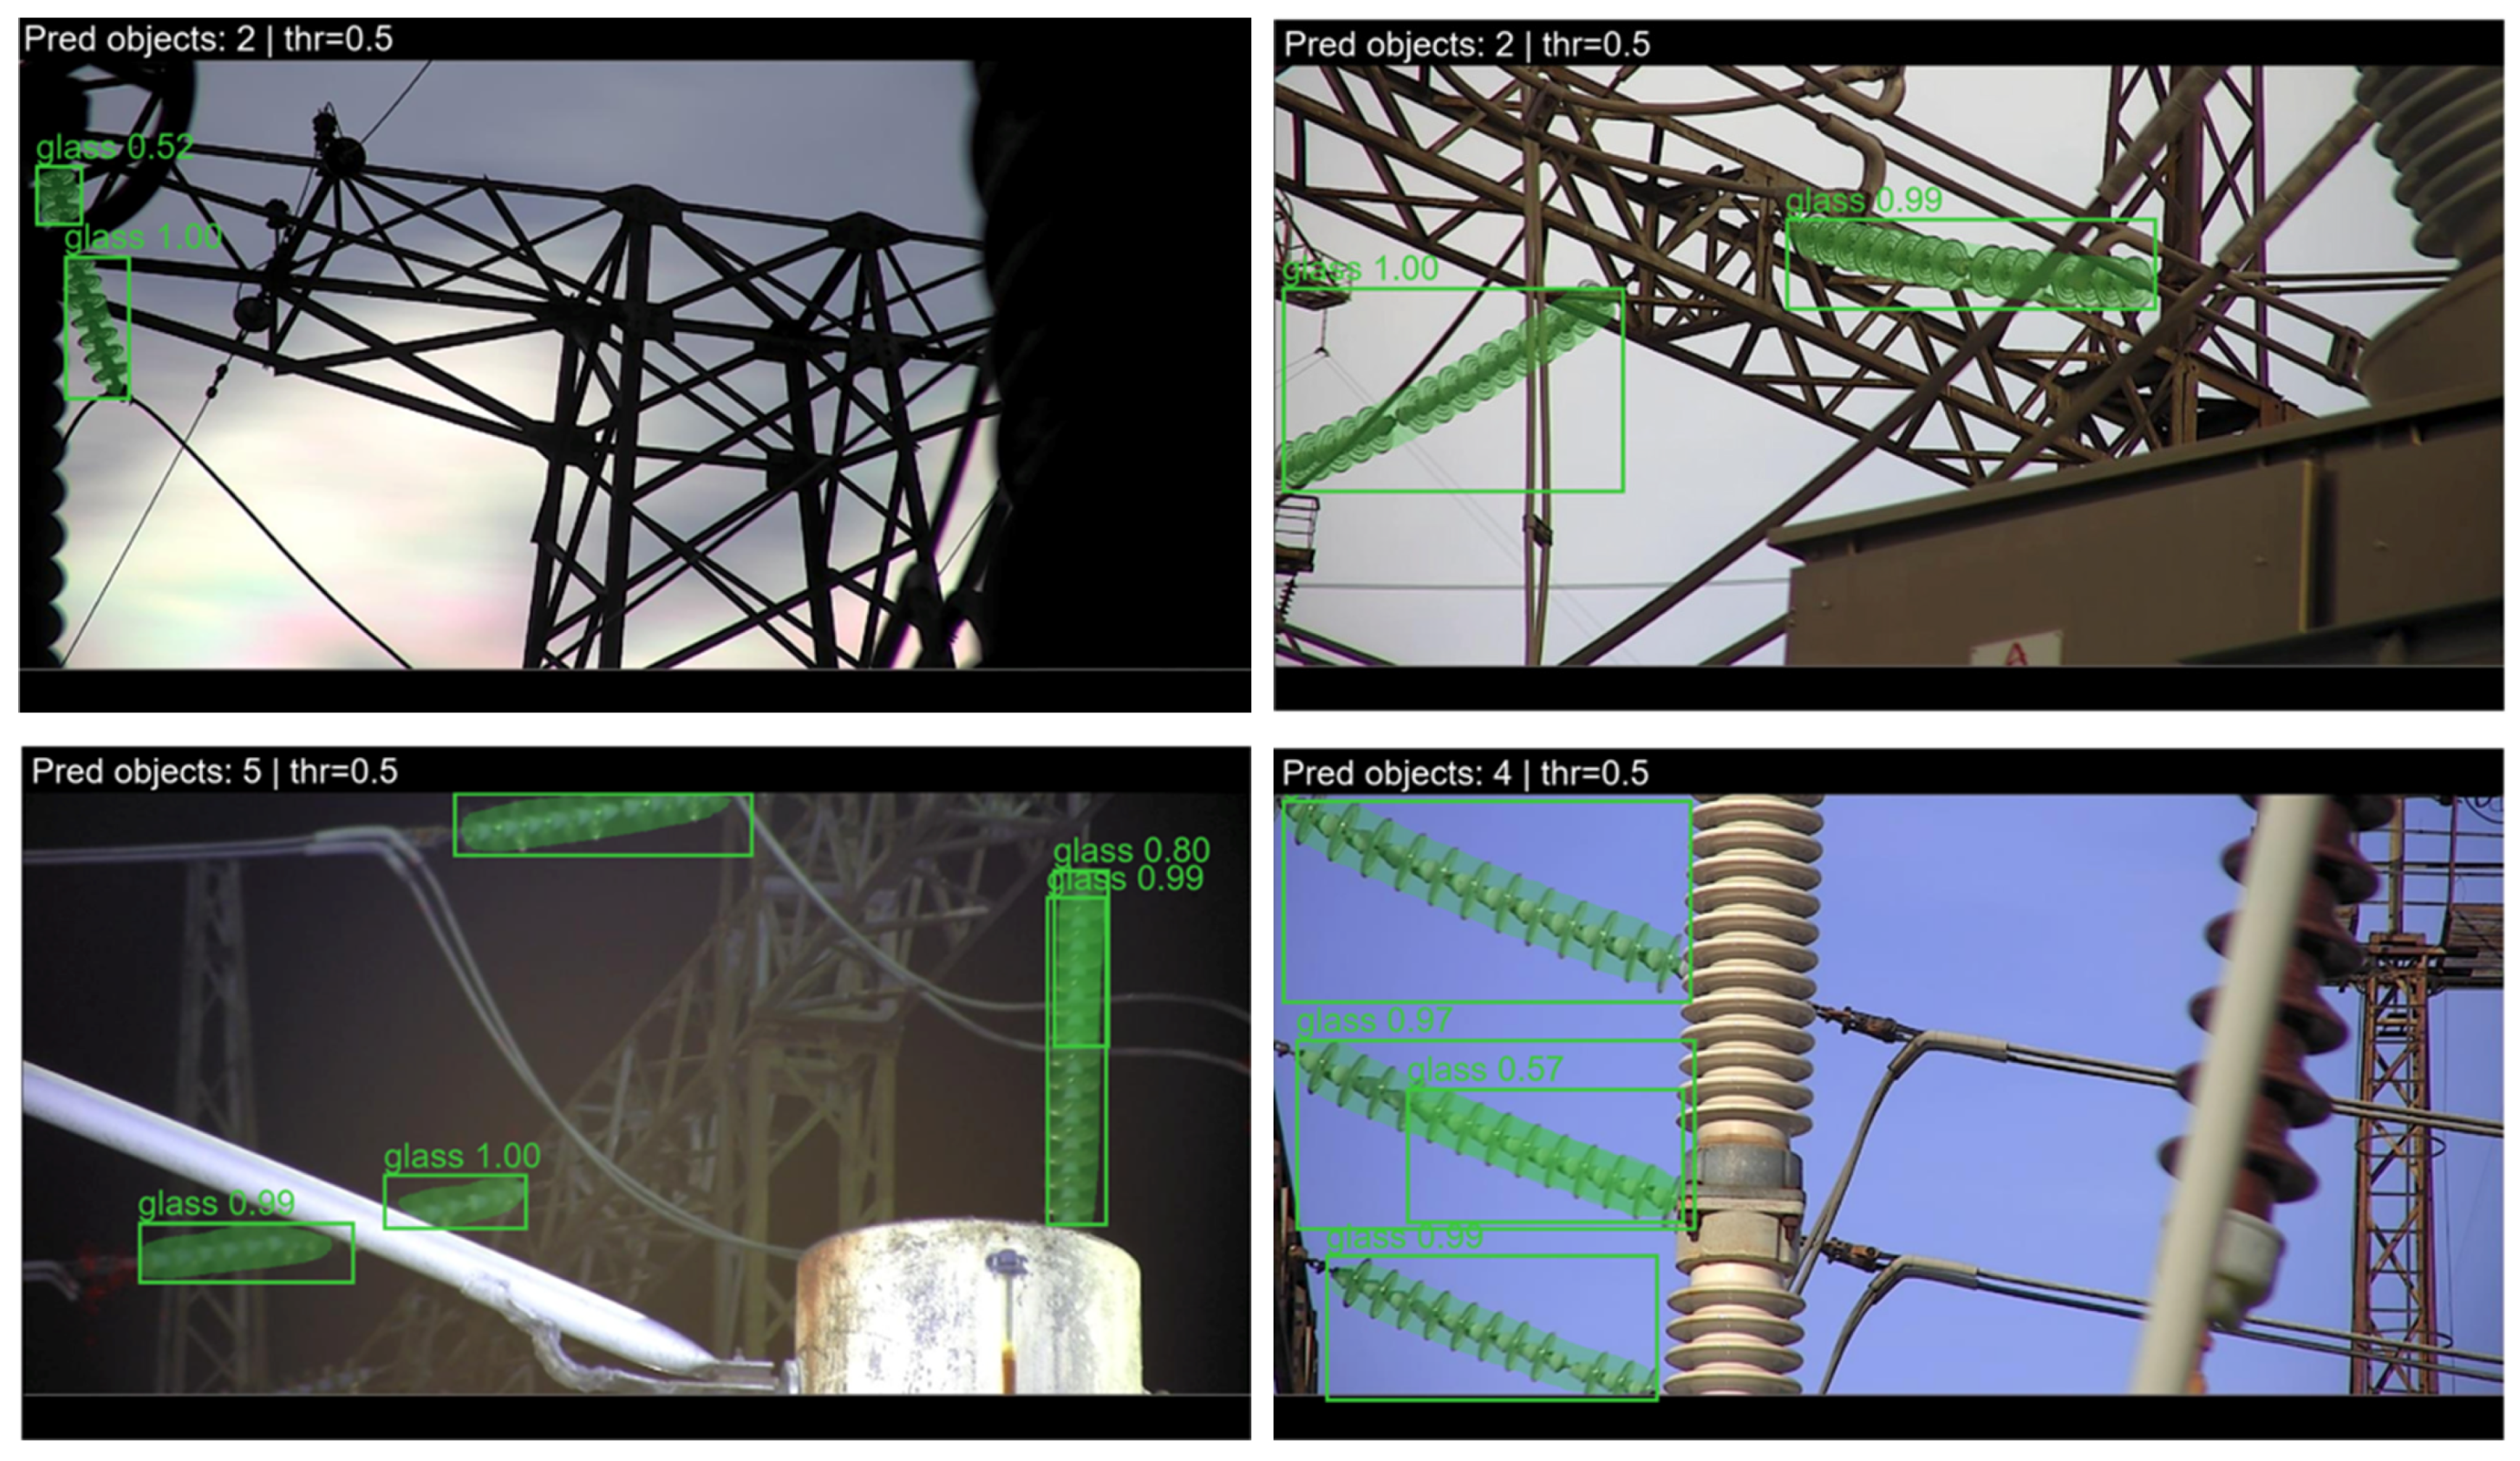
To qualitatively illustrate scene complexity and the characteristics of instance segmentation,
Figure 11 presents examples of predicted masks generated by a baseline model. Typical failure cases include missed detections of very small objects and duplicate detections, where multiple overlapping predictions correspond to the same insulator string.
Predicted instance masks (Mask R-CNN, ResNet-50-FPN) are overlaid on the original RGB images to illustrate scene complexity, object-scale variability, and partial occlusions.
Overall, the statistical characteristics, annotation consistency assessment, and baseline evaluation results indicate that UVInsDet is a structurally consistent and practically usable dataset for computer vision research focused on insulator detection and instance segmentation in complex substation environments.
5. Usage Notes and Limitations
The UVInsDet dataset is intended for use in tasks involving insulator-string detection and instance segmentation in complex industrial environments. The dataset can support the development and evaluation of computer vision models for automated inspection of substation equipment under conditions of high object density, structured industrial backgrounds, and substantial object-scale variability.
Because annotations are provided as pixel-wise instance segmentation masks, the dataset can be used for both instance segmentation and object detection tasks. Conversion of segmentation masks into bounding boxes enables compatibility with a wide range of detection frameworks, while the availability of annotations in the COCO format facilitates integration into standard machine learning workflows.
The dataset may also be used to investigate the robustness of computer vision models under varying observation conditions, including changes in illumination, weather, object scale, and viewing geometry. In addition, the presence of images without target objects enables studies of false-positive behavior and supports the development of recognition systems with improved operational reliability.
The dataset is particularly suitable for research on small-object recognition, domain adaptation, robust visual recognition, and intelligent inspection systems for electric power infrastructure. Furthermore, the visible-spectrum imagery provided by UVInsDet may serve as a visual layer for future multimodal inspection systems integrating visible, ultraviolet, infrared, or other diagnostic modalities.
Several limitations should be considered when using the dataset. First, all images were acquired at a single operational 220 kV substation. Consequently, the dataset reflects a specific equipment configuration and does not encompass the full diversity of substation layouts, voltage classes, and geographic conditions encountered in practice. Second, all images were acquired using a single camera type and optical configuration. Although this reflects a realistic inspection scenario, additional adaptation may be required when transferring models to data acquired using different imaging systems. Third, only glass and porcelain insulator strings are annotated. Other insulating components, including post insulators, as well as insulation defects and degradation indicators, are outside the scope of the present dataset. Finally, the provided masks represent object-level extents of insulator strings and are not intended for segmentation of individual insulator units.
Users should also take into account the pronounced class imbalance present in the dataset, as porcelain insulator strings constitute only a small fraction of all annotated instances. Although this distribution reflects the actual composition of the inspected substation equipment, it may influence both model training and evaluation. In particular, models trained without imbalance-aware strategies may become biased toward the dominant glass-insulator class and may exhibit unstable or poorly calibrated performance for the minority porcelain class. Therefore, class-wise metrics should be reported whenever the dataset is used for multi-class recognition experiments, and aggregate metrics should be interpreted with caution.
Depending on the intended application, additional imbalance-handling strategies may be beneficial. These may include class-weighted loss functions, oversampling of minority-class instances, targeted data augmentation for porcelain insulators, or balanced sampling strategies at the image or instance level. When the objective is robust detection of insulator strings regardless of material type, researchers may also consider reporting additional class-agnostic detection and segmentation metrics.
Furthermore, because the images were acquired using the visible channel of a narrow-angle ultraviolet inspection camera, models pretrained on conventional visible-light datasets may require additional fine-tuning or domain adaptation. The inclusion of negative samples should likewise be considered during model development, as these images play an important role in training systems that are robust to false detections.
6. Conclusions
This paper presents UVInsDet, a publicly available dataset for insulator-string detection and instance segmentation collected during ground-based robotic inspections of an operational 220 kV high-voltage substation. The dataset contains 591 visible-spectrum RGB images and 1415 manually annotated insulator-string instances represented by pixel-wise segmentation masks. The data capture realistic inspection conditions, including dense industrial backgrounds, varying illumination, partial occlusions, substantial object-scale variability, and both positive and negative inspection scenarios.
Unlike most existing publicly available insulator datasets, which primarily focus on overhead transmission lines and UAV-based image acquisition, UVInsDet targets the underrepresented domain of robotic inspection in high-voltage substations. The dataset provides a specialized resource for studying computer vision methods under conditions that more closely reflect practical industrial inspection environments.
The dataset is distributed together with annotations in both LabelMe and COCO formats, metadata files, and auxiliary tools supporting dataset reuse and experiment reproducibility. Statistical analysis, annotation consistency assessment, and baseline model evaluation demonstrate that the dataset is structurally consistent and suitable for training and evaluating detection and instance segmentation algorithms.
UVInsDet can support research on insulator recognition, small-object detection, robust visual recognition, domain adaptation, and intelligent monitoring systems for electric power infrastructure. In addition, the dataset may serve as a visual component within future multimodal diagnostic systems integrating visible, ultraviolet, infrared, and other inspection modalities.
Future extensions of the dataset may include additional substations, imaging configurations, insulation component types, and additional sensing modalities, including infrared and ultraviolet imagery, enabling multimodal datasets for intelligent inspection of power infrastructure.