Article

Sea Grape (Caulerpa racemosa) Kombucha: A Comprehensive Study of Metagenomic and Metabolomic Profiling, Its Molecular Mechanism of Action as an Antioxidative Agent, and the Impact of Fermentation Time

by
Dian Aruni Kumalawati
1,
Reza Sukma Dewi
2,
Noor Rezky Fitriani
3,
Scheirana Zahira Muchtar
2,
Juan Leonardo
4,
Nurpudji Astuti Taslim
5,
Raffaele Romano
6,*,
Antonello Santini
7,* and
Fahrul Nurkolis
8,9,10
1
Biomedical Science Department, Faculty of Science and Technology, State Islamic University of Sunan Kalijaga (UIN Sunan Kalijaga), Yogyakarta 55281, Indonesia
2
Biology Department, Faculty of Science and Technology, State Islamic University of Sunan Kalijaga (UIN Sunan Kalijaga), Yogyakarta 55281, Indonesia
3
Chemistry Department, Faculty of Mathematics and Natural Sciences, IPB University, Bogor 16680, Indonesia
4
Citra Deli Kreasitama Ltd., Banten 15124, Indonesia
5
Division of Clinical Nutrition, Department of Nutrition, Faculty of Medicine, Hasanuddin University, Makassar 90245, Indonesia
6
Department of Agricultural Sciences, University of Napoli Federico II, Via Università, 100-80055 Portici, Italy
7
Department of Pharmacy, University of Napoli Federico II, Via Domenico Montesano, 49-80131 Napoli, Italy
8
Master of Basic Medical Science, Faculty of Medicine, Universitas Airlangga, Surabaya 60132, Indonesia
9
Institute for Research and Community Service, State Islamic University of Sunan Kalijaga (UIN Sunan Kalijaga), Yogyakarta 55281, Indonesia
10
Medical Research Center of Indonesia, Surabaya 60286, Indonesia
*
Authors to whom correspondence should be addressed.
Beverages 2025, 11(5), 134; https://doi.org/10.3390/beverages11050134
Submission received: 13 July 2025 / Revised: 21 August 2025 / Accepted: 1 September 2025 / Published: 5 September 2025

Abstract

Sea grape kombucha has been known to exhibit high antioxidant activity due to its elevated total polyphenol content. This study aims to identify and characterize the active microbial community involved in the fermentation of kombucha using sea grapes (C. racemosa) as the primary substrate. Furthermore, it evaluates the effects of different Symbiotic Culture of Bacteria and Yeast (SCOBY) starter concentrations on the physicochemical properties and antioxidant activity of sea grape kombucha. Our results showed that the pH of the kombucha was higher after 7 days of fermentation compared to later time points. The microbial community was composed of 97.08% bacteria and 2.92% eukaryotes, divided into 10 phyla and 69 genera. The dominant genus in all samples was Komagataeibacter. Functional profiling based on 16S rRNA data revealed that metabolic functions accounted for 77.04% of predicted microbial activities during fermentation. The most enriched functional categories were carbohydrate metabolism (15.70%), cofactor and vitamin metabolism (15.54%), and amino acid metabolism (14.24%). At KEGG Level 3, amino acid-associated pathways, particularly alanine, aspartate, and glutamate metabolism (4.24%), were predominant. The fermentation process in sea grape kombucha is primarily driven by carbohydrate and amino acid metabolism, supported by energy-generating and cofactor biosynthesis pathways. Our findings indicate that different metabolic pathways lead to variations in kombucha components, and distinct fermentation stages result in different metabolic reactions. For instance, early fermentation stages (Day 7) are dominated by amino acid metabolism, whereas the late stages (Day 21) show increased activity in carbohydrate and sulfur metabolism. Metabolomic analysis revealed that increasing the SCOBY starter concentration significantly influenced pH, soluble solid content, vitamin C, tannin, and flavonoid content. These variations suggest that fermentation duration and microbial composition significantly influence the spectrum of bioactive metabolites, which synergistically provide functional benefits such as antimicrobial, antioxidant, and metabolic health-promoting activities. For example, sample K1 produced more fatty acids and simple sugar alcohols, sample K2 enriched complex lipid compounds and phytosterols, while sample K3 dominated the production of polyols and terpenoid compounds.

Graphical Abstract

1. Introduction

Marine macroalgae represent a valuable biological resource with significant potential in the development of functional foods, owing to their richness in bioactive compounds such as polysaccharides, proteins, and various pharmacologically active secondary metabolites [1,2]. One notable species with high nutritional and economic value is Caulerpa racemosa (C. racemosa), commonly referred to as sea grapes. This green macroalga is extensively cultivated across East and Southeast Asia, particularly in the Philippines, Indonesia, and Vietnam, and is traditionally consumed as a functional food [3].
C. racemosa has been reported to contain a range of essential bioactive compounds, including proteins, polysaccharides, flavonoids, polyphenols, and antioxidants, along with secondary metabolites such as terpenoids, oxylipins, phlorotannins, and volatile hydrocarbons [4,5]. Its nutritional profile is also noteworthy, characterized by a low-fat content (0.08–1.9%) and a relatively high protein content (17–27%), making it a promising candidate for plant-based protein sources [6]. Furthermore, several studies have demonstrated its anti-obesity activity, including the reduction in blood glucose and total cholesterol levels, as well as the upregulation of Peroxisome Proliferator-Activated Receptor Gamma Coactivator 1-alpha (PGC-1α), a transcriptional coactivator involved in energy metabolism regulation [7,8,9].
Innovative applications of C. racemosa, particularly in the form of fermented products such as kombucha, have emerged as a promising strategy in the functional food sector. Kombucha is a fermented beverage produced through the symbiotic interaction of lactic acid bacteria, acetic acid bacteria, and yeasts within a Symbiotic Culture of Bacteria and Yeast (SCOBY). Kombucha formulated with C. racemosa as a substrate has demonstrated potential anti-obesity and anti-aging effects by modulating lipid profiles, notably reducing total cholesterol, triglycerides, and low-density lipoprotein (LDL), while enhancing high-density lipoprotein (HDL) levels [8,9,10].
The fermentation process in kombucha is driven by a complex microbial consortium, the composition of which is influenced by various factors such as substrate origin, geographical production area, fermentation conditions, and the specific composition of the SCOBY used [11]. These microbial communities are actively involved in key metabolic pathways, including carbohydrate, amino acid, and lipid metabolism; secondary metabolite biosynthesis; energy production and conversion; and the metabolism of various organic acids [12,13,14]. A comprehensive understanding of the microbial community dynamics involved in kombucha fermentation using C. racemosa is essential to optimize the product’s functional quality and health benefits. Molecular approaches based on DNA/RNA analysis, particularly Next Generation Sequencing (NGS), have proven effective in characterizing the microbial diversity and functional roles in fermented food ecosystems [15].
Meanwhile antioxidant activity in kombucha is influenced by its secondary metabolite and vitamin C content. Augusta et al. [16] demonstrated that sea grape kombucha exhibited the highest antioxidant activity due to its elevated total polyphenol content. However, their study did not further investigate specific subclasses of polyphenolic secondary metabolites, such as tannins and flavonoids, which are known to contribute significantly to antioxidant capacity. In contrast, a study by Puspitasari et al. [17] reported a positive correlation between vitamin C levels and antioxidant activity in tea kombucha. Vitamin C functions as a potent antioxidant that can repair cellular and skin tissue damage caused by oxidative stress. Nonetheless, the presence and role of vitamin C in sea grape kombucha have yet to be investigated, underscoring the need for further analysis in this context. pH values and soluble solid content are also important parameters in evaluating kombucha. pH testing is essential for determining the safety of the beverage for consumption, while TDS analysis provides insight into the total concentration of dissolved substances present.
This study aims to identify and characterize the active microbial community involved in the fermentation of kombucha using C. racemosa as the primary substrate. Furthermore, it evaluates the effects of different SCOBY starter concentrations on the physicochemical properties and antioxidant activity of sea grape kombucha. Parameters such as pH, total dissolved solids, vitamin C content, tannin content, flavonoid content, and antioxidant activity were measured. The findings are expected to contribute to a better understanding of the functional potential of sea grape kombucha as a novel fermented beverage.

2. Materials and Methods

2.1. Methods for Metagenomic Analysis

2.1.1. Preparation of Sea Grape Kombucha

Preparation of kombucha tea from sea grapes follows the method of Permatasari et al. [10] namely, fresh sea grapes were dried in an oven at 25 °C for about 5 h to lower water activity and temporarily suppress native epiphytic microbiota prior to controlled inoculation, improving microbiological consistency and safety [18]. Drying also standardizes the matrix on a dry-weight basis so fixed solid-to-liquid ratios yield reproducible extraction and fermentation kinetics [19]. Low-temperature dehydration helps retain phenolics and other bioactives compared with hotter methods, preserving functional attributes desired in the finished kombucha [20]. Next, the dried sea grapes were pulverized using a blender (WARING 8010 BU Laboratory Blender, Waring Commercial, Stamford, CT, USA). The main formulation for all kombucha tea samples was 12.5 g dried sea grape powder, 500 mL water, and 50 g SCOBY gel and starter solution (LilyGold Organic, UIN Sunan Kalijaga Laboratory, Yogyakarta, Indonesia), with the addition of 50 g Trigona sapiens honey 20% (v/v) (Klanceng, Madu Murni Juragan, Yogyakarta, Indonesia). The length of fermentation time was varied at 7 days, 14 days, and 21 days to determine differences in the diversity and number of microbes contained in sea grape kombucha [21].

2.1.2. Sea Grape Kombucha pH Value Analysis

pH testing has been carried out using a digital pH meter that has been calibrated with pH 4 and 7 buffers. The pH testing procedure follows Azizah et al. [22], with readings taken at the end of fermentation for each sample, specifically at 7 days, 14 days, and 21 days.

2.1.3. Sea Grape Kombucha Sugar Content Test

Testing sugar content was determined using a refractometer (PAL-α Digital Hand-held, ATAGO Co., Ltd., Tokyo, Japan) and was carried out at the end of fermentation on each sample, and at 7 days of fermentation, 14 days of fermentation, and 21 days of fermentation. The test results were determined by the concentration of soluble solids (°Brix) calibrated with distilled water as a blank. Before the reading process, calibration is carried out using distilled water as a blank. Then, the testing process is initiated by dripping the sample liquid onto the prism, after which the device automatically performs the calculation. The higher the sugar content in the sample, the higher the refractive index, so that the refractometer will show a larger scale. Because ethanol interferes with refractometric °Brix, ethanol was quantified by headspace GC-FID, and reported residual sugars from HPLC; refractometer values are presented only as total soluble solids, not as sugar concentration.

2.1.4. Metagenome DNA Extraction

Sea grape kombucha was fermented according to variations of 7 days, 14 days, and 21 days. Furthermore, metagenome DNA extraction was carried out on each sample by scraping the new SCOBY layer formed from the kombucha fermentation process. The metagenome DNA extraction method follows the modified method of Guerra et al. [23]. SCOBY gel from kombucha samples in each fermentation variation was crushed, and the resulting liquid was taken as much as 2 mL and put into a microtube. The sample DNA was extracted using the CTAB method.
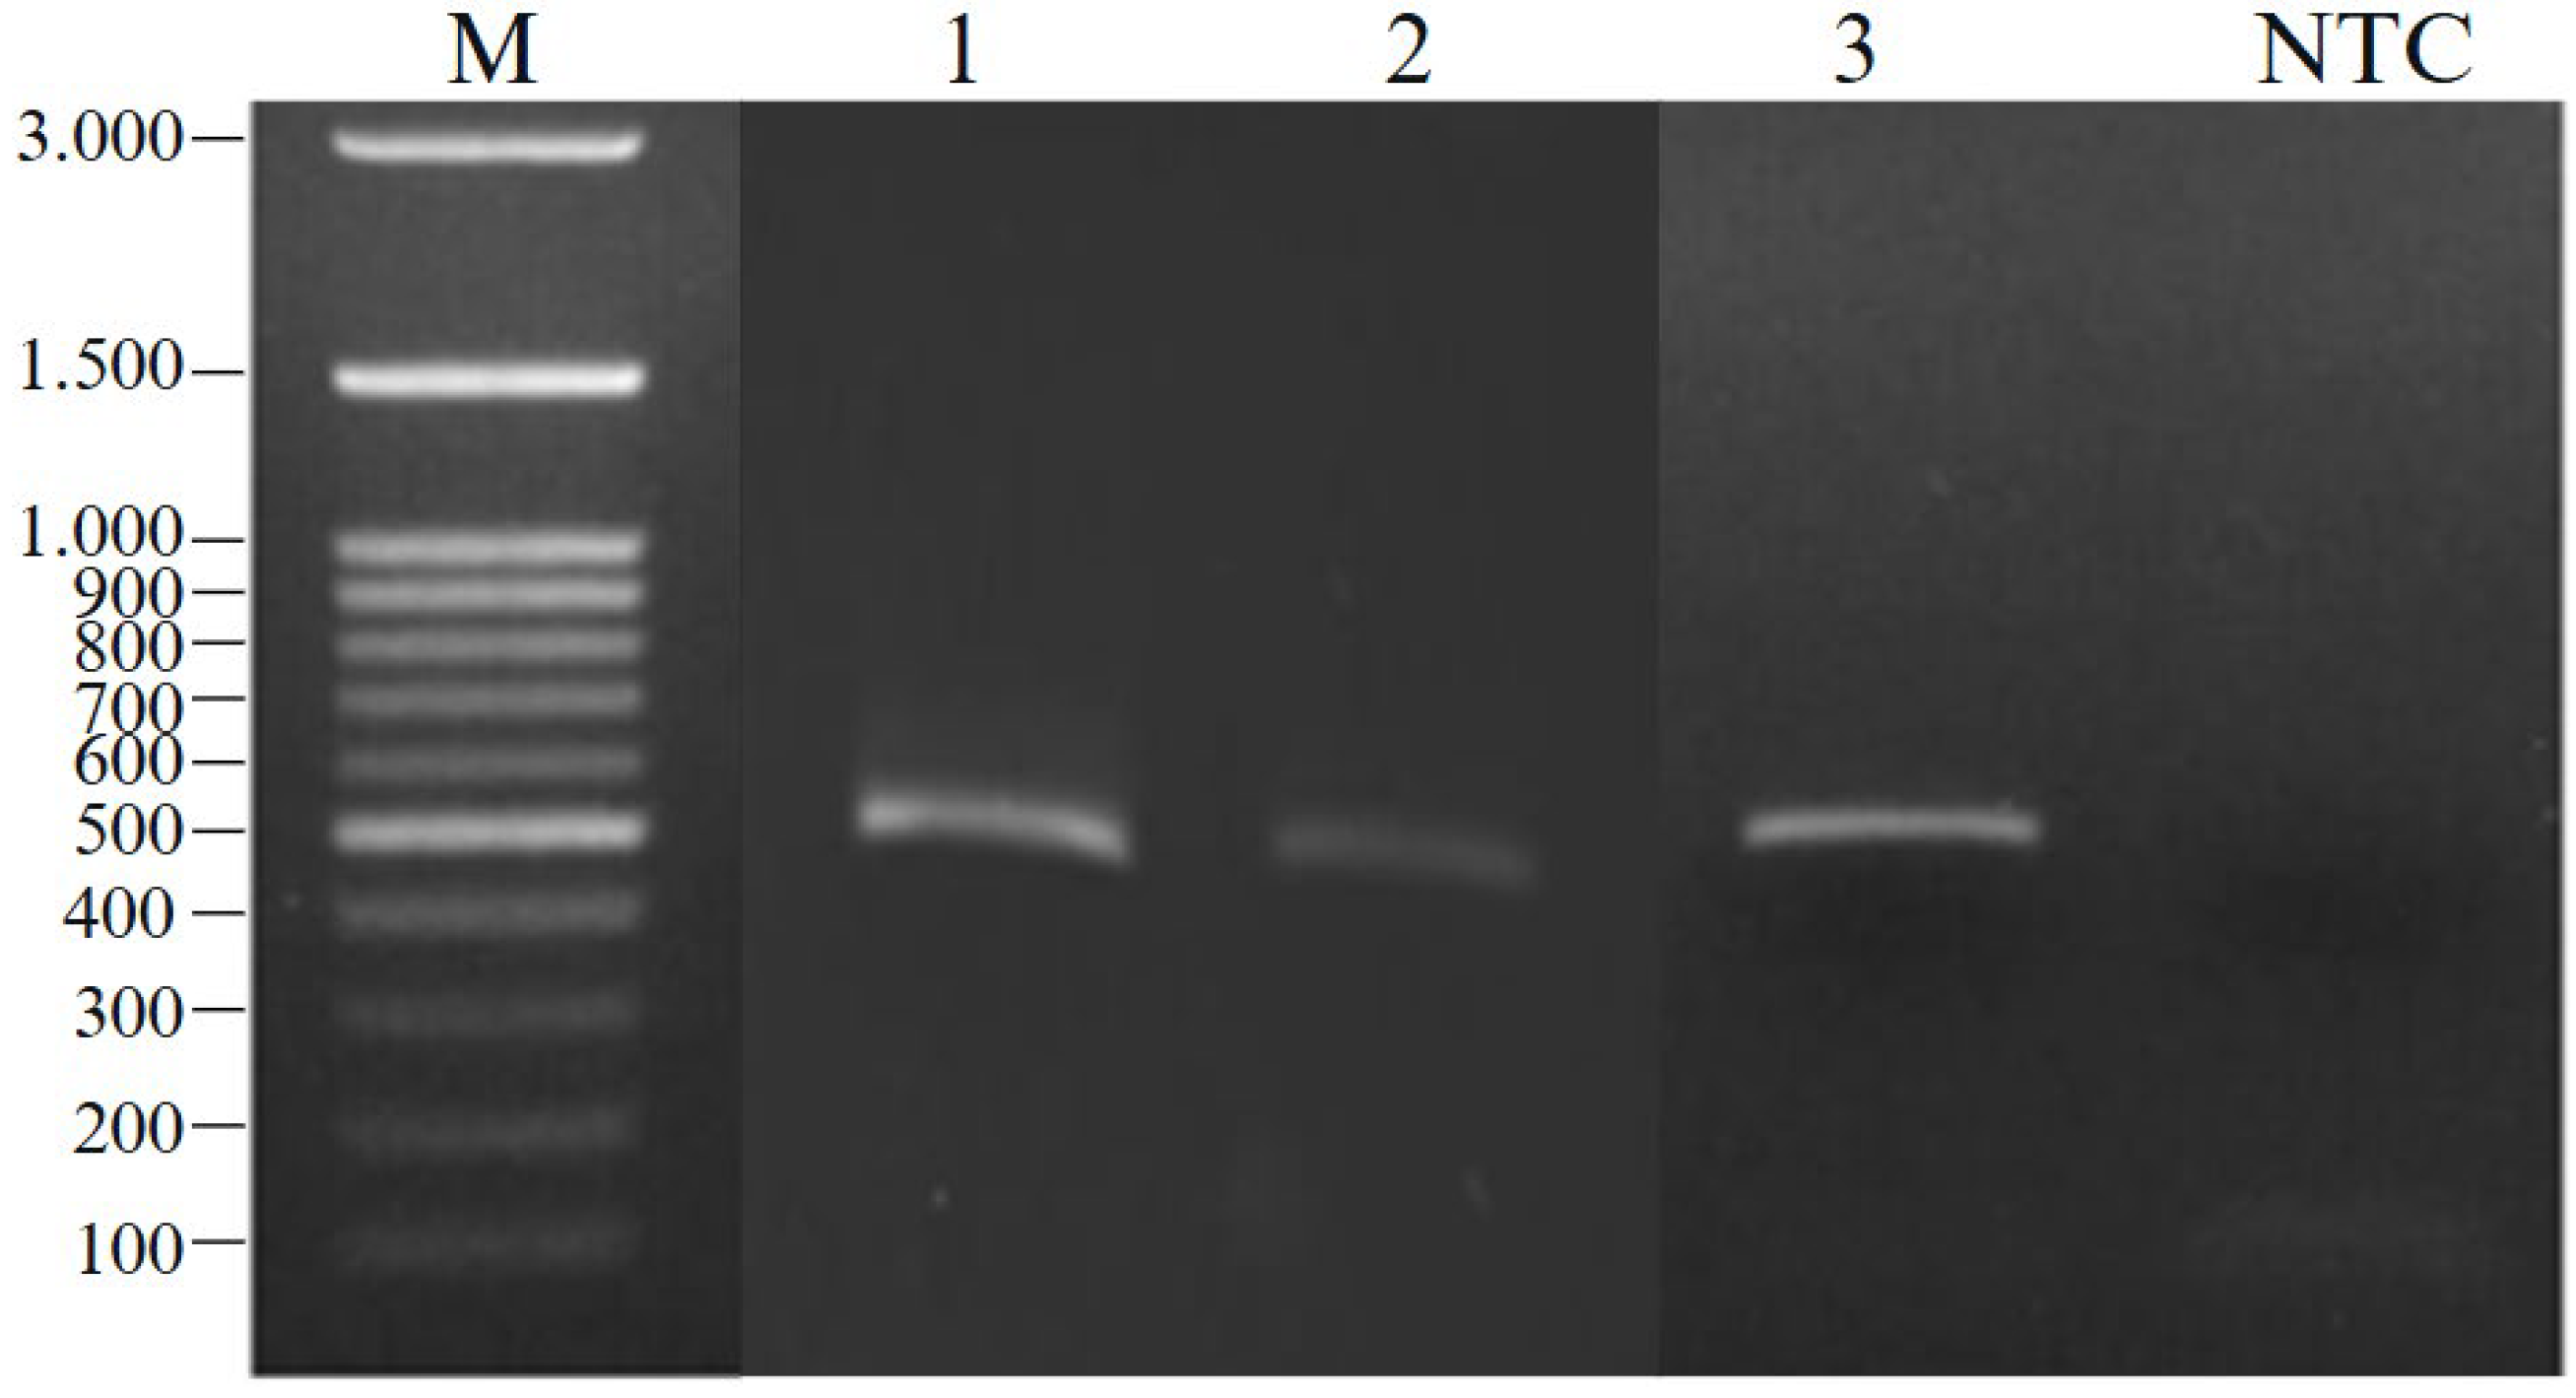
The total DNA amplification process was performed using PCR targeting the 16S rRNA gene. Each microtube contained a total volume of 30 µL, which included 15 µL of PCR mix (Dream Taq Green, Thermo Fisher Scientific Baltics UAB, Vilnius, Lithuania), 1 µM of primer 341F (5′-CCTAYGGGRBGCASCAG-3′), 1 µM of primer 806R (5′-GGACTACNNGGGTATCTAAT-3′), 2 µL of DNA sample (template), and 7 µL of nuclease-free water. DNA amplification was carried out for 35 cycles. The results of the amplification were evaluated using electrophoresis on a 1% (w/v) agarose gel. The gel was prepared by dissolving 0.25 g of agarose in 25 mL of 1× TBE buffer (Tris-borate-EDTA) by heating. The successfully amplified DNA sample produced a bright band under UV light (ChemiDoc MP imaging system) within the size range of 470–500 bp when compared to the 1 kb ladder marker.

2.1.5. Sequencing of Bacterial 16S rRNA Genes from Kombucha and Bioinformatics Analysis

The results of total DNA isolation with a concentration of more than 20 ng/µL were sent to Genetika Science Company (Tangerang, Banten, Indonesia) for Next Generation Sequencing (NGS) using the Illumina MiSeq platform (PE300). The primers used were 16S rRNA region V3–V4 (341F: 5′-CCTAYGGGRBGCASCAG-3′; 806R: 5′-GGACTACNNGGGTATCTAAT-3′) with a sequence length of 400–500 bp [24].
Bioinformatics analysis of the sequencing results began with sequencing of adapter primers and the PCRs of paired-end reads were removed using Cutadapt. DADA2 was used to correct sequencing errors and remove low-quality sequences and chimera errors. The resulting ASV data were used for taxonomic classification against the SILVA (silva_nr99_v138.1) (16S) database. Downstream analysis and visualization were performed using packages in RStudio (R version 4.2.3) (https://www.R-project.org/, accessed on 10 January 2025) and Krona Tools (https://github.com/marbl/Krona, accessed on 10 January 2025). Relative abundance was analyzed based on the relative number of taxa in each sample and then displayed by taxa of Phylum and Genus.

2.1.6. Initial 16S rRNA Data Processing and ASV Construction

16S rRNA data were processed using the DADA2 tool on the usegalaxy.eu (accessed on 10 January 2025) website (Galaxy version 1.30.0+galaxy0) into ASV (Amplicon Sequence Variants) data and taxonomic tables. This process begins with inspection and visualization of forward and reverse data quality using: (1) dada2: plotQualityProfile tool, followed by (2) dada2: filterAndTrim, which filters and trims data to remove low-quality bases and adapters with the parameters reported in Table 1.
The data is then processed with (3) dada2: learnErrors to determine the sequencing error rate in the forward and reverse data, and (4) dada2: dada or denoising to correct sequence errors. The separated forward and reverse data were then processed with (5) dada2: mergePairs, or dereplication to unify identical sequences. ASV (Amplicon Sequence Variant) data construction is performed with (6) dada2: makeSequenceTable, followed by (7) dada2: remove Bimemra Denovo to detect, identify, and discard chimera sequences, and ending with taxonomy formation by referencing the ASV data on the SILVA database version 138 file with (8) dada2: assignTaxonomy. The ASV data were saved in FASTA format, while the taxonomy table was saved in tabular format (TSV) for subsequent analysis [25,26].

2.1.7. Functional Profiling with PICRUST V3.4

PICRUST2 V3.4 (Phylogenetic Investigation of Communities by Reconstruction of Unobserved States) is a software designed to predict functional abundance based on marker gene sequences. The initial stage of ASV data processing is performed by mapping the sequence data with a phylogenetic tree reference using the tool (1) PICRUST2: Sequence placement based on the output of three tools; HMMER (http://www.hmmer.org, accessed on 11 January 2025) to place ASV data, EPA-ng8 to determine the optimal position of ASV data on the reference phylogeny (Barbera et al., 2019), and GAPPA9 to convert the JSON-based file format (place) into newick [27].
The phylogenetic tree data were then processed with (2) PICRUST2: Hidden state prediction that uses castor R package [27] to predict functional genes based on phylogenetic position. This tool can predict metabolic functions or pathways that cannot be observed directly in microbial communities, but can be obtained by referring to community taxonomy or the presence of certain genes. The output obtained is tabular data containing predictions of 16S marker gene abundance, gene family abundance in the form of KO (KEGG Orthology) and EC (Enzyme Commission). The next stage is functional prediction using (3) PICRUST2: Metagenome prediction. Input data are ASV abundance table, 16S marker gene abundance table, and gene family abundance in the form of KO (KEGG Orthology) or EC (Enzyme Commission). The final data generated is a pathway abundance table based on EC and KO values.
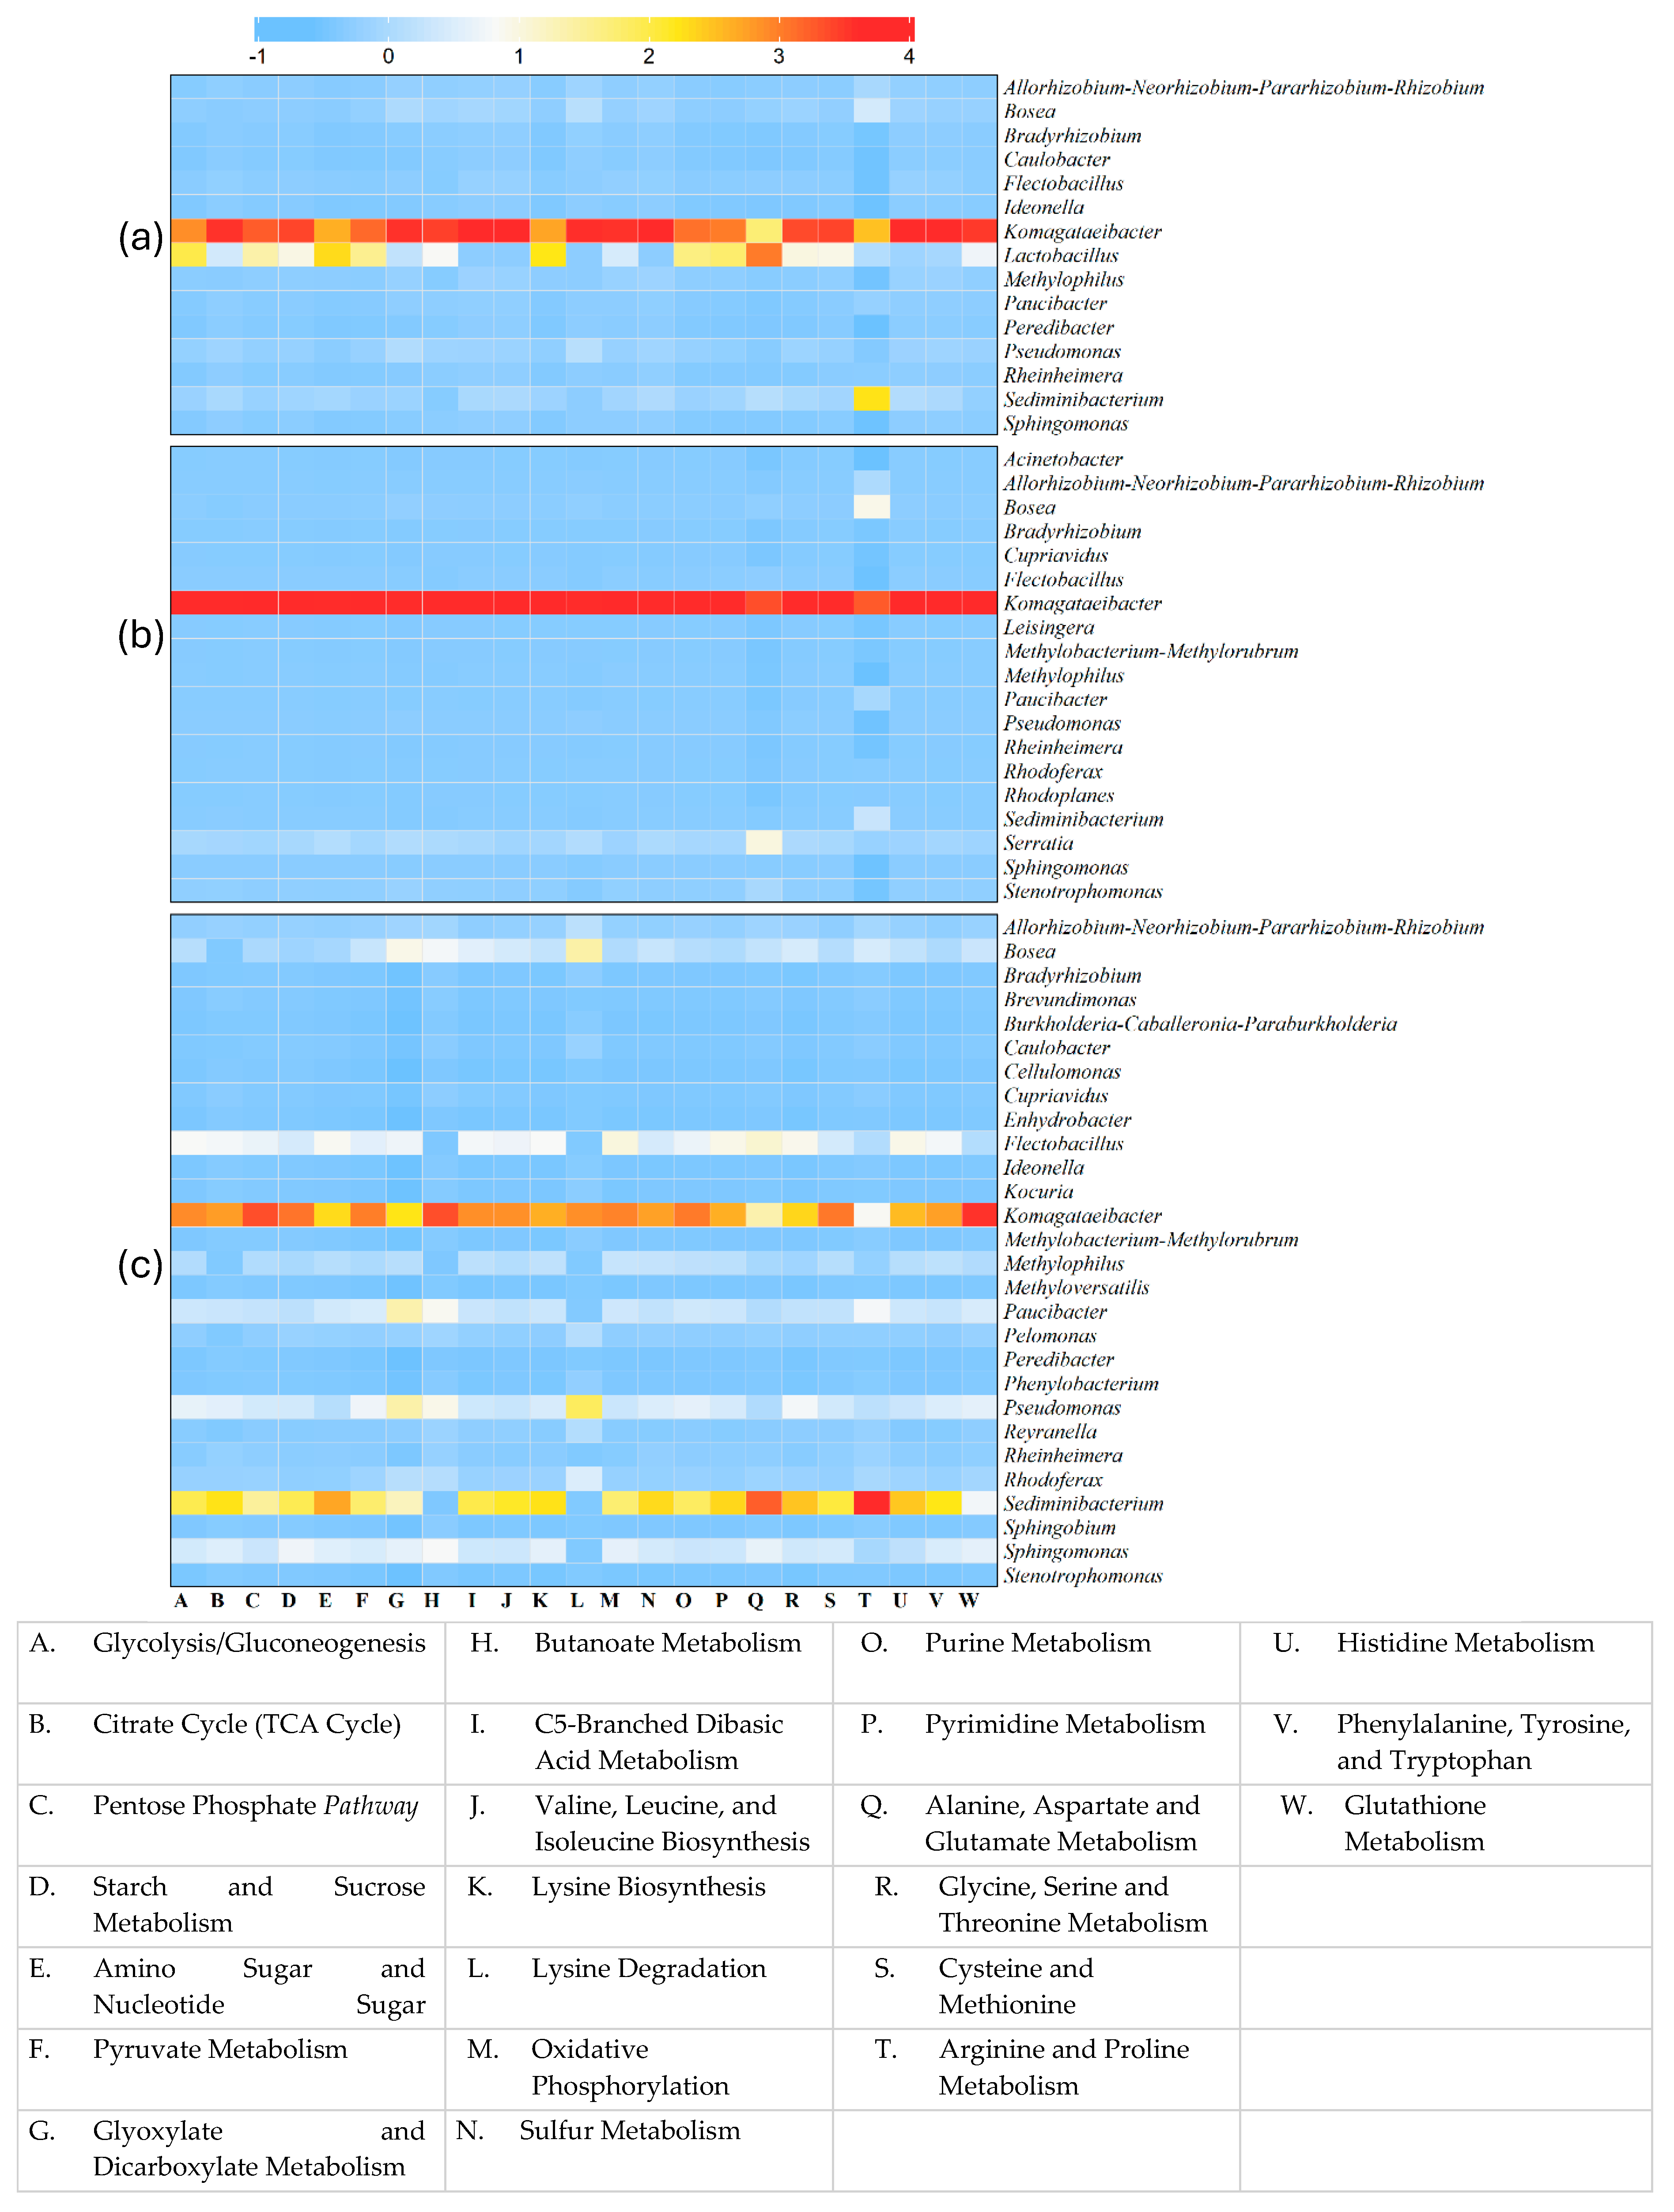
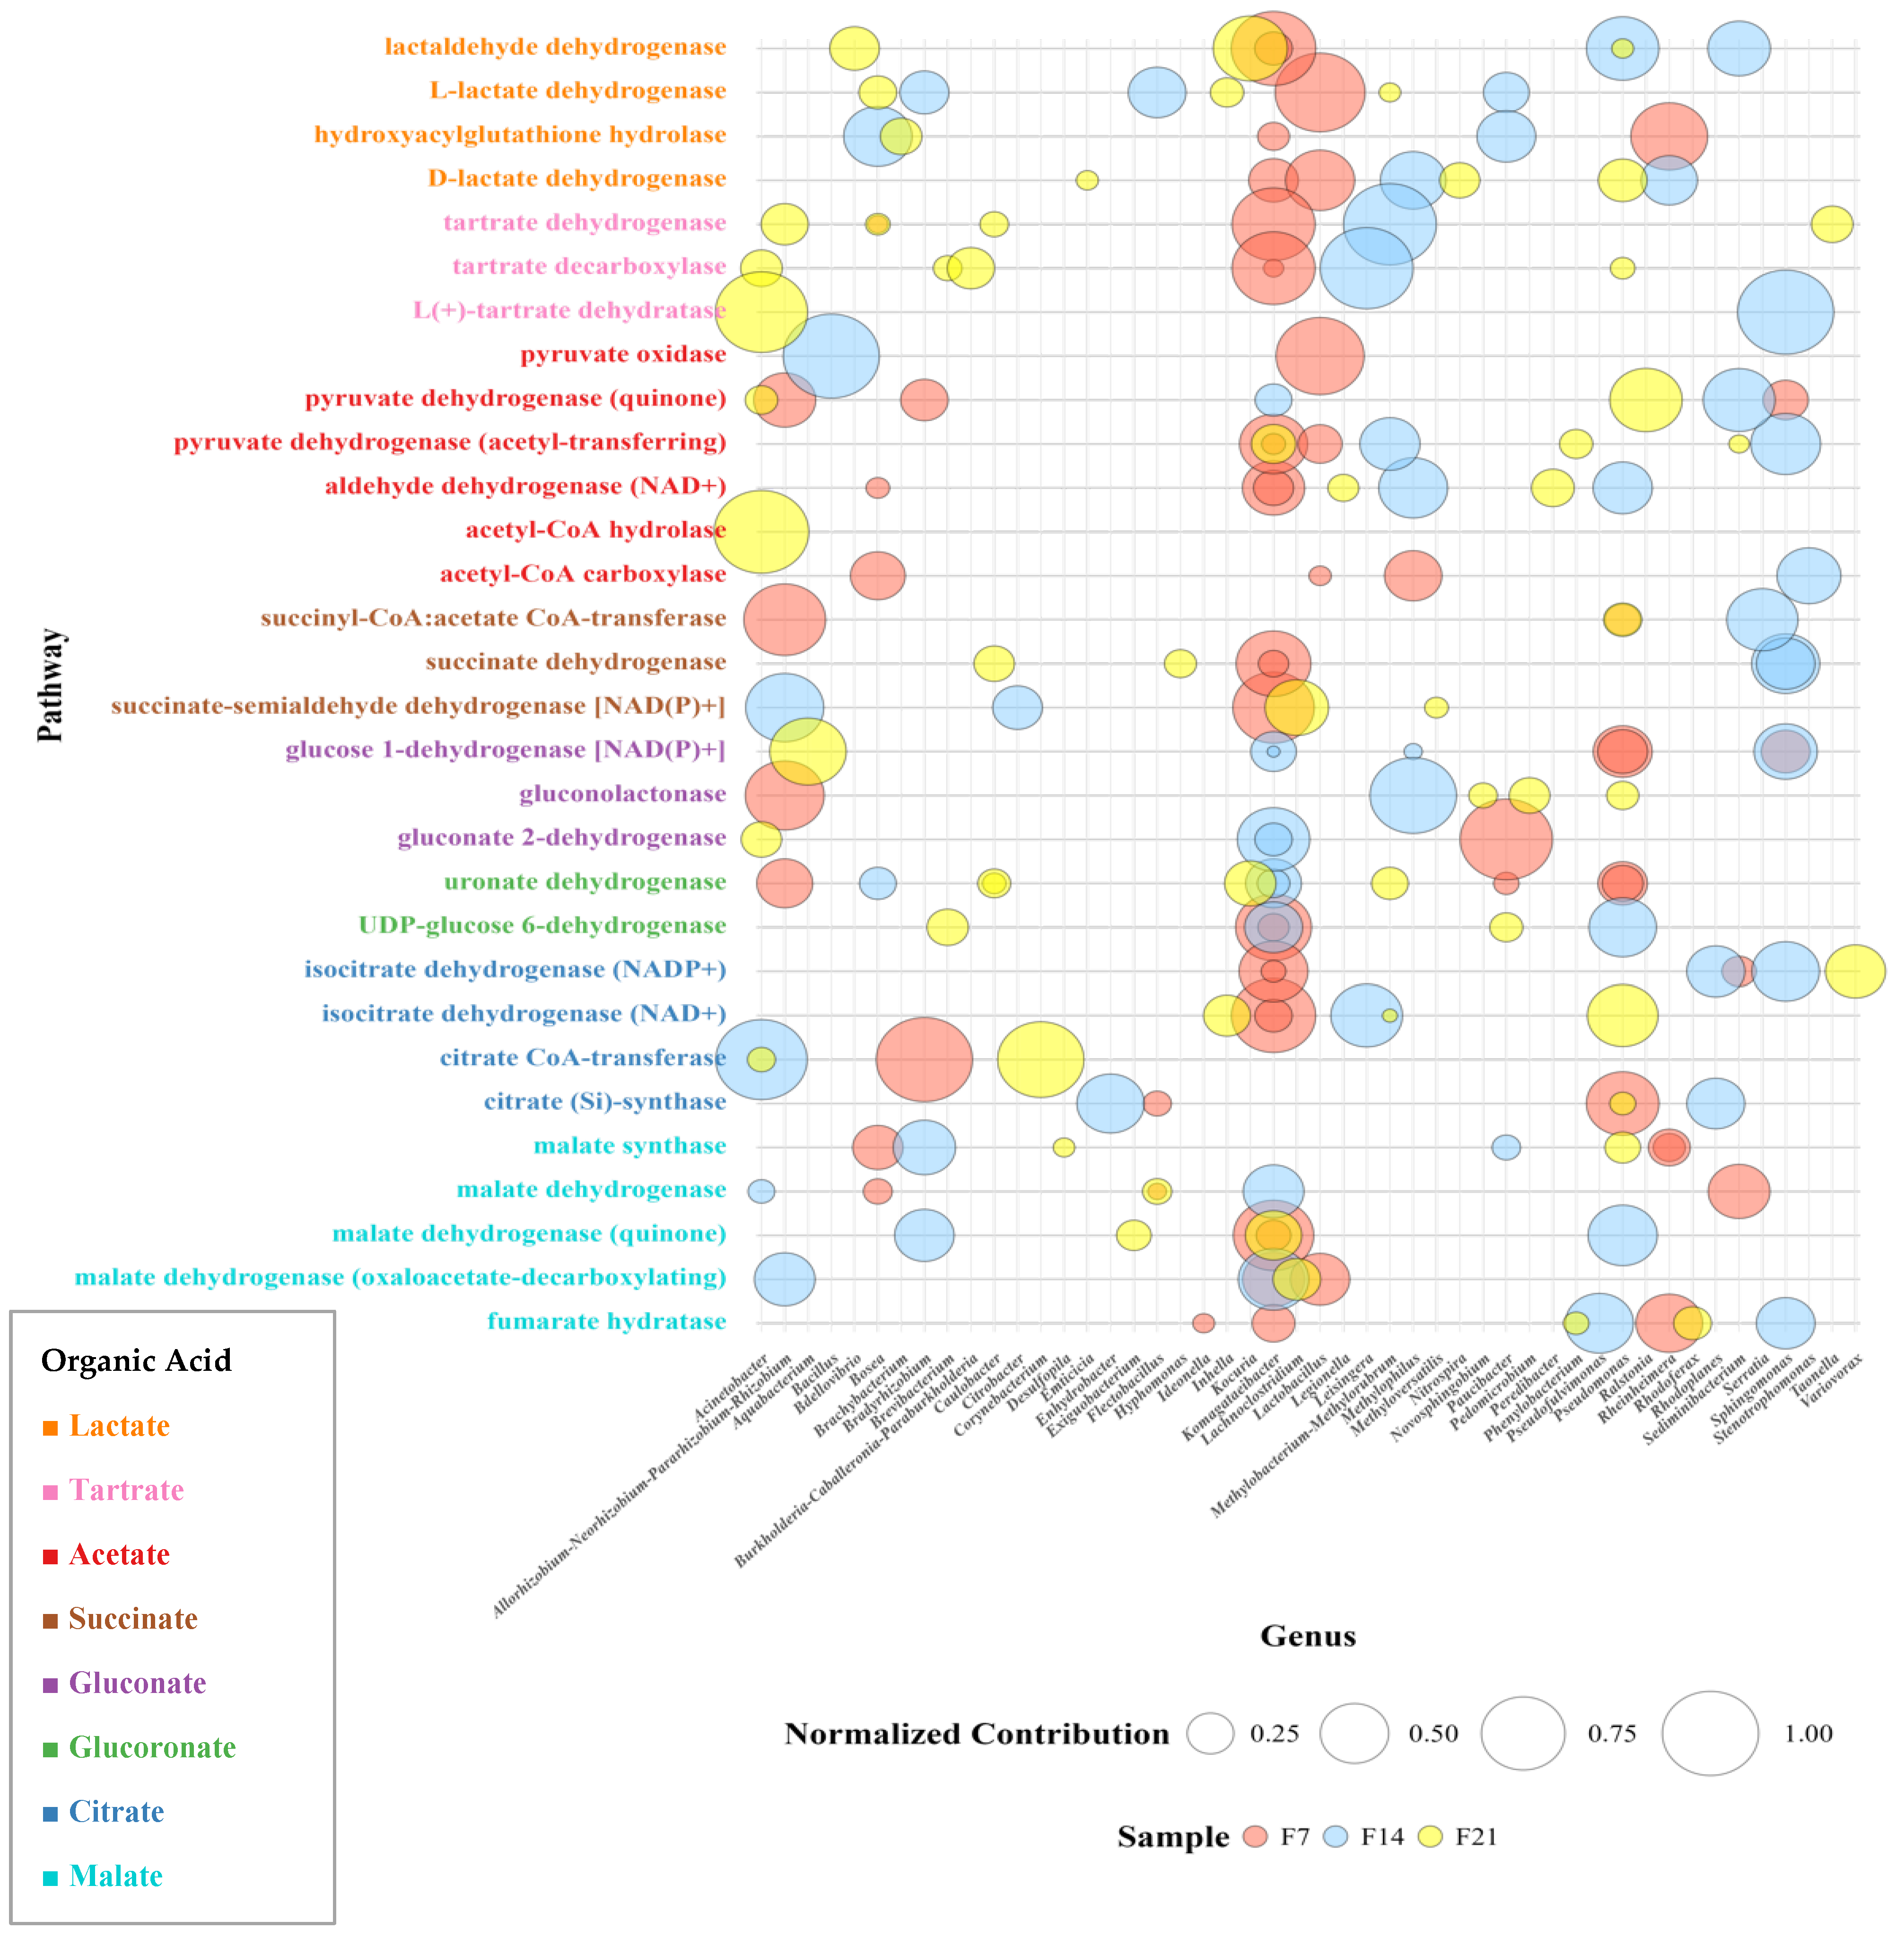
Analysis of the data obtained was presented in a qualitative descriptive manner. Taxonomic and functional pathway data with relative abundance below 0.1% were discarded using the genefilter_sample and prune taxa functions of the phyloseq R package version 1.36.0 [28]. The final data were visualized in three forms: a simple bar chart to show the relative abundance in different pathways, a heatmap to show the cumulative contribution of bacterial communities in each metabolic pathway, and a bubble plot to visualize the correlation between bacterial communities in each enzymatic pathway. The formation of the heatmap was performed with ComplexHeatmap R package version 2.20.0, while the formation of the bubble plot with ggplot2 R package version 3.5.1.

2.2. Methods for Metabolomic Analysis

2.2.1. Preparation of Sea Grapes

Sea grapes (C. racemosa) were collected from the Carita Anyer beach in the district of Pandeglang Regency, Banten Province, Indonesia (coordinates: 6° 16′ 58.8″ S, 105° 51′ 3.6″ E). Sea grapes were sorted and washed with running water, and soaked for 3 days [29]. Next, the samples were drained, weighed, and then dried in the sun for 3–4 days. After that, the sea grapes were ground in a blender, and then filtered to obtain sea grape powder. The sea grape powder was then stored in a sealed glass container [7] at room temperature (25 °C ± 2 °C).

2.2.2. Preparation of Sea Grape Infusion

A total of 50 g of sea grape powder was weighed and placed into a beaker. Meanwhile, 1 L of distilled water was heated to boiling point and then poured into the beaker containing the sea grape powder. The mixture was stirred for 15 min until homogeneity. Afterward, the seaweed solution was separated from the residue by filtration using a filter cloth (100 mesh). One hundred grams of Trigona honey were then added, and the mixture was stirred until the honey was fully dissolved. The resulting mixture was subsequently filtered using a Buchner filter and labeled as control sample (K0). Control was freshly prepared on the same day of analysis to ensure consistency and avoid degradation.

2.2.3. Preparation of Sea Grape Kombucha for Metabolomic Analysis

Preparation of kombucha tea from sea grapes followed the method of Augusta et al. [16] with slight modifications. The main formulation for all kombucha sea grape samples is 50 g of sea grapes, 1 L of boiling water, and 80 g of SCOBY gel, with the addition of 100 g of Trigona sapiens honey. Each sample treatment has variations in the concentration (K1 10%; K2 15%; K3 20%) of w/v SCOBY starter solution. All samples were put in a glass beaker and anaerobic conditions at room temperature (29 °C ± 2 °C) for 12 days. After fermentation, the sea grape kombucha was filtered using a Buchner filter. The fermented product was then poured into sterilized bottles and stored in a refrigerator at 10 °C for further testing.

2.2.4. Sea Grape Kombucha pH Value Test

pH testing is carried out using a digital pH meter (Consort C6030, Consort bvba, Turnhout, Belgium) that has been calibrated with pH 4 and pH 7 buffer solutions. pH testing followed the AOAC method. A total of 20 mL of the sample was prepared and placed in a beaker. The pH meter electrode was immersed in the solution and left for a few moments until the pH reading was stabilized. The pH meter electrode was then removed, rinsed with distilled water, and dried with tissue paper for reuse.

2.2.5. Sea Grape Kombucha Soluble Solid Content Test

Soluble solid content was tested using a refractometer (Abbe 2WAJ, AMTAST (Amtast USA Inc., Lakeland, FL, USA)) following the procedure suggested by the AOAC method. Before use, the refractometer was cleaned by dripping distilled water evenly onto the top of the refractometer prism and then wiping it dry with a tissue. The sample was dripped 2–3 times onto the top of the prism and the Brix degree measured.

2.2.6. Determination of Vitamin C Content

The vitamin C content in sea grape kombucha was analyzed following the method of Yulianto et al. [30] using UV-Vis spectrophotometry (U-1800, Hitachi High-Tech Corporation, Tokyo, Japan). The maximum wavelength was identified within the range of 200–300 nm, with measurements conducted based on absorbance readings. A standard curve was established using ascorbic acid solutions at concentrations of 2, 4, 6, 8, and 10 µg/mL. For sample analysis, the kombucha was gradually diluted, and its absorbance was measured at the maximum wavelength. The analyses of both samples and standard were made in triplicate, and the mean value with ± standard deviation (SD) is presented.

2.2.7. Determination of Total Tannin Content

The total tannin content was determined using the Folin–Ciocalteu method as described by Mulyani et al. [31] with slight modifications. The kombucha (1 mL) was mixed with 9 mL of distilled water. An aliquot of 1 mL of kombucha and 1 mL of Folin–Ciocalteu reagent was mixed and incubated for 5 min at room temperature. Next, 2 mL of sodium carbonate (Na2CO3) (15% w/v) was added and incubated for 5 min at room temperature. The final volume of the solution was adjusted to 10 mL with distilled water. The solution was incubated for 110 min at room temperature. The absorbance was determined using a Hitachi U-1800 UV-Vis spectrophotometer (Hitachi High-Technologies Corporation, Wokingham, Berkshire, United Kingdom) at a wavelength of 784 nm. The gallic acid standard curve was prepared from 10 to 50 µg/mL solutions. The analyses of both samples and standard were made in triplicate, and the mean value with ± standard deviation (SD) is reported.

2.2.8. Determination of Total Flavonoid Content

The flavonoid content was determined using the aluminum trichloride method as described by Ramadhani et al. [32]. An aliquot of 1 mL kombucha, 1 mL aluminum trichloride (AlCl3) (10% w/v), and 8 mL acetic acid (CH3COOH) (5% v/v) were mixed and incubated for 30 min at room temperature. The absorbance was determined using a Hitachi U-1800 UV-Vis spectrophotometer at a wavelength of 415 nm. A standard curve of quercetin was initially prepared using a 12.5–200 µg/mL solution range. The analyses of both samples and standard were made in triplicate, and the mean value with ± standard deviation (SD) is reported.

2.2.9. Antioxidant Activity

Antioxidant activity was assessed by measuring the scavenging power of the DPPH radical (2,2-Diphenyl-1-picrylhydrazyl). The DPPH test is carried out according to the method described by Molyneux [33]. 1 mL DPPH solution (200 µM) was mixed with 1 mL sample solutions at different concentrations (20,000–10,000 µg/mL). The solution was incubated for 30 min at room temperature in dark conditions. Next, the final volume of the solution was adjusted to 5 mL with ethanol. A control (Abs Control) containing 4 mL of methanol and 1 mL of DPPH solution was also realized. The standard used was ascorbic acid (1000–5000 µg/mL). The radical scavenging capacity using the free DPPH radical was evaluated by measuring the decrease in absorbance at 517 nm. When the reading was complete, the percentage of inhibition of samples was calculated from the obtained absorbance by the equation: % Inhibition = (Abs Control–Abs Test)/Abs Control) × 100. Then, curves were constructed by plotting the percentage of inhibition against concentration in µg/mL. The equation of this curve allowed us to calculate the IC50 corresponding to the sample concentration that reduced the initial DPPH absorbance by 50%. A smaller IC50 value corresponds to a higher antioxidant activity. All analyses were realized in triplicate.

2.2.10. Statistical Analysis

Analysis of variance (ANOVA) was used to evaluate the statistical significance of the data to evaluate the relationship and effect of SCOBY starter concentration on the physicochemical characteristics and antioxidant activity of sea grape kombucha. The observational data were analyzed using the Kruskal–Wallis test. All statistical analyses were carried out using SPSS software version 26 (IBM Corp., Armonk, NY, USA).

2.2.11. Screening GC-MS/MS

A volume of 1000 μL of the sample was pipetted and mixed with 1000 μL of acetonitrile. The mixture was then evaporated for 6 h at 55 °C with a flow rate of 1.5 mL/min. After evaporation, the residue was reconstituted with 1000 μL of acetonitrile. The reconstituted sample was subsequently filtered using a 0.22 μm PTFE membrane filter. Finally, the filtered sample was injected into the GC-MS/MS (Thermo Scientific, Waltam, MA, USA) system for analysis.

3. Results and Discussion

3.1. Metagenomic and Fermentation Time Analysis

Sea grape kombucha fermented at three different fermentation times, namely after 7 days (F7), 14 days (F14), and 21 days (F21), exhibited a characteristic sour taste and the formation of a new SCOBY layer as shown in Figure 1, which serves as an indicator of successful kombucha fermentation [34].

3.1.1. pH Value and Sugar Content of Sea Grape Kombucha

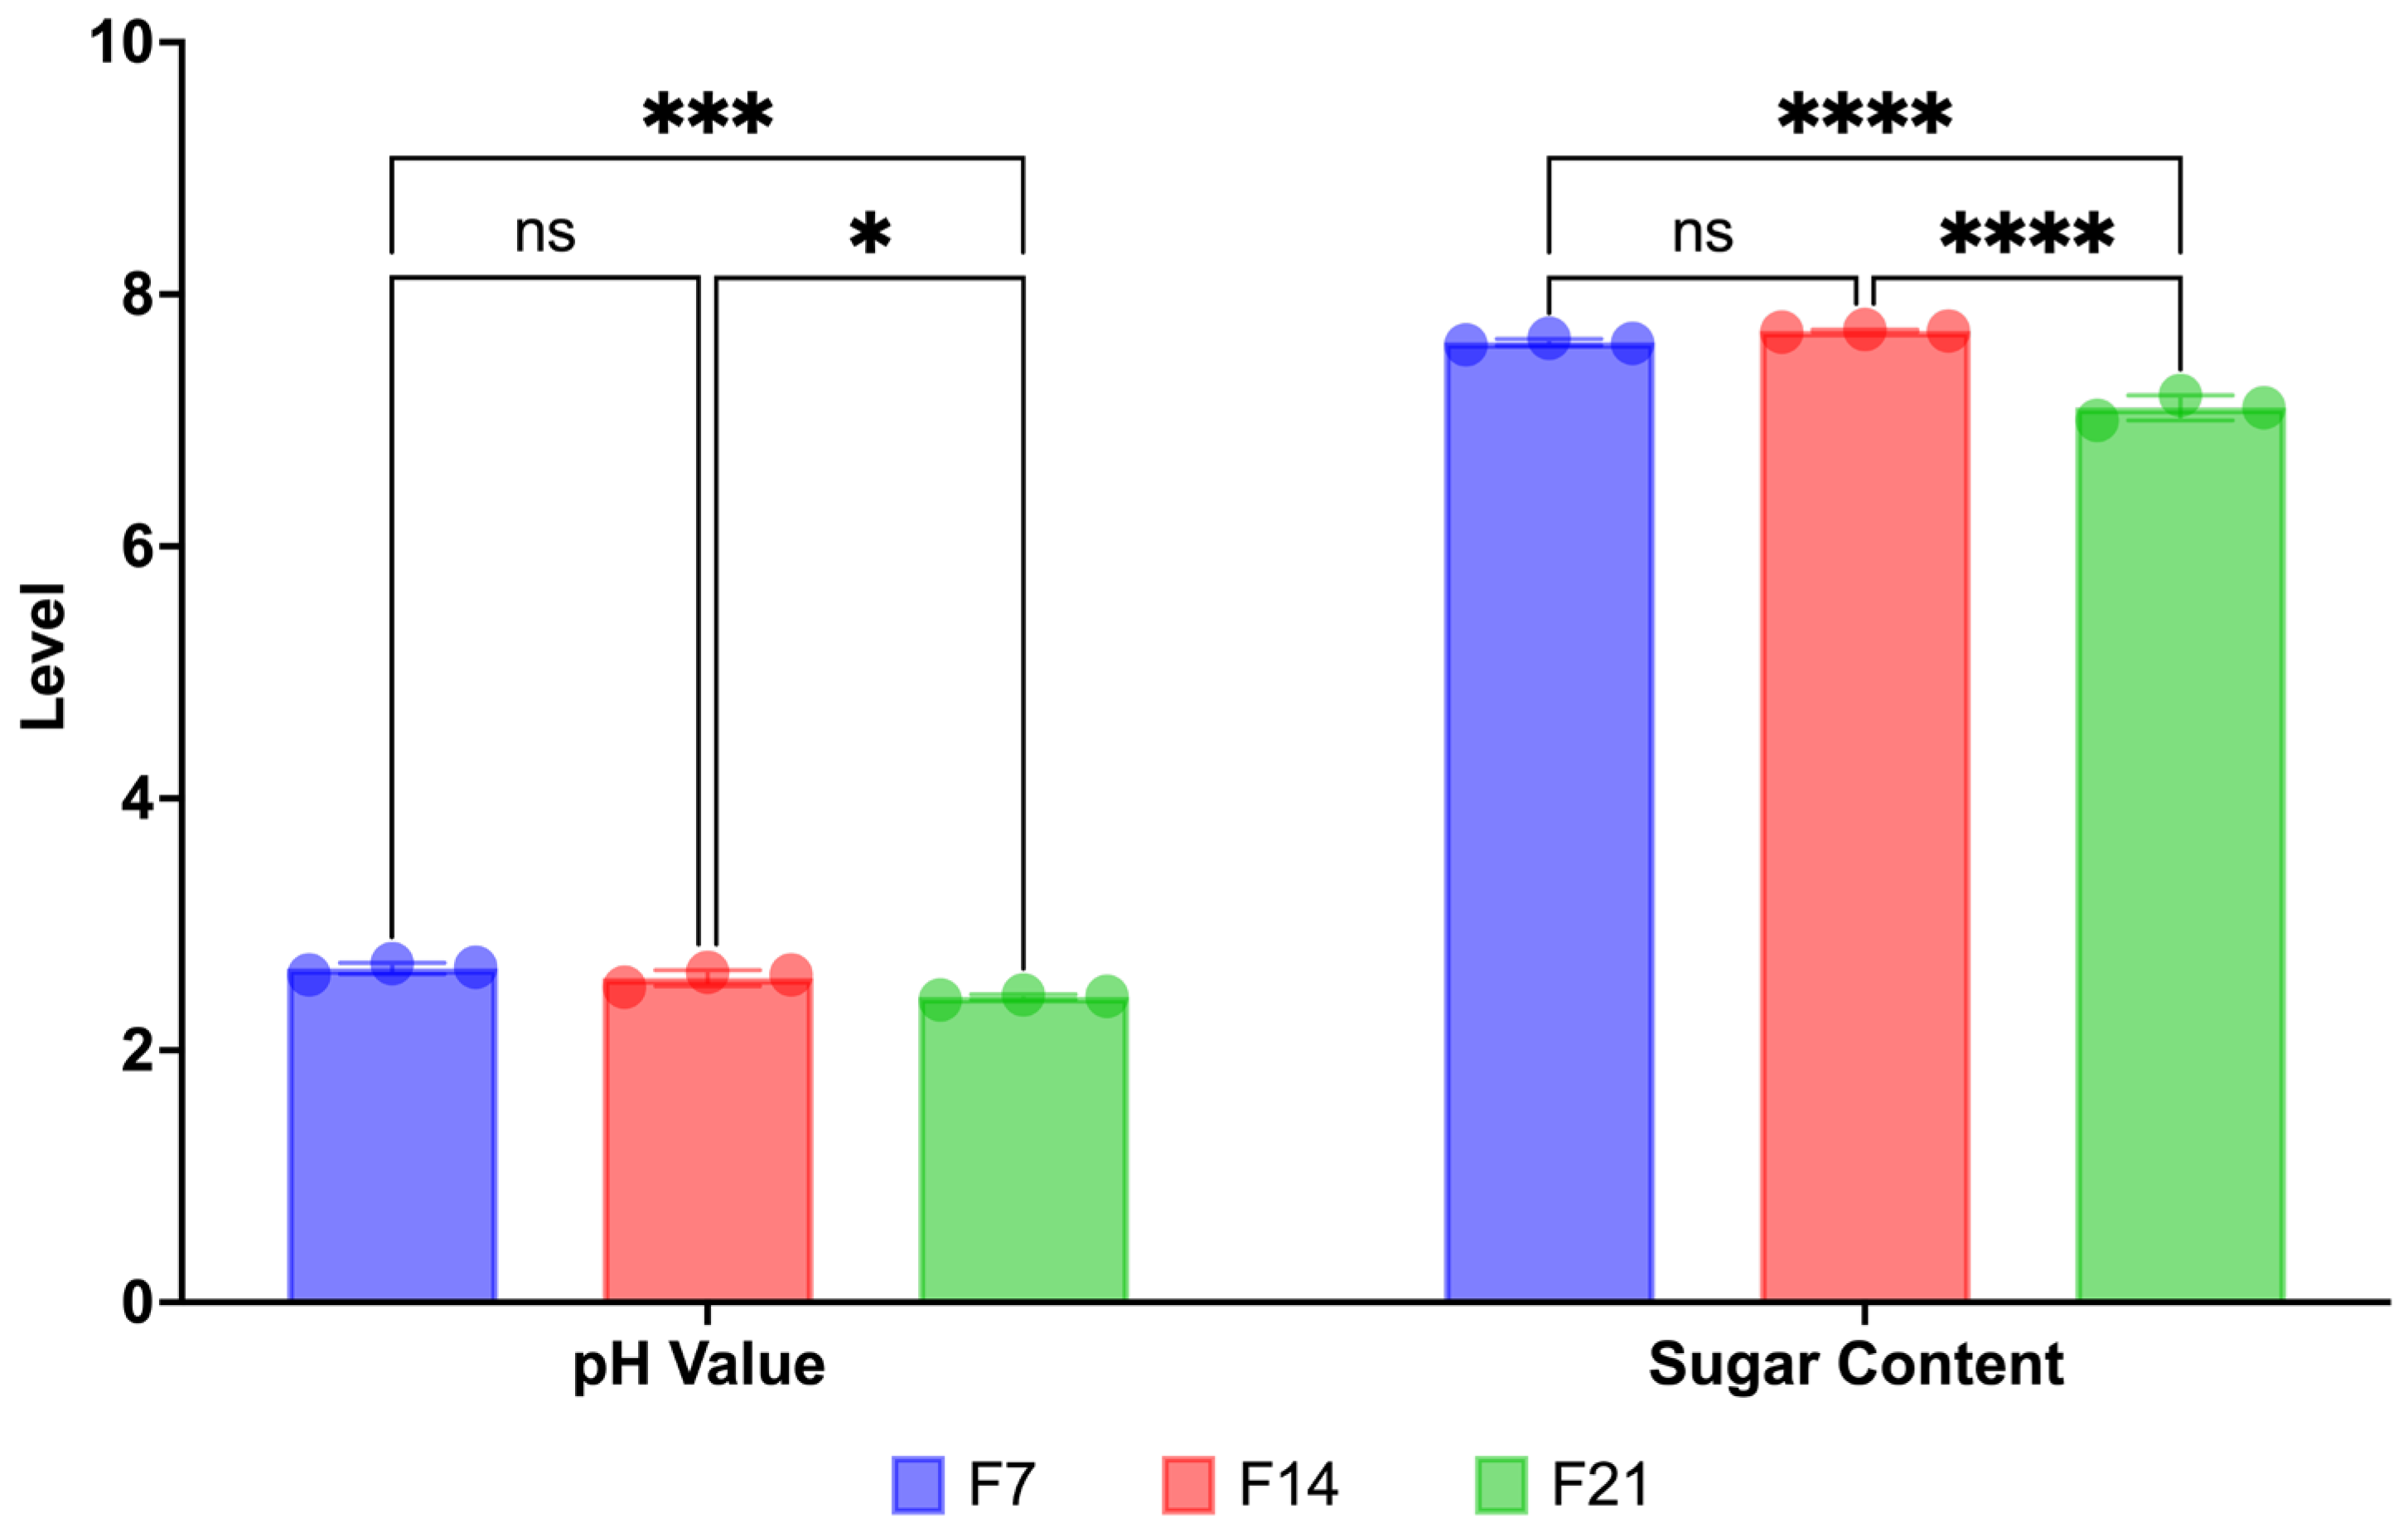
Kombucha formulations with a fermentation time of 7 days (F7) showed higher pH values compared to the pH values for fermentation times of 14 days (F14) and 21 days (F21) (Figure 2). The duration of fermentation also influences the sugar content in kombucha. Prolonged fermentation results in a reduction in sugar levels. This decline is attributed to a series of biochemical transformations occurring during the kombucha fermentation process, in which sugars are metabolized by the microbial consortium into glucose, fructose, organic acids, and other metabolites [35,36].
pH is one of the most important parameters affecting kombucha fermentation due to the organic acids formed, which results in the biological activity of the resulting beverage [37]. According to Hur et al. [38], pH value is closely related to microbial growth and structural changes in phytochemical compounds that can affect antioxidant activity. The antioxidant activity observed in sea-grape kombucha is most likely attributable to phenolic compounds and vitamin C, which are water-soluble and readily released or transformed during fermentation, with additional contributions from sulfated polysaccharides (metal chelation) and carotenoids (singlet oxygen quenching). Together, these phytochemicals explain the radical-scavenging and reducing capacities detected in antioxidant assays [39,40]. The pH value of post-fermentation sea grape kombucha in all samples (F7, F14, F21) shows a level of acidity that tends to be high. This is due to the fermentation time and starter concentration used. The higher the starter concentration used, the lower the pH value produced [41]. The decrease in pH and increase in acid content in fermentation products are also influenced by the activity of microorganisms [42]. At longer fermentation times, the pH value will decrease so that it is more acidic [43]. Organic acids obtained from the metabolites of bacteria and yeast used as culture affect the decrease in pH in kombucha. This is in line with the observation of Greenwalt et al. [44], which stated that the bacterial activity produces metabolites in the form of acetic acid and other organic acids, which can cause the pH to drop. The research of Zeng et al. [45] showed that acidic conditions (pH < 7) are able to maintain the stability of organic compounds contained in beverages because tea polyphenols are sensitive to pH; the lower the pH, the more stable tea polyphenols are during storage.

3.1.2. Bacteria’s DNA Metagenome Extraction from Sea Grape Kombucha Fermentation

Genomic DNA from kombucha samples F7, F14, and F21 was successfully extracted, and the 16S rRNA gene was amplified at the V3–V4 region, producing a fragment of approximately 470 bp (Figure 3). According to Zhang et al. [24], the expected size of the 16S rRNA gene in the V3–V4 region ranges from 400 to 500 bp.

3.1.3. Relative Abundance of Genus from Sea Grape Kombucha

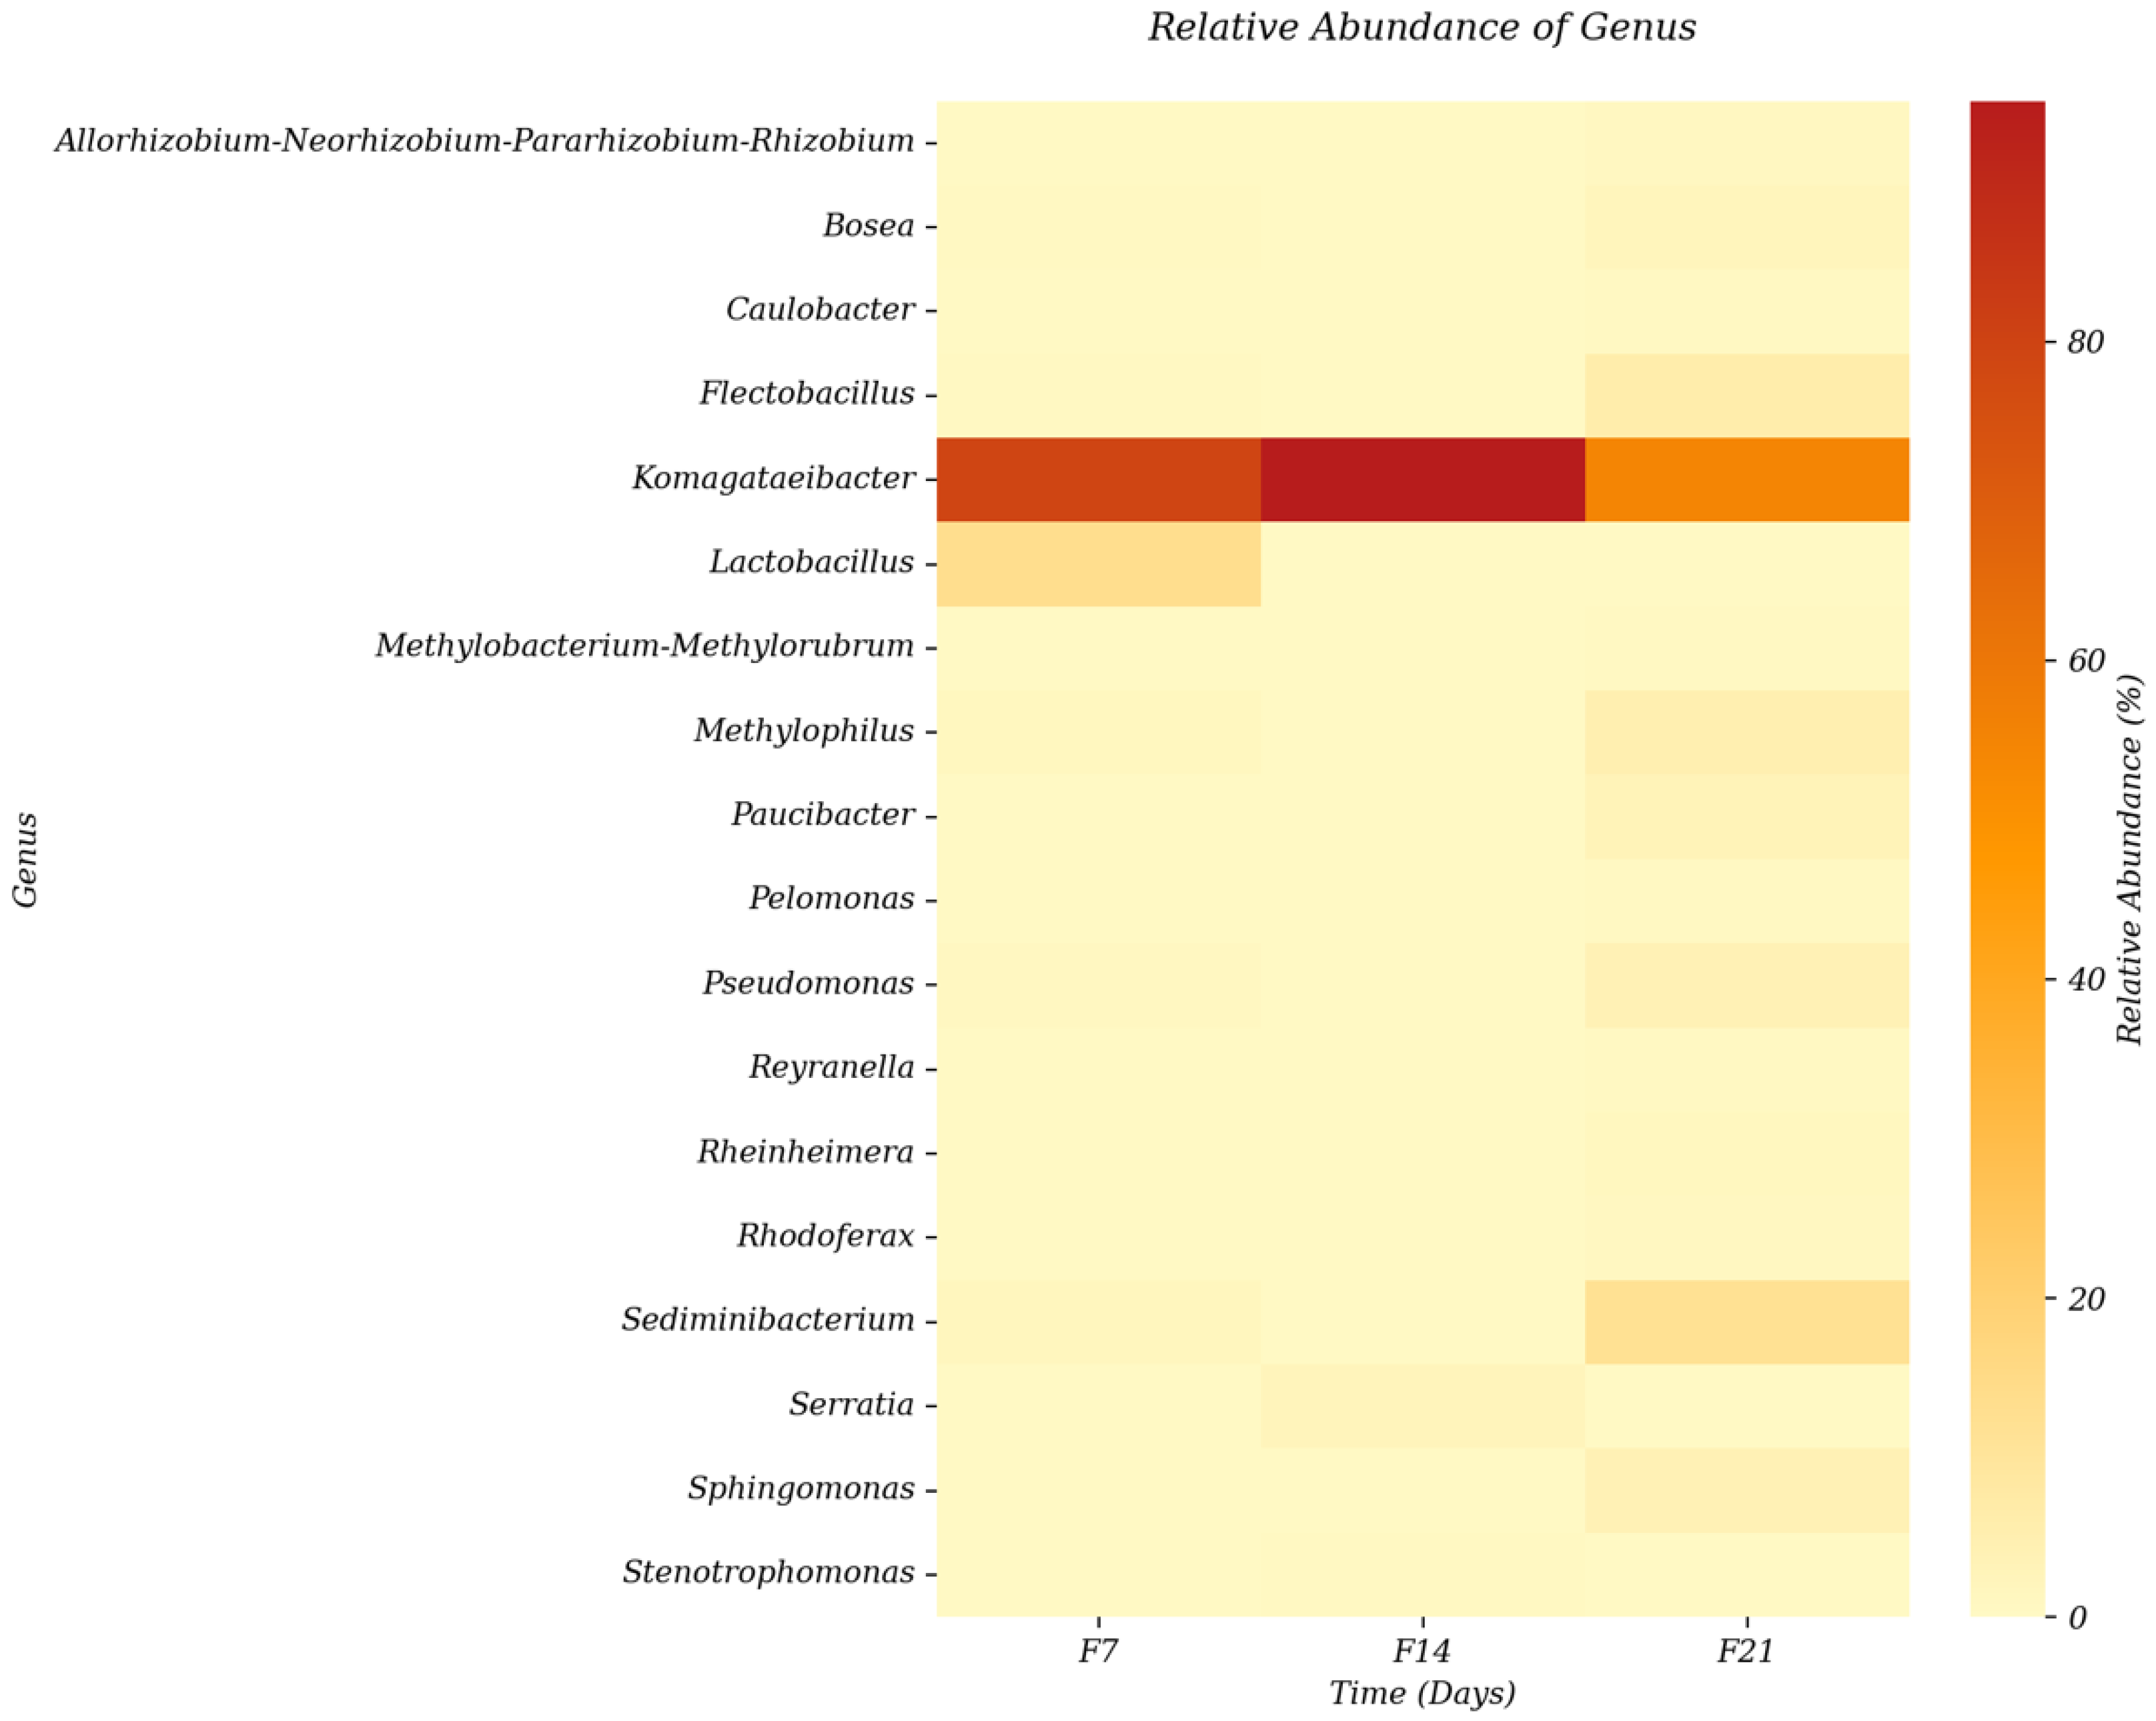
Based on metagenomic analysis of the three Kombucha samples, taxonomic classification data of the bacterial communities were obtained by comparing ASV sequence data with the SILVA version 138 reference database. Overall, the microbial community in sea grape kombucha consisted of 97.08% bacteria and 2.92% eukaryotes (Figure 4). The bacterial community in sea grape kombucha was divided into 10 phyla and 69 genera. After filtering for low-abundance species, 18 genera remained.
Relative abundance data indicated that Komagataeibacter was the dominant genus in all samples, which is consistent with findings from Dewi [46]. In contrast, genera such as Sediminibacterium, Lactobacillus, and Flectobacillus showed more variable patterns, with Sediminibacterium increasing notably in F21 (12.11%), and Lactobacillus decreasing drastically to nearly undetectable levels after F7. Other genera, including Methylophilus, Pseudomonas, and Sphingomonas, were also present in low to moderate abundance, generally increasing in later samples.
While these taxa are not traditionally recognized as primary acid producers in kombucha, they may influence fermentation indirectly through polysaccharide degradation, production of secondary organic acids, or cross-feeding interactions that enhance substrate availability for acetic acid bacteria. Additionally, the near-complete disappearance of Lactobacillus after F7 suggests that lactic acid bacteria played only a transient role in early acidification, leaving later-stage pH decline to be explained by acetic acid bacteria in synergy with secondary metabolic contributions from these less dominant genera. Thus, the progressive acidification observed in the F21 group likely reflects not only Komagataeibacter-driven acetic and gluconic acid accumulation but also the broader restructuring of the microbial community, where auxiliary genera may contribute to metabolic complexity and sustained pH reduction over prolonged fermentation.
Other than lactic acid bacteria, the principal driver of the further pH decline in the F21 group can be explained by a yeast and acetic acid bacteria metabolic sequence. Yeasts convert sucrose to glucose or fructose and ferment these to ethanol; aerobic acetic acid bacteria (commonly Komagataeibacter, Acetobacter, and Gluconobacter in kombucha) then oxidize ethanol and sugars to acetic, gluconic, and glucuronic acids, which accumulate over time and reduce pH. This yeast and acetic acid bacteria pathway is a well-documented mechanism for progressive acidification in kombucha and is supported by several compositional/time-series studies reporting increases in acetic, gluconic, and glucuronic acids with fermentation time [47,48,49].

3.1.4. Functional Annotation of Taxa in Sea Grape Kombucha

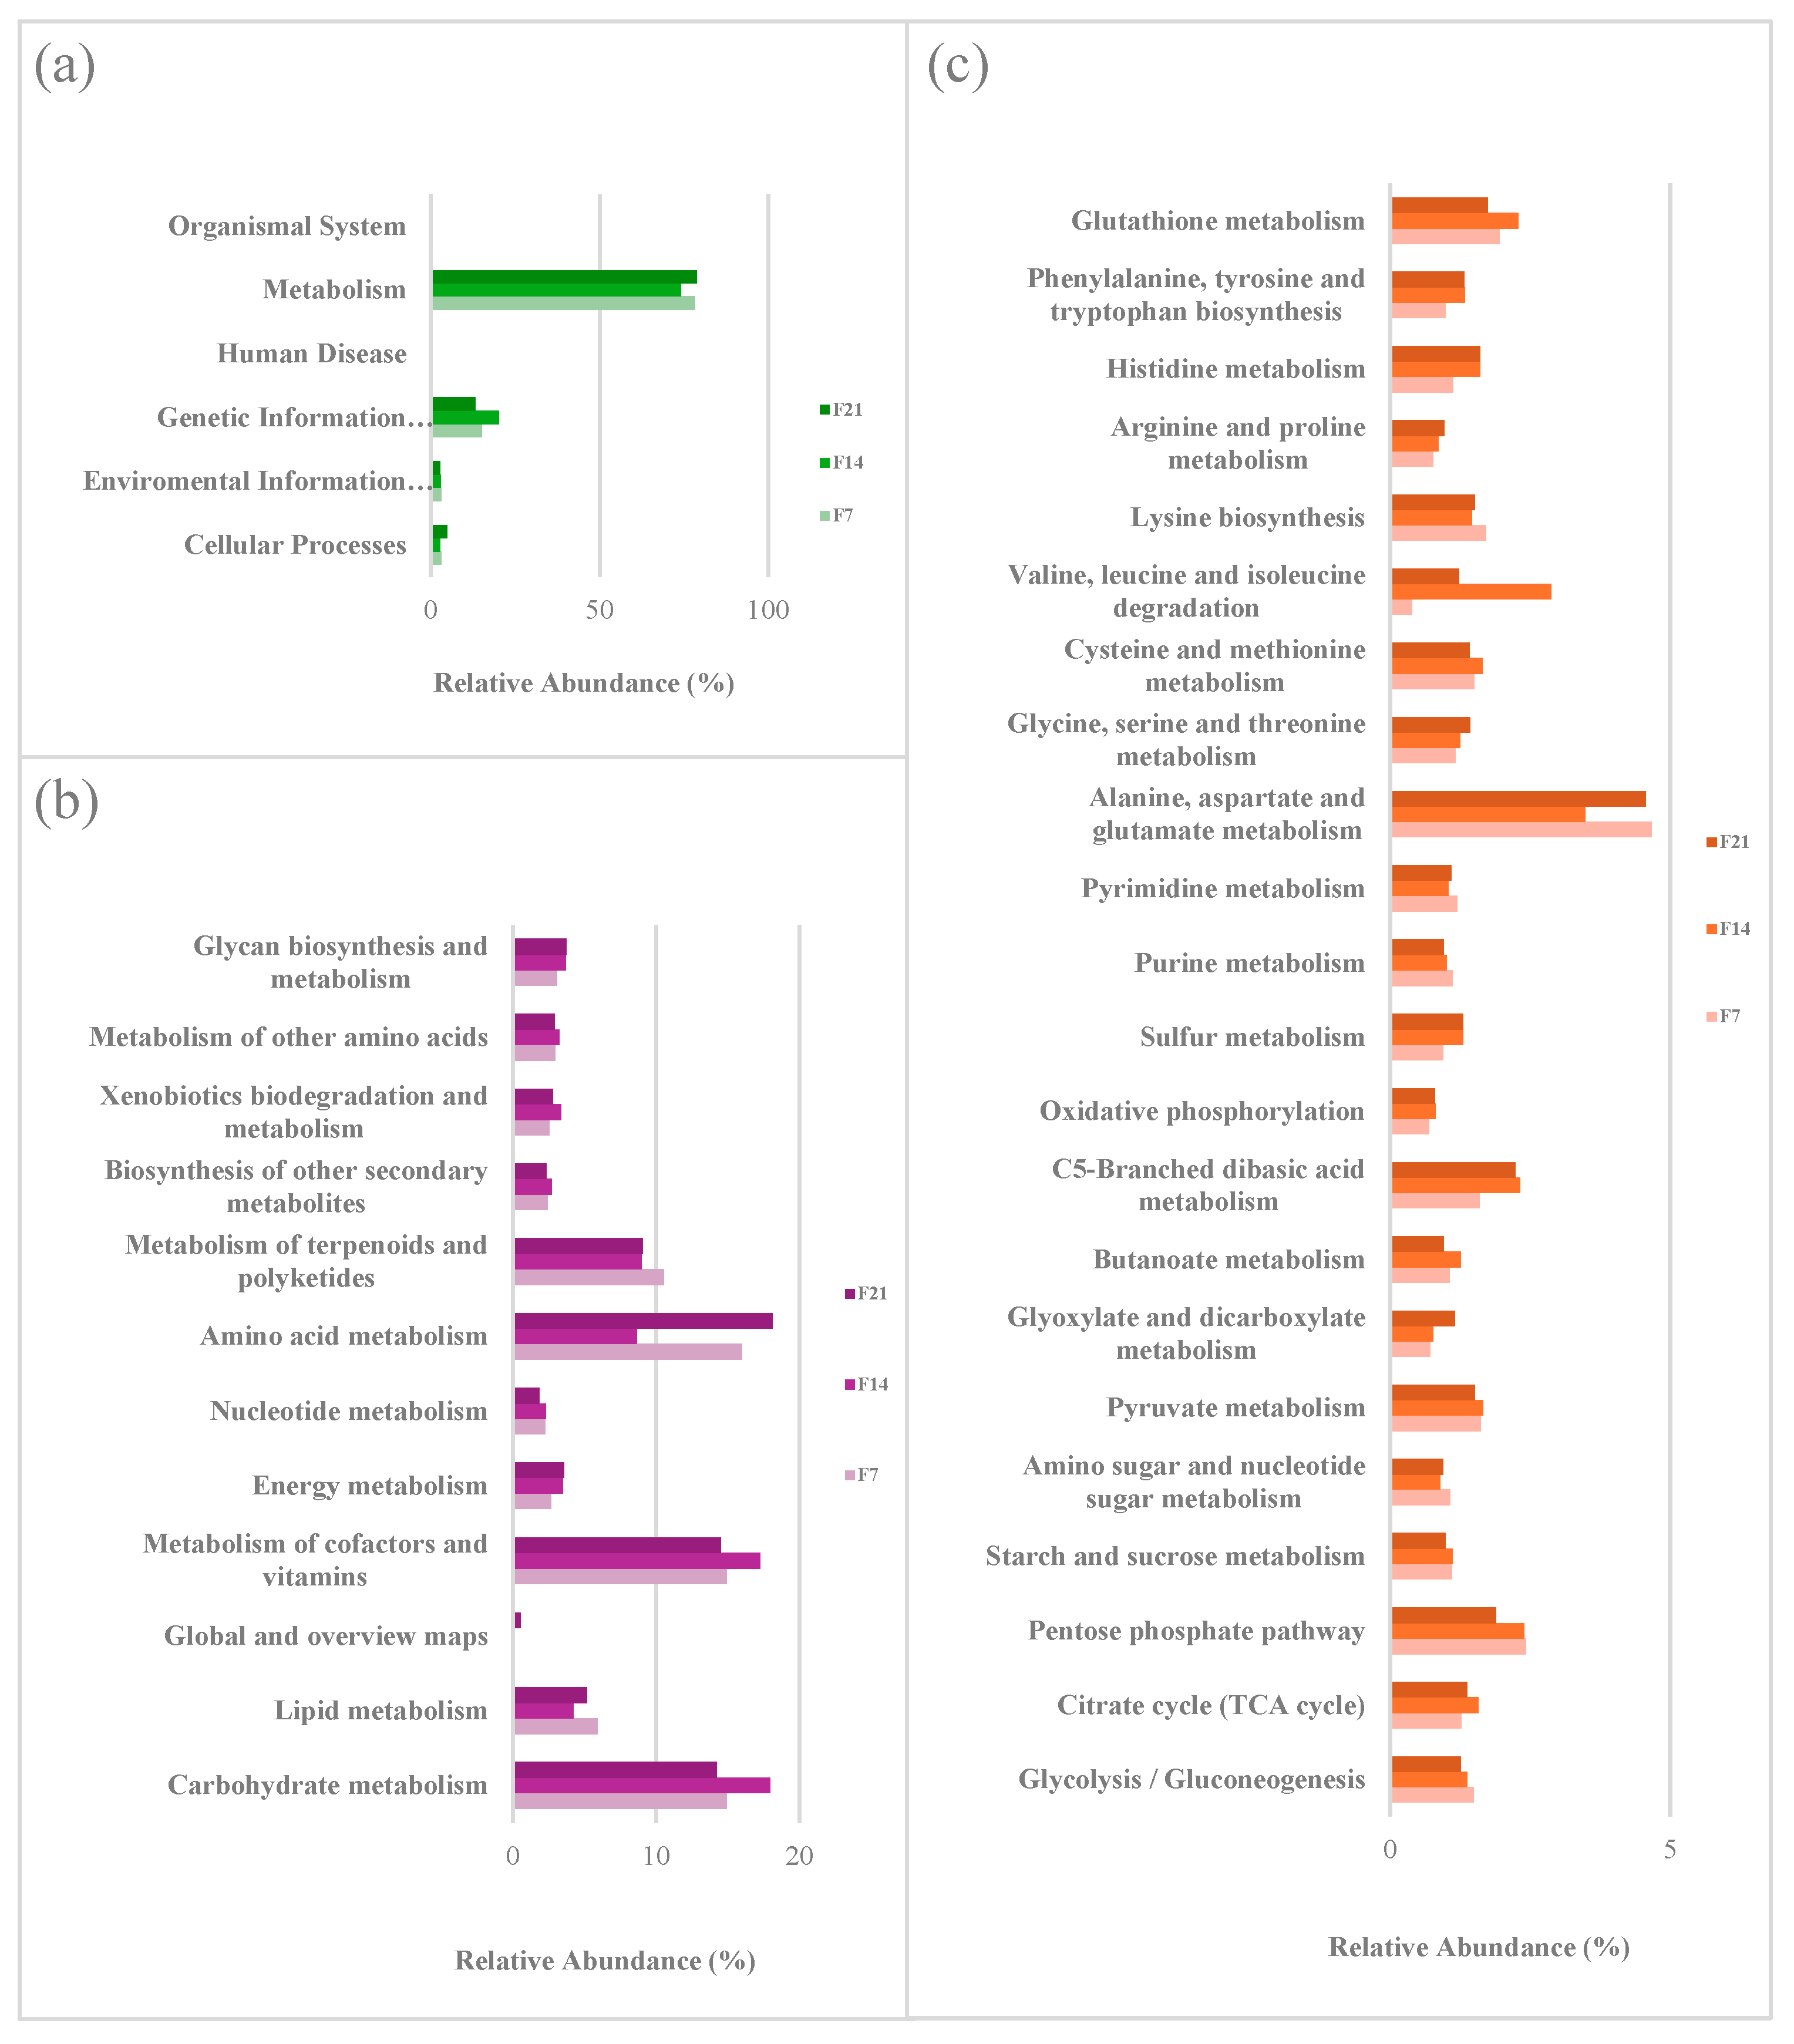
According to the functional profiling based on 16S rRNA data analyzed using PICRUSt and referenced against the KEGG database (Figure 5), metabolic functions accounted for the majority of predicted microbial activities during the fermentation of sea grape kombucha, representing 77.04% of total relative abundance. This dominance indicates a primary microbial focus on biochemical transformations rather than complex genetic or cellular processes.
At KEGG Level 2, the most enriched functional categories were carbohydrate metabolism (15.70%), cofactor and vitamin metabolism (15.54%), and amino acid metabolism (14.24%). These pathways are critical for sugar degradation, energy generation, and biosynthesis of essential biomolecules. Lipid metabolism (5.11%) and terpenoid/polyketide metabolism (9.52%) were also detected, likely reflecting secondary metabolite production. At KEGG Level 3, amino acid-associated pathways were predominant, particularly alanine, aspartate, and glutamate metabolism (4.24%), suggesting active nitrogen cycling and protein turnover. Other relevant pathways included the pentose phosphate pathway (2.24%), C5-branched dibasic acid metabolism (2.05%), glycolysis (1.38%), the TCA cycle (1.41%), and pyruvate metabolism (1.60%). These findings indicate moderate energy metabolism activity. Overall, these results suggest that the fermentation process in sea grape kombucha is primarily driven by carbohydrate and amino acid metabolism, supported by energy-generating and cofactor biosynthesis pathways.

3.1.5. Correlation Analysis Between Metabolic Pathways and Bacterial Communities in Sea Grape Kombucha

The functional profile of metabolic pathways based on the KEGG Database revealed microbial succession dynamics during kombucha fermentation (Figure 6). Komagataeibacter consistently dominated the fermentation process, with its functional roles adapting to changing environmental conditions. On day 7, the ecosystem was still simple, with dominant activity in the Alanine, Aspartate, and Glutamate Metabolism (0.87) and Valine , Leucine and Isoleucine Biosynthesis (0.73) pathways, supported by Komagataeibacter and moderate contribution from Lactobacillus (0.39). The activation of C5-Branched Dibasic Acid Metabolism (0.62) indicated the utilization of branched-chain amino acid derivatives, while the near-neutral pH allowed coexistence of acetic acid and lactic acid bacteria.
By day 14, the fermentation environment had become more acidic and oxygenated. Komagataeibacter shifted its activity toward the Citrate Cycle (0.70), Oxidative Phosphorylation (0.88), and Pentose Phosphate Pathway (0.89), while Butanoate Metabolism (0.33) emerged as an alternative redox pathway. During this phase, the abundance of Lactobacillus declined sharply due to pH stress and substrate competition. By day 21, the microbial community stabilized under the dominance of Komagataeibacter while Lactobacillus was nearly absent (0.0038). Amino acid metabolism became reactivated (Alanine, Aspartate, and Glutamate Metabolism, 0.91), along with increased activity in Starch and Sucrose Metabolism (0.31) and Sulfur Metabolism (0.99), indicating a progressively specialized microbial function profile.
Further analysis highlighted dominant carbohydrate metabolism pathways—namely Pentose phosphate pathway (ko00030), C5-Branched dibasic acid metabolism (ko00660), Glycolysis/Gluconeogenesis (ko00010), and Pyruvate Metabolism (ko00620)—which supported efficient sugar conversion into various bioactive compounds [50]. Carbohydrate metabolism in the kombucha consortium proceeds through well-defined microbial pathways that convert sucrose → glucose/fructose (yeast invertases) and then channel hexoses into a set of discrete metabolites with known functional roles. Yeasts ferment glucose/fructose via glycolysis and alcoholic fermentation (pyruvate → acetaldehyde → ethanol), producing ethanol and CO2 early in the process. Aerobic acetic-acid bacteria (AAB; e.g., Komagataeibacter, Acetobacter, Gluconobacter) oxidize ethanol to acetic acid and can oxidize glucose to gluconic acid (via membrane-bound glucose dehydrogenases) and further to glucuronic acid through uronic-acid pathways. These organic acids (acetic, gluconic, and glucuronic) are the principal contributors to increased titratable acidity and progressive pH decline during extended fermentation. Komagataeibacter spp. also polymerize UDP-glucose to produce bacterial cellulose, an exopolysaccharide that shapes the pellicle and affects mouthfeel. When present, lactic acid bacteria produce lactic acid and related metabolites (e.g., succinate), while yeast and bacterial metabolism also generate low-molecular-weight bioactive molecules and volatiles such as acetoin, diacetyl, esters, and aldehydes, plus water-soluble B vitamins and ascorbic acid derivatives [37,48,51]. Collectively, these compounds account for the beverage’s acidity, antimicrobial properties, altered polyphenol profile, texture (cellulose), and aroma/taste changes observed with prolonged fermentation.
Functional genes in Alanine, Aspartate and Glutamate Metabolism (ko00250), along with ko00270, ko00290, and ko00300, correlated with the amino acid profiles found in sea grape-based kombucha (C. racemosa)—notably glutamic acid, aspartic acid, and alanine [52]—which contribute to umami and sweet flavors [53,54,55]. The presence of Purine (ko00230) and Pyrimidine Metabolism (ko00240) pathways suggests accelerated microbial growth during acetic acid fermentation [56,57]. Additionally, although Sulfur Metabolism (ko00920) has not been directly studied in kombucha, its potential role in acidification and metabolic modulation is supported by aerobic solid-state fermentation data [58].

3.1.6. Correlation Data Between Organic Acid-Related Enzymatic Pathways and Bacterial Community Composition in Sea Grape Kombucha

Organic acid metabolism during kombucha fermentation involves key microbial dynamics that shift in response to environmental changes such as pH and oxygen levels (Figure 7). Early fermentation (day 7) is dominated by Lactobacillus, which produces lactate via D- and L-lactate dehydrogenase (0.51 and 0.87, respectively), but its activity declines significantly by day 14 and 21 due to acid stress [46,59]. In contrast, Komagataeibacter remains active throughout the process, contributing to acetate and citrate metabolism via acetyl-CoA hydrolase/carboxylase (0.62) and citrate synthase (0.92), although its acetate-related role decreases on day 14. Acinetobacter and Sphingomonas then become dominant in the late stages, with high activity of acetyl-CoA carboxylase and hydrolase (0.90 and 0.97), reflecting a succession from sugar oxidizers to advanced acetate oxidizers [60].
The production of gluconate and glucuronate initially involves Paucibacter and Pseudomonas through uronate dehydrogenase (0.28–0.34), which later transitions to Sphingomonas. Glucuronate, formed via EC:1.1.1.22 UDP-glucose 6-dehydrogenase, is known for detoxifying effects [61], while acetate—produced via multiple acetyl-CoA related pathways—is the major contributor to kombucha’s sour profile [62]. Komagataeibacter, though not directly linked to gluconate synthesis, may share this function with its relatives Gluconobacter and Acetobacter [51]. Citrate metabolism, involving Pseudomonas and Komagataeibacter, is also crucial, aided by citrate (Si)-synthase, with Pseudomonas utilizing a specific tricarboxylate transport system [63].
Additional minor acids like malate, succinate, and tartrate also contribute to kombucha’s profile. Malate, a TCA cycle intermediate, plays a role in flavor enhancement and antimicrobial activity [64]. In sake fermentation, Saccharomyces cerevisiae synthesizes succinate and malate, imparting umami flavor [65], a role likely shared in kombucha by Saccharomyces and Acetobacteraceae members [66]. Tartrate synthesis is associated with EC:4.2.1.32 L(+)-tartrate dehydratase and has been found in appreciable amounts in kombucha [67]. Lastly, the presence of non-pathogenic Gram-negative bacteria such as Pseudomonas, Acinetobacter, and Enterobacteriaceae (Citrobacter, Serratia)—common food surface contaminants—may indicate environmental contamination during fermentation [68].

3.2. Metabolomic Analysis

Kombucha is a fermented beverage made from tea and sugar using a SCOBY starter. In this study, kombucha was produced from sea grapes with the addition of Trigona honey. Sea grapes were selected due to their high polyphenol content and antioxidant properties. The production of kombucha using sea grapes aims to diversify the use of sea grapes into a functional beverage with potentially high market value. Furthermore, the fermentation process is expected to enhance the concentration of secondary metabolites in the sea grapes. Trigona honey has been used as a sugar substitute because the addition of Trigona honey results in higher total polyphenol content and antioxidant activity in kombucha production compared to the addition of sugarcane, brown sugar, stevia, and rock sugar as per the previously reported data [16]. Figure 8 shows the appearance of the sea grape kombucha produced in this study.

3.2.1. Physicochemical Characteristics of Sea Grape Kombucha

In kombucha production, the concentration of the SCOBY starter plays a crucial role in determining product quality. Differences in starter concentration influence the number and activity of microorganisms, which affect the fermentation process and metabolite production. These variations are reflected in physicochemical parameters such as pH, soluble solid content, vitamin C content, tannin content, and flavonoid content. The physicochemical characteristics of sea grape kombucha obtained in this study are shown in Table 2.

3.2.2. pH Value

The pH measurement was conducted to determine the acidity level of the kombucha beverage, which is a critical factor in assessing its safety for consumption. The sea grape kombucha samples produced in this study exhibited pH values ranging from approximately 2.5 to 2.7, indicating an acidic nature. These pH values fall within the standard range for kombucha as established by the British Columbia Centre for Disease Control (BCCDC), Canada—a guideline recommended for commercial kombucha production—which specifies a pH range of 2.5 to 4.2 [69]. The organic acids commonly found in kombucha include acetic acid, gluconic acid, glucuronic acid, citric acid, γ-lactic acid, malic acid, tartaric acid, malonic acid, oxalic acid, succinic acid, and pyruvic acid [70].
The Kruskal–Wallis test showed a significant difference in the data (p = 0.016 < 0.05), indicating that the concentration of the SCOBY starter solution significantly influences the pH values of sea grape kombucha. In this study, increasing the concentration of the SCOBY starter solution led to an increase in the pH value of the sea grape kombucha produced. The pH of sample K3 (20%) was notably higher than that of samples K1 (10%) and K2 (15%). This finding contradicts the results reported by Marwati et al. [71], who observed that higher starter concentrations in kombucha tea resulted in lower pH values. The elevated pH observed here may be attributed to substrate depletion in the fermentation medium, which likely caused a reduction in bacterial viability. Anggraini & Retnaningrum [72] noted that bacterial colony counts in kombucha decline as the available nutrients in the fermentation medium become limited or exhausted. Such unfavorable fermentation conditions inhibit the bacteria’s ability to produce acetic acid, resulting in an increase in pH.

3.2.3. Soluble Solid Content

The analysis of soluble solid content was conducted to quantify the total concentration of dissolved organic and inorganic substances present in the kombucha beverage. A lower concentration of solids corresponds to a reduced soluble solid content. This parameter primarily reflects the presence of carbohydrates such as starch, glucose, fructose, and sucrose.
The Kruskal–Wallis test showed a significant difference in the data (p = 0.024 < 0.05), indicating that the concentration of the SCOBY starter solution has a significant effect on the soluble solid content of sea grape kombucha. In this study, increasing the concentration of the SCOBY starter solution led to a decrease in the soluble solid content of the sea grape kombucha produced. The soluble solid content of sample K3 (20%) was notably lower than that of samples K1 (10%) and K2 (15%). These findings are consistent with the study by Kurniawan et al. [73], which reported that an increase in starter concentration is associated with a decrease in substrate levels, as the substrates are consumed by microbial cells for metabolic processes, leading to a reduction in soluble solid content. During the fermentation process, Saccharomyces cerevisiae yeast and Acetobacter xylinum bacteria degrade the sugars present in the fermentation medium into lactic acid, ethanol, and carbon dioxide. As a result, the glucose content in the medium decreases, leading to a reduction in soluble solid content. However, in sample K2 (15%), a slight increase in soluble solid content was observed compared to the K1 (10%). This may be attributed to suboptimal microbial activity. Ideally, when microorganisms are metabolically active, they require more sugar to support their growth and reproduction, resulting in lower residual sugar levels in the solution.

3.2.4. Vitamin C Content

The determination of vitamin C content was conducted to quantify the amount of vitamin C present in sea grape kombucha. Vitamin C plays a significant role in antioxidant defense mechanisms. An increased concentration of vitamin C in a sample is generally associated with enhanced antioxidant activity. This is attributed to its capacity to donate hydrogen atoms to free radicals, thereby forming a stable ascorbyl radical that interrupts the radical chain reactions.
The Kruskal–Wallis test showed a significant difference in the data (p = 0.023 < 0.05), indicating that the concentration of the SCOBY starter solution had a significant effect on the vitamin C content of sea grape kombucha. In this study, increasing the concentration of the SCOBY starter solution led to a decrease in the vitamin C of the sea grape kombucha produced. The Vitamin C of sample K3 (20%) was notably lower than that of samples K1 (10%) and K2 (15%). This finding is consistent with a study by Jamilah [74], which reported that increasing the concentration of the SCOBY starter solution is inversely proportional to the vitamin C content in kombucha beverages. The decrease in vitamin C levels is presumed to occur due to the depletion of available nutrients in the fermentation medium, thereby limiting the microorganisms’ ability to produce vitamin C. In addition, the reduction may also be attributed to the transformation of previously synthesized vitamin C into other acidic compounds during fermentation.

3.2.5. Total Tannin Content

The determination of tannin content was conducted to quantify the amount of tannins present in sea grape kombucha. Tannins are a group of secondary metabolites known for their antioxidant properties. An increase in tannin concentration in a sample is generally associated with enhanced antioxidant capacity, due to their ability to scavenge free radicals and inhibit oxidative reactions.
The Kruskal–Wallis test revealed a statistically significant difference in the data (p = 0.023 < 0.05), indicating that the concentration of the SCOBY starter solution significantly influenced the tannin content of sea grape kombucha. In this study, increasing the concentration of the SCOBY starter solution led to an increase in the total tannin content of the sea grape kombucha produced. This finding aligns with the study by Zubaidah et al. [75], which demonstrated that the addition of SCOBY starter during the fermentation process enhances tannin levels in kombucha. The rise in tannin content is closely related to the metabolic activity of microbes during fermentation, which can modify bioactive components such as tannin compounds.
Although lactic acid bacteria (LAB) are reported to produce tannase enzymes capable of hydrolyzing tannins, leading to reduced tannin content [76], our results showed that higher SCOBY starter content corresponded to an increase rather than a decrease in tannin levels. This counterintuitive trend may be explained by several factors. First, LAB abundance in kombucha communities is typically low relative to acetic acid bacteria and yeasts, especially under acidic and oxygen-rich conditions that favor Komagataeibacter spp. [77]. Consequently, LAB-derived tannase activity may be insufficient to drive measurable tannin degradation in our system. Second, microbial metabolism during fermentation often liberates bound polyphenols (including hydrolyzable tannins) from the sea grape matrix through enzymatic hydrolysis of cell walls or glycosidic linkages [78]. Thus, increased microbial density from higher SCOBY inoculation could enhance the release of these compounds into the broth, outweighing any tannin-degrading effect of LAB. Therefore, the observed rise in tannin content with higher SCOBY addition likely reflects a predominance of polyphenol liberation processes over tannase-mediated degradation.
According to Cvetković et al. [79], lactic acid bacteria such as Lactobacillus and Lactococcus are present in kombucha beverages. The presence of lactic acid bacteria during fermentation contributes to the conversion of complex phenolics into simpler forms and the depolymerization of high molecular weight phenolics [80]. Lactic acid bacteria possess tannase enzyme activity capable of degrading tannins or tannic acid into gallic acid and pyrogallol [80]. The enzymatic activity results in the formation of compounds such as epigallocatechin gallate, gallic acid esters, and epicatechin gallate. This is consistent with the findings of [81], who reported an increase in simple phenolic acids, including syringic acid, gallic acid, and ferulic acid, because of fermentation by lactic acid bacteria.

3.2.6. Total Flavonoid Content

The determination of flavonoid content was conducted to quantify the flavonoid levels in sea grape kombucha. Flavonoids, as a class of secondary metabolites, are recognized for their potent antioxidant activities. Elevated flavonoid concentrations in a sample are typically correlated with increased antioxidant capacity.
The Kruskal–Wallis test revealed a statistically significant difference in the data (p = 0.022 < 0.05), indicating that the concentration of the SCOBY starter solution had a significant effect on the flavonoid content of sea grape kombucha. In this study, increasing the concentration of the SCOBY starter solution led to a decrease in the total flavonoid content of the sea grape kombucha produced. This finding is consistent with studies by Jakubczyk et al. [82] and Phung et al. [47], which demonstrated that the addition of SCOBY starter solution during fermentation can degrade flavonoid compounds, resulting in decreased flavonoid content in kombucha. The reduction in flavonoid levels is presumed to be due to oxidative reactions of polyphenols. Furthermore, the biodegradation of flavonoids into simpler molecules during fermentation is attributed to hydrolytic enzymes produced by lactic acid bacteria (LAB), particularly Lactiplantibacillus plantarum within the SCOBY consortium, which secretes β-glucosidase to degrade polyphenols and flavonoids [47].

3.2.7. Antioxidant Activity of Sea Grape Kombucha

The antioxidant activity of sea grape (Caulerpa racemosa) kombucha was assessed using a UV-Vis spectrophotometer via the DPPH (1,1-diphenyl-2-picrylhydrazyl) radical scavenging assay. The antioxidant activity of sea grape (Caulerpa racemosa) kombucha was evaluated at various concentrations: 20,000 ppm, 40,000 ppm, 60,000 ppm, 80,000 ppm, and 100,000 ppm. Absorbance was measured for each concentration, and the percentage of inhibition was subsequently calculated. The inhibition percentage indicates the extent to which free radicals are scavenged by compounds present in the sample. A higher percentage of inhibition corresponds to a greater ability to neutralize DPPH free radicals. These inhibition values were then used to determine the concentration required to inhibit 50% of the DPPH radicals (IC50). A lower IC50 value indicates stronger antioxidant activity. The antioxidant activity of sea grape kombucha obtained in this study is presented in Table 3.
The Kruskal–Wallis test revealed no statistically significant difference in the data (p = 0.761 > 0.05), indicating that the concentration of the SCOBY starter solution did not have a significant effect on the antioxidant activity of sea grape kombucha. An increase in the concentration of the SCOBY starter solution in this study was positively correlated with enhanced antioxidant activity in sea grape kombucha. This result is consistent with findings reported by Augusta et al. [16] and Rosita and Amaro [83], which demonstrated a direct relationship between SCOBY starter concentration and antioxidant capacity. During fermentation, microorganisms facilitate the degradation of complex polyphenolic and flavonoid compounds into simpler phenolic molecules, resulting in an overall increase in phenolic content and antioxidant potential [84].
The observed increase in tannin content further supports the enhancement of antioxidant activity during the fermentation process. Higher concentrations of the SCOBY starter solution lead to increased production of organic acids, which in turn promotes the accumulation of phenolic compounds such as tannins, thereby amplifying antioxidant activity. Based on the results obtained, tannins were identified as the principal polyphenolic compounds contributing to the antioxidant activity of sea grape kombucha in this study.

3.2.8. Bioactive Compound of Sea Grape Kombucha

GC-MS analysis of the three sea grape kombucha fermentation samples yielded a total of 26 compounds classified into fatty acid and ester, alcohol and polyol, terpenoid, and phytosterol/steroid groups (Table 4, Table 5 and Table 6). The composition of each sample contributed differently to the overall compound profile, i.e., K1 (10%), K2 (15%), and K3 (20%), reflecting the microbial fermentation dynamics and secondary metabolite potential of the Caulerpa racemosa marine substrate.
Fatty Acids and Their Ester Compounds
Fatty acid compounds such as hexadecanoic acid, octadec-9-enoic acid, and 2-propenoic acid were found in K1 and K2. In addition, esters of fatty acids such as palmitic acid methyl ester, phytyl decanoate, and hexadecanoic acid esters appeared dominantly in K2 and K3. These compounds contain carboxylic (-COOH) and ester (-COOR) groups, and play a role in lowering pH and inhibiting the growth of pathogenic microbes [85,86]. The total contribution of this group was dominated by K2, at 15%, indicating that this fermentation stage optimizes the formation of lipid compounds and their derivatives through microbial activity metabolizing carbohydrate and protein substrates from seaweed.
Polyhydroxy Alcohol and Polyol
One of the major compounds of K3 was sorbitol (32.30%), indicating the dominance of polyols produced during the advanced fermentation process. Sorbitol, along with glucitol from K1, serves as a natural sweetener, osmoregulatory agent, and has prebiotic potential [87]. K3 contributed the highest (20%) to the polyhydroxy alcohol group, indicating the accumulation of non-volatile metabolites as fermentation duration and glucose-fermenting microbial activity increased.
Terpenoid (Monoterpene and Diterpene)
Sample K2 and K3 contained terpenoid compounds such as phytol, phytol acetate, α-terpineol, carveol, and neophytadiene. Terpenoids are known as volatile components with high antimicrobial and antioxidant activity, and play an important role in the aroma and flavor of kombucha [88,89]. The contribution of K3 in this group reached 20%, indicating that these volatile compounds were formed optimally at the advanced fermentation stage through microbial activity on natural phenolic compounds from Caulerpa racemosa.
Phytosterol dan Steroid
Samples K2 and K3 also showed the presence of β-sitosterol and γ-sitosterol, as well as complex steroid derivatives such as pregn-4-ene-3,20-dione. These compounds are non-volatile and are known to have cholesterol-lowering effects, anti-inflammatory, and antioxidant activities [90,91]. The main contribution to this group came from K3, totaling about 20%, suggesting that phytosterols tend to accumulate in the late fermentation phase and make an important contribution to the functional value of kombucha.

4. Conclusions

Based on the results of this study, it can be concluded that the pH values of sea grape kombucha at fermentation days 7, 14, and 21 (F7, F14, F21) were 2.66, 2.62, and 2.43, respectively. A longer fermentation period resulted in a gradual decrease in pH. The sugar content at F7, F14, and F21 was recorded at 7.6%, 7.7%, and 7.1%, respectively, indicating a declining trend as fermentation progressed. This reduction is attributed to the microbial community in kombucha utilizing sugar as a substrate for the production of organic acids.
Functional profiling based on KEGG Orthology (KO) values using the KEGG database revealed 6 level-1 pathways, 35 level-2 pathways, and 155 level-3 pathways. The fermentation process of sea grape kombucha was dominated by Komagataeibacter, which consistently exhibited the highest functional contribution throughout various fermentation stages. The most dominant metabolic pathways were Glycolysis/Gluconeogenesis, the Citrate cycle (TCA cycle), and Alanine, aspartate, and glutamate metabolism, reflecting the central role of this bacterium in carbohydrate, energy, and amino acid metabolism during fermentation.
Further functional profiling based on Enzyme Commission (EC) numbers using the MetaCyc database identified a total of 1788 pathways, 30 of which were associated with organic acid metabolism—including acetate, lactate, malate, succinate, gluconate, glucuronate, and citrate. Komagataeibacter played a key role in acetate and citrate metabolism, while Lactobacillus dominated lactate pathways in the early stages of fermentation. Pseudomonas and Saccharomyces contributed to succinate and tartrate pathways, respectively. These results reflect a metabolic transition from fermentative to oxidative processes throughout the fermentation of sea grape kombucha.
Based on metabolomic analysis, it can be concluded that the concentration of the SCOBY starter solution significantly influenced (p < 0.05) the physicochemical characteristics of sea grape kombucha, including pH, soluble solid content, vitamin C, tannin, and flavonoid contents. Specifically, increasing the SCOBY starter concentration led to a higher pH value and total tannin content but decreased soluble solid content, vitamin C, and flavonoid contents. In contrast, the concentration of the SCOBY starter solution did not have a statistically significant effect (p > 0.05) on the antioxidant activity of the kombucha as measured by IC50 values; nevertheless, higher SCOBY concentrations tended to reduce IC50 values, indicating a potential enhancement of antioxidant activity. These findings provide insights into the fermentation characteristics of sea grape kombucha and its potential functional benefits.
The combination of the three fermentation samples showed that sea grape kombucha contains a diverse range of bioactive compounds that are dynamically formed over time. Sample K1 produced more fatty acids and simple sugar alcohols, sample K2 enriched complex lipid compounds and phytosterols, while sample K3 dominated the production of polyols and terpenoid compounds. These variations suggest that fermentation duration and microbial composition significantly influence the spectrum of bioactive metabolites, which synergistically provide functional benefits such as antimicrobial, antioxidant, and metabolic health-promoting activities.

Author Contributions

Conceptualization, D.A.K., A.S. and F.N.; Methodology, F.N., N.A.T. and A.S.; Software, F.N., R.S.D., N.R.F., S.Z.M. and J.L.; Validation, N.A.T., R.R., A.S. and F.N.; Formal Analysis, F.N., R.S.D., D.A.K., N.R.F., S.Z.M. and J.L.; Investigation, F.N., R.S.D., N.R.F., S.Z.M. and J.L.; Data Curation, F.N., R.S.D. and N.R.F.; Resources, F.N. and D.A.K.; Writing—Original Draft Preparation, F.N., J.L., R.S.D., N.R.F., S.Z.M., A.S. and N.A.T.; Writing—Review and Editing, F.N., A.S., N.A.T., R.R., D.A.K. and J.L.; Visualization, F.N., R.R. and R.S.D.; Supervision, N.A.T., F.N., R.R., D.A.K. and A.S.; Project Administration, R.S.D. and F.N. All authors have read and agreed to the published version of the manuscript.

Funding

This research was partially funded by the Indofood Riset Nugraha (IRN) program by PT. Indofood Sukses Makmur Tbk. No.: SKE.037/X/CC/X/2023.

Institutional Review Board Statement

Not applicable.

Informed Consent Statement

Not applicable.

Data Availability Statement

The original contributions presented in this study are included in the article material. Further inquiries can be directed to the corresponding authors.

Acknowledgments

The authors would like to express gratitude for the support of Ika Qurrotul Afifah in this kombucha study.

Conflicts of Interest

Juan Leonardo’s affiliation, he is indeed a member of Citra Deli Kreasitama Ltd., Banten 15124, Indonesia, a company active in herbal medicine. However, for this manuscript his involvement was strictly in the capacity of an independent researcher. Citra Deli Kreasitama Ltd. had no involvement in the conception, design, execution, data analysis, interpretation, or writing of this study, nor is there any connection between the research findings and the company’s products. Therefore, his affiliation does not affect the authenticity or objectivity of the experimental results.

References

  1. Holdt, S.L.; Kraan, S. Bioactive Compounds in Seaweed: Functional Food Applications and Legislation. J. Appl. Phycol. 2011, 23, 543–597. [Google Scholar] [CrossRef]
  2. Wells, M.L.; Potin, P.; Craigie, J.S.; Raven, J.A.; Merchant, S.S.; Helliwell, K.E.; Smith, A.G.; Camire, M.E.; Brawley, S.H. Algae as Nutritional and Functional Food Sources: Revisiting Our Understanding. J. Appl. Phycol. 2017, 29, 949–982. [Google Scholar] [CrossRef] [PubMed]
  3. Chen, X.; Sun, Y.; Liu, H.; Liu, S.; Qin, Y.; Li, P. Advances in Cultivation, Wastewater Treatment Application, Bioactive Components of Caulerpa Lentillifera and Their Biotechnological Applications. PeerJ 2019, 7, e6118. [Google Scholar] [CrossRef] [PubMed]
  4. Yang, P.; Liu, D.-Q.; Liang, T.-J.; Li, J.; Zhang, H.-Y.; Liu, A.-H.; Guo, Y.-W.; Mao, S.-C. Bioactive Constituents from the Green Alga Caulerpa racemosa. Bioorg. Med. Chem. 2015, 23, 38–45. [Google Scholar] [CrossRef] [PubMed]
  5. Peñalver, R.; Lorenzo, J.M.; Ros, G.; Amarowicz, R.; Pateiro, M.; Nieto, G. Seaweeds as a Functional Ingredient for a Healthy Diet. Mar. Drugs 2020, 18, 301. [Google Scholar] [CrossRef]
  6. Verlaque, M.; Durand, C.; Huisman, J.M.; Boudouresque, C.-F.; Le Parco, Y. On the Identity and Origin of the Mediterranean Invasive Caulerpa racemosa (Caulerpales, Chlorophyta). Eur. J. Phycol. 2003, 38, 325–339. [Google Scholar] [CrossRef]
  7. Kuswari, M.; Nurkolis, F.; Mayulu, N.; Ibrahim, F.M.; Taslim, N.A.; Wewengkang, D.S.; Sabrina, N.; Arifin, G.R.; Mantik, K.E.K.; Bahar, M.R.; et al. Sea Grapes Extract Improves Blood Glucose, Total Cholesterol, and PGC-1α in Rats Fed on Cholesterol- and Fat-Enriched Diet. F1000Research 2021, 10, 718. [Google Scholar] [CrossRef]
  8. Permatasari, H.K.; Firani, N.K.; Prijadi, B.; Irnandi, D.F.; Riawan, W.; Yusuf, M.; Amar, N.; Chandra, L.A.; Yusuf, V.M.; Subali, A.D.; et al. Kombucha Drink Enriched with Sea Grapes (Caulerpa racemosa) as a Potential Functional Beverage to Contrast Obesity: An in Vivo and in Vitro Approach. Clin. Nutr. ESPEN 2022, 49, 232–240. [Google Scholar] [CrossRef]
  9. Permatasari, H.K.; Nurkolis, F.; Hardinsyah, H.; Taslim, N.A.; Sabrina, N.; Ibrahim, F.M.; Visnu, J.; Kumalawati, D.A.; Febriana, S.A.; Sudargo, T.; et al. Metabolomic Assay, Computational Screening, and Pharmacological Evaluation of Caulerpa racemosa as an Anti-Obesity with Anti-Aging by Altering Lipid Profile and Peroxisome Proliferator-Activated Receptor-γ Coactivator 1-α Levels. Front. Nutr. 2022, 9, 939073. [Google Scholar] [CrossRef]
  10. Permatasari, H.K.; Nurkolis, F.; Augusta, P.S.; Mayulu, N.; Kuswari, M.; Taslim, N.A.; Wewengkang, D.S.; Batubara, S.C.; Ben Gunawan, W. Kombucha Tea from Seagrapes (Caulerpa racemosa) Potential as a Functional Anti-Ageing Food: In Vitro and in Vivo Study. Heliyon 2021, 7, e07944. [Google Scholar] [CrossRef]
  11. La China, S.; De Vero, L.; Anguluri, K.; Brugnoli, M.; Mamlouk, D.; Gullo, M. Kombucha Tea as a Reservoir of Cellulose-Producing Bacteria: Assessing Diversity among Komagataeibacter Isolates. Appl. Sci. 2021, 11, 1595. [Google Scholar] [CrossRef]
  12. Franzosa, E.A.; McIver, L.J.; Rahnavard, G.; Thompson, L.R.; Schirmer, M.; Weingart, G.; Lipson, K.S.; Knight, R.; Caporaso, J.G.; Segata, N.; et al. Species-Level Functional Profiling of Metagenomes and Metatranscriptomes. Nat. Methods 2018, 15, 962–968. [Google Scholar] [CrossRef]
  13. Jakubczyk, K.J.; Piotrowska, G.; Janda, K. Characteristics and Biochemical Composition of Kombucha—Fermented Tea. Med. Ogólna Nauk. Zdrowiu 2020, 26, 94–96. [Google Scholar] [CrossRef]
  14. Matchado, M.S.; Rühlemann, M.; Reitmeier, S.; Kacprowski, T.; Frost, F.; Haller, D.; Baumbach, J.; List, M. On the Limits of 16S RRNA Gene-Based Metagenome Prediction and Functional Profiling. Microb. Genom. 2024, 10, 001203. [Google Scholar] [CrossRef]
  15. Jagadeesan, B.; Gerner-Smidt, P.; Allard, M.W.; Leuillet, S.; Winkler, A.; Xiao, Y.; Chaffron, S.; Van Der Vossen, J.; Tang, S.; Katase, M.; et al. The Use of Next-Generation Sequencing for Improving Food Safety: Translation into Practice. Food Microbiol. 2019, 79, 96–115. [Google Scholar] [CrossRef] [PubMed]
  16. Augusta, P.S.; Nurkolis, F.; Noor, S.L.; Permatasari, H.K.; Hardinsyah; Taslim, N.A.; Batubara, S.C.; Mayulu, N.; Wewengkang, D.S.; Rotinsulu, H. Probiotic Beverage: The Potential of Anti-Diabetes within Kombucha Tea Made from Sea Grapes (Ceulerpa racemosa) Containing High Antioxidant and Polyphenol Total. Proc. Nutr. Soc. 2021, 80, E149. [Google Scholar] [CrossRef]
  17. Puspitasari, Y.; Palupi, R.; Nurikasari, M. Analisis Kandungan Vitamin C Teh Kombucha Berdasarkan Lama Fermentasi Sebagai Alternatif Minuman Untuk Antioksidan. Glob. Health Sci. 2017, 2, 245–253. Available online: https://jurnal.csdforum.com/index.php/GHS/article/view/137 (accessed on 30 August 2025). [CrossRef]
  18. Løvdal, T.; Lunestad, B.T.; Myrmel, M.; Rosnes, J.T.; Skipnes, D. Microbiological Food Safety of Seaweeds. Foods 2021, 10, 2719. [Google Scholar] [CrossRef]
  19. Zhou, W.; Wang, Y.; Xu, R.; Tian, J.; Li, T.; Chen, S. Comparative Analysis of the Nutrient Composition of Caulerpa Lentillifera from Various Cultivation Sites. Foods 2025, 14, 474. [Google Scholar] [CrossRef]
  20. Dhakal, S.; Pandey, D.; van der Heide, M.E.; Nørgaard, J.V.; Vrhovsek, U.; Khanal, P. Effect of Different Drying Methods on the Nutritional Composition and Phenolic Compounds of the Brown Macroalga, Fucus Vesiculosus (Fucales, Phaeophyceae). J. Appl. Phycol. 2024, 36, 3649–3663. [Google Scholar] [CrossRef]
  21. Khaerah, A.; Halijah, H.; Nawir, N. Perbandingan Total Mikroba Kombucha Dengan Variasi Jenis Teh Dan Lama Fermentasi. Bionature 2020, 21, 26–34. [Google Scholar] [CrossRef]
  22. Azizah, N.; Al-Barrii, A.N.; Mulyani, S. Pengaruh Lama Fermentasi Terhadap Kadar Alkohol, pH, Dan Produksi Gas Pada Proses Fermentasi Bioetanol Dari Whey Dengan Substitusi Kulit Nanas. J. Apl. Teknol. Pangan 2012, 1, 72–77. [Google Scholar]
  23. Guerra, V.; Beule, L.; Lehtsaar, E.; Liao, H.-L.; Karlovsky, P. Improved Protocol for DNA Extraction from Subsoils Using Phosphate Lysis Buffer. Microorganisms 2020, 8, 532. [Google Scholar] [CrossRef] [PubMed]
  24. Zhang, H.; Wang, X.; Chen, A.; Li, S.; Tao, R.; Chen, K.; Huang, P.; Li, L.; Huang, J.; Li, C.; et al. Comparison of the Full-Length Sequence and Sub-Regions of 16S RRNA Gene for Skin Microbiome Profiling. mSystems 2024, 9, e0039924. [Google Scholar] [CrossRef]
  25. Callahan, B.J.; McMurdie, P.J.; Rosen, M.J.; Han, A.W.; Johnson, A.J.A.; Holmes, S.P. DADA2: High-Resolution Sample Inference from Illumina Amplicon Data. Nat. Methods 2016, 13, 581–583. [Google Scholar] [CrossRef]
  26. Edgar, R.C.; Flyvbjerg, H. Error Filtering, Pair Assembly and Error Correction for Next-Generation Sequencing Reads. Bioinformatics 2015, 31, 3476–3482. [Google Scholar] [CrossRef]
  27. Czech, L.; Barbera, P.; Stamatakis, A. Genesis and Gappa: Processing, Analyzing and Visualizing Phylogenetic (Placement) Data. Bioinformatics 2020, 36, 3263–3265. [Google Scholar] [CrossRef]
  28. McMurdie, P.J.; Holmes, S. Phyloseq: An R Package for Reproducible Interactive Analysis and Graphics of Microbiome Census Data. PLoS ONE 2013, 8, e61217. [Google Scholar] [CrossRef]
  29. Siagian, K.D.; Lantang, D.; Dirgantara, S.; Simaremare, E.S. Uji Aktivitas Antifungi Anggur Laut (Caulerpa sp.) Asal Pulau Ambai Serui Terhadap Fungi Candida Krusei Dan Candida Albicans. Pharmacy 2018, 15, 16. [Google Scholar] [CrossRef]
  30. Yulianto, S.; Jamilatun, M.; Jamilatun, M.; Pangesti, F.A.; Pangesti, F.A. Analisis Kadar Vitamin C Wedang Jeruk Nipis (Citrus aurantifolia) Berdasarkan Variasi Suhu Menggunakan Metode Spektrofotometri Uv—Vis. J. Formil (Forum Ilm.) Kesmas Respati 2022, 7, 208. [Google Scholar] [CrossRef]
  31. Mulyani, E.; Herlina, H.; Suci, K. Penetapan Kadar Tanin Ekstrak Daun Pagoda (Clerodendrum Paniculantum) Dengan Metode Spektrofotometri Visible Dan Titrasi Permanganometri. Lumbung Farm. J. Ilmu Kefarmasian 2022, 3, 7. [Google Scholar] [CrossRef]
  32. Ramadhani, N.; Samudra, A.G.; Pratiwi, L.W.I. Analisis Penetapan Kadar Flavonoid Sari Jeruk Kalamansi (Citrofortunella Microcarpa) Dengan Metode Spektrofotometri UV-VIS. J. Mandala Pharmacon Indones. 2020, 6, 53–58. [Google Scholar] [CrossRef]
  33. Molyneux, P. The Use of the Stable Free Radical Diphenylpicrylhydrazyl (Dpph) for Estimating Antioxidant Activity. Songklanakarin J. Sci. Technol. 2004, 26, 211–219. [Google Scholar]
  34. Suffys, S.; Richard, G.; Burgeon, C.; Werrie, P.-Y.; Haubruge, E.; Fauconnier, M.-L.; Goffin, D. Characterization of Aroma Active Compound Production during Kombucha Fermentation: Towards the Control of Sensory Profiles. Foods 2023, 12, 1657. [Google Scholar] [CrossRef] [PubMed]
  35. Chakravorty, S.; Bhattacharya, S.; Chatzinotas, A.; Chakraborty, W.; Bhattacharya, D.; Gachhui, R. Kombucha Tea Fermentation: Microbial and Biochemical Dynamics. Int. J. Food Microbiol. 2016, 220, 63–72. [Google Scholar] [CrossRef]
  36. Tran, T.; Grandvalet, C.; Verdier, F.; Martin, A.; Alexandre, H.; Tourdot-Maréchal, R. Microbiological and Technological Parameters Impacting the Chemical Composition and Sensory Quality of Kombucha. Compr. Rev. Food Sci. Food Saf. 2020, 19, 2050–2070. [Google Scholar] [CrossRef] [PubMed]
  37. Villarreal-Soto, S.A.; Beaufort, S.; Bouajila, J.; Souchard, J.-P.; Taillandier, P. Understanding Kombucha Tea Fermentation: A Review. J. Food Sci. 2018, 83, 580–588. [Google Scholar] [CrossRef] [PubMed]
  38. Hur, S.J.; Lee, S.Y.; Kim, Y.-C.; Choi, I.; Kim, G.-B. Effect of Fermentation on the Antioxidant Activity in Plant-Based Foods. Food Chem. 2014, 160, 346–356. [Google Scholar] [CrossRef] [PubMed]
  39. Tesvichian, S.; Sangtanoo, P.; Srimongkol, P.; Saisavoey, T.; Buakeaw, A.; Puthong, S.; Thitiprasert, S.; Mekboonsonglarp, W.; Liangsakul, J.; Sopon, A.; et al. Sulfated Polysaccharides from Caulerpa Lentillifera: Optimizing the Process of Extraction, Structural Characteristics, Antioxidant Capabilities, and Anti-Glycation Properties. Heliyon 2024, 10, e24444. [Google Scholar] [CrossRef]
  40. Zhao, W.; Subbiah, V.; Xie, C.; Yang, Z.; Shi, L.; Barrow, C.; Dunshea, F.; Suleria, H.A.R. Bioaccessibility and Bioavailability of Phenolic Compounds in Seaweed. Food Rev. Int. 2022, 39, 5729–5760. [Google Scholar] [CrossRef]
  41. Tarhan Kuzu, K.; Aykut, G.; Tek, S.; Yatmaz, E.; Germec, M.; Yavuz, I.; Turhan, I. Production and Characterization of Kombucha Tea from Different Sources of Tea and Its Kinetic Modeling. Processes 2023, 11, 2100. [Google Scholar] [CrossRef]
  42. Ningsih, D.R.; Bintoro, V.P.; Nurwantoro, N. Analisis Total Padatan Terlarut, Kadar Alkohol, Nilai PH Dan Total Asam Pada Kefir Optima Dengan Penambahan High Fructose Syrup (HFS). J. Teknol. Pang. 2018, 2, 84–89. [Google Scholar] [CrossRef]
  43. Nur, M.; Hasriadi, H.; Ita Juwita, A.; Mursida, M. Korelasi Waktu Fermentasi Terhadap Arus Listrik Albedo Dan Flavedo Jeruk Pamelo (Citrus Maxima). Agrokompleks 2021, 21, 33–39. [Google Scholar] [CrossRef]
  44. Greenwalt, C.J.; Ledford, R.A.; Steinkraus, K.H. Determination and Characterization of the Antimicrobial Activity of the Fermented TeaKombucha. LWT Food Sci. Technol. 1998, 31, 291–296. [Google Scholar] [CrossRef]
  45. Zeng, L.; Ma, M.; Li, C.; Luo, L. Stability of Tea Polyphenols Solution with Different PH at Different Temperatures. Int. J. Food Prop. 2017, 20, 1–18. [Google Scholar] [CrossRef]
  46. Dewi, R.S. Analisis Metagenomik Bakteri Pada Kombucha Anggur Laut (Caulerpa racemosa) Berdasarkan Gen 16S RRNA; UIN Sunan Kalijaga: Yogyakarta, Indonesia, 2025. [Google Scholar]
  47. Phung, L.T.; Kitwetcharoen, H.; Chamnipa, N.; Boonchot, N.; Thanonkeo, S.; Tippayawat, P.; Klanrit, P.; Yamada, M.; Thanonkeo, P. Changes in the Chemical Compositions and Biological Properties of Kombucha Beverages Made from Black Teas and Pineapple Peels and Cores. Sci. Rep. 2023, 13, 7859. [Google Scholar] [CrossRef]
  48. Antolak, H.; Piechota, D.; Kucharska, A. Kombucha Tea Double Power of Bioactive Compounds from Tea and Symbiotic Culture of Bacteria and Yeasts (SCOBY). Antioxidants 2021, 10, 1541. [Google Scholar] [CrossRef]
  49. Wang, B.; Rutherfurd-Markwick, K.; Zhang, X.-X.; Mutukumira, A.N. Kombucha: Production and Microbiological Research. Foods 2022, 11, 3456. [Google Scholar] [CrossRef]
  50. Wu, L.-H.; Lu, Z.-M.; Zhang, X.-J.; Wang, Z.-M.; Yu, Y.-J.; Shi, J.-S.; Xu, Z.-H. Metagenomics Reveals Flavour Metabolic Network of Cereal Vinegar Microbiota. Food Microbiol. 2017, 62, 23–31. [Google Scholar] [CrossRef]
  51. Jayabalan, R.; Malbaša, R.V.; Lončar, E.S.; Vitas, J.S.; Sathishkumar, M. A Review on Kombucha Tea-Microbiology, Composition, Fermentation, Beneficial Effects, Toxicity, and Tea Fungus. Compr. Rev. Food Sci. Food Saf. 2014, 13, 538–550. [Google Scholar] [CrossRef]
  52. Santosa, G.W.; Djunaedi, A.; Susanto, A.B.; Pringgenies, D.; Ariyanto, D.; Pranoton, A.K. The Potential Two Types of Green Macroalgae (Caulerpa racemose and Caulerpa lentillifera) as a Natural Food Preservative from Jepara Beach, Indonesia. Trends Sci. 2024, 21, 7394. [Google Scholar] [CrossRef]
  53. Gao, P.; Zhang, Z.; Jiang, Q.; Hu, X.; Zhang, X.; Yu, P.; Yang, F.; Liu, S.; Xia, W. Metabolomics Ravels Flavor Compound Formation and Metabolite Transformation in Rapid Fermentation of Salt-Free Fish Sauce from Catfish Frames Induced by Mixed Microbial Cultures. Food Chem. 2025, 463, 141246. [Google Scholar] [CrossRef] [PubMed]
  54. Han, D.; Yang, Y.; Guo, Z.; Dai, S.; Jiang, M.; Zhu, Y.; Wang, Y.; Yu, Z.; Wang, K.; Rong, C.; et al. A Review on the Interaction of Acetic Acid Bacteria and Microbes in Food Fermentation: A Microbial Ecology Perspective. Foods 2024, 13, 2534. [Google Scholar] [CrossRef]
  55. Wang, X.; Li, Y.; Zuo, L.; Li, P.; Lou, H.; Zhao, R. Revealing the Characteristics and Correlations among Microbial Communities, Functional Genes, and Vital Metabolites through Metagenomics in Henan Mung Bean Sour. Microorganisms 2025, 13, 845. [Google Scholar] [CrossRef]
  56. Liao, T.; Li, X.-R.; Fan, L.; Zhang, B.; Zheng, W.-M.; Hua, J.-J.; Li, L.; Mahror, N.; Cheng, L.-H. Nature of Back Slopping Kombucha Fermentation Process: Insights from the Microbial Succession, Metabolites Composition Changes and Their Correlations. Front. Microbiol. 2024, 15, 1433127. [Google Scholar] [CrossRef]
  57. Villarreal-Soto, S.A.; Bouajila, J.; Pace, M.; Leech, J.; Cotter, P.D.; Souchard, J.-P.; Taillandier, P.; Beaufort, S. Metabolome-Microbiome Signatures in the Fermented Beverage, Kombucha. Int. J. Food Microbiol. 2020, 333, 108778. [Google Scholar] [CrossRef]
  58. Zhang, H.; Dou, Z.; Bi, W.; Yang, C.; Wu, X.; Wang, L. Multi-Omics Study of Sulfur Metabolism Affecting Functional Microbial Community Succession during Aerobic Solid-State Fermentation. Bioresour. Technol. 2023, 387, 129664. [Google Scholar] [CrossRef]
  59. Fu, C.; Yan, F.; Cao, Z.; Xie, F.; Lin, J. Antioxidant Activities of Kombucha Prepared from Three Different Substrates and Changes in Content of Probiotics during Storage. Food Sci. Technol. 2014, 34, 123–126. [Google Scholar] [CrossRef]
  60. Martínez Leal, J.; Valenzuela Suárez, L.; Jayabalan, R.; Huerta Oros, J.; Escalante-Aburto, A. A Review on Health Benefits of Kombucha Nutritional Compounds and Metabolites. CyTA J. Food 2018, 16, 390–399. [Google Scholar] [CrossRef]
  61. Jayabalan, R.; Marimuthu, S.; Swaminathan, K. Changes in Content of Organic Acids and Tea Polyphenols during Kombucha Tea Fermentation. Food Chem. 2007, 102, 392–398. [Google Scholar] [CrossRef]
  62. Fukaya, M.; Takemura, H.; Tayama, K.; Okumura, H.; Kawamura, Y.; Horinouchi, S.; Beppu, T. The AarC Gene Responsible for Acetic Acid Assimilation Confers Acetic Acid Resistance on Acetobacter Aceti. J. Ferment. Bioeng. 1993, 76, 270–275. [Google Scholar] [CrossRef]
  63. Mamlouk, D.; Gullo, M. Acetic Acid Bacteria: Physiology and Carbon Sources Oxidation. Indian J. Microbiol. 2013, 53, 377–384. [Google Scholar] [CrossRef]
  64. Chi, Z.; Wang, Z.-P.; Wang, G.-Y.; Khan, I.; Chi, Z.-M. Microbial Biosynthesis and Secretion of L-Malic Acid and Its Applications. Crit. Rev. Biotechnol. 2016, 36, 99–107. [Google Scholar] [CrossRef] [PubMed]
  65. Nakayama, S.; Tabata, K.; Oba, T.; Kusumoto, K.; Mitsuiki, S.; Kadokura, T.; Nakazato, A. Characteristics of the High Malic Acid Production Mechanism in Saccharomyces Cerevisiae Sake Yeast Strain No. 28. J. Biosci. Bioeng. 2012, 114, 281–285. [Google Scholar] [CrossRef] [PubMed]
  66. Wu, Y.; Xia, M.; Zhang, X.; Li, X.; Zhang, R.; Yan, Y.; Lang, F.; Zheng, Y.; Wang, M. Unraveling the Metabolic Network of Organic Acids in Solid-State Fermentation of Chinese Cereal Vinegar. Food Sci. Nutr. 2021, 9, 4375–4384. [Google Scholar] [CrossRef] [PubMed]
  67. Ivanišová, E.; Meňhartová, K.; Terentjeva, M.; Harangozo, Ľ.; Kántor, A.; Kačániová, M. The Evaluation of Chemical, Antioxidant, Antimicrobial, and Sensory Properties of Kombucha Tea Beverage. J. Food Sci. Technol. 2020, 57, 1840–1846. [Google Scholar] [CrossRef]
  68. Møretrø, T.; Langsrud, S. Residential Bacteria on Surfaces in the Food Industry and Their Implications for Food Safety and Quality. Compr. Rev. Food Sci. Food Saf. 2017, 16, 1022–1041. [Google Scholar] [CrossRef]
  69. de Miranda, J.F.; Ruiz, L.F.; Silva, C.B.; Uekane, T.M.; Silva, K.A.; Gonzalez, A.G.M.; Fernandes, F.F.; Lima, A.R. Kombucha: A Review of Substrates, Regulations, Composition, and Biological Properties. J. Food Sci. 2022, 87, 503–527. [Google Scholar] [CrossRef]
  70. Ivanišová, E.; Meňhartová, K.; Terentjeva, M.; Godočíková, L.; Árvay, J.; Kačániová, M. Kombucha Tea Beverage: Microbiological Characteristic, Antioxidant Activity, and Phytochemical Composition. Acta Aliment. 2019, 48, 324–331. [Google Scholar] [CrossRef]
  71. Marwati; Syahrumsyah, H.; Handria, R. Pengaruh Konsentrasi Gula Dan Strater Terhadap Mutu Teh Kombucha. J. Teknol. Pertan. 2013, 8, 49–53. [Google Scholar]
  72. Anggraini, A.C.; Retnaningrum, E. Efektivitas Dan Kualitas Produk Fermentasi Kombucha Dengan Kombinasi Substrat Teh Daun Sukun (Artocarpus Altilis (Parkinson) Fosberg) Dan Lemon (Citrus limon (L.) Burm. f.). J. Pengolah. Pangan 2023, 8, 97–106. [Google Scholar] [CrossRef]
  73. Kurniawan, M.B.; Ginting, S.; Nurminah, M. Pengaruh Penambahan Gula Dan Starter Terhadap Karakteristik Minuman Teh Kombucha Daun Gambir (Uncaria Gambir Roxb). J. Rekayasa Pangan Dan Pertan. 2017, 5, 251–257. [Google Scholar]
  74. Jamilah, V. Pengaruh Variasi Konsentrasi Starter Terhadap Kualitas Teh Kombucha (Studi Eksperimen Sebagai Sumber Belajar Peserta Didik Pada Materi Bioteknologi Untuk Sekolah Menenegah Atas Kelas XII Semester Genap). Ph.D. Thesis, UIN Raden Intan Lampung, Bandar Lampung, Indonesia, 2019. [Google Scholar]
  75. Zubaidah, E.; Yurista, S.; Rahmadani, N.R. Characteristic of Physical, Chemical, and Microbiological Kombucha from Various Varieties of Apples. IOP Conf. Ser. Earth Environ. Sci. 2018, 131, 012040. [Google Scholar] [CrossRef]
  76. Guo, X.; Chen, D.; Huang, P.; Gao, L.; Zhou, W.; Zhang, J.; Zhang, Q. Effects of Tannin-Tolerant Lactic Acid Bacteria in Combination with Tannic Acid on the Fermentation Quality, Protease Activity and Bacterial Community of Stylo Silage. J. Sci. Food Agric. 2025, 105, 2540–2551. [Google Scholar] [CrossRef]
  77. Prajapati, K.; Prajapati, J.; Patel, D.; Patel, R.; Varshnei, A.; Saraf, M.; Goswami, D. Multidisciplinary Advances in Kombucha Fermentation, Health Efficacy, and Market Evolution. Arch. Microbiol. 2024, 206, 366. [Google Scholar] [CrossRef]
  78. Yang, F.; Chen, C.; Ni, D.; Yang, Y.; Tian, J.; Li, Y.; Chen, S.; Ye, X.; Wang, L. Effects of Fermentation on Bioactivity and the Composition of Polyphenols Contained in Polyphenol-Rich Foods: A Review. Foods 2023, 12, 3315. [Google Scholar] [CrossRef]
  79. Cvetković, D.; Ranitović, A.; Savić, D.; Joković, N.; Vidaković, A.; Pezo, L.; Markov, S. Survival of Wild Strains of Lactobacilli during Kombucha Fermentation and Their Contribution to Functional Characteristics of Beverage. Pol. J. Food Nutr. Sci. 2019, 69, 407–415. [Google Scholar] [CrossRef]
  80. Rahmi, N.; Khairiah, N.; Rufida, R.; Hidayati, S.; Muis, A. Pengaruh Fermentasi Terhadap Total Fenolik, Aktivitas Penghambatan Radikal Dan Antibakteri Ekstrak Tepung Biji Teratai (Effect of Fermentation on Total Phenolic, Radical Scavenging and Antibacterial Activity of Waterlily (Nymphaea Pubescens Willd.). Biopropal Ind. 2020, 11, 9. [Google Scholar] [CrossRef]
  81. Kwaw, E.; Ma, Y.; Tchabo, W.; Apaliya, M.T.; Wu, M.; Sackey, A.S.; Xiao, L.; Tahir, H.E. Effect of Lactobacillus Strains on Phenolic Profile, Color Attributes and Antioxidant Activities of Lactic-Acid-Fermented Mulberry Juice. Food Chem. 2018, 250, 148–154. [Google Scholar] [CrossRef]
  82. Jakubczyk, K.; Kałduńska, J.; Kochman, J.; Janda, K. Chemical Profile and Antioxidant Activity of the Kombucha Beverage Derived from White, Green, Black, and Red Tea. Antioxidants 2020, 9, 447. [Google Scholar] [CrossRef]
  83. Rosita, H.; Amaro, D. Pengaruh Konsentrasi Starter SCOBY (Symbiotic Culture of Bacteria and Yeast) Terhadap Mutu Kimia, Mikrobiologi Dan Organoleptik Kombucha Sari Apel. J. Ilmu Dan Teknol. Pangan 2021, 7, 12–22. [Google Scholar]
  84. Morales, D. Biological Activities of Kombucha Beverages: The Need for Clinical Evidence. Trends Food Sci. Technol. 2020, 105, 323–333. [Google Scholar] [CrossRef]
  85. Leal, J.M.M.; Valera, M.J.D.; Hernández, C.R.; González, R.J. Fermented Kombucha Beverages: Microbial and Chemical Analysis. Food Chem. 2018, 265, 1–7. [Google Scholar]
  86. Sharma, S.; Sahai, S.; Singh, P. GC-MS-Based Chemical Profiling and Antimicrobial Activity of Fatty Acid Esters from Fermented Food Bacteria. J. Appl. Microbiol. 2020, 128, 1442–1451. [Google Scholar]
  87. Yadav, R.; Tripathi, M.K.; Mishra, A. Role of Sugar Alcohols in Food Industry: Current Applications and Future Aspects. Food Res. Int. 2021, 140. [Google Scholar] [CrossRef]
  88. Bicas, J.L.; Dionisio, A.P.; Pastore, G.M. Bio-Oxidation of Terpenes: An Approach for Flavour Industry. Chem. Soc. Rev. 2011, 40, 4455–4475. [Google Scholar] [CrossRef] [PubMed]
  89. de Carvalho, C.C.C.R.; da Fonseca, M.M.R. Biotransformation of Terpenes. Biotechnol. Adv. 2006, 24, 134–142. [Google Scholar] [CrossRef]
  90. Baskar, A.A.; Numair, K.S.; Alsaif, M.A.; Ignacimuthu, S. β-Sitosterol Prevents Lipid Peroxidation and Improves Antioxidant Status and Histopathological Changes in Rats with Hepatic Injury. Food Chem. Toxicol. 2012, 50, 2409–2415. [Google Scholar]
  91. Gupta, M.B.; Nath, R.; Srivastava, N.; Shanker, K.; Kishor, K.; Bhargava, K.P. Anti-Inflammatory and Antipyretic Activities of Beta-Sitosterol. Planta Med. 1980, 39, 157–163. [Google Scholar] [CrossRef]
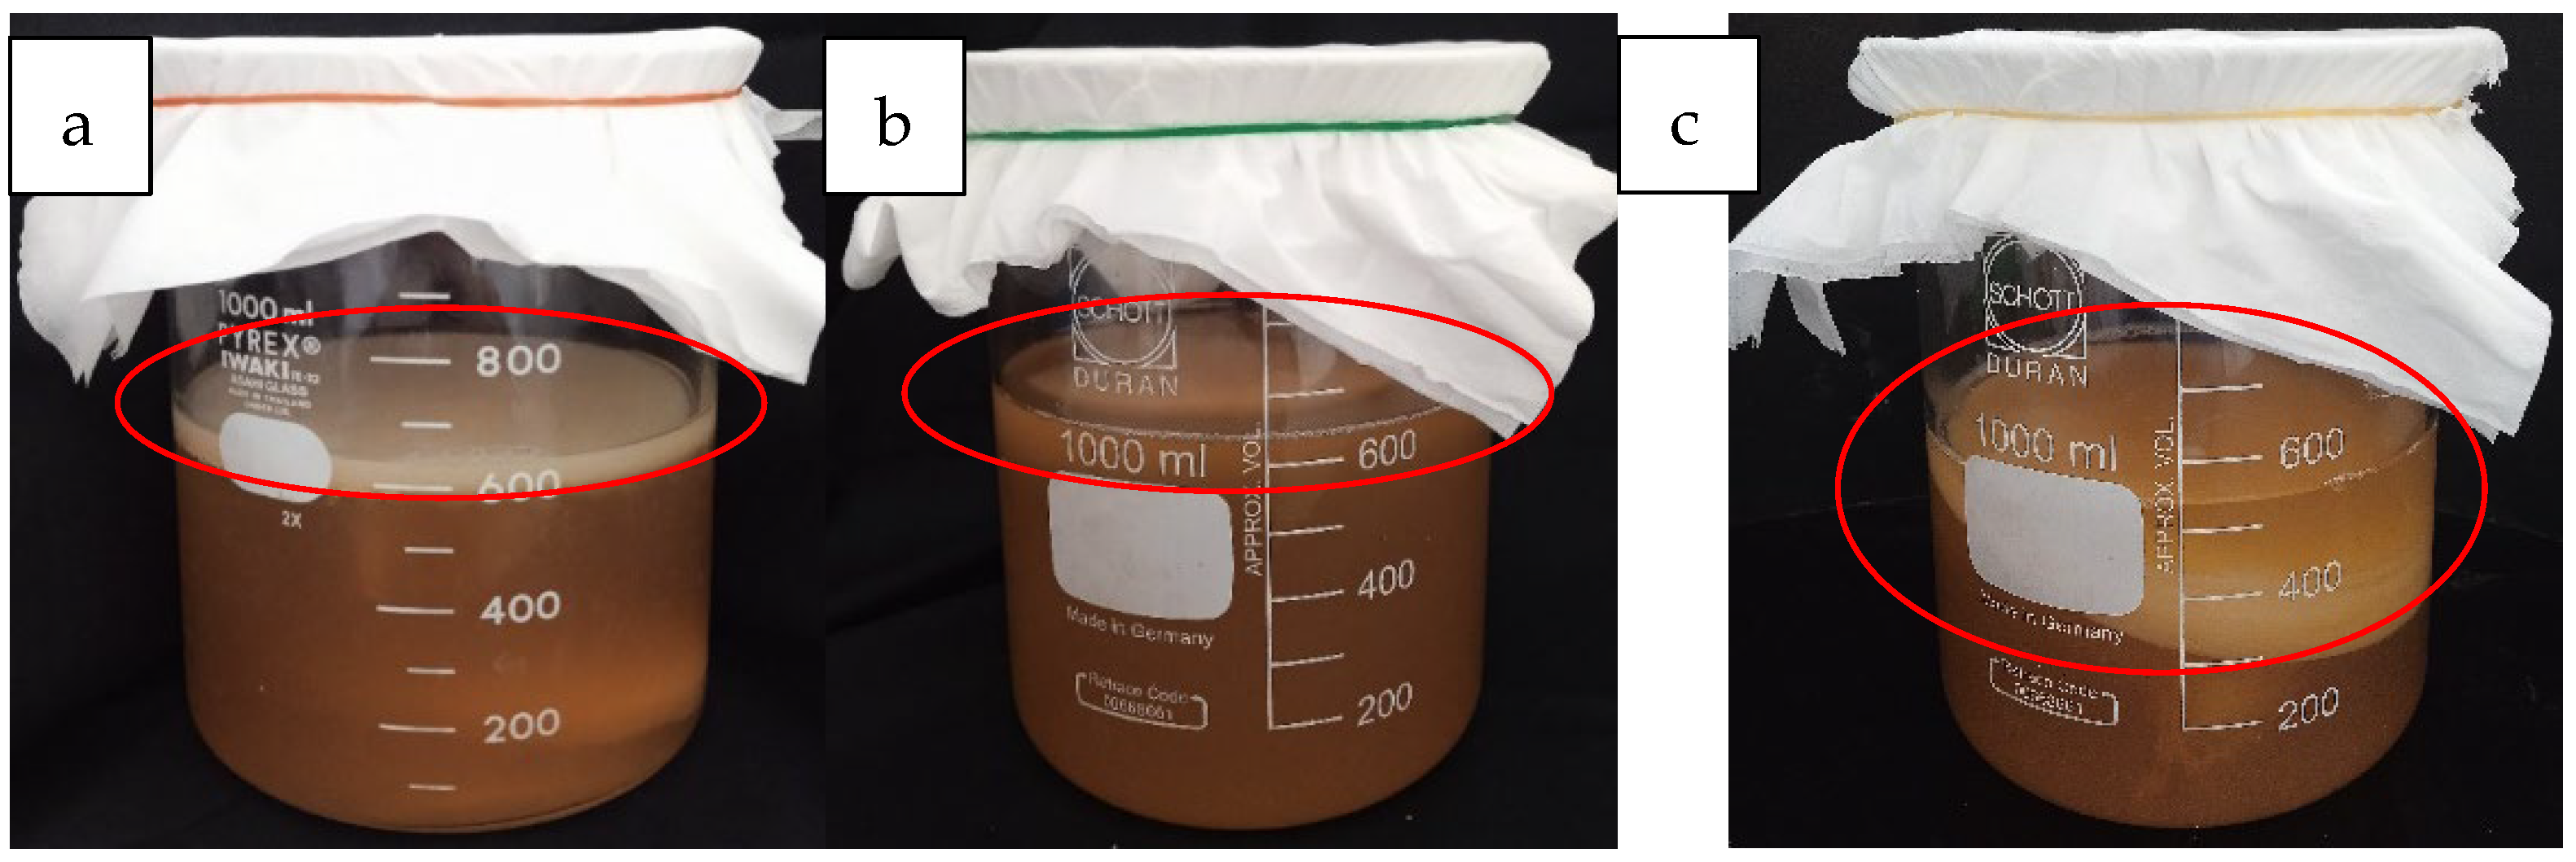
Figure 1. Sea Grape Kombucha: (a) F7: 7 Days Fermentation, (b) F14: 14 Days Fermentation, (c) F21: 21 Days Fermentation.
Beverages 11 00134 g001
Figure 2. The pH value of Sea Grape Kombucha under different fermentation durations showed a decreasing trend with the progression of fermentation days. ns, not significant (p > 0.05), *, ***, **** significant (p < 0.05).
Beverages 11 00134 g002
Figure 3. Visualization of the 16S rRNA amplification results from three Sea Grape Kombucha samples on 1% agarose gel confirmed successful amplification of the 16S rRNA gene (V3–V4 region), indicated by a band size of approximately 470 bp. Note: M: Marker, 1: 7 Days of Sea Grape Kombucha, 2: 14 Days of Sea Grape Kombucha, 3: 21 Days of Sea Grape Kombucha, NTC: No Template Control.
Beverages 11 00134 g003
Figure 4. Genus Diversity Heatmap Across Various Fermentation Stages of Kombucha (F7, F14, F21), Dominated by the Genus Komagataeibacter.
Beverages 11 00134 g004
Figure 5. Graph of Predicted Relative Abundance (%) of the Sea Grape Kombucha Metabolic Profile Based on KEGG Database (a) Level 1, (b) Level 2 [Metabolism], (c) Level 3 [Carbohydrate metabolism, Energy metabolism, Nucleotide metabolism, Amino acid metabolism].
Beverages 11 00134 g005
Figure 6. Heatmap of metabolic pathway correlations in the bacterial community of sea grape kombucha based on KEGG level 3 database across different fermentation days: (a) F7, (b) F14, and (c) F21. Color intensity indicates the normalized abundance of each pathway (norm_taxon_func_abun).
Beverages 11 00134 g006
Figure 7. Bubble plot of enzymatic pathway correlations related to organic acid metabolism in the bacterial community of sea grape kombucha based on the MetaCyc database. The size and color intensity of the bubbles represent the normalized abundance of each pathway (norm_taxon_func_abun).
Beverages 11 00134 g007
Figure 8. Sea grape kombucha: (a) before fermentation, (b) after fermentation, (c) after filtration.
Beverages 11 00134 g008
Table 1. Dada2 parameter: filterAndTrim (Galaxy Versi 1.30.0+galaxy0).
Trim Filter
truncQ2maxLenNA
trimLeft0minLen20
trimRight0maxN0
truncLen0minQ0
maxEE2
Table 2. Physicochemical Characteristics of Sea Grape Kombucha.
SamplespHSoluble Solid Content Vitamin C Content
(mg AAE/mL)
Total Tannin ContentTotal Flavonoid Content
(°Brix)(mg GAE/mL)(mg QE/mL)
K04.133 ± 0.01817.17 ± 0.140.4872 ± 0.00110.1135 ± 0.00070.0620 ± 0.0009
K1 (10%)2.566 ± 0.02111.08 ± 0.800.2123 ± 0.01840.2721 ± 0.02230.0589 ± 0.0008
K2 (15%)2.618 ± 0.01311.17 ± 0.800.2446 ± 0.01560.3070 ± 0.00790.0550 ± 0.0013
K3 (20%)2.723 ± 0.01710.04 ± 0.070.2118 ± 0.00770.3126 ± 0.00750.0525 ± 0.0030
Notes: K0 = control (sea grape infusion); K1 = 10% (v/w) SCOBY starter solution; K2 = 15% (v/w) SCOBY starter solution; K3 = 20% (v/w) SCOBY starter solution.
Table 3. Antioxidant Activity of Sea Grape Kombucha.
SamplesIC50
(µg/mL)
K0101.470 ± 5.88
K1 (10%)69.637 ± 2.45
K2 (15%)56.947 ± 2.45
K3 (20%)49.572 ± 2.45
Table 4. Sample with 10% starter concentration (K1).
NoCompounds NamePercent Area (%)Molecular FormulaFunctional Group Compound GroupPubChem CID
C1Quinic acid2.30C7H12O6-COOH, -OHOrganic acid6508
C2Palmitic acid1.09C16H32O2-COOHSaturated fatty acid985
C32-Propenoic acid0.96C3H4O2-COOH, C=CUnsaturated fatty acid6581
C4Glucitol1.66C6H14O6-OH (polyhydroxy)Sugar alcohol/polyol82170
C5Hexadecanoic acid4.58C16H32O2-COOHSaturated fatty acid985
C6Octadec-9-enoic acid3.97C18H34O2-COOH, C=CUnsaturated fatty acid965
Table 5. Sample with 15% starter concentration (K2).
NoCompounds NamePercent Area (%)Molecular FormulaFunctional Group Compound GroupPubChem CID
C1Phytol11.02C20H40OAlcohol (-OH)Diterpenoid alcohol5280435
C2Phytol, acetate7.05C22H42OEsterTerpenoid ester637195
C3Phytyl decanoate7.90C30H58O2EsterTerpenoid ester140471960
C4Pregn-4-ene-3,20-dione, 21-(acetyloxy)-9-fluoro-11,17-dihydroxy-2-methyl-, (2beta,11beta)-1.07C24H33FO6Keton, Ester, -OHSteroid complexes31719
C5Rhodopin0.65C40H58OAlcohol, Polyenes Carotenoid5365880
C6ß-Sitosterol11.89C29H50OAlcohol (Sterol)Phytosterol222284
C7Hexadecanoic acid7.25C16H32O2Carboxylic acid (-COOH)Fatty acid985
C8Hexadecanoic acid, 1-(hydroxymethyl)-1,2-ethanediyl ester4.05C35H68O5EsterEsterified fatty acids99931
C9i-Propyl 11,12-methylene-octadecanoate1.04C22H42O2EsterEsterified fatty acids91692516
C10Neophytadiene3.20C20H38AlkenesDiterpene hydrocarbons10446
Table 6. Sample with 20% starter concentration (K3).
NoCompounds NamePersen Area (%)Molecular FormulaGugus FungsiKelompok SenyawaPubChem CID
C1Sorbitol32.30C6H14O6Polyhydroxy Alcohol (-OH)Sugar alcohol/polyol5780
C2ß-Sitosterol1.80C29H50OSteroidal alcohol (-OH)Phytosterol222284
C3γ-Sitosterol6.45C29H50OSteroidal alcohol (-OH)Phytosterol457801
C4Palmitic acid methyl ester0.54C17H34O2Ester (-COOCH3)Ester fatty acid8181
C5Carveol6.70C10H16OAlcohol, alkenes (C=C)Monoterpene alcohol7438
C6α-Terpineol10.22C10H18OAlcoholMonoterpene alcohol17100
C7Limetol1.90C10H18OAlcoholMonoterpene alcohol522514
Disclaimer/Publisher’s Note: The statements, opinions and data contained in all publications are solely those of the individual author(s) and contributor(s) and not of MDPI and/or the editor(s). MDPI and/or the editor(s) disclaim responsibility for any injury to people or property resulting from any ideas, methods, instructions or products referred to in the content.