Article

Effects of Enzymatic Hydrolysis Combined with Ultrasonic Treatment on the Properties of an Apple Juice Enriched with Apple Bagasse

by
Alina Manthei
,
Pedro Elez-Martínez
*,
Olga Martín-Belloso
and
Robert Soliva-Fortuny
Department of Food Technology, Engineering and Science, University of Lleida—Agrotecnio CERCA Centre, Av. Alcalde Rovira Roure, 191, 25198 Lleida, Spain
*
Author to whom correspondence should be addressed.
Beverages 2025, 11(5), 133; https://doi.org/10.3390/beverages11050133
Submission received: 31 March 2025 / Revised: 25 April 2025 / Accepted: 5 August 2025 / Published: 4 September 2025

Abstract

The incorporation of apple bagasse (AB), a by-product of juice extraction, into apple juice can enhance its nutritional value while reducing food waste. This study investigated the effects of enzymatic hydrolysis (EH) and ultrasonic pre-treatment (US) on AB-enriched apple juice, focusing on its physicochemical, functional, and health-promoting properties. Apple juice was fortified with AB (1.5%, 3%, 4.5%) and subjected to EH using a cellulase-pectinase mixture for different durations (2, 6, 24 h). Optimal EH conditions (2 h, 3% AB) were combined with US (400 W, 8 min). Key parameters were analyzed, including total phenolic content, antioxidant activity, and glycemic response, alongside sensory evaluation. EH reduced particle size (D50), viscosity, and pH, while increasing GalA content, with effects intensifying over time. US further decreased D50 by 25.4% and viscosity by 39.7% but had no impact on other properties. Juices with 3% and 4.5% AB had over twice the phenolic content and 2.5–3× higher antioxidant activity. They also exhibited a potential hypoglycemic effect, with enhanced in vitro glucose retardationand lower blood glucose levels in 10 individuals. In conclusion, AB-enriched apple juice, treated with US and EH, showed higher nutritional value while maintaining acceptable sensory properties.

1. Introduction

The health-promoting effect of a high dietary fiber (DF) intake is widely acknowledged. The consumption of DF is primarily linked to the modulation of gut microbiota and attenuated blood glucose and cholesterol level leading to a lower risk for the development of coronary heart diseases, type 2 diabetes and obesity [1]. However, studies have proven that the average intake in most developed countries is lower than the daily recommended intake of 25–35 g [2]. This emphasizes the demand of exploring new DF sources and developing new fiber-enriched food products which meet the requirement of 3 g of DF in 100 g of product to be declared as ‘source of fiber’ [3]. Fruit by-products, such as bagasse and peel, are emerging as a novel DF source due to their high content of DF, therein high proportion of soluble DF (SDF), and bioactive compounds, such as polyphenols and carotenoids. These residues, discarded after juice preparation and processing, offer an affordable and sustainable solution for obtaining DF. Their utilization is needed urgently to prevent environmental problems related to the greenhouse gas emissions while decomposing on landfills [4].
An application of high interest to support the concept of circular economy is the enrichment of the juice with bagasse that originates from its production. The introduction of bagasse into a juice could result in a product with enhanced health-promoting effect, particularly higher antioxidant properties and a lower glycemic effect. This is mainly attributed to the interaction between DF and glucose molecules resulting in reduced diffusion rates and absorption. The modulation of the glycemic index of a product holds significant importance. High glucose spikes, i.e., sharp rises in blood glucose levels, are associated with enhanced inflammation [5], hormone dysregulation [6] and overall higher risk to develop several diseases, such as obesity, type 2 diabetes, cardiovascular diseases and gastrointestinal disorders [7]. Processed fruit juices are prone to cause a high increase in blood glucose due to their high content of concentrated sugars and lack of DF. Therefore, the introduction of DF might attenuate the glycemic load of the product. However, when a high amount of DF (>3%) was incorporated into a food product, the rheological and sensorial properties in terms of firmness, chewiness and sandiness/grittiness were often affected negatively which was linked with the high insoluble DF (IDF) content [8,9,10]. Therefore, technologies to modify DF structure and increase the SDF content must be investigated and be incorporated into the production of fiber-enriched food products.
Ultrasonication (US) and enzymatic hydrolysis (EH) are environmentally friendly methods which are proposed to cause favorable molecular alterations and higher solubility of DF [11,12]. Structural modifications by US are caused by fluid motion, cavitational collapse of bubbles and the formation of hydroxyl radicals within the bubbles which can induce chemical reactions. High- and low-pressure regions of the high-frequency ultrasonic waves result in the generation of microbubbles and their growth by diffusion (entry of gas) and coalescence (merge of two bubbles) [13]. When the size of the bubble exceeds a limit, it collapses leading to the local increase in temperature, pressure and shear forces which can disrupt aggregates and reduce the chain length of cell wall polysaccharides [14,15]. In addition, EH is an effective method to solubilize DF when enzyme preparations are carefully selected according to the certain fiber material and its composition. When applying US prior to EH, enzymes can benefit from the loosened, partly disrupted DF structure and their efficacy in solubilizing IDF might be enhanced [16]. Research on incorporating modification technologies into high-fiber product development to valorize DF side streams and support circular economy remains limited. Integrating treatments into the food development process would address challenges associated with the preparation and drying of the ingredients after treatments, mitigate potential reductions in property enhancements by these methods and promote the homogeneous distribution of the ingredient within the food matrix. Therefore, this work explored the application of EH, and its combination with US directly in a bagasse-enriched juice to enhance its fiber functionality and, consequently, enable the incorporation of a higher DF content. Furthermore, the health outcomes of the application were evaluated using both in vitro and in vivo glucose measurements, approaches that are rarely included in comparable studies.
The impact of bagasse incorporation and efficiency of treatments was evaluated by measuring particle size, pH, color, viscosity and galacturonic acid content. The health promotion of the juices was assessed by determining antioxidant properties and the retardation of glucose in vitro. Subsequently, EH time and bagasse concentration were selected and the sensorial acceptability of the juice and its hypoglycemic effect in an in vitro study were tested.

2. Material and Methods

2.1. Material

Apples (Golden) and cloudy apple juices without additives derived from Gala apples (Cal Violí, Lleida, Spain) were purchased from a local supermarket in Lleida, Spain. For enzymatic hydrolysis, Celluclast 1.5 L (Novozymes, Copenhagen, Denmark) and Pectinase 62L (Biocatalysts Limited, Wales, UK) were selected [16,17]. For the determination of glucose in in vitro experiments, a glucose assay kit (Megazyme, Wicklow, Ireland) was used containing the GOPOD reagent which comprises a GOPOD reagent buffer and enzymes, i.e., glucose oxidase and peroxidase. Galacturonic acid, gallic acid and trolox standards, purchased from Sigma Aldrich (St. Louis, MO, USA), served the analysis of pectin, total phenolic contents and antioxidant activity. Apple pectin, i.e., poly-D-galacturonic acid methyl ester, with 70–75% esterification (Sigma Aldrich, St. Louis, MO, USA) was used as a reference. Bile extract porcine, pancreatin (from porcine pancreas, ≥3 USP) and α-amylase (from porcine pancreas, 15 U/mg) were purchased from Sigma Aldrich (St. Louis, MO, USA).

2.2. Preparation of Apple Bagasse

Apples were washed and the juice was extracted from the fruits (Greenstar Elite Juicer, Tribest Corporation, Anaheim, CA, USA). During juice extraction, the bagasse was collected and subsequently heated up to 85 °C for 5 min to inhibit the activity of oxidizing enzymes and prevent color changes [18]. Longer thermal treatments and higher temperatures should be avoided since it might cause DF structure modification and lower antioxidant activities. Several washings with cold distilled water using a fine mesh fabric strainer were conducted to reduce the content of free sugars to a minimum. After draining the water, the bagasse was frozen and freeze-dried for three days. Subsequently, the dried ingredient was ground with a blade grinder (Taurus aromatic, 150 W; Taurus group, Oliana, Spain) and sieved to a fine powder with a particle size of 0.3 mm.

2.3. Determination of DF Composition in Apple Bagasse

The content of insoluble and soluble dietary fiber (IDF/SDF) was measured utilizing the AOAC method 991.43 (2002). Additionally, IDF fractions were further examined by the determination of lignin and acidic detergent DF (ADF), containing lignin and cellulose, following the AOAC method 973.18 (1974) with some modifications. Neutral detergent DF (NDF), which is comprised of lignin, hemicellulose and cellulose, was determined on the basis of the AOAC method 2002.04 (2002). For each IDF fraction determination, 0.5 g of apple bagasse (AB) was weighed directly into a 25-µm particle retention filter bag (F57 Fiber bags, ANKOM Technology, Macedon, NY, USA) and the top of the bag was heat sealed. NDF was measured by covering the bag containing AB with acetone for 10 min. Subsequently, the solvent was removed, and the bag was air dried. Fiber bags were placed on the trays of a fiber analyzer (Ankom Fiber analyzer, ANKOM Technology, Macedon, NY, USA) and 100 mL of a neutral solution, which contained 60 g of sodium lauryl sulfate (SDS), 37.2 g of EDTA, 13.6 g of sodium tetraborate hydrate, 9.2 g of disodium phosphate, 20 mL of triethylene glycol dissolved in 2 L of distilled water, was added. Furthermore, 20 g of sodium sulfite and 4 mL of α-amylase were added to the solution inside the device. For ADF, heat sealed bags containing 0.5 g AB were directly placed onto the trays of the fiber analyzer and digestion was carried out with 100 mL of an acidic solution, comprising 20 g of cetyl-trimethyl-ammonium bromide in 1 L of 0.5 M H2SO4, for each AB sample. The extraction was carried out by automatic agitation and heating by the device for 75 min, when NDF was measured, and for 60 min in ADF determinations. After finishing the extraction of both IDF fractions, AB was washed three times with 1900 mL of distilled water, which was previously heated up to 80 °C. For NDF, 4 mL of α-amylasewas added in the first and second washes. Washed and extracted ADF and NDF inside of the bags were placed in 250 mL beakers and fully covered with acetone for 5 min. After air drying, they were placed on aluminum trays inside of a stove and dried at 102 ± 2 °C until constant dry matter was reached. To correct ADF and NDF for ashes, bags were incinerated for 2 h in a muffle furnace at 600 ± 15 °C and, after cooling down in a desiccator, weighed.
Finally, lignin content was determined of a 0.5 g ADF sample, which was extracted as previously described. To remove cellulose, ADF was digested additionally by submerging it in 250 mL of 72% H2SO4. After 3 h, bags were removed and washed with distilled water until pH was neutral and subsequently with acetone to wash off all remnants. The final drying followed the same procedure as utilized for ADF and NDF determinations.

2.4. Enzymatic Hydrolysis and Ultrasonic Treatment of Bagasse-Enriched Juices

Apple bagasse powder was added in different concentrations (1.5%, 3%, 4.5%) into the apple juice. Subsequently, enzymatic hydrolysis (EH) was carried out with an enzyme mixture of Celluclast 1.5 L (1% w/w) and Pectinase 62 L (0.5% w/w). Juices containing bagasse were enzymatically treated for 2, 6 and 24 h (labeled as ‘T2-x’, ‘T6-x’, ‘T24-x’ with x = concentration [%], i.e., 1.5, 3, 4.5) at 45 °C under continuous stirring. After treatments, the juices were heated up to 100 °C for 5 min to inactivate the enzymes.
After selecting a specific concentration of apple bagasse and EH time, ultrasonic treatments were performed as a physical pre-treatment on this juice using an ultrasonic homogenizer (UP400St, Hielscher Ultrasonics GmbH, Teltow, Germany) operating at a frequency of 24 kHz and maximum input power of 400 W (100% amplitude). The sonotrode with a diameter of 14 mm was applied directly into the apple juice with a depth of 20 mm and treatments were conducted for 8 min in continuous mode. To prevent thermal treatments, the bagasse-enriched juice was consistently cooled during treatments to ensure that the temperature remained below 60 °C. Following US, the juice was subjected to EH with the previously used conditions and the defined duration.
After treatments, juices were cooled down to room temperature and kept at 4 °C for further analysis. Controls of a juice without bagasse (‘Control juice’), not-treated juices containing bagasse in the same concentrations (‘NT-1.5’, ‘NT-3’, ‘NT-4.5’) but without applying treatments and a reference juice comprising 3% commercial apple pectin were carried along.

2.5. Analysis of Bagasse-Enriched Juices

2.5.1. Particle Size Distribution

Particle size distribution was analyzed using a Malvern laser particle size analyzer (Mastersizer 3000, Malvern Instruments Ltd., Malvern, UK) with a wet dispersion unit (Hydro SM). The measurements of the juices were performed in triplicate applying a refractive index of 1.333. D50 and D90 of the particle size distribution were obtained from the device’s software (Mastersizer Xplorer v3.88) and used for further analysis.

2.5.2. pH and Color

The pH values of the juices were measured with a pHmeter (micro pH 2000, Crison Instruments, Barcelona, Spain). CIE L*-, a*- and b*-value of the juices were measured by a colorimeter (CR-400 Chroma Meter, Konica Minolita, Ramsey, NJ, USA) after one day of storage. L* represents the lightness (0 = black, 100 = white), a* the redness/greenness (a* > 0 redness; a* < 0 greenness) and b* the yellowness/blueness (b* > 0 yellowness; a* < 0 blueness). These parameters provide a quantitative assessment of juice color, where changes in L* can indicate browning or opacity, and shifts in a* or b* values reflect differences in the color tone and pigmentation. Color difference ΔE between DF-enriched juices and control juice without AB was calculated as follows:
E = ( L * s L * c ) 2 + ( a * s a * c ) 2 + ( b * s b * c ) 2
L*s = Lightness value of enriched juice, L*c = Lightness value of control.

2.5.3. Viscosity

Apparent viscosities of juices were assessed using a SV-10 vibro-viscosimeter (A&D company, Tokyo, Japan). The device produces vibration of 30 Hz at a constant amplitude of 0.4 mm and controlled temperature. Results were expressed in mPa·s.

2.5.4. Galacturonic Acid Content

For the extraction of pectin, the method of Alvarez et al., (1998) [19] was used with some modifications. Firstly, the soluble fractions of the juices were separated by centrifugating 10 g of juices at 9000 rpm for 15 min and filtrating their supernatants. Subsequently, 25 mL of 95% EtOH was added, and solutions were placed into a water bath at 80 °C for 30 min. After cooling down to room temperature, alcohol-insoluble residues (AIR) were separated by filtration and washed with 73% EtOH. AIRs were collected and dissolved in 50 mL distilled water. Galacturonic acid content was analyzed spectrophotometrically adapting the method of Anthon & Barret, (2008) [20]. Therefore, a buffered copper solution was prepared by dissolving 23.2 g NaCl, 3.2 g sodium acetate, and 1.0 mL glacial acetic acid in 80 mL water. After complete dissolution, 0.5 g CuSO4 was added, and the pH was adjusted to 4.8 using NaOH. The final volume was brought up to 100 mL. For the colorimetric assay, 0.5 mL of sample solution was mixed with 0.5 mL of copper solution. The mixture was heated up to 100 °C and maintained for 35 min at this temperature. After removing it from heat, 1 mL of 1:40 diluted Folin–Ciocalteau reagent (Scharlau S.L., Barcelona, Spain) was immediately added, and color intensity was measured at 750 nm. A standard curve of 0.025 to 0.3 mM galacturonic acid standard aided the calculation of galacturonic acid in the solution.

2.5.5. Antioxidant Properties

Modified from the method utilized by Cassani et al. (2016) [21], antioxidants were extracted from 15 g of juice by adding 20 mL 80% (v/v) EtOH and mixing the solution for 90 min. Following centrifugation at 9000 rpm for 15 min, extracts were filtered and kept at −40 °C one day before analysis.
  • Total phenolic content
Determination of total phenolic content (TPC) was conducted spectrophotometrically using a multiplate spectrophotometer (Multiskan™ GO, Thermo Fisher Scientific Inc., Waltham, MA, USA). Therefore, 20 µL of the extract solution was mixed with 100 µL of 1:10 diluted Folin–Ciocalteu reagent (Scharlau S.L., Barcelona, Spain) and, after 5 min, 75 µL of 7.5% Na2CO3 was added [22]. After incubating for 1 h in the dark, the absorbance was measured at 765 nm. To calculate TPC in gallic acid equivalents (GAEs) mg/g, a calibration curve with gallic acid standard ranging from 0 to 100 µg/mL was used, following Equation (2):
T P C G A E   m g / g   j u i c e = c   · ( V / m )
c = concentration of GAE from gallic acid standard curve [mg/mL], V = Volume of extract solution [mL], m = weight of juice used for extraction [g].
b.
DPPH assay
For the measurement of radical scavenging activity, 50 µL extract solution was combined with 150 µL of DPPH solution composed of 2.4 mg of DPPH (Sigma Aldrich, St. Louis, MO, USA) in 100 mL MeOH [23]. The addition of a substance capable of donating a hydrogen atom leads to the conversion of DPPH into its reduced form resulting in the loss of violet color. Samples were incubated for 30 min in the dark before measuring absorbance at 515 nm using microtiter plates. A standard curve of Trolox from 0.0125 to 0.1 mM was performed to express DPPH scavenging activity in Trolox equivalent antioxidant capacity (TEAC) mg/g.

2.5.6. Glucose Content

The glucose contents of the bagasse, the control juice without AB and juices containing 3% AB, modified by EH of different hydrolysis times and US, were measured to evaluate the potential release of glucose by EH. Therefore, 10 mg of AB in 1.5 mL of distilled water and 1.5 mL of juices were transferred to 2 mL tubes and centrifuged at 12,000 g for 15 min. Glucose contents were determined in the supernatants. Therefore, 0.1 mL of supernatant was combined with 3 mL of GOPOD reagent of a glucose assay kit (Megazyme, Wicklow, Ireland) following incubation of 20 min at 50 °C. Absorbance was measured at 510 nm (UV-1600PC, VWR, Radnor, PA, USA) and glucose concentrations were calculated by using the glucose standard solution (1 mg/mL) of the assay kit.

2.5.7. Glucose Retardation Kinetics In Vitro

The hypoglycemic effect of juices was assessed by measuring glucose retardation in vitro over time after the simulated digestion of the juice. The digestion process followed the protocol of Ryan & Prescott, (2010) [24] with some adjustments. For the gastric phase, 20 g of juice was adjusted to pH 3 by adding 0.2 M HCl. Afterwards, 1 mL of a 4% pepsin preparation was added following an incubation at 37 °C for 30 min. The reduced time of gastric digestion simulated the rapid transit of the liquid juices through the gastrointestinal system. After completing the gastric phase, the pH of juices was increased to 5.3 utilizing 0.9 M NaHCO3 and, subsequently, 100 µL pancreatin (0.08 g in 1 mL saline) and 200 µL bile (0.1 g in 1 mL saline) were added. The pH was adjusted to 7.5 with 0.1 M NaOH. Juices were filled into dialysis tubes with a molecular weight cut-off of 14 kDa (Sigma Aldrich, St. Louis, MO, USA) and dialyzed during intestinal digestion against 150 mL distilled water. After 15, 30, 45, 60 min, 1.5 mL of sample was deducted from the dialysate and glucose concentrations were measured by mixing 0.1 mL of dialysate with 3 mL of GOPOD reagent (Megazyme, Wicklow, Ireland). Subsequent incubation of 20 min at 50 °C resulted in a pink color and its intensity was measured at 510 nm. Glucose concentrations were determined by means of a glucose standard solution (1 mg/mL) and concentrations were plotted over time, illustrating the progressive diffusion of glucose.

2.5.8. Sensory Evaluation

Sensorial characteristics of juices were tested by a sensorial panel of 40 untrained volunteers. Juices were stored for one day at 4 °C prior testing and kept on ice until serving. Participants had to rate attributes of the juices on a hedonic scale ranging from 1 (low) to 5 (high) without having information on their composition and treatment. Appearance/color was evaluated from light/typical color of apple juice to brownish. Flavor characteristics included sweetness (not sweet–very sweet), acidity (not acid–very acid) and bitterness/off-taste (not bitter/no off-notes–very bitter/intense off-notes). Regarding textural properties, panelists were asked to value viscosity (liquid–viscous/dense) and graininess (no perception of particles/graininess–high perception of particles/graininess). Finally, the overall acceptability had to be rated on the scale from 1 to 5, corresponding to ‘I do not like it’ and ‘I like it very much’ to assess the desirability of the juices. The investigation has been done in accordance with ‘The Code of Ethics of the World Medical Association (Declaration of Helsinki)’ for experiments involving humans.

2.5.9. Glycemic Response In Vivo

The transferability of the results of the in vitro glucose retardation kinetics was tested in a study with 10 healthy volunteers (5 female, 5 male) with an age ranging from 19 to 29. Participants had to appear on the same day of two consecutive weeks in the morning at 9 am in a fasting state. Finger prick blood samples were taken in the fasting state (baseline) and 15, 30, 45, 60, 90 and 120 min after ingesting the juice. Blood glucose concentrations were measured with a glucose monitor (GIMA SpA, Gessate, Italy). Results of blood glucose response were plotted with time on the x-axis and blood glucose values in mg/dL on y-axis. The area under the curve (AUC) for each participant and ingested juice was calculated applying the trapezoidal method. Areas were calculated starting from the fasting blood glucose level at time 0 until the blood glucose value returned to the baseline again. The study was conducted in accordance with the principles outlined in ‘The Code of Ethics of the World Medical Association (Declaration of Helsinki)’ for experiments involving humans.

2.6. Statistical Analysis

All measurements were conducted in duplicate, if not differently stated. Data were analyzed using ANOVA and Tukey HSD test (p < 0.05).

3. Results and Discussion

3.1. Fiber Composition of Apple Bagasse

Apple bagasse (AB) contained 37.40% IDF and 7.45% SDF accounting for a TDF of 44.85% (Table 1). Within IDF, the highest proportion was comprising cellulose (19.92%) and smaller proportions of hemicellulose (9.11%) and lignin (4.26%). From these results it can be assumed that AB is a high fiber-rich ingredient containing an elevated IDF percentage. When comparing this composition with other studies on the DF content of apple pomace, similar IDF, hemicellulose and cellulose values were reported but much higher SDF. For instance, Ma et al., (2019) [25] found 10.9% of hemicellulose and 17.7% cellulose but 19.6% pectin, which is the major fraction of SDF. Gorinstein et al., (2001) [26] measured similar IDF of 37% in apple pomace but SDF of 28%. The proportion of SDF and pectin contents can vary greatly between cultivars, ripening grades and different fractions, i.e., pulp and peel, of a fruit and additionally depend on the preparation methods, i.e., extraction, level of washing, drying and milling, of the bagasse [27].

3.2. Analysis of the Properties of Bagasse-Enriched Juices

After subjecting apple juices with varying concentrations of AB to various times of EH and analyzing their properties, the juice containing 3% of AB and treated enzymatically for 2 h (T2-3) was selected for an additional US pre-treatment. Furthermore, these juices, i.e., T2-3 and US-T2-3, were chosen for sensorial analysis and in vivo glycemic responses. This decision was based on the results of the different properties, aiming to obtain a juice with the maximum concentration of AB and DF, while considering the industrial feasibility of the process and consumer perception. For instance, the viscosities of juices containing 4.5% AB were too high to be perceived as liquid juices. Among treated juices containing 3% AB, the highest inhibition of glucose diffusion in vitro was obtained after 2 h of EH. Additionally, from an industrial perspective, a 2 h-EH would be more feasible, as it significantly reduces equipment occupancy, energy consumption, processing and supervision time resulting in lower production costs. Shortening the duration of EH also minimizes the exposure window for microbial growth and reduces the risk of contamination as well as the need for stricter sanitation controls or added preservatives. This would be particularly important in warm, moist environments required for enzymatic treatments of the juices. The following sections provide an in-depth analysis of the juices’ properties.

3.2.1. Particle Size and Color

The particle size of the juice provides an indication of the efficiency of the enzymatic hydrolysis (EH) in solubilizing IDF. Furthermore, it is an important factor to estimate the graininess of the product which is substantial for the consumer acceptance of the product. The values for D50, presentative for the median particle size, and D90, indicating the size of the biggest particles, of the particle size distribution are summarized in Table 2. By the application of enzymes, a continuous reduction in the particle size by extending the hydrolysis time could be achieved. There were no significant differences of D90 among different treatment times but D50 was significantly smaller after 24 h of EH in comparison to T2-juices (enzymatically treated for 2 h). The median particle size was reduced by 38.9% and bigger particles (D90) by 40.8% after 24 h. Therefore, EH led to the breakdown of polysaccharide bonds resulting in a reduction in particle size and the release and solubilization of shorter polysaccharide fractions. Particle size of juices enriched with 3% apple pectin was not significantly different to the control juice without bagasse which reflected the high solubility of apple pectin. The application of US as a pre-treatment of 2 h-EH induced the smallest median particle size among fortified juices, but without significance to T24. Hence, US application before EH could shorten the time of EH to 2 h while achieving an even greater reduction in particle size than that obtained after 24 h-EH without physical modification. This higher decrease was due to the loosened DF structure after US which facilitated the accessibility of inner DF structures for the enzymes. Similarly, Luo et al., (2018) [28] reported a 31.8% reduction of D90 after hydrolyzing bamboo shoot shell IDF with a cellulase-xylanase mixture for 24 h. In the same study, physical modification applying high-pressure showed higher efficiency and achieved a decrease of 70.1%.
As shown in Table 2, DF-enriched juices exhibited a slight change of color towards enhanced whiteness (higher L*-value) and yellowness (higher b*-value) with increasing concentration of AB. After the preparation and lyophilization of AB, the by-product powder was slightly yellow but almost colorless which accounts for the slight alteration in color. The variation in a*-values was very small and did not show any clear tendency linked with the introduction of AB or application of EH, thus there was no change in red- or greenness by the addition of the by-product to the juice. Regarding the different treatment conditions, no impact of EH time and application of US could be found for the increase in b*-value. On the contrary, whiteness index decreased slightly with the time of EH in 3% and 4.5% juices whereas a higher value was observed in the US-treated juice. As a result, the application of US cavitation had a moderate whitening effect on the final product. US might have influenced color generation and whiteness through higher solubility, disrupted DF structure and smaller particle size. The process might have led to the effective homogenization and incorporation of AB into the juice which is based on the fluid motion and particle break-up caused by the high local temperature and pressure increase, radical formation, and intense shear forces [29]. In addition, the efficacy of EH after US in reducing the particle size was enhanced leading to smaller particles which might have contributed to a lighter color. The juice comprising 3% pectin presented similar colorimetric values than the control juice, thus the addition of pectin had the lowest effect on color change which was denoted by the lowest color difference ΔE.

3.2.2. Viscosity

Apparent viscosity was enhanced with the introduction of AB, increasing with higher AB concentrations (Table 2). DF implies a thickening effect by the ability of adsorbing water and forming gels. Water molecules can be absorbed to hydrophilic groups of DF or entrapped inside the IDF network by the formation of mesh structures with junction zones [30]. In addition, SDF, particularly pectin, is attributed with viscosity-inducing properties which positively correlate with the concentration and molecular weight of the solute [31,32]. The viscosities of the untreated and treated juices containing the lowest concentration of 1.5% AB were not significantly different to the control. Differences became more evident with higher concentrations of the by-product. The introduction of 3% AB without modification resulted in a high increase in viscosity from 1.83 mPa·s to 257.50 mPa·s. The sharp increase in viscosity observed in the untreated 3% juice sample may result from a nonlinear effect due to the high fiber content forming a structured network, alongside potential overestimation by the vibro-viscosimeter, which can be affected by particle interference in highly viscous suspensions. However, the application of EH lowered this enhancement by the continuous decrease in particle size and IDF content. A significant reduction was observed after 6 h of EH (14.80 mPa·s) but no further decrease was achieved when extending hydrolysis time to 24 h (14.05 mPa·s). Hence, further enzymatic activity did not impact IDF particle size and a maximum degradation was reached after 6 h-EH although enzymes might have further reduced molecular weight of soluble components. US-pretreated juices showed a slightly lower viscosity than the enzymatically treated juice without physical modification (T2-3) which could be related to the enhanced reduction in particle size. Highest differences between the different hydrolysis times were seen in the juice with highest concentration of AB. The viscosity of the untreated juice containing 4.5% AB was too high to be measured by the used viscometer. However, a continuous decrease with longer treatment times to 90.30 mPa·s after 24 h-EH was detected. The measurement of the pectin-enriched juice showed significantly less viscosity than the untreated apple juice containing the same concentration of 3% AB but similar viscous characteristics than the 2 h-treated juice. These results might propose that the thickening effect by AB addition was mainly driven by its high content of IDF components which capture the water molecules inside of the DF matrix [33]. By applying EH and increasing SDF, physical entanglements of polysaccharides forming gels were weakened and the molecular weight of insoluble and soluble components were decreased resulting in lower thickness [31]. The increase in viscosity and higher gel strength when DF is added to liquid or semi-solid food products is a highly observed phenomenon. For instance, higher gel strength and lower syneresis were found for the addition of 1% of orange fiber [34] and higher viscosities for increasing concentrations of mulberry pomace [35] in yogurts. The incorporation of different hydrocolloids, such as β-glucan and xanthan gum, into a fruit juice enhanced its viscosity and pseudoplastic behavior related to their molecular weight [36]. In accordance with our study, the acid hydrolysis of high molecular-weight β-glucan reduced its molecular weight which strongly impacted the viscosity of the aqueous dispersion [37].

3.2.3. Galacturonic Acid Content and pH

The pH of the fortified apple juices decreased as the concentration of AB increased (Table 2), primarily due to the presence of organic acids in the bagasse. According to the studies of Martău et al., (2021) [38], the main organic acids found in apple pomace were malic acid followed by citric and oxalic acid. The application of enzymes resulted in a further decrease in pH which was intensified with the extension of EH time. Therefore, the reduction must be related to the release of acidic substances during hydrolysis. The main soluble DF component of AB is pectin which can make up 19.6% of the bagasse [25]. The release of pectic components by EH can be measured by analyzing the galacturonic acid (GalA) content, which is the main component of soluble pectin constituting the backbone of pectin polysaccharides. Figure 1 illustrates the enhanced galacturonic acid (GalA) content of juices containing AB and the progressive influence of hydrolysis time on the release of pectic, acidic substances. Continuous release of GalA with prolonged hydrolysis was more pronounced in juices with higher concentrations of AB containing a higher amount of available pectin. In enzymatically treated juices comprising 3% and 4.5% AB, hydrolysis for 24 h released a significantly higher content of GalA than EH of 2 h and a steady increase in GalA with longer hydrolysis time could be noted. Inside the plant cell wall, pectin forms its own network interacting with the hemicellulosic-cellulosic framework through hydrogen-bridge binds and covalent bonding [39]. The increase in GalA could be attributed to the ongoing degradation of pectin molecules through the activity of pectinase which is facilitated by the increasing accessibility of pectin after the continuous solubilization of cellulose chains and weakening of the entangled network structures. US application did not affect the GalA content and showed similar quantities (0.12 g/g) compared to the 2 h-EH treated juice without physical pre-treatment. This might suggest that the pectin network within the DF structure of apple bagasse is highly accessible for enzymatic processing and does not require physical manipulation. In line with that, Song et al., (2021) [12] reported only low benefit of the combination of physical comminution applying dry micronization or wet ball milling before xylanase hydrolysis of citrus fiber on pectin content. However, comparison is impeded since different enzymes were applied. The increased GalA contents in enzymatically treated juices were reflected in the decrease in particle size and viscosity. As in viscosity measurements, differences among fortified juices were higher with enhanced AB concentrations. This observation could confirm that mainly insoluble cellulose and hemicellulose components provided viscosity but not solubilized pectin. Galacturonic/pectin contents might be slightly overestimated since the colorimetric assay has low interference with other components present in AB and the juice, such as fructose and xylose [20].

3.2.4. Antioxidant Properties

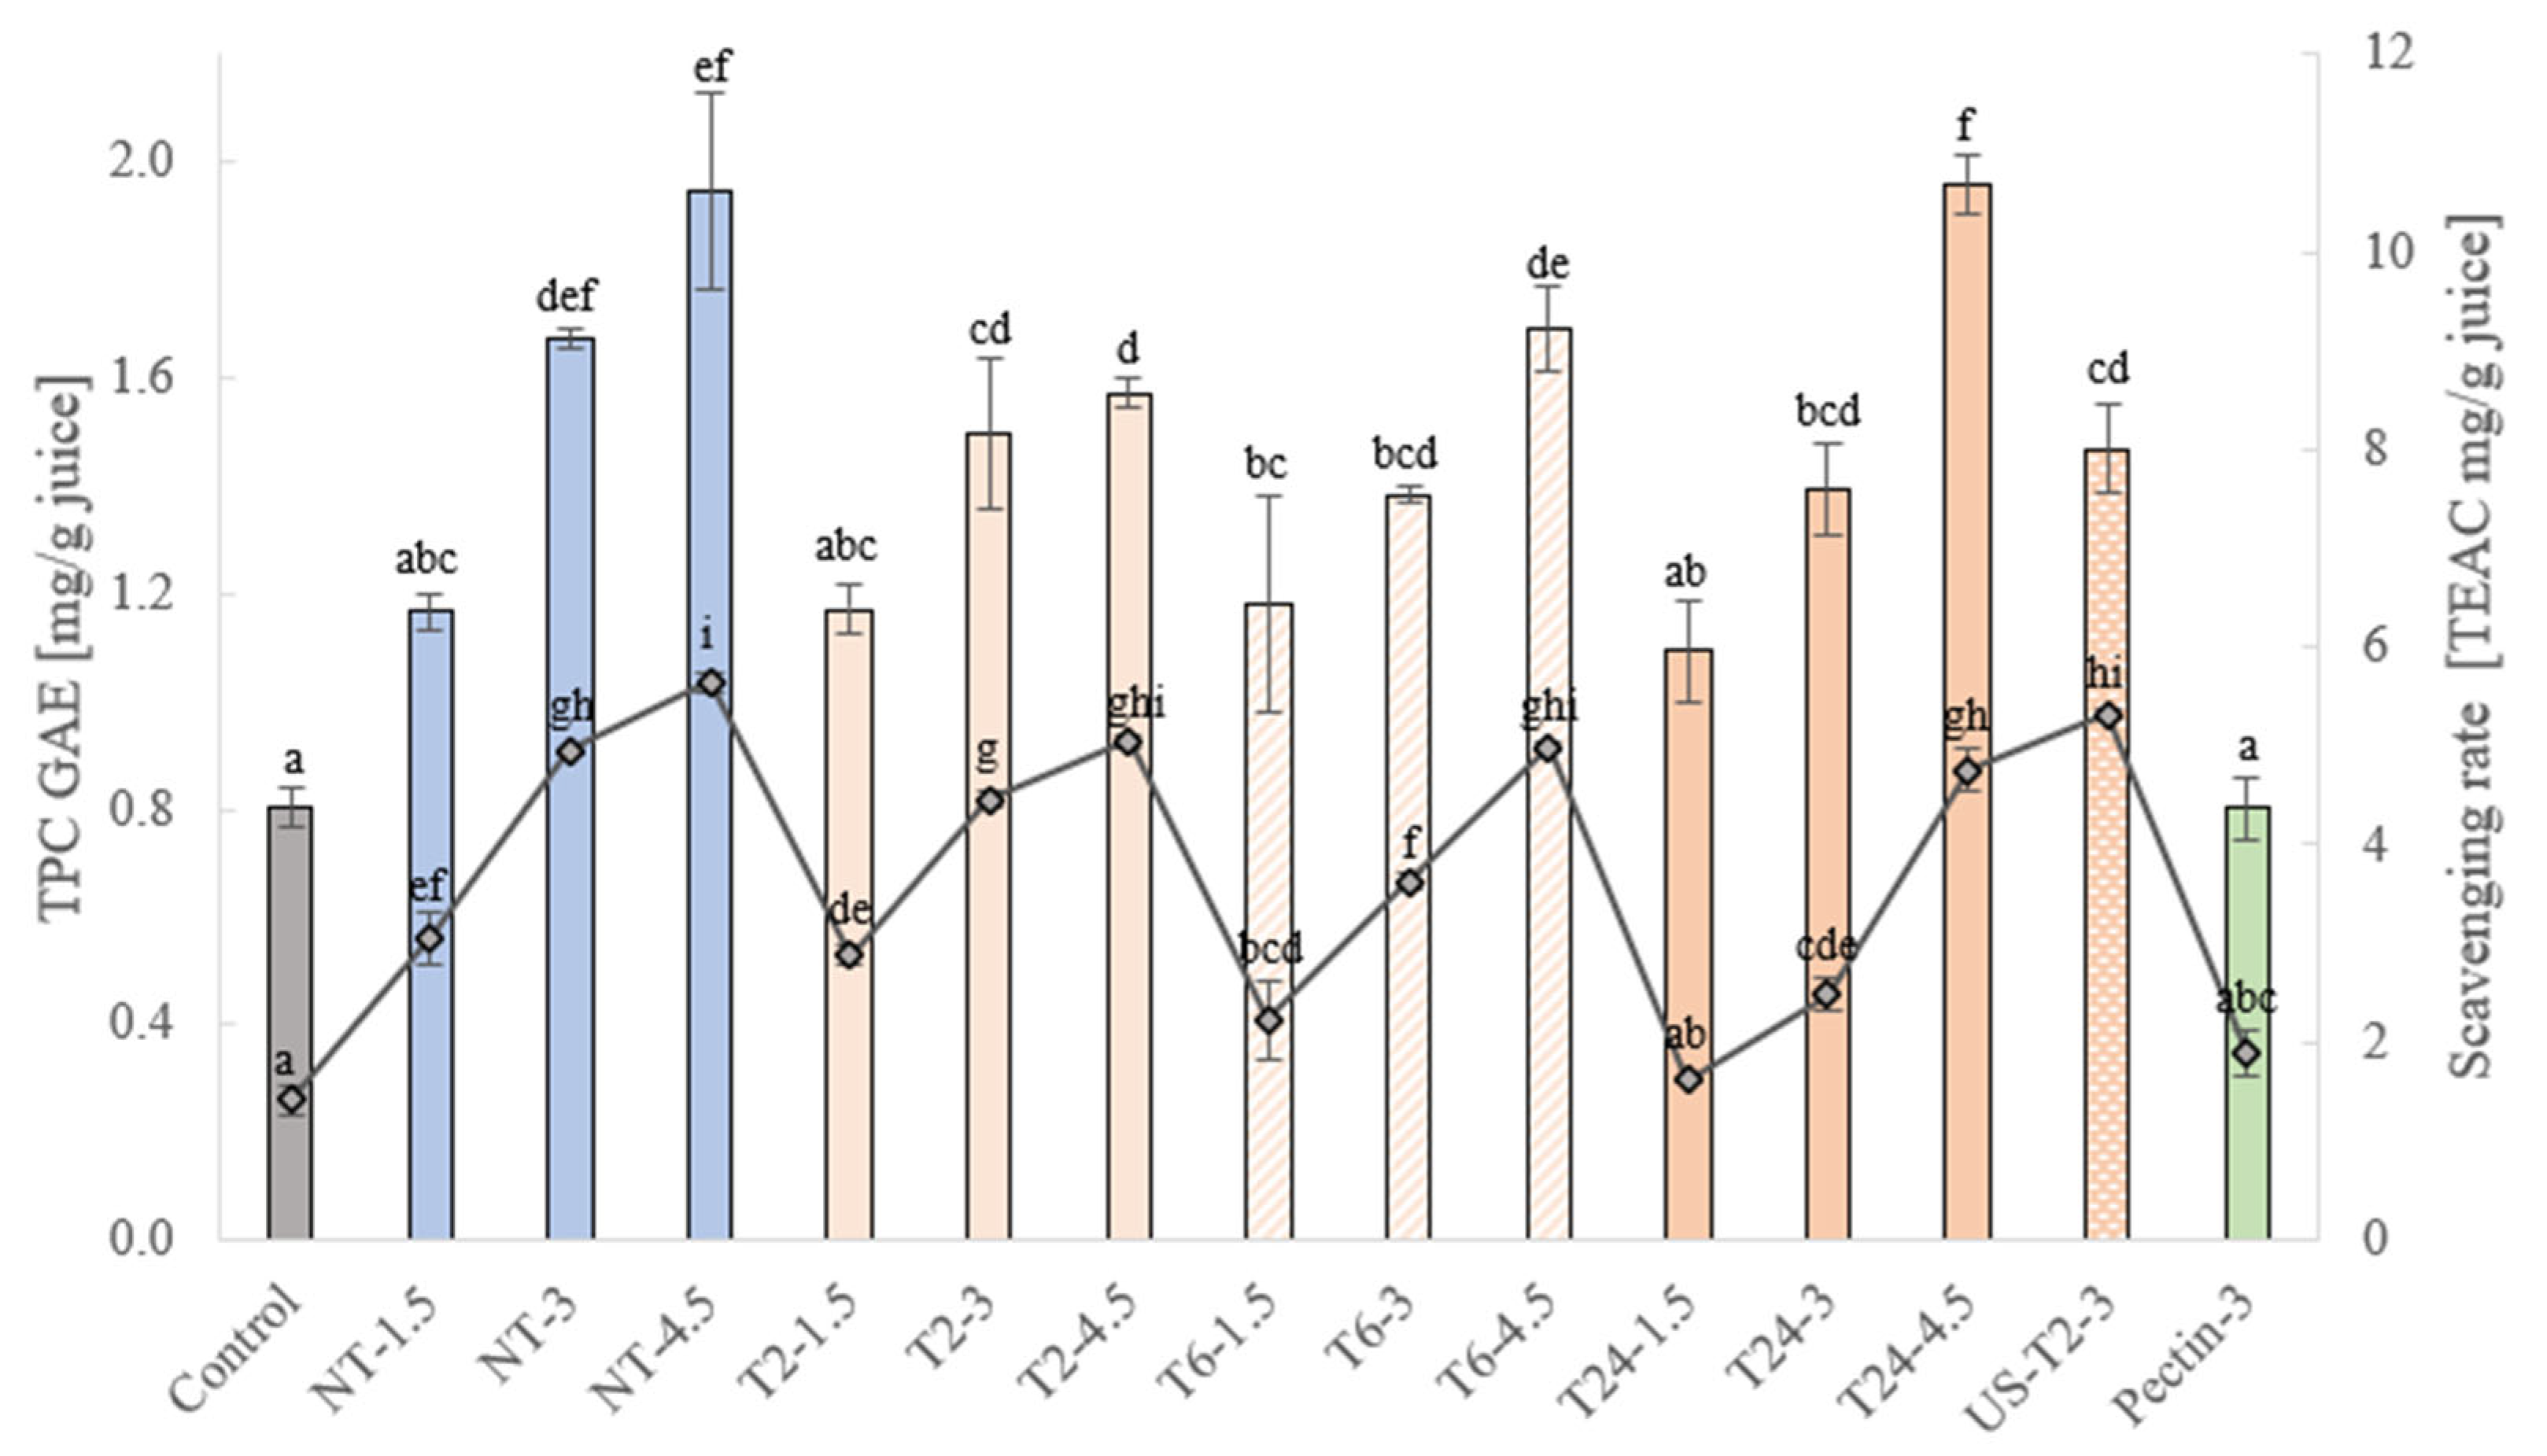
The main antioxidant components in apple bagasse are polyphenolic compounds, dominated by quercetin and chlorogenic acid [40]. Shown in Figure 2, total phenolic content (TPC) and correspondingly the antioxidant activity, measured by the DPPH scavenging rate, increased with higher quantities of AB in the juices. After the addition of 3% and 4.5% AB, enriched juices had a significantly higher TPC than the juice without AB and that with 3% pectin. In comparison to the control, a 1.1-fold and 1.4-fold increase in the number of polyphenolic compounds was achieved when 3% and 4.5% AB was added to the juice. No impact of EH and hydrolysis time could be observed on TPC. Furthermore, there was no enhancement on the extractability of polyphenols after applying US as pre-treatment in our study. This might suggest that polyphenolic compounds of apple bagasse are highly accessible, or the molecular alterations achieved by EH and US were not effective enough in opening the DF structure to enable access to bioactive compounds which are entrapped within the inner DF structure. In contrast, EH with longer treatment times was found to moderately decrease the antioxidant activity, likely due to the loss of other bioactive compounds, such as ascorbic acid, or the reduced activity of polyphenols caused by high temperatures during inactivation of enzymes. Most bioactive components are heat-sensitive, thus high temperature can cause their degradation, conversion into another compound or reduce biological activity [41]. Temperatures above 45 °C already can induce instability and decrease the antioxidant activity of polyphenols [42] and ascorbic acid [43]. In treated juices containing 4.5% AB, the decrease was lower than in juices with lower concentrations of AB. This might be associated with the higher pectin contents in these juices which was found to have a protective effect on phenolic compounds, such as the stabilization of anthocyanins from strawberries by apple and sugar beet pectin [44]. Some studies reported synergistic or antagonistic molecular interactions of compounds present in a food matrix with antioxidants from the added extract. For instance, the addition of banana peel extract in a freshly squeezed orange juice increased its antioxidant activity above a concentration of 5 mg/mL but decreased radical scavenging rates when it was incorporated into a fruit juice concentrate [45]. The author proposed that there might be antagonistic interactions of the compounds in the concentrate with bioactive components of the banana peel extract. In addition, antioxidant activities of different mixtures of green tea and broccoli by-product powder suggested molecular reactions between tea flavanols and broccoli glucosinolates [46]. Therefore, the polyphenolic components derived from AB might have an antagonistic effect with the phytochemicals of the apple juice leading to lower antioxidant activities after EH. Another important factor is the storage time of the apple juice, which can reduce the content of polyphenols and their activity [47]. Juices were bought on different days, always one day before conducting the experiments, but the time of storage in the supermarket was unknown and could have influenced the outcome. However, our results showed that the addition of AB into the juice significantly enhanced its antioxidant properties which would highly promote the nutritional effect of the juice.

3.2.5. Glucose Retardation Kinetics In Vitro

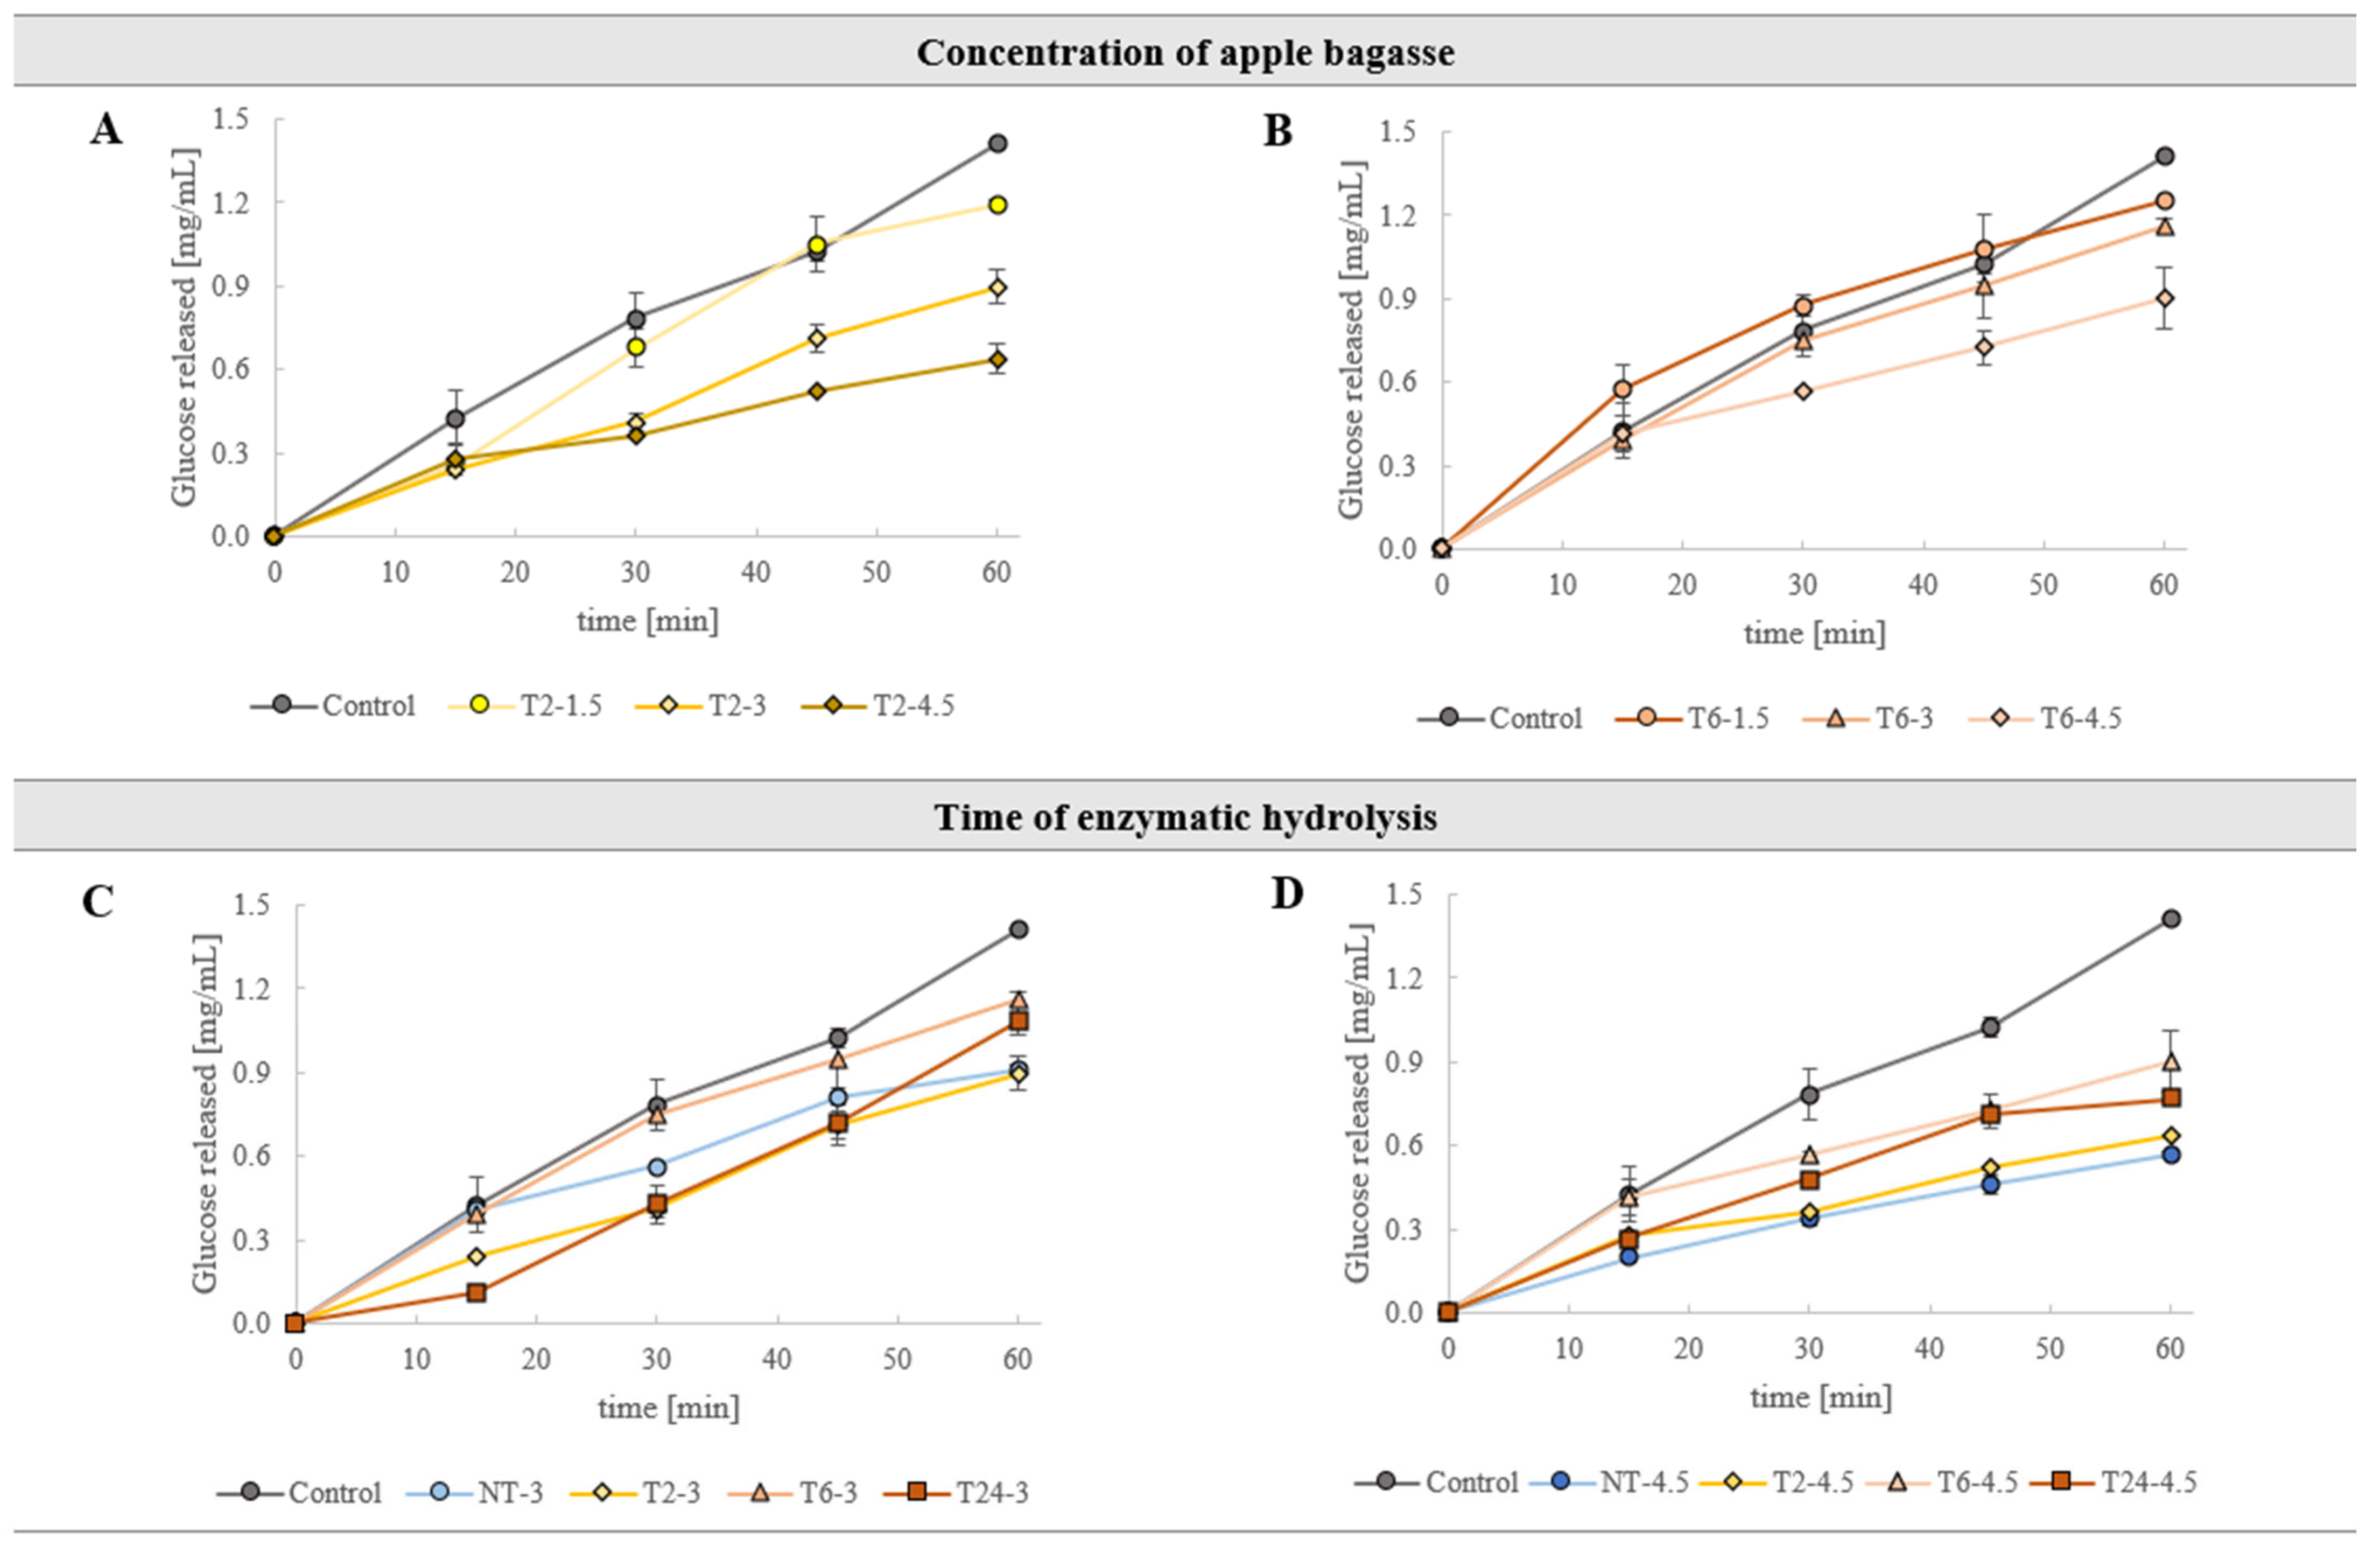
DF has a hypoglycemic effect by interacting with glucose molecules and thereby reducing their diffusion and delaying their adsorption from the intestinal lumen to the gut epithelial cells [1,32]. In Table 3 and Figure 3A–D, the effect of the addition of AB and treatment application on the retardation of glucose is shown.
Although AB contained glucose and its incorporation into the juice enhanced the content of natural sugars in the beverage (Table 4), AB-enriched juices showed a decelerated release of glucose to the dialysate. When comparing the kinetics of the different concentrations of added AB which aligned with the juice viscosity, the higher the amount of AB and viscosity the lower the rise in glucose concentrations (Figure 3A,B). Hence, stronger, more viscous polymer networks in juices with 3% and 4.5% AB must have captured the glucose molecules more tightly in the DF network structure, thereby reducing the liberation and diffusion through the membrane.
For the evaluation of the differently treated juices, the initial contents of glucose in juices before digestion and dialysis were measured. Juices containing 3% AB were selected to evaluate the impact of EH and US on glucose levels (Table 4). EH treatment time did not affect the glucose contents of the juices indicating that the enzymes did not release glucose from the cellulose matrix. Hence, the initial glucose contents in enzymatically treated juices could be neglected as a factor that contributed to variations among different EH times. However, US pre-treatment increased the content of glucose in the beverage, thus US cavitation must have caused the release of glucose from cellulose or, more likely, enhanced the access to the reducing ends of cellulosic microfibrils for enzymatic degradation.
This interpretation is supported by previous findings which showed elevated glucose quantities after the combination of physical treatments with EH in apple and orange bagasse whereas physical modification alone led to little or no increase [16,17]. Therefore, facilitated accessibility of the substrate to enzymatic action appears to be the most likely explanation. In juices enzymatically treated for 24 h, a lower influence of the increase in AB concentration was observed (Table 3), which could be associated with the lower viscosity of these juices due to the advanced polysaccharide degradation. Therefore, entrapment of glucose requires an intact, entangled IDF network which also acts as a physical obstacle delaying diffusion [33]. The effect of different treatment times is illustrated in Figure 3C,D for juices containing 3% AB and 4.5% AB, respectively. For both concentrations, the highest glucose-lowering effect was found in 2 h-treated juices whereas the lowest impact on glucose delay was observed after 6 h of EH. Juices, composed of 3% AB and subjected to 24 h-hydrolysis, demonstrated glucose retardation kinetics similar to the juice enzymatically treated for 2 h. However, when 4.5% was added, 24 h-treated juices showed a reduced impact on glucose diffusion when compared to the product hydrolyzed for 2 h. In contrast to the untreated juice fortified with 3% AB, 2 h-hydrolysis increased the efficacy of delaying glucose. However, this effect was reduced in juices containing the highest AB concentration likely due to the exceptionally high viscosity of the untreated juice. The pre-treatment with US resulted in a lower reduction in glucose release within the first 30 min of dialysis compared to the corresponding juice without physical treatment. This might be related to the lower viscosity, particle size and the higher glucose content in this product. Juices comprising 3% commercial apple pectin effectively reduced the release of glucose to the dialysate compared to the control but showed a lower reducing effect than the 2 h-treated juice with the same concentration. From these results, it can be deduced that there were more factors than viscosity and the initial glucose content in the juice affecting glucose retardation kinetics: (1) Lower particle size and higher GalA content after EH may be linked with higher solubility and more porous surface area in AB which can result in higher interactions with glucose molecules [48]. (2) High contents of soluble pectin might have enhanced the efficacy of glucose delay, indicated by the high efficiency of the 3% pectin juice and higher glucose reduction of 24 h-treated juices compared to the 6 h-hydrolyzed equivalent. (3) The interaction of IDF and SDF components is likely to play an important role in capturing glucose molecules. This mechanism might have been promoted by the moderate degradation of IDF after enzymatic application of 2 h, resulting in optimal attenuation of released glucose in these juices.
Several studies confirm the influence of other factors than viscosity on glucose retardation. For instance, Dhital et al., (2014) [49] reported a significant impact of the viscosity of solutions containing different concentrations of soluble cereal DF on glucose reduction. However, the effect was not linear since the addition of 1% and 2% DF increased viscosity 10- and 100-fold, respectively, but mass transfer coefficients of glucose were only reduced by a factor of 1.5 and 2.5. Additionally, Ou et al., (2001) [50] compared the ability of various IDF and SDF sources to delay glucose diffusion during dialysis. The velocity of glucose diffusion was impacted by viscosity but as well by glucose adsorption. To summarize, the addition of AB lowered the diffusion of glucose, but the results of differently treated juices demonstrated that the benefit was not only related to viscosity but is the result of a complex interaction of physicochemical and techno-functional characteristics of DF.

3.2.6. Sensory Evaluation

From the results of glucose retardation kinetics, antioxidant properties, reduction in particle size and viscosity, juices enzymatically treated for 2 h with and without US pre-treatment, were selected and tested for their sensorial acceptability in comparison to the control juice. As shown in Figure 4, the addition of AB primarily caused differences in the perception of color (darker, more intense), viscosity (more viscous) and granularity (perceived graininess). Variances among participants’ ratings ranged from 0.27 (granularity of the control juice) to 1.39 (acidity of the enzymatically treated juice T2-3). Higher variability could be found for the taste attributes (sweetness: 1.05–1.07; acidity: 0.94–1.39; bitterness: 0.78–0.93) and granularity of the treated juices (1.00–1.17), whereas the ratings of the control juice were more consistent. Higher disagreement among panelists for these parameters was expected, as these attributes are more prone to subjective interpretation and participants lacked sensory evaluation training. The measurements of the L*a*b*-values of enriched juices indicated higher yellowness which might have been perceived as a more intense color. Although the enriched juices contained a higher glucose content, they were rated lower in sweetness. This might be attributed to the higher perceived bitterness/off-taste which could have masked the sweet flavor. The mild bitter taste could be due to the higher content of polyphenols which has been documented to impart bitterness [51]. The main free polyphenols in apple pomace after methanol extraction were identified as chlorogenic acid, quercetin glycosides and phloridzin [52] while quercetin derivatives were primarily linked with bitterness and astringency at elevated concentrations [53]. Panelists attributed higher acidity to the juices with AB which was a consequence of their lower pH resulting from the presence of organic acids in AB, mainly malic, citric and oxalic acid [38], and release of pectin acidic components by EH. Juices that underwent additional physical modification with US differed slightly in their perceived viscosity and graininess which was linked to their lower viscosity and particle size. However, this did not lead to a better score of the product. The general acceptability of the beverages was rated as follows: Control: 4 ± 0.88, T2-3: 3.2 ± 1.06, US-T2-3: 3.1 ± 0.88. The lower evaluation of the treated juices may largely be attributed to the lower and less consistent ratings of bitterness, acidity and granularity. When adding a DF source to a liquid product, it is unavoidable to encounter changes in color, texture, and taste. However, the general rating of the fortified juices treated with EH achieved a high acceptability of the product. It might be worth exploring the impact of additional micronization and homogenization techniques of the bagasse, such as ultrafine grinding and milling, and of the enriched juices, including high shear mixing or high-pressure homogenization (HPH) before/after EH. This approach could further reduce the particle size, thereby minimizing the perceived graininess and improving mouthfeel. The most feasible and scalable options from an industrial perspective might be high shear mixing or high-pressure homogenization applied with EH, as both technologies are already widely used in beverage production and are more cost-effective in terms of energy consumption and processing costs than grinding methods. Notably, HPH, as sole treatment and combined with EH, has been proven to be highly effective in particle size reduction [54,55,56].

3.2.7. Glycemic Response in Vivo

The average glycemic response of the 10 participants is illustrated in Figure 5. The glycemic response to a certain food product as well as fasting blood glucose level differs greatly for each person resulting in the high variance of the response and blood glucose level after the consumption of the juice [57]. The degree of increase depends on several factors, such as lifestyle, diet, age, sex, stress level and, most importantly, microbiota composition [58,59]. Except for one participant (peak after 45 min), the majority showed the highest glucose concentrations after 30 min of digestion for both juices. Hence, there were no differences in the shape of the curves of the different juices which would indicate a delay of sugar adsorption. However, 7 participants had an attenuated peak after consuming the AB-enriched juice. Additionally, the average area under the curve (AUC), i.a. glycemic load, and slope of the glycemic curve was lower for this juice (AUC: 1305 ± 728.3; Slope: 1.22 ± 0.47) compared to the control without AB (AUC: 1469.6 ± 781, Slope: 1.31 ± 0.46). Therefore, the DF enrichment of the juice by adding AB led to the attenuation of postprandial glycemia in most participants which might confirm the results of reduced diffusion measured in vitro. However, the reduction was not consistent in all participants and due to the high variance of the blood glucose levels, there was no significance of the modulated response. Several factors can contribute to discrepancies between results obtained from in vitro glucose diffusion experiments and in vivo blood glucose responses. Although the digestion process was simulated and juices diluted, various other processes during digestion, such as secretions of digestion and fermentation-related hormones and actions of gastric emptying and mixing, affect postprandial glycemia [32]. Furthermore, high dilutions of 3–5fold were measured when food reached the duodenum which would cause a substantial drop in the physiological DF concentration and viscosity and diminish the reducing effect of DF in vivo [60,61]. However, there are still several studies which report a significant influence of the viscosity and molecular weight of the DF substrate on in vivo peak glucose reduction. For instance, Thondre et al., (2013) [62] tested high-molecular-weight and low-molecular-weight β-glucan, mixed in a soup, and found higher attenuation of the glycemic response for the more viscous, high-molecular-weight DF substrate. J. Wood et al., (1994) [63] found an inverse relationship of concentration and viscosity of oat gum with the glucose and insulin response. Acid hydrolysis of the gums highly reduced this effect. According to these results, the application of enzymes to the juice which reduced particle size of AB and viscosity of the beverage might have diminished the attenuating impact of AB. Another important factor contributing to the reduction is the higher glucose concentration of the fortified juice (Table 4). The enrichment of blackcurrant juice with crowberry powder resulted in an attenuated peak at 30 min but a slower decline of the glycemic curve of blood glucose during the second hour after ingestion resulting in a higher AUC of the juice containing berry powder [64]. The increased glycemic load was ascribed to the higher glucose content of these juices whereas the reduced glycemic peak to their higher polyphenol content. Polyphenols have been shown to have the potential to reduce postprandial blood glucose levels through several mechanisms, such as the stimulation of pancreatic insulin secretion and inhibition of α-amylase and glucosidase [65]. Therefore, the elevated sugar content in the hydrolyzed juice containing AB can contribute to enhanced peaks, whereas the increased TPC can lead to attenuated blood glucose responses. Hence, these factors might have counteracted each other diminishing the blood-sugar lowering impact of the enriched juice and promoting the notable variance among study’s participants.
However, the enhanced content of DF, which created higher viscosity, combined with the higher concentration of polyphenols in the treated AB-enriched juice implied a potential hypoglycemic effect to the beverage. Therefore, the addition of AB to a juice may help to reduce the glycemic peaks in healthy individuals which would mitigate oxidative stress and help to prevent the development of chronic diseases, primarily type-2 diabetes and cardiovascular diseases [66].

4. Conclusions

The addition of AB to an apple juice resulted in a beverage with higher viscosity, GalA content, lower pH and improved antioxidant and glucose-reducing properties. The application of EH proved to be a highly effective method for incorporating the by-product into the beverage since it increased the solubility of AB, indicated by enhanced GalA contents and reduced particle size. This effect was further enhanced when pre-treating the juice with US before EH. Despite sensory differences between the AB-enriched juice and the juice without AB, the overall positive sensory acceptance indicated high consumer acceptance. The potential for a hypoglycemic effect of the fortified juice was suggested by a reduction in in vitro glucose diffusion and a lower average glycemic response in vivo. However, the high variability of postprandial glucose levels among individuals does not permit a definitive assertion.
This study demonstrates the great potential of the application of US and EH to incorporate AB into a beverage to obtain a product with high DF content, positive sensory perception, and potential health-promoting effects. Incorporating AB back into the juice it originated from presents an interesting approach to promote circular economy principles and find a utilization of the increasing quantities of apple by-products.

Author Contributions

A.M.: conceptualization; methodology; investigation; writing—original draft, review and editing. P.E.-M.: funding acquisition, writing—review and editing. O.M.-B.: writing—review and editing. R.S.-F.: conceptualization; supervision; writing—review and editing. All authors have read and agreed to the published version of the manuscript.

Funding

This work has received funding from the European Union’s H2020 research and innovation programme under Marie Sklodowska-Curie grant agreement No. 801586. The project RTI2018-095560-B-I00 was funded by MCIN/AEI/10.13039/501100011033/ and FEDER (‘A way of making Europe’) and the project TED2021-131828B-I00 was financed by MCIN/AEI/10.13039/501100011033 and European Union NextGenerationEU/PRTR.

Institutional Review Board Statement

At the time this research was conducted, The University of Lleida’s Comitè d'Ètica per la Recerca i Transferència [Ethics Committee for Research and Transfer] or CERT was not operating, but the President of that committee, which now is operating, states that “Having assessed the documentation submitted, I can confirm that the investigation has been done in accordance with The Code of Ethics of the World Medical Association (Declaration of Helsinki) for experiments involving humans”.

Informed Consent Statement

Informed consent was obtained from all subjects involved in the study.

Data Availability Statement

The raw data supporting the conclusions of this article will be made available by the authors on request.

Acknowledgments

We would like to acknowledge Judith Arroyo Freixa for her support in performing experiments and collecting data.

Conflicts of Interest

There are no conflicts of interest to declare.

References

  1. Kendall, C.W.C.; Esfahani, A.; Jenkins, D.J.A. The link between dietary fibre and human health. Food Hydrocoll. 2010, 24, 42–48. [Google Scholar] [CrossRef]
  2. Stephen, A.M.; Champ, M.M.-J.; Cloran, S.J.; Fleith, M.; van Lieshout, L.; Mejborn, H.; Burley, V.J. Dietary fibre in Europe: Current state of knowledge on definitions, sources, recommendations, intakes and relationships to health. Nutr. Res. Rev. 2017, 30, 149–190. [Google Scholar] [CrossRef]
  3. European Commission. Regulation (EC) No 1924/2006 of the European Parliament and of the Council of 20 December 2006 on nutrition and health claims on foods. Off. J. Eur. Union 2006, L 404, 9–25. [Google Scholar]
  4. Vilariño, M.V.; Franco, C.; Quarrington, C. Food loss and waste reduction as an integral part of a circular economy. Front. Environ. Sci. 2017, 5, 21. [Google Scholar] [CrossRef]
  5. Collier, B. Glucose Control and the Inflammatory Response. Nutr. Clin. Pr. 2008, 23, 3–15. [Google Scholar] [CrossRef] [PubMed]
  6. Pitteloud, N.; Mootha, V.K.; Dwyer, A.A.; Hardin, M.; Lee, H.; Eriksson, K.F.; Tripathy, D.; Yialamas, M.; Groop, L.; Elahi, D.; et al. Relationship Between Testosterone Levels, Insulin Sensitivity, and Mitochondrial Function in Men. Diabetes Care July 2005, 28, 1636–1642. [Google Scholar] [CrossRef] [PubMed]
  7. Bano, G. Glucose homeostasis, obesity and diabetes. Best Pract. Res. Clin. Obstet. Gynaecol. 2013, 27, 715–726. [Google Scholar] [CrossRef]
  8. Espírito-Santo, A.; Lagazzo, A.; Sousa, A.; Perego, P.; Converti, A.; Oliveira, M.N. Rheology, spontaneous whey separation, microstructure and sensorial characteristics of probiotic yoghurts enriched with passion fruit fiber. Food Res. Int. 2013, 50, 224–231. [Google Scholar] [CrossRef]
  9. Tomic, N.; Dojnov, B.; Miocinovic, J.; Tomasevic, I.; Smigic, N.; Djekic, I.; Vujcic, Z. Enrichment of yoghurt with insoluble dietary fiber from triticale—A sensory perspective. LWT Food Sci. Technol. 2017, 80, 59–66. [Google Scholar] [CrossRef]
  10. Hashim, I.B.; Khalil, A.H.; Afifi, H.S. Quality characteristics and consumer acceptance of yogurt fortified with date fiber. J. Dairy Sci. 2009, 92, 5403–5407. [Google Scholar] [CrossRef]
  11. Moreira, S.A.; Alexandre, E.M.C.; Pintado, M.; Saraiva, J.A. Effect of emergent non-thermal extraction technologies on bioactive individual compounds profile from different plant materials. Food Res. Int. 2019, 115, 177–190. [Google Scholar] [CrossRef]
  12. Song, L.-w.; Qi, J.-r.; Liao, J.-s.; Yang, X.-q. Enzymatic and enzyme-physical modification of citrus fiber by xylanase and planetary ball milling treatment. Food Hydrocoll. 2021, 121, 107015. [Google Scholar] [CrossRef]
  13. Kentish, S.; Feng, H. Applications of power ultrasound in food processing. Annu. Rev. Food Sci. Technol. 2014, 5, 263–284. [Google Scholar] [CrossRef] [PubMed]
  14. Ashokkumar, M.; Sunartio, D.; Kentish, S.; Mawson, R.; Simons, L.; Vilkhu, K.; Versteeg, C. Modification of food ingredients by ultrasound to improve functionality: A preliminary study on a model system. Innov. Food Sci. Emerg. Technol. 2008, 9, 155–160. [Google Scholar] [CrossRef]
  15. Vodeničarová, M.; Dřímalová, G.; Hromádková, Z.; Malovíková, A.; Ebringerová, A. Xyloglucan degradation using different radiation sources: A comparative study. Ultrason. Sonochem. 2006, 13, 157–164. [Google Scholar] [CrossRef]
  16. Manthei, A.; Elez-Martínez, P.; Soliva-Fortuny, R.; Murciano-Martínez, P. Ultrasonication and enzymatic treatment of apple and orange bagasses: Molecular characterization of released oligosaccharides and modification of techno-functional and health-related properties. LWT 2024, 194, 115816. [Google Scholar] [CrossRef]
  17. Manthei, A.; Elez-Martínez, P.; Soliva-Fortuny, R.; Murciano-Martínez, P. Prebiotic potential of pectin and cello-oligosaccharides from apple bagasse and orange peel produced by high-pressure homogenization and enzymatic hydrolysis. Food Chem. 2024, 435, 137583. [Google Scholar] [CrossRef]
  18. Sarpong, F.; Yu, X.; Zhou, C.; Hongpeng, Y.; Uzoejinwa, B.B.; Bai, J.; Wu, B.; Ma, H. Influence of anti-browning agent pretreatment on drying kinetics, enzymes inactivation and other qualities of dried banana (Musa ssp.) under relative humidity-convective air dryer. J. Food Meas. Charact. 2018, 12, 1229–1241. [Google Scholar] [CrossRef]
  19. Alvarez, S.; Alvarez, R.; Riera, F.A.; Coca, J. Influence of depectinization on apple juice ultrafiltration. Colloids Surf. A Physicochem. Eng. Asp. 1998, 138, 377–382. [Google Scholar] [CrossRef]
  20. Anthon, G.E.; Barrett, D.M. Combined enzymatic and colorimetric method for determining the uronic acid and methylester content of pectin: Application to tomato products. Food Chem. 2008, 110, 239–247. [Google Scholar] [CrossRef]
  21. Cassani, L.; Tomadoni, B.; Viacava, G.; Ponce, A.; Moreira, M. Enhancing quality attributes of fiber-enriched strawberry juice by application of vanillin or geraniol. LWT 2016, 72, 90–98. [Google Scholar] [CrossRef]
  22. Schneider, V.S.; Bark, J.M.; Winnischofer, S.M.B.; Dos Santos, E.F.; Iacomini, M.; Cordeiro, L.M.C. Dietary fibres from guavira pomace, a co-product from fruit pulp industry: Characterization and cellular antioxidant activity. Food Res. Int. 2020, 132, 109065. [Google Scholar] [CrossRef]
  23. Fonteles, T.V.; Leite, A.K.F.; da Silva, A.R.A.; Fernandes, F.A.N.; Rodrigues, S. Sonication Effect on Bioactive Compounds of Cashew Apple Bagasse. Food Bioprocess Technol. 2017, 10, 1854–1864. [Google Scholar] [CrossRef]
  24. Ryan, L.; Prescott, S.L. Stability of the antioxidant capacity of twenty-five commercially available fruit juices subjected to an in vitro digestion. Int. J. Food Sci. Technol. 2010, 45, 1191–1197. [Google Scholar] [CrossRef]
  25. Ma, Y.; Luo, J.; Xu, Y. Co-preparation of pectin and cellulose from apple pomace by a sequential process. J. Food Sci. Technol. 2019, 56, 4091–4100. [Google Scholar] [CrossRef] [PubMed]
  26. Gorinstein, S.; Martín-Belloso, O.; Park, Y.-S.; Haruenkit, R.; Lojek, A.; Ĉíž, M.; Caspi, A.; Libman, I.; Trakhtenberg, S. Comparison of some biochemical characteristics of different citrus fruits. Food Chem. 2001, 74, 309–315. [Google Scholar] [CrossRef]
  27. Mudgil, D. The Interaction Between Insoluble and Soluble Fiber. In Dietary Fiber for the Prevention of Cardiovascular Disease; Academic Press: Cambridge, MA, USA, 2017; pp. 35–59. [Google Scholar]
  28. Luo, X.; Wang, Q.; Fang, D.; Zhuang, W.; Chen, C.; Jiang, W.; Zheng, Y. Modification of insoluble dietary fibers from bamboo shoot shell: Structural characterization and functional properties. Int. J. Biol. Macromol. 2018, 120, 1461–1467. [Google Scholar] [CrossRef]
  29. Gogate, P.R.; Pandit, A.B. A review and assessment of hydrodynamic cavitation as a technology for the future. Ultrason. Sonochem. 2005, 12, 21–27. [Google Scholar] [CrossRef]
  30. Chaplin, M.F. Fibre and water binding. Proc. Nutr. Soc. 2003, 62, 223–227. [Google Scholar] [CrossRef]
  31. Dikeman, C.L.; Fahey, G.C. Viscosity as related to dietary fiber: A review. Crit. Rev. Food Sci. Nutr. 2006, 46, 649–663. [Google Scholar] [CrossRef]
  32. Goff, H.D.; Repin, N.; Fabek, H.; El Khoury, D.; Gidley, M.J. Dietary fibre for glycaemia control: Towards a mechanistic understanding. Bioact. Carbohydrates Diet. Fibre 2018, 14, 39–53. [Google Scholar] [CrossRef]
  33. López, G.; Ros, G.; Rincón, F.; Periago, M.J.; Martínez, M.C.; Ortuño, J. Relationship between Physical and Hydration Properties of Soluble and Insoluble Fiber of Artichoke. J. Agric. Food Chem. 1996, 44, 2773–2778. [Google Scholar] [CrossRef]
  34. García-Pérez, F.J.; Lario, Y.; Fernández-López, J.; Sayas, E.; Pérez-Alvarez, J.A.; Sendra, E. Effect of orange fiber addition on yogurt color during fermentation and cold storage. Color Res. Appl. 2005, 30, 457–463. [Google Scholar] [CrossRef]
  35. Du, H.; Yang, H.; Wang, X.; Zhu, F.; Tang, D.; Cheng, J.; Liu, X. Effects of mulberry pomace on physicochemical and textural properties of stirred-type flavored yogurt. J. Dairy Sci. 2021, 104, 12403–12414. [Google Scholar] [CrossRef]
  36. Paquet, É.; Hussain, R.; Bazinet, L.; Makhlouf, J.; Lemieux, S.; Turgeon, S.L. Effect of processing treatments and storage conditions on stability of fruit juice based beverages enriched with dietary fibers alone and in mixture with xanthan gum. LWT 2014, 55, 131–138. [Google Scholar] [CrossRef]
  37. Vaikousi, H.; Biliaderis, C.G. Processing and formulation effects on rheological behavior of barley β-glucan aqueous dispersions. Food Chem. 2005, 91, 505–516. [Google Scholar] [CrossRef]
  38. Martău, G.A.; Teleky, B.-E.; Ranga, F.; Pop, I.D.; Vodnar, D.C. Apple Pomace as a Sustainable Substrate in Sourdough Fermentation. Front. Microbiol. 2021, 12, 742020. [Google Scholar] [CrossRef]
  39. Carpita, N.C.; Gibeaut, D.M. Structural models of primary cell walls in flowering plants: Consistency of molecular structure with the physical properties of the walls during growth. Plant J. 1993, 3, 1–30. [Google Scholar] [CrossRef]
  40. Rashid, R.; Wani, S.M.; Manzoor, S.; Masoodi, F.; Dar, M. Green extraction of bioactive compounds from apple pomace by ultrasound assisted natural deep eutectic solvent extraction: Optimisation, comparison and bioactivity. Food Chem. 2022, 398, 133871. [Google Scholar] [CrossRef]
  41. Casquete, R.; Castro, S.M.; Martín, A.; Ruiz-Moyano, S.; Saraiva, J.A.; Cordoba, M.G.; Teixeira, P. Evaluation of the effect of high pressure on total phenolic content, antioxidant and antimicrobial activity of citrus peels. Innov. Food Sci. Emerg. Technol. 2015, 31, 37–44. [Google Scholar] [CrossRef]
  42. Lohani, U.C.; Muthukumarappan, K.; Meletharayil, G.H. Application of hydrodynamic cavitation to improve antioxidant activity in sorghum flour and apple pomace. Food Bioprod. Process. 2016, 100, 335–343. [Google Scholar] [CrossRef]
  43. Jutkus, R.A.L.; Li, N.; Taylor, L.S.; Mauer, L.J. Effect of temperature and initial moisture content on the chemical stability and color change of various forms of Vitamin C. Int. J. Food Prop. 2015, 18, 862–879. [Google Scholar] [CrossRef]
  44. Buchweitz, M.; Speth, M.; Kammerer, D.; Carle, R. Stabilisation of strawberry (Fragaria x ananassa Duch.) anthocyanins by different pectins. Food Chem. 2013, 141, 2998–3006. [Google Scholar] [CrossRef] [PubMed]
  45. Ortiz, L.; Dorta, E.; Lobo, M.G.; González-Mendoza, L.A.; Díaz, C.; González, M. Use of Banana (Musa acuminata Colla AAA) Peel Extract as an Antioxidant Source in Orange Juices. Plant Foods Hum. Nutr. 2017, 72, 60–66. [Google Scholar] [CrossRef]
  46. Dominguez-Perles, R.; Moreno, D.A.; Carvajal, M.; Garcia-Viguera, C. Composition and antioxidant capacity of a novel beverage produced with green tea and minimally-processed byproducts of broccoli. Innov. Food Sci. Emerg. Technol. 2011, 12, 361–368. [Google Scholar] [CrossRef]
  47. Gliszczynska-Swiglo, A.; Tyrakowska, B. Quality of commercial apple juices evaluated on the basis of the polyphenol content and the TEAC antioxidant activity. J. Food Sci. 2003, 68, 1844–1849. [Google Scholar] [CrossRef]
  48. Zhang, F.; Yi, W.; Cao, J.; He, K.; Liu, Y.; Bai, X. Microstructure characteristics of tea seed dietary fibre and its effect on cholesterol, glucose and nitrite ion adsorption capacities in vitro: A comparison study among different modifications. Int. J. Food Sci. Technol. 2020, 55, 1781–1791. [Google Scholar] [CrossRef]
  49. Dhital, S.; Dolan, G.; Stokes, J.R.; Gidley, M.J. Enzymatic hydrolysis of starch in the presence of cereal soluble fibre polysaccharides. Food Funct. 2014, 5, 579–586. [Google Scholar] [CrossRef]
  50. Ou, S.; Kwok, K.-C.; Li, Y.; Fu, L. In vitro study of possible role of dietary fiber in lowering postprandial serum glucose. J. Agric. Food Chem. 2001, 49, 1026–1029. [Google Scholar] [CrossRef]
  51. Axten, L.; Wohlers, M.; Wegrzyn, T. Using phytochemicals to enhance health benefits of milk: Impact of polyphenols on flavor profile. J. Food Sci. 2008, 73, H122–H126. [Google Scholar] [CrossRef]
  52. Li, W.; Yang, R.; Ying, D.; Yu, J.; Sanguansri, L.; Augustin, M.A. Analysis of polyphenols in apple pomace: A comparative study of different extraction and hydrolysis procedures. Ind. Crop. Prod. 2020, 147, 112250. [Google Scholar] [CrossRef]
  53. Benvenutti, L.; Bortolini, D.G.; Nogueira, A.; Zielinski, A.A.F.; Alberti, A. Effect of addition of phenolic compounds recovered from apple pomace on cider quality. LWT 2019, 100, 348–354. [Google Scholar] [CrossRef]
  54. Liu, C.-M.; Liang, R.-H.; Dai, T.-T.; Ye, J.-P.; Zeng, Z.-C.; Luo, S.-J.; Chen, J. Effect of dynamic high pressure microfluidization modified insoluble dietary fiber on gelatinization and rheology of rice starch. Food Hydrocoll. 2016, 57, 55–61. [Google Scholar] [CrossRef]
  55. Yu, G.; Bei, J.; Zhao, J.; Li, Q.; Cheng, C. Modification of carrot (Daucus carota Linn. var. Sativa Hoffm.) pomace insoluble dietary fiber with complex enzyme method, ultrafine comminution, and high hydrostatic pressure. Food Chem. 2018, 257, 333–340. [Google Scholar] [CrossRef]
  56. Morales-Medina, R.; Manthei, A.; Drusch, S. Enzymatic pre-treatment defines the water-binding and rheological properties of dynamic ultra-high-pressure homogenised pea hull suspensions. Food Hydrocoll. 2024, 157, 110454. [Google Scholar] [CrossRef]
  57. Vrolix, R.; Mensink, R.P. Variability of the glycemic response to single food products in healthy subjects. Contemp. Clin. Trials 2010, 31, 5–11. [Google Scholar] [CrossRef] [PubMed]
  58. Whelan, W.J.; Hollar, D.; Agatston, A.; Dodson, H.J.; Tahal, D.S. The glycemic response is a personal attribute. IUBMB Life 2010, 62, 637–641. [Google Scholar] [CrossRef] [PubMed]
  59. Zeevi, D.; Korem, T.; Zmora, N.; Israeli, D.; Rothschild, D.; Weinberger, A.; Ben-Yacov, O.; Lador, D.; Avnit-Sagi, T.; Lotan-Pompan, M.; et al. Personalized Nutrition by Prediction of Glycemic Responses. Cell 2015, 163, 1079–1094. [Google Scholar] [CrossRef] [PubMed]
  60. Borgström, B.; Dahlqvist, A.; Lundh, G.; Sjövall, J. Studies of intestinal digestion and absorption in the human. J. Clin. Investig. 1957, 36, 1521–1536. [Google Scholar] [CrossRef]
  61. Fabek, H.; Messerschmidt, S.; Brulport, V.; Goff, H.D. The effect of invitro digestive processes on the viscosity of dietary fibres and their influence on glucose diffusion. Food Hydrocoll. 2014, 35, 718–726. [Google Scholar] [CrossRef]
  62. Thondre, P.S.; Shafat, A.; Clegg, M.E. Molecular weight of barley β-glucan influences energy expenditure, gastric emptying and glycaemic response in human subjects. Br. J. Nutr. 2013, 110, 2173–2179. [Google Scholar] [CrossRef]
  63. Wood, P.J.; Braaten, J.T.; Scott, F.W.; Riedel, K.D.; Wolynetz, M.S.; Collins, M.W. Effect of dose and modification of viscous properties of oat gum on plasma glucose and insulin following an oral glucose load. Br. J. Nutr. 1994, 72, 731–743. [Google Scholar] [CrossRef]
  64. Törrönen, R.; McDougall, G.J.; Dobson, G.; Stewart, D.; Hellström, J.; Mattila, P.; Pihlava, J.-M.; Koskela, A.; Karjalainen, R. Fortification of blackcurrant juice with crowberry: Impact on polyphenol composition, urinary phenolic metabolites, and postprandial glycemic response in healthy subjects. J. Funct. Foods 2012, 4, 746–756. [Google Scholar] [CrossRef]
  65. Zhao, C.; Wan, X.; Zhou, S.; Cao, H. Natural Polyphenols: A Potential Therapeutic Approach to Hypoglycemia. eFood 2020, 1, 107–118. [Google Scholar] [CrossRef]
  66. Augustin, L.S.A.; Kendall, C.W.C.; Jenkins, D.J.A.; Willett, W.C.; Astrup, A.; Barclay, A.W.; Björck, I.; Brand-Miller, J.C.; Brighenti, F.; Buyken, A.E.; et al. Glycemic index, glycemic load and glycemic response: An International Scientific Consensus Summit from the International Carbohydrate Quality Consortium (ICQC). Nutr. Metab. Cardiovasc. Dis. 2015, 25, 795–815. [Google Scholar] [CrossRef] [PubMed]
Figure 1. Galacturonic acid (GalA) contents of apple juices without apple bagasse (control) and enriched with different concentrations of bagasse (1.5 %, 3 %, 4.5 %) applying different treatment conditions. NT—not-treated; T2/T6/T24—enzymatically treated for 2/6/24 h; US-T2—juice, ultrasonically treated and subsequently hydrolyzed with enzymes for 2h; the following numbers, i.e., 1.5, 3, 4.5, indicate the concentration of apple bagasse in the juice. Different letters indicate significant differences between samples (p < 0.05).
Beverages 11 00133 g001
Figure 2. Total phenolic content (TPC) (Beverages 11 00133 i001) and DPPH scavenging rate (Beverages 11 00133 i002) of apple juices without apple bagasse (control) and enriched with 3 % pectin or different concentrations of bagasse (1.5 %, 3 %, 4.5 %) applying different treatment conditions. NT—not-treated; T2/T6/T24—enzymatically treated for 2/6/24 h; US-T2—juice; ultrasonically treated and subsequently hydrolyzed with enzymes for 2 h; the following number, i.e., 1.5, 3, 4.5, indicate the concentration of apple bagasse/pectin in the juice.
Beverages 11 00133 g002
Figure 3. (AD): Released glucose into the dialysate over a dialysis time of 1 h of pre-digested apple juices without AB (control) in comparison to juices enriched with 1.5%, 3%, 4.5% AB and enzymatically treated for 2 h (A) and 6 h (B). In (C,D), released glucose during dialysis of control juices and beverages containing 3% AB (C) and 4.5% AB (D) applying different EH times were illustrated.
Beverages 11 00133 g003
Figure 4. Results of the sensory evaluation of apple juice without AB (control) and juices containing 3% AB, enzymatically treated for 2 h (T2-3) and additionally with US (US-T2-3). Attributes were rated by 40 individuals on a scale from 1 to 5 (low–high) and the average ratings are presented on the graph.
Beverages 11 00133 g004
Figure 5. Average of the glycemic response of 10 participants after ingesting 200 mL of the apple juice without AB (control) and of the juice which contained 3% AB and was enzymatically treated for 2 h (T2-3).
Beverages 11 00133 g005
Table 1. DF composition of apple bagasse, including content of insoluble dietary fiber (IDF), soluble dietary fiber (SDF), cellulose, hemicellulose and lignin.
IDF [%]SDF [%]Cellulose [%]Hemicellulose [%]Lignin [%]
Apple bagasse37.40 ± 1.277.45 ± 0.4919.92 ± 0.989.11 ± 1.124.26 ± 0.45
Table 2. Properties, including D50 and D90 of particle size distribution, pH, viscosity and colorimetric values, of apple juices without apple bagasse (control) and enriched with 3% pectin and different concentrations of bagasse (1.5%, 3%, 4.5%) applying different treatment conditions. Different letters indicate significant differences between samples (p < 0.05).
D50D90pHViscosity [mPa·s]L*-Value
(Whiteness)
a*-Value
(Red-Green)
b*-Value
(Yellow-Blue)
Color Difference ΔE
Control9.94 ± 0.06 a23.43 ± 0.15 a3.871.83 ± 0.01 a33.70 ± 0.00 a−1.83 ± 0.00 ab4.78 ± 0.01 a
NT-1.5356.57 ± 4.04 b771.67 ± 1.15 b3.765.98 ± 0.1 a39.38 ± 0.02 b−2.18 ± 0.01 cd10.16 ± 0.01 b7.84 ± 0.02 a
NT-3340.33 ± 4.04 bc760.00 ± 4.36 b3.65257.50 ± 12.02 b41.35 ± 0.00 c−1.44 ± 0.00 f12.12 ± 0.02 c10.62 ± 0.02 b
NT-4.5320.67 ± 2.08 c749.67 ± 3.79 b3.59n.a.44.82 ± 0.04 d−1.19 ± 0.16 g15.81 ± 0.10 d15.69 ± 0.05 c
T2-1.5255.67 ± 16.01 de571.00 ± 40.87 c3.642.58 ± 0.14 a37.95 ± 0.01 e−2.49 ± 0.04 e8.67 ± 0.00 e5.82 ± 0.01 d
T2-3264.00 ± 18.68 d581.00 ± 40.80 c3.4649.55 ± 9.69 ab40.04 ± 0.00 f−2.26 ± 0.01 d11.48 ± 0.01 f9.25 ± 0.00 e
T2-4.5264.00 ± 18.52 d578.67 ± 40.05 c3.34179.75 ± 44.90 d42.68 ± 0.03 g−1.30 ± 0.01 fg15.42 ± 0.05 g13.95 ± 0.05 f
T6-1.5241.33 ± 10.02 def497.67 ± 29.02 c3.542.59 ± 0.29 a34.40 ± 0.00 h−2.00 ± 0.01 bc4.24 ± 0.01 h0.89 ± 0.00 g
T6-3236.67 ± 12.50 def501.00 ± 39.51 c3.4014.80 ± 2.12 a39.08 ± 0.03 i−2.31 ± 0.02 de10.39 ± 0.02 b7.80 ± 0.03 b
T6-4.5251.00 ± 15.10 def550.33 ± 50.80 c3.28138.00 ± 28.28 cd41.38 ± 0.06 c−1.66 ± 0.01 a13.72 ± 0.05 i11.80 ± 0.07 h
T24-1.5217.67 ± 8.62 fg456.33 ± 25.42 c3.492.64 ± 0.18 a44.82 ± 0.20 j−1.88 ± 0.03 b8.27 ± 0.04 j4.07 ± 0.14 i
T24-3225.00 ± 13.75 efg469.33 ± 34.95 c3.3214.05 ± 1.06 a38.94 ± 0.06 i−2.15 ± 0.02 cd11.07 ± 0.04 k8.21 ± 0.06 j
T24-4.5220.67 ± 9.02 fg468.00 ± 27.84 c3.2290.30 ± 7.78 bc40.50 ± 0.13 k−1.68 ± 0.01 a12.81 ± 0.18 l10.54 ± 0.21 b
US-T2-3197.00 ± 8.19 g458.00 ± 46.51 c3.4729.90 ± 5.52 a42.02 ± 0.04 l−1.87 ± 0.00 b12.76 ± 0.06 l11.54 ± 0.07 h
Pectin-39.32 ± 0.12 a98.07 ± 5.14 a3.1751.15 ± 4.60 ab36.78 ± 0.09 m−2.26 ± 0.02 d7.01 ± 0.05 m3.83 ± 0.10 i
NT—not-treated; T2/T6/T24—enzymatically treated for 2/6/24 h; US-T2—juice ultrasonically treated for 8 min with 400 W and subsequently hydrolyzed with enzymes for 2 h; the following numbers, i.e., 1.5, 3, 4.5, indicate the concentration of apple bagasse/pectin in the juice.
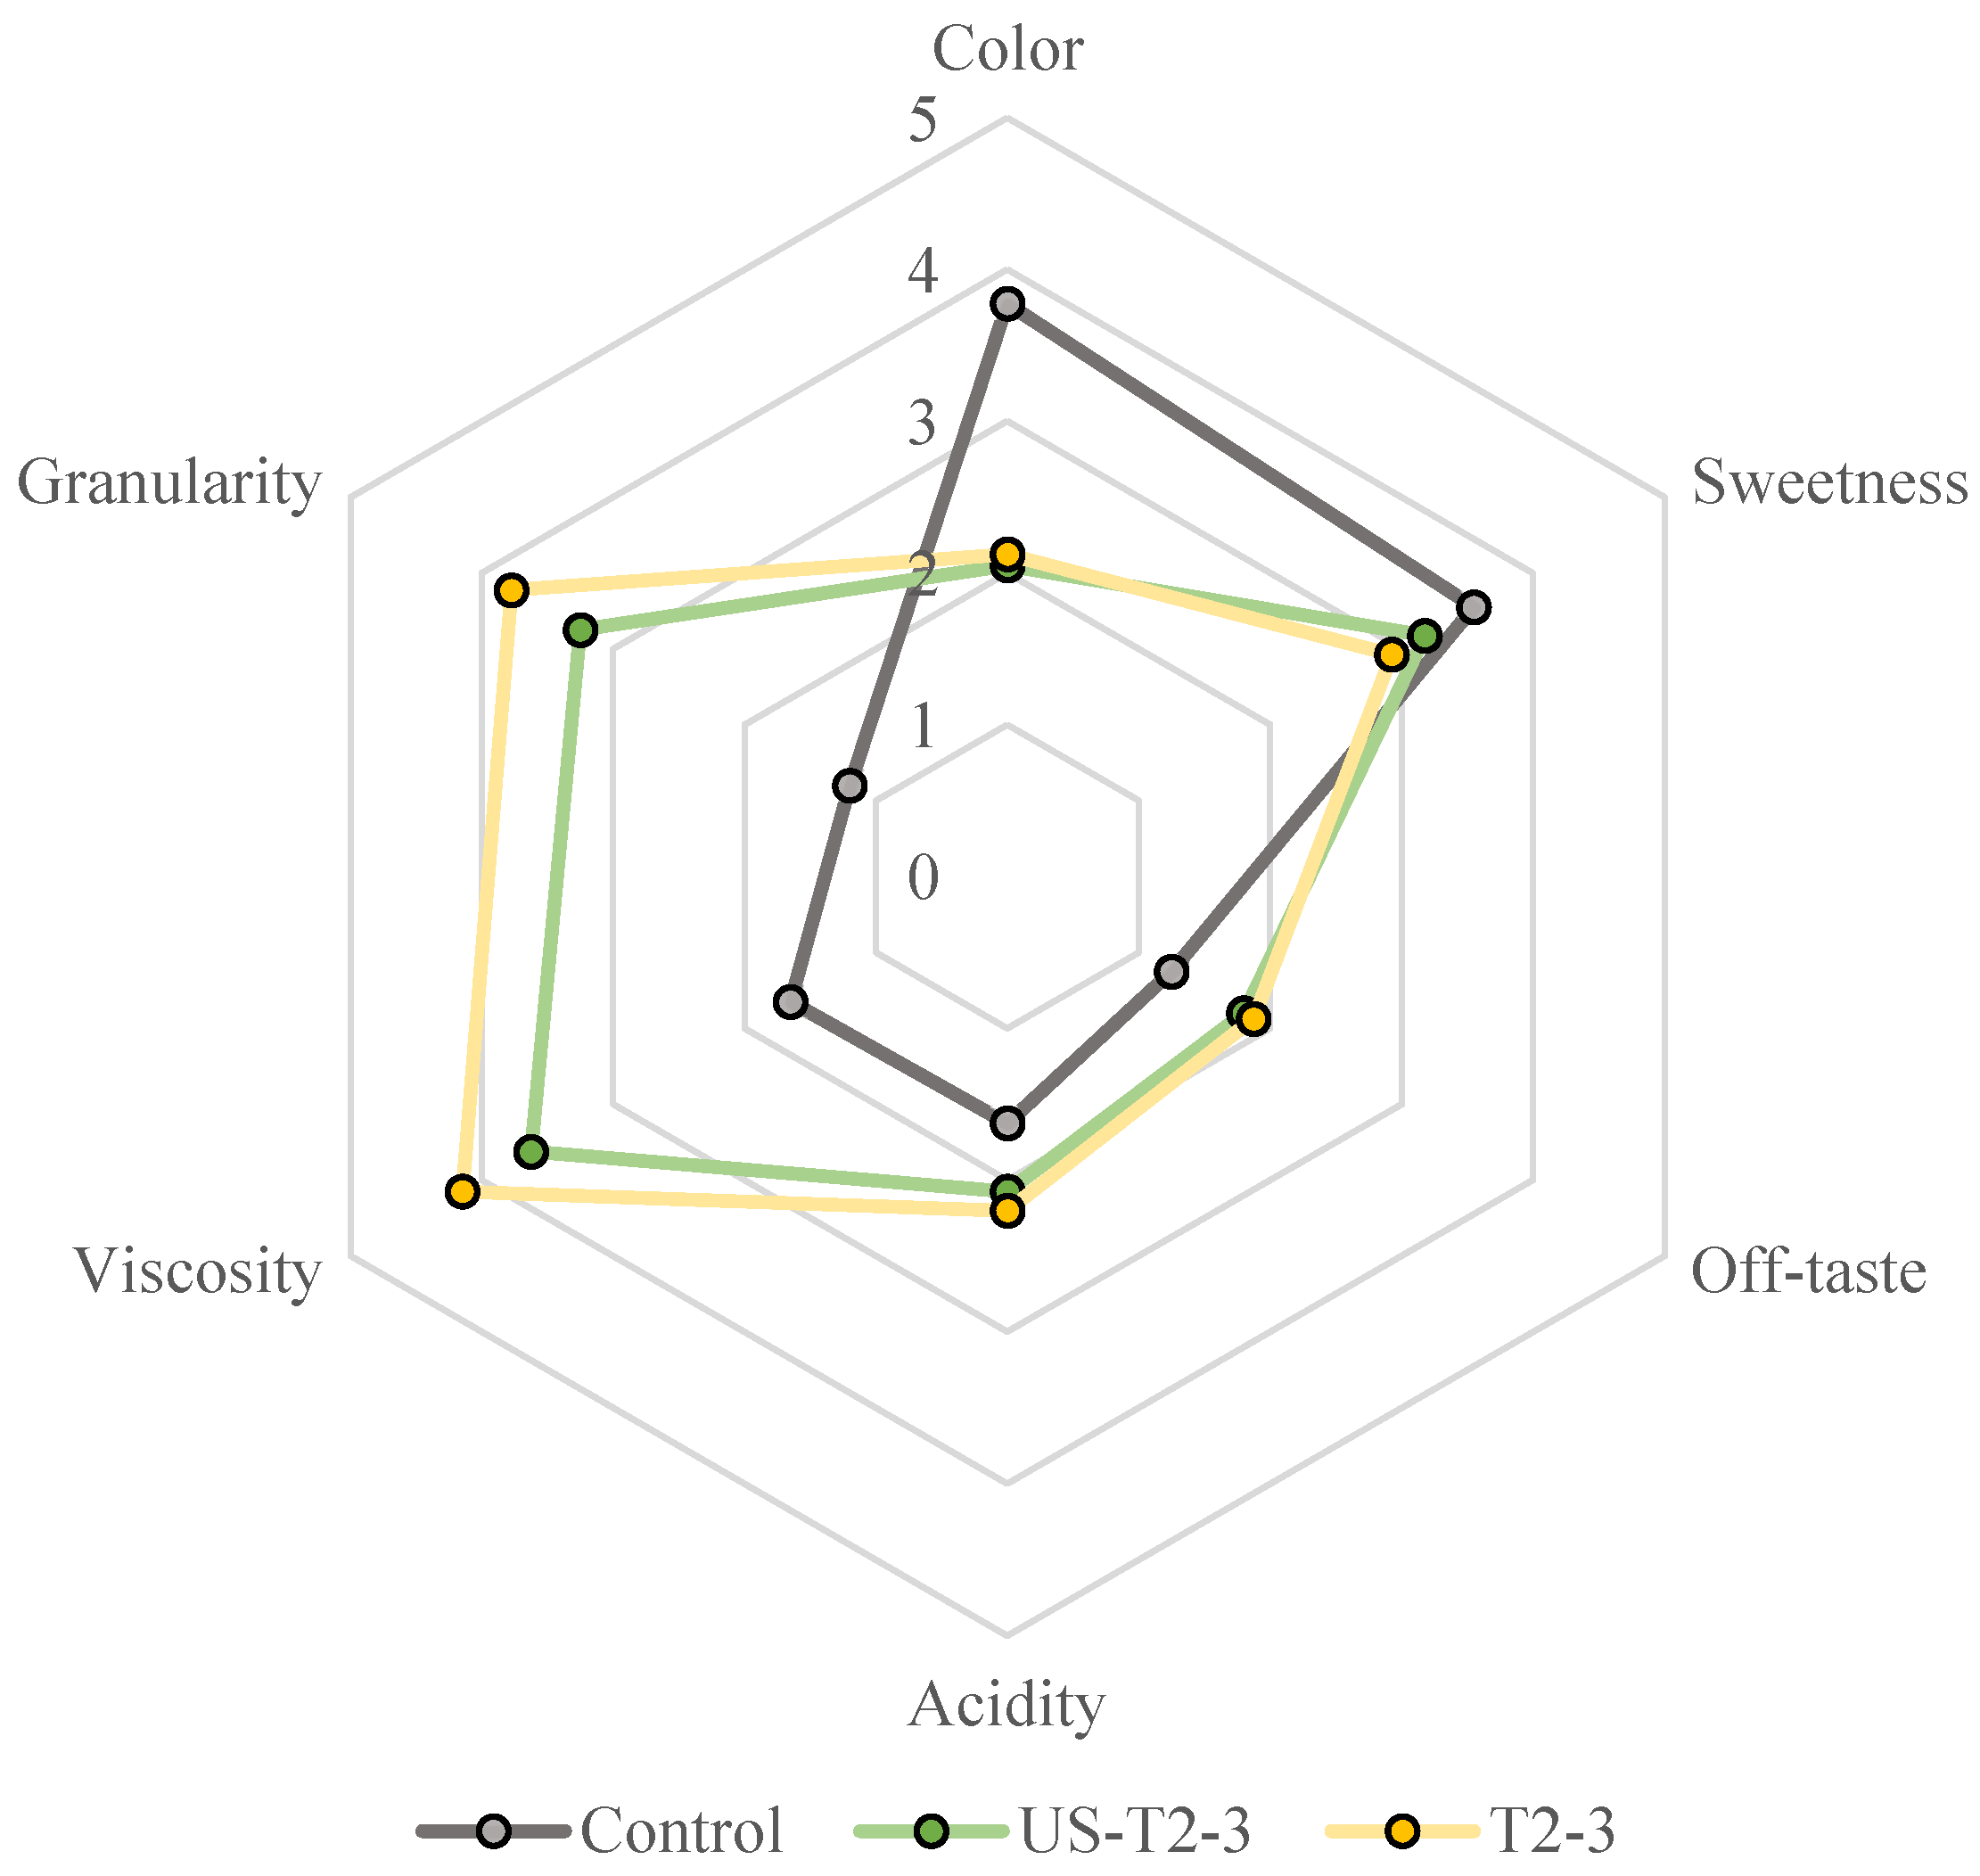
Table 3. Glucose concentrations, released after 15, 30, 45 and 60 min of dialysis, into the dialysate of apple juices without apple bagasse (control) and enriched with 3% pectin or different concentrations of bagasse (1.5%, 3%, 4.5%) applying different treatment conditions.
Released Glucose in Dialysate [mg/mL]
15 min 30 min 45 min 60 min
Control0.425 ± 0.10 ab0.784 ± 0.10 ab1.027 ± 0.03 abc1.415 ± 0.00 a
NT-1.50.212 ± 0.02 bc0.655 ± 0.10 abc0.951 ± 0.17 abc1.273 ± 0.17 ab
NT-30.404 ± 0.00 ab0.565 ± 0.00 bcde0.814 ± 0.03 abcd0.912 ± 0.02 cde
NT-4.50.197 ± 0.02 bc0.340 ± 0.03 ef0.459 ± 0.03 e0.566 ± 0.01 f
T2-1.50.258 ± 0.02 bc0.676 ± 0.07 abc1.052 ± 0.10 ab1.194 ± 0.01 abc
T2-30.240 ± 0.00 c0.412 ± 0.03 f0.714 ± 0.05 de0.897 ± 0.06 ef
T2-4.50.278 ± 0.06 bc0.365 ± 0.00 cdef0.523 ± 0.01 de0.639 ± 0.05 ef
T6-1.50.574 ± 0.09 a0.876 ± 0.04 a1.081 ± 0.12 a1.249 ± 0.00 ab
T6-30.391 ± 0.02 ab0.752 ± 0.03 ab0.946 ± 0.12 abc1.162 ± 0.02 abc
T6-4.50.416 ± 0.07 ab0.569 ± 0.01 bcde0.726 ± 0.06 bcde0.903 ± 0.11 cde
T24-1.50.212 ± 0.16 bc0.501 ± 0.03 cdef0.701 ± 0.04 cde1.018 ± 0.24 bcde
T24-30.111 ± 0.02 c0.427 ± 0.07 def0.721 ± 0.08 cde1.086 ± 0.05 bc
T24-4.50.267 ± 0.11 bc0.480 ± 0.08 cdef0.709 ± 0.10 cde0.768 ± 0.07 def
US-T2-30.423 ± 0.02 ab0.583 ± 0.09 bcd0.728 ± 0.02 bcde0.893 ± 0.06 cde
Pectin-30.197 ± 0.04 bc0.536 ± 0.00 bcdef0.801 ± 0.10 abcd1.043 ± 0.06 bcd
NT—not-treated; T2/T6/T24—enzymatically treated for 2/6/24 h; US-T2—juice, ultrasonically treated for 8 min, 400 W and subsequently hydrolyzed with enzymes for 2h; the following numbers, i.e., 1.5, 3, 4.5, indicate the concentration of apple bagasse/pectin in the juice. Different letters indicate significant differences between samples (p < 0.05).
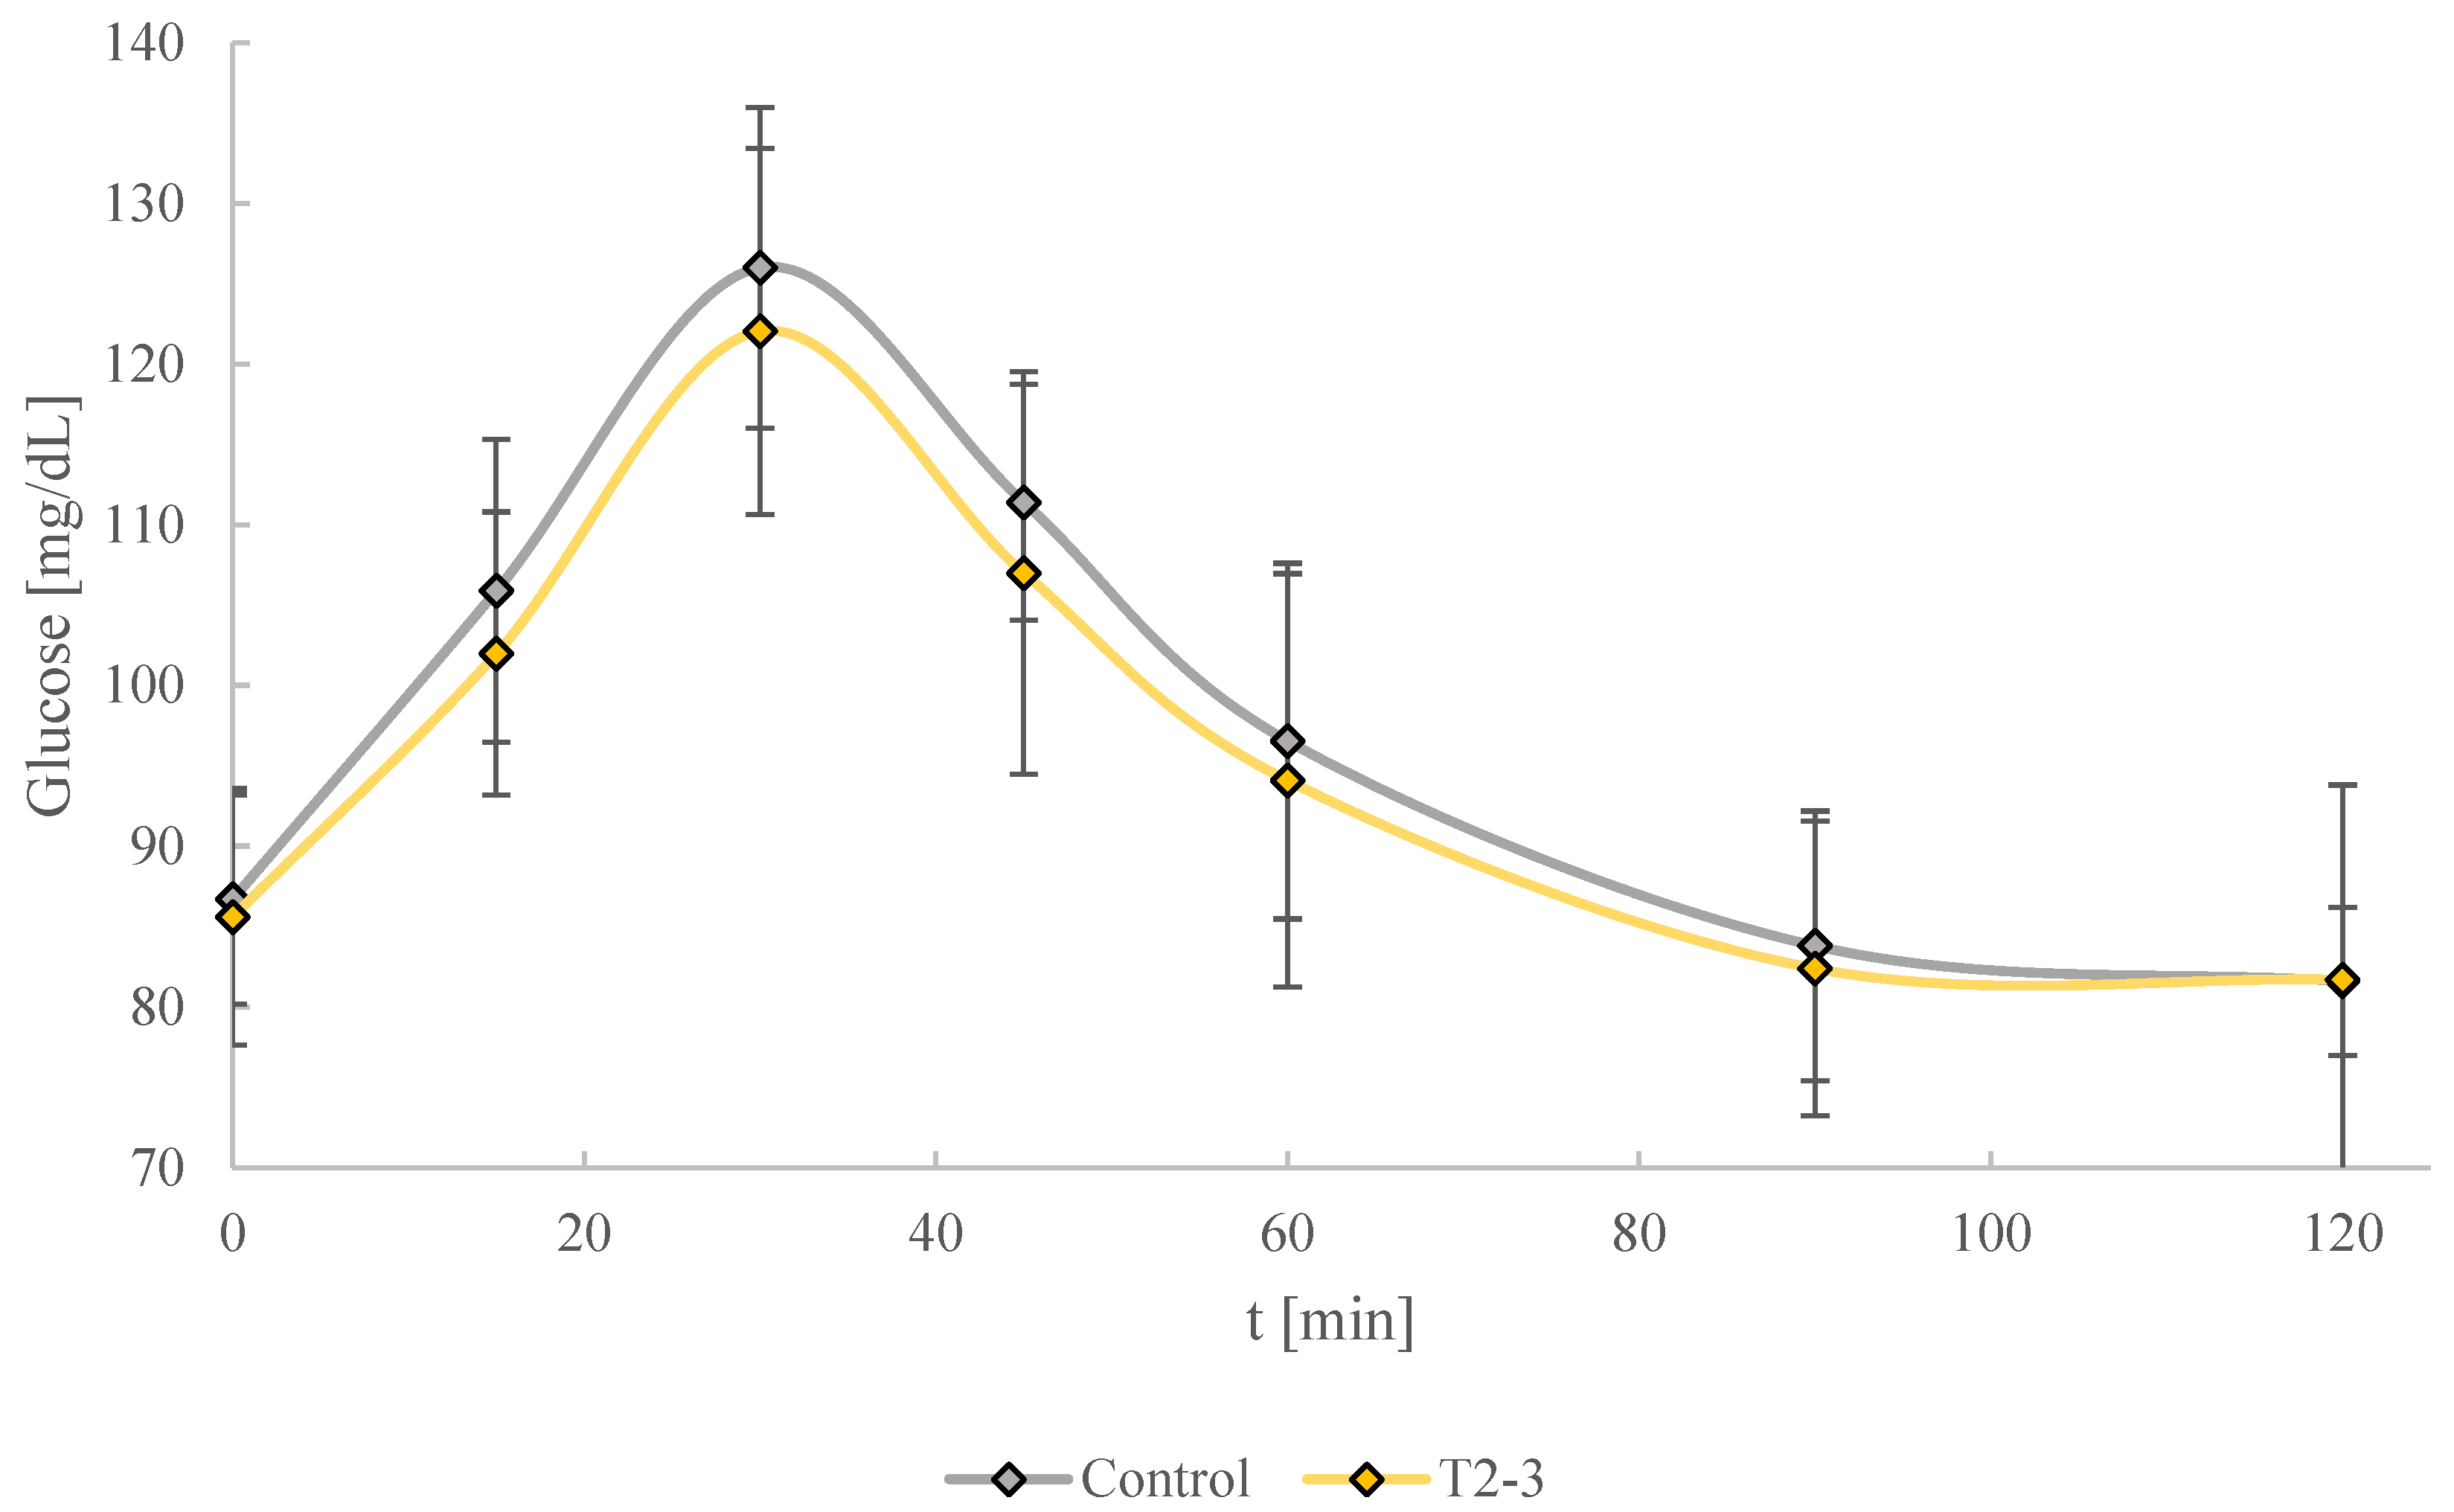
Table 4. Concentration of glucose in the bagasse (AB), juices without AB (control) and treated juices containing 3% AB applying different treatment conditions. Different letters indicate significant differences between samples (p < 0.05).
Glucose [mg/mL]
Apple bagasse1.08 ± 0.02 a*
Control31.95 ± 0.21 b
NT-335.18 ± 0.18 c
T2-335.60 ± 0.06 c
T6-335.23 ± 0.24 c
T24-335.39 ± 0.24 c
US-T2-336.56 ± 0.41 d
* Measured in a bagasse-in-water suspension; free glucose concentration of apple bagasse powder: 0.11 mg/mg bagasse.
Disclaimer/Publisher’s Note: The statements, opinions and data contained in all publications are solely those of the individual author(s) and contributor(s) and not of MDPI and/or the editor(s). MDPI and/or the editor(s) disclaim responsibility for any injury to people or property resulting from any ideas, methods, instructions or products referred to in the content.