Article

Distribution and Relationships of Polycyclic Aromatic Hydrocarbons (PAHs) in Soils and Plants near Major Lakes in Eastern China

1
MOE Laboratory for Earth Surface Processes, College of Urban and Environmental Sciences, Peking University, Beijing 100871, China
2
Beijing Key Laboratory of Water Resources & Environmental Engineering, China University of Geosciences (Beijing), Beijing100083, China
*
Author to whom correspondence should be addressed.
Toxics 2022, 10(10), 577; https://doi.org/10.3390/toxics10100577
Submission received: 17 August 2022 / Revised: 28 September 2022 / Accepted: 29 September 2022 / Published: 30 September 2022

Abstract

:
The distributions and correlations among polycyclic aromatic hydrocarbons (PAHs) in soils and plants were analyzed. In this study, 9 soil samples and 44 plant samples were collected near major lakes (Hongze Lake, Luoma Lake, Chaohu, Changhu, Danjiangkou Reservoir, Wuhan East Lake, Longgan Lake, Qiandao Lake and Liangzi Lake) in eastern China. The following results were obtained: The total contents of PAHs in soil varied from 99.17 to 552.10 ng/g with an average of 190.35 ng/g, and the total contents of PAHs in plants varied from 122.93 to 743.44 ng/g, with an average of 274.66 ng/g. The PAHs in soil were dominated by medium- and low-molecular-weight PAHs, while the PAHs in plants were dominated by low-molecular-weight PAHs. The proportion of high-molecular-weight PAHs was the lowest in both soil and plants. Diagnostic ratios and principal component analysis (PCA) identified combustion as the main source of PAHs in soil and plants. The plant PAH monomer content was negatively correlated with Koa. Acenaphthylene, anthracene, benzo[k]fluoranthene, benzo[b]fluoranthene and dibenzo[a,h]anthracene were significantly correlated in plants and soil. In addition, no significant correlation between the total contents of the 16 PAHs and the content of high-, medium-, and low-molecular-weight PAHs in plants and soil was found. Bidens pilosa L. and Gaillardia pulchella Foug in the Compositae family and cron in the Poaceae family showed relatively stronger accumulation of PAHs, indicating their potential for phytoremediation.

1. Introduction

Polycyclic aromatic hydrocarbons (PAHs) are a class of organic compounds containing two or more benzene rings connected by fused or non-fused rings. PAHs are released into the environment from both natural and anthropogenic sources. The incomplete combustion of organic matter from human activities, such as the combustion of coal, firewood, and other biomass, as well as exhaust emissions from diesel and gasoline vehicles, can lead to the production of PAHs [1]. Natural activities, such as forest fires, grassland fires and volcanic eruptions also produce PAHs [2,3,4]. PAHs are carcinogenic and mutagenic [5,6]. They are ubiquitous in water, the atmosphere, soil, and sediment. They may harm human health if they enter the body through exposure to contaminated environments or the food chain [7,8].
In terrestrial environments, soil is the primary environmental repository for semi-volatile organic compounds, such as PAHs [9]. PAHs in soil can be derived from both dry and wet deposition of PAHs from the atmosphere. Wastewater discharge and irrigation may also increase the concentration of PAHs in soil [10]. For PAH-contaminated soil remediation, phytoremediation is one of the attractive strategies due to its environmental friendliness and relatively low cost [11]. Plants can absorb and accumulate PAHs from contaminated soil [12]. In addition to soil, plants can also absorb PAHs directly from the atmosphere because of the lipophilicity of both PAHs and the plant cuticle [13]. Contaminated particulates deposited on leaves are another source of PAHs in plants [14]. Studies have shown that the differences in PAHs in plant samples reflect spatial differences in PAHs in the atmosphere [15].
There have been a variety of studies on PAHs in soils around the world. The content and distribution of PAHs in soils from different countries have been reported [16,17,18]. Some studies focus on the sources, health risks and ecological risks of PAHs in soil [19,20]. Studies on the remediation of PAH-contaminated soils have also been conducted [21,22].
Compared to soil studies, there are fewer studies on PAHs in plants. The type of plant species is one of the factors that affect the concentration of PAHs in plants [23,24]. Several plants have been found to have the potential to remediate PAH-contaminated soils [25,26], but the distribution of PAHs in the plant-soil system has not been discussed.
Various studies have been conducted on PAHs in soil [27,28,29], and several studies have measured the contents of PAHs in plants. However, few studies have focused on soil-plant systems. In this study, soil samples and plant samples near major lakes in eastern China were collected to: (1) investigate the contents and distribution of 16 PAHs in soil and plants; (2) preliminarily identify the emission sources of PAHs; (3) reveal the distribution of PAHs in the soil-plant system and the possible relationships between PAHs in soil and plants; (4) explore the possibility of phytoremediation in PAH-contaminated soil.

2. Materials and Methods

2.1. Sample Collection

The nearshore areas of nine lakes in two major lake areas in eastern China were selected for this study. The nine lakes include Hongze Lake and Luoma Lake in the Huaihe River Basin, and Chaohu, Changhu, Danjiangkou Reservoir, Wuhan East Lake, Longgan Lake, Qiandao Lake, and Liangzi Lake in the middle and lower reaches of the Yangtze River. Detailed information on the nine lakes is provided in Table S1.
Soil samples (n = 9) were collected from nearshore areas of the lakes. Five samples were collected from each quadrat and were mixed. Plant samples (n = 44) included whole plants for herbs, small shrubs, and leaves of large shrubs and trees. The plants in each soil quadrat were represented by the 3–5 common plants in the quadrat. Soil and plant samples were air-dried at a temporary location, transported in bags, freeze-dried, and ground in the laboratory before extraction.

2.2. Sample Extraction and Cleanup

In the laboratory, the soil and plant samples were transferred into polytetrafluoroethylene (PTFE) microwave tubes. 20 mL of hexane-acetone (1:1, v/v) mixture and surrogate standards (2-fluorobiphenyl and 4-terphenyl-d14) were added. The samples were soaked in the solution overnight until completely saturated. Then the PAHs were extracted using a microwave extraction system. The temperature was increased to 100 °C in 10 min, maintained for 10 min, and then cooled over 30 min. After filter pressing, 6 mL of a hexane-acetone (1:1, v/v) mixture was used to wash the extraction tube twice. The filtered extracts were rotary evaporated to approximately 1 mL. For solvent exchange, 5 mL of hexane was added, and the solution was rotary-evaporated to approximately 1 mL.
Anhydrous sodium-silica-alumina (1 cm, 10 cm, and 10 cm from top to bottom) chromatography columns were used for clean–up. Since plants contain chlorophyll, when purifying plant samples, 2 cm of Florisil was employed before alumina was used to enhance the purification effect. The concentrated solution was then transferred to a column. Then, 15 mL of hexane was added and the mixture was discharged. Subsequently, 70 mL of dichloromethane was added to elute the PAHs. The eluate containing the PAHs was concentrated to approximately 1 mL. Then, 5 mL of hexane were added for solvent exchange and the solution was rotary-evaporated to approximately 1 mL. Next, 25 μL internal standards (naphthalene-d8, acenaphthene-d10, chrysene-d12, perylene-d12 and anthracene-d10, 4 mg/L) was added. The solution was transferred into a 2 mL brown vial for instrument analysis.

2.3. Sample Analysis

An Agilent 6890 gas chromatograph (GC) coupled with a 5973 mass spectrometer detector (MSD) (Agilent Technologies Inc., Palo Alto, CA, USA) was used to determine the PAH contents of the samples. A DB-5 MS column (30 m*250 μm internal diameter, 0.25 μm film thickness) was used. The instruments were operated in electron impact (EI) and selective ion monitoring (SIM) modes. The carrier gas was helium (99.999%) and the flow rate was 1.2 mL/min. The injection volume was 1μL and the injection port temperature was 280 ℃. The temperature of ion source was 230 ℃. The oven temperature was programmed to an initial temperature of 60 ℃ for 1 min and then increased at a rate of 10 ℃/min from 60 to 180 ℃, at which point the temperature was maintained for 6 min. Then, the temperature increased to 250 ℃ at a rate of 10 ℃/min for 5 min and then increased to 305 ℃ at a rate of 15 ℃/min, and held for 6 min. The chromatograms of the 16 PAHs are shown in Figure S1.
Two parallel samples were used for soil and plant samples. The methods for recoveries were determined before the samples were formally analyzed. The recoveries of the 16 priority PAHs set by the US EPA are listed in Table S2. The recoveries of PAHs in soil were between 39.7% and 80.8%, and the recoveries of PAHs in plants ranged from 35.6 to 104%.

2.4. Data Analysis

Data processing and graphing were performed using Microsoft Excel 2016 (Microsoft, Seattle, WA, USA) and SPSS 20.0 (IBM, Armonk, NY, USA). Part of the graphing was performed using Origin 2020 (OriginLab, Northampton, MA, USA). Data normality was tested using the Shapiro-Wilk test, and data correlations were tested using the Spearman’s rank correlation coefficient and Pearson correlation coefficient.

3. Results

3.1. The Statistical Features of PAH Contents in Soil and Plants

Sixteen priority PAHs were detected in the soil and plant samples. A normality test of PAHs content was performed. The PAH contents in soil and plants were logarithmically transformed, and the Shapiro-Wilk test was used to test for a normal distribution in the data before and after transformation. In the soil samples, 12 PAHs did not follow a normal distribution (p < 0.05) before transformation, while 4 PAHs did follow a normal distribution (Nap, Flu, Phe and Ant). After logarithmic transformation, the skewness and kurtosis of the 16 PAHs were reduced, and all substances obeyed a lognormal distribution (Figure S2, Table S3). Therefore, the PAH monomer content of soil can be described by a lognormal distribution. Before transformation, only Ace showed a normal distribution in plant samples (p = 0.061 > 0.05). After logarithmic transformation, the skewness and kurtosis of the 16 PAHs were reduced. In addition to Ace, the other five PAHs (Nap, Phe, Ant, Chr and BaP) obeyed a normal distribution. However, in general, the contents of most PAH monomers did not obey a normal distribution before and after logarithmic transformation (Figure S3, Table S4). Therefore, it is not appropriate to describe the PAHs content of plants with normal or lognormal distributions.
In the soil samples, the average total PAH content was 190 ng/g, and the concentration range was 99.2–552 ng/g. The detection rates of the PAH monomers were all 100%, except for Ace and DahA, whose detection rates were 66.7% and 88.9%, respectively (Table 1). In plant samples, the average total content of PAHs was 275 ng/g, which was higher than that in soil. The total PAH content ranged from 123 ng/g to 743 ng/g. The detection rates of PAHs were 100%, except for six PAHs (Ace, BkF, BaP, IcdP, DahA, and BghiP). Phe was the most abundant PAH in soil and plants. In soil samples, the content of Any was the lowest, and the contents of Ace, DahA, and BaP were also low, and were even lower in plant samples (Tables S5 and S6).

3.2. Distribution and Composition of PAHs in Soil

The distribution and composition characteristics of PAHs in soils varied among different lakes. The PAH content of the soil sample from Qiandao Lake was the highest (552 ng/g), followed by the PAH content of the soil samples from Wuhan East Lake and Changhu. The PAHs contents of the soil samples from the other lakes were below 200 ng/g. The PAH content of the soil sample from Luoma Lake was the lowest, at only 99.2 ng/g (Figure 1a). The concentrations of Nap, Any, Ace, Flu, Phe, and Ant were similar among the different soil samples. The concentrations of other PAH monomers were higher in soil samples with higher total PAH contents (Figure 1b). The Spearman’s rank correlation coefficient was used to analyze the correlation between the PAH monomer content and total PAH content. The results showed no significant correlations between the Nap, Ace, Flu, Phe, and Ant contents and the total content of PAHs. However, the monomer contents of the other 11 PAHs and the total content were significantly correlated at a confidence level of 0.01, indicating that the differences in PAHs contents in soils from different lake areas were mainly due to the 11 PAHs.
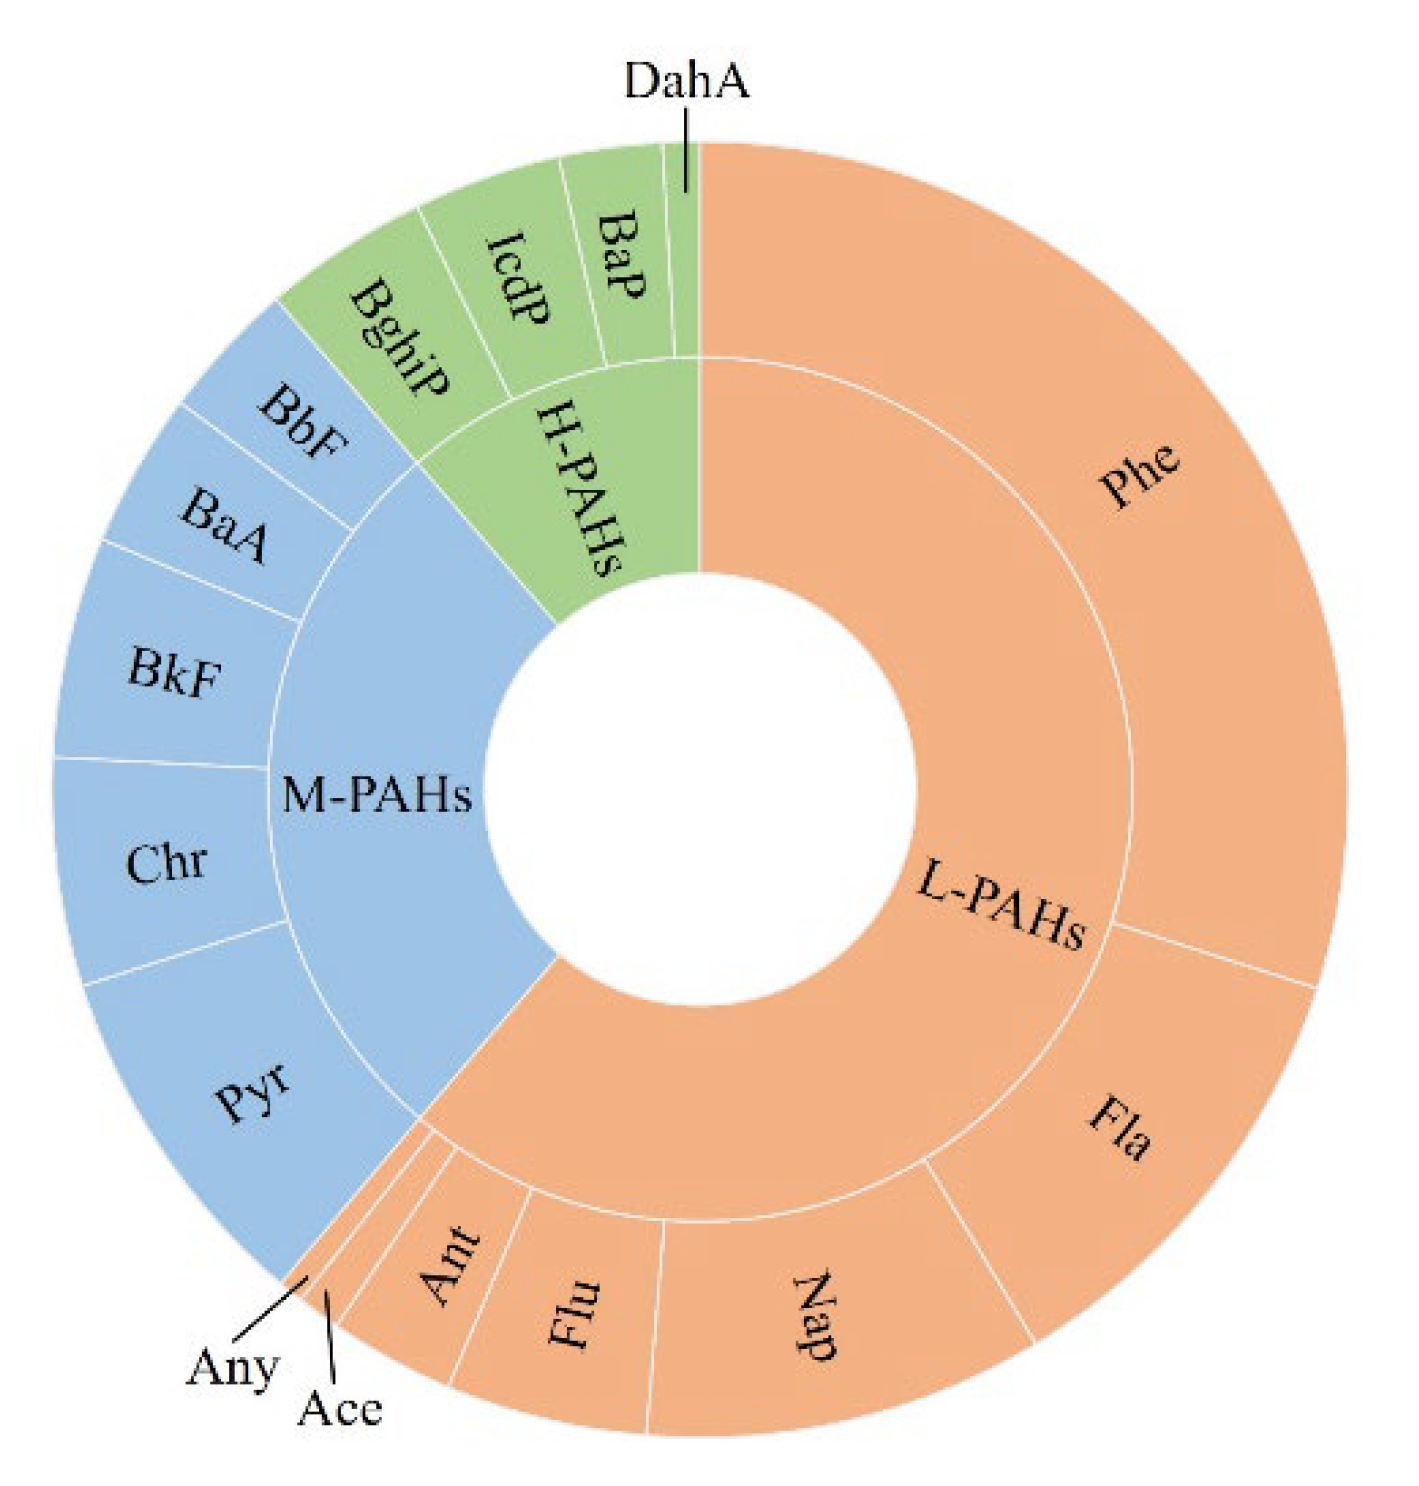
Overall, Phe accounted for the highest proportion (30.0%) of the 16 PAHs in soil, followed by Flu, Nap, and Pyr, whereas BaP, DahA, Ace, and Any accounted for low proportions, all below 3% (Figure 2). The 16 PAHs were divided into three types: low-molecular-weight PAH (seven bi- and tri-ring PAHs), medium-molecular-weight PAH (five tetra-ring PAHs), and high-molecular-weight PAH (four penta- and hexa-ring PAHs). Low-molecular-weight PAHs accounted for 61.2% of the soil PAHs, while high-molecular-weight PAHs accounted for the smallest proportion of soil PAHs (11.4 %).
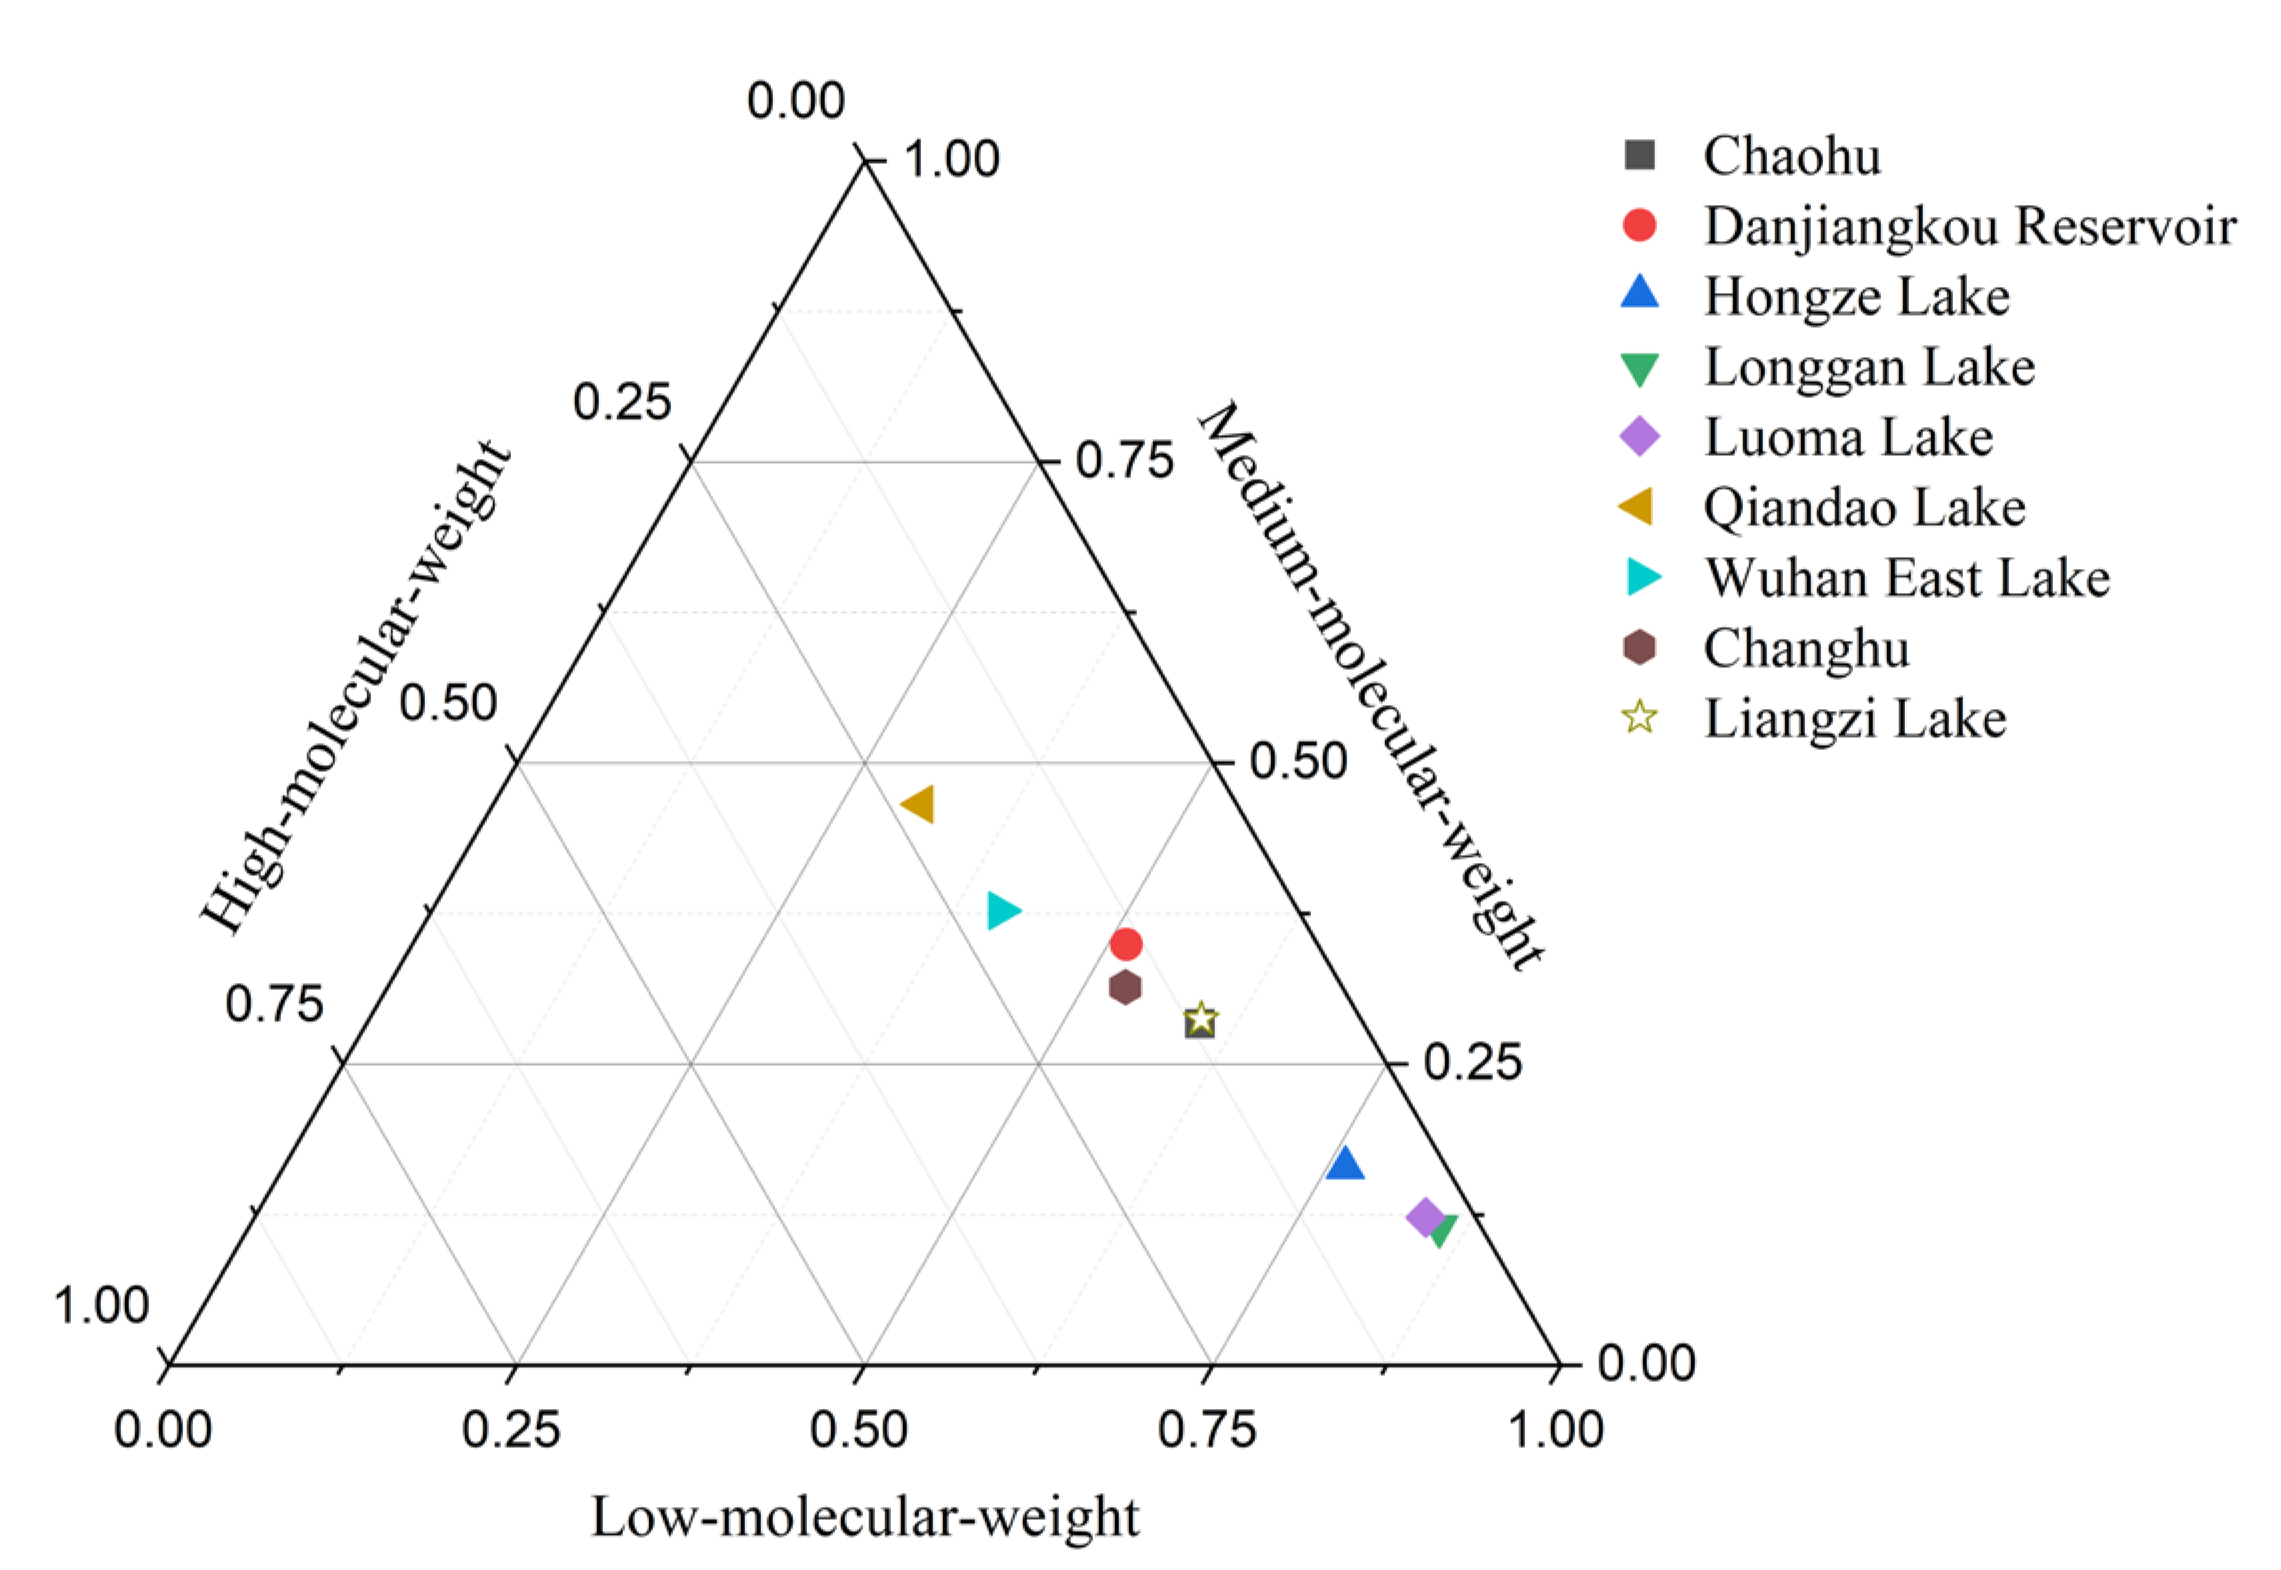
For soil samples from different lakes, the PAHs in the soil near Qiandao Lake were dominated by medium-molecular-weight PAHs, which accounted for 46.6% of the total PAHs, followed by low- and high-molecular-weight PAHs. Low-molecular-weight and medium-molecular-weight PAHs were the main PAHs in the soil of Wuhan East Lake. The proportions of the two groups were similar (40.8% and 37.7 %, respectively). The proportion of high-molecular-weight PAHs was the lowest. In the soils of the other seven lakes, low-molecular-weight PAHs were dominant, accounting for more than 50% of the total PAHs. In the soils of Hongze Lake, Longgan Lake, and Luoma Lake, low-molecular-weight PAHs accounted for more than 75% of the total PAHs. In general, the PAHs in the soils of the nine lakes were dominated by low- and medium-molecular-weight PAHs. High-molecular-weight PAHs accounted for the least number of PAHs (Figure 3).

3.3. Distribution and Composition of PAHs in Plants

There were also differences in the distributions and compositions of PAHs in different plants. The PAH content of the Garcinia genus Hypericum was the highest (660 ng/g), while the PAH content of plants from other families was less than 400 ng/g (Figure 4). Among the different species of plants, the highest PAH content was found in Erigeron annuus (L.) Pers. (743 ng/g). Two species of Poaceae also had two large values: Setaria viridis (L.) Beauv. (542 ng/g), and Imperata cylindrica (L.) Beauv. (527 ng/g). In general, except for a few extremely high values, the PAHs contents of different plant families ranged from 100 to 400 ng/g.
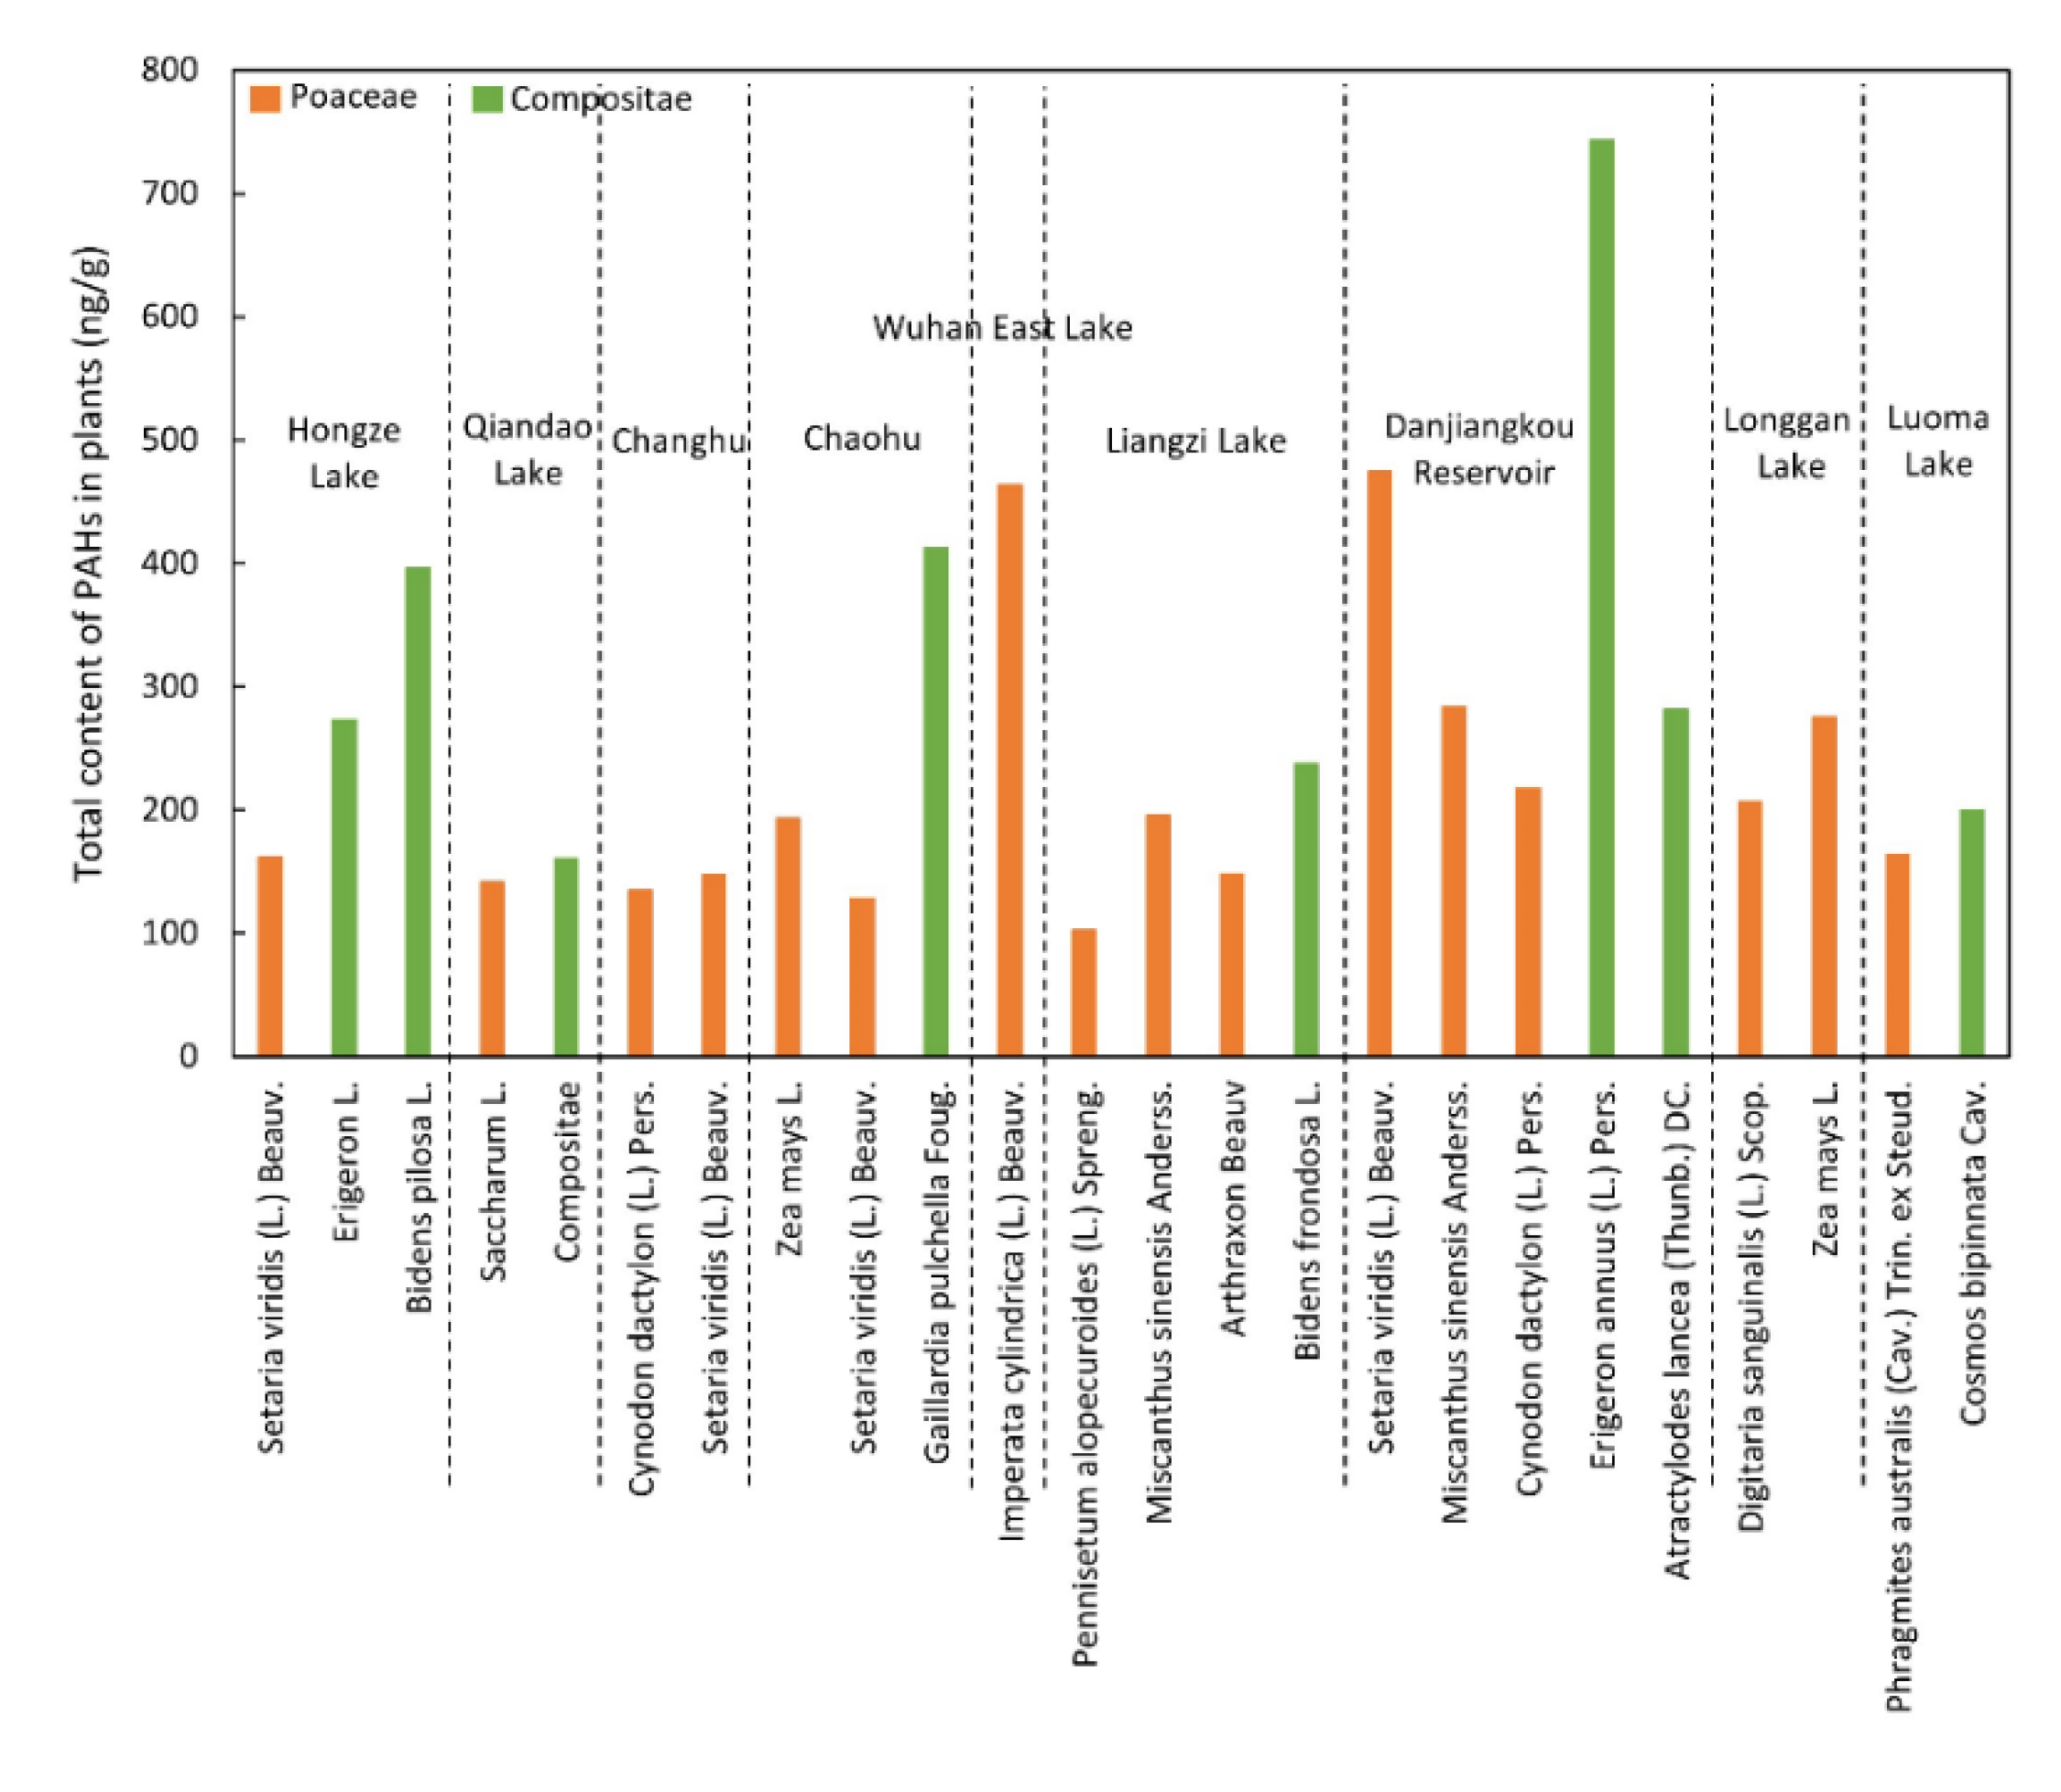
Gramineae (n = 16) and Compositae (n = 8) plants with larger sample sizes were selected to compare the PAH contents in samples of the same family from different regions (Figure 5). The highest contents of PAHs in Gramineae and Compositae appeared in plants near the Danjiangkou Reservoir. Within Poaceae, the PAH content of Imperata cylindrica (L.) Beauv. near Wuhan East Lake was also high. The PAH contents of plants near lakes were all in the range of 100–200 ng/g and showed no obvious differences, except for plants from Wuhan East Lake, Danjiangkou Reservoir, and Longgan Lake. The difference in PAH content of Compositae from different regions was larger than that of Gramineae and ranged from 161 to 743 ng/g.
The 16 PAHs in plants were dominated by Phe (40.2%), followed by Fla, Nap, and Flu, similar to the distribution of PAHs in the soil. DahA, Ace, and BaP accounted for relatively low proportions (all less than 1%) (Figure 6). Low-molecular-weight PAHs accounted for the highest proportion (79.2%), followed by medium-molecular-weight PAHs. High-molecular-weight PAHs accounted for the least proportion, which is consistent with composition of the soil.
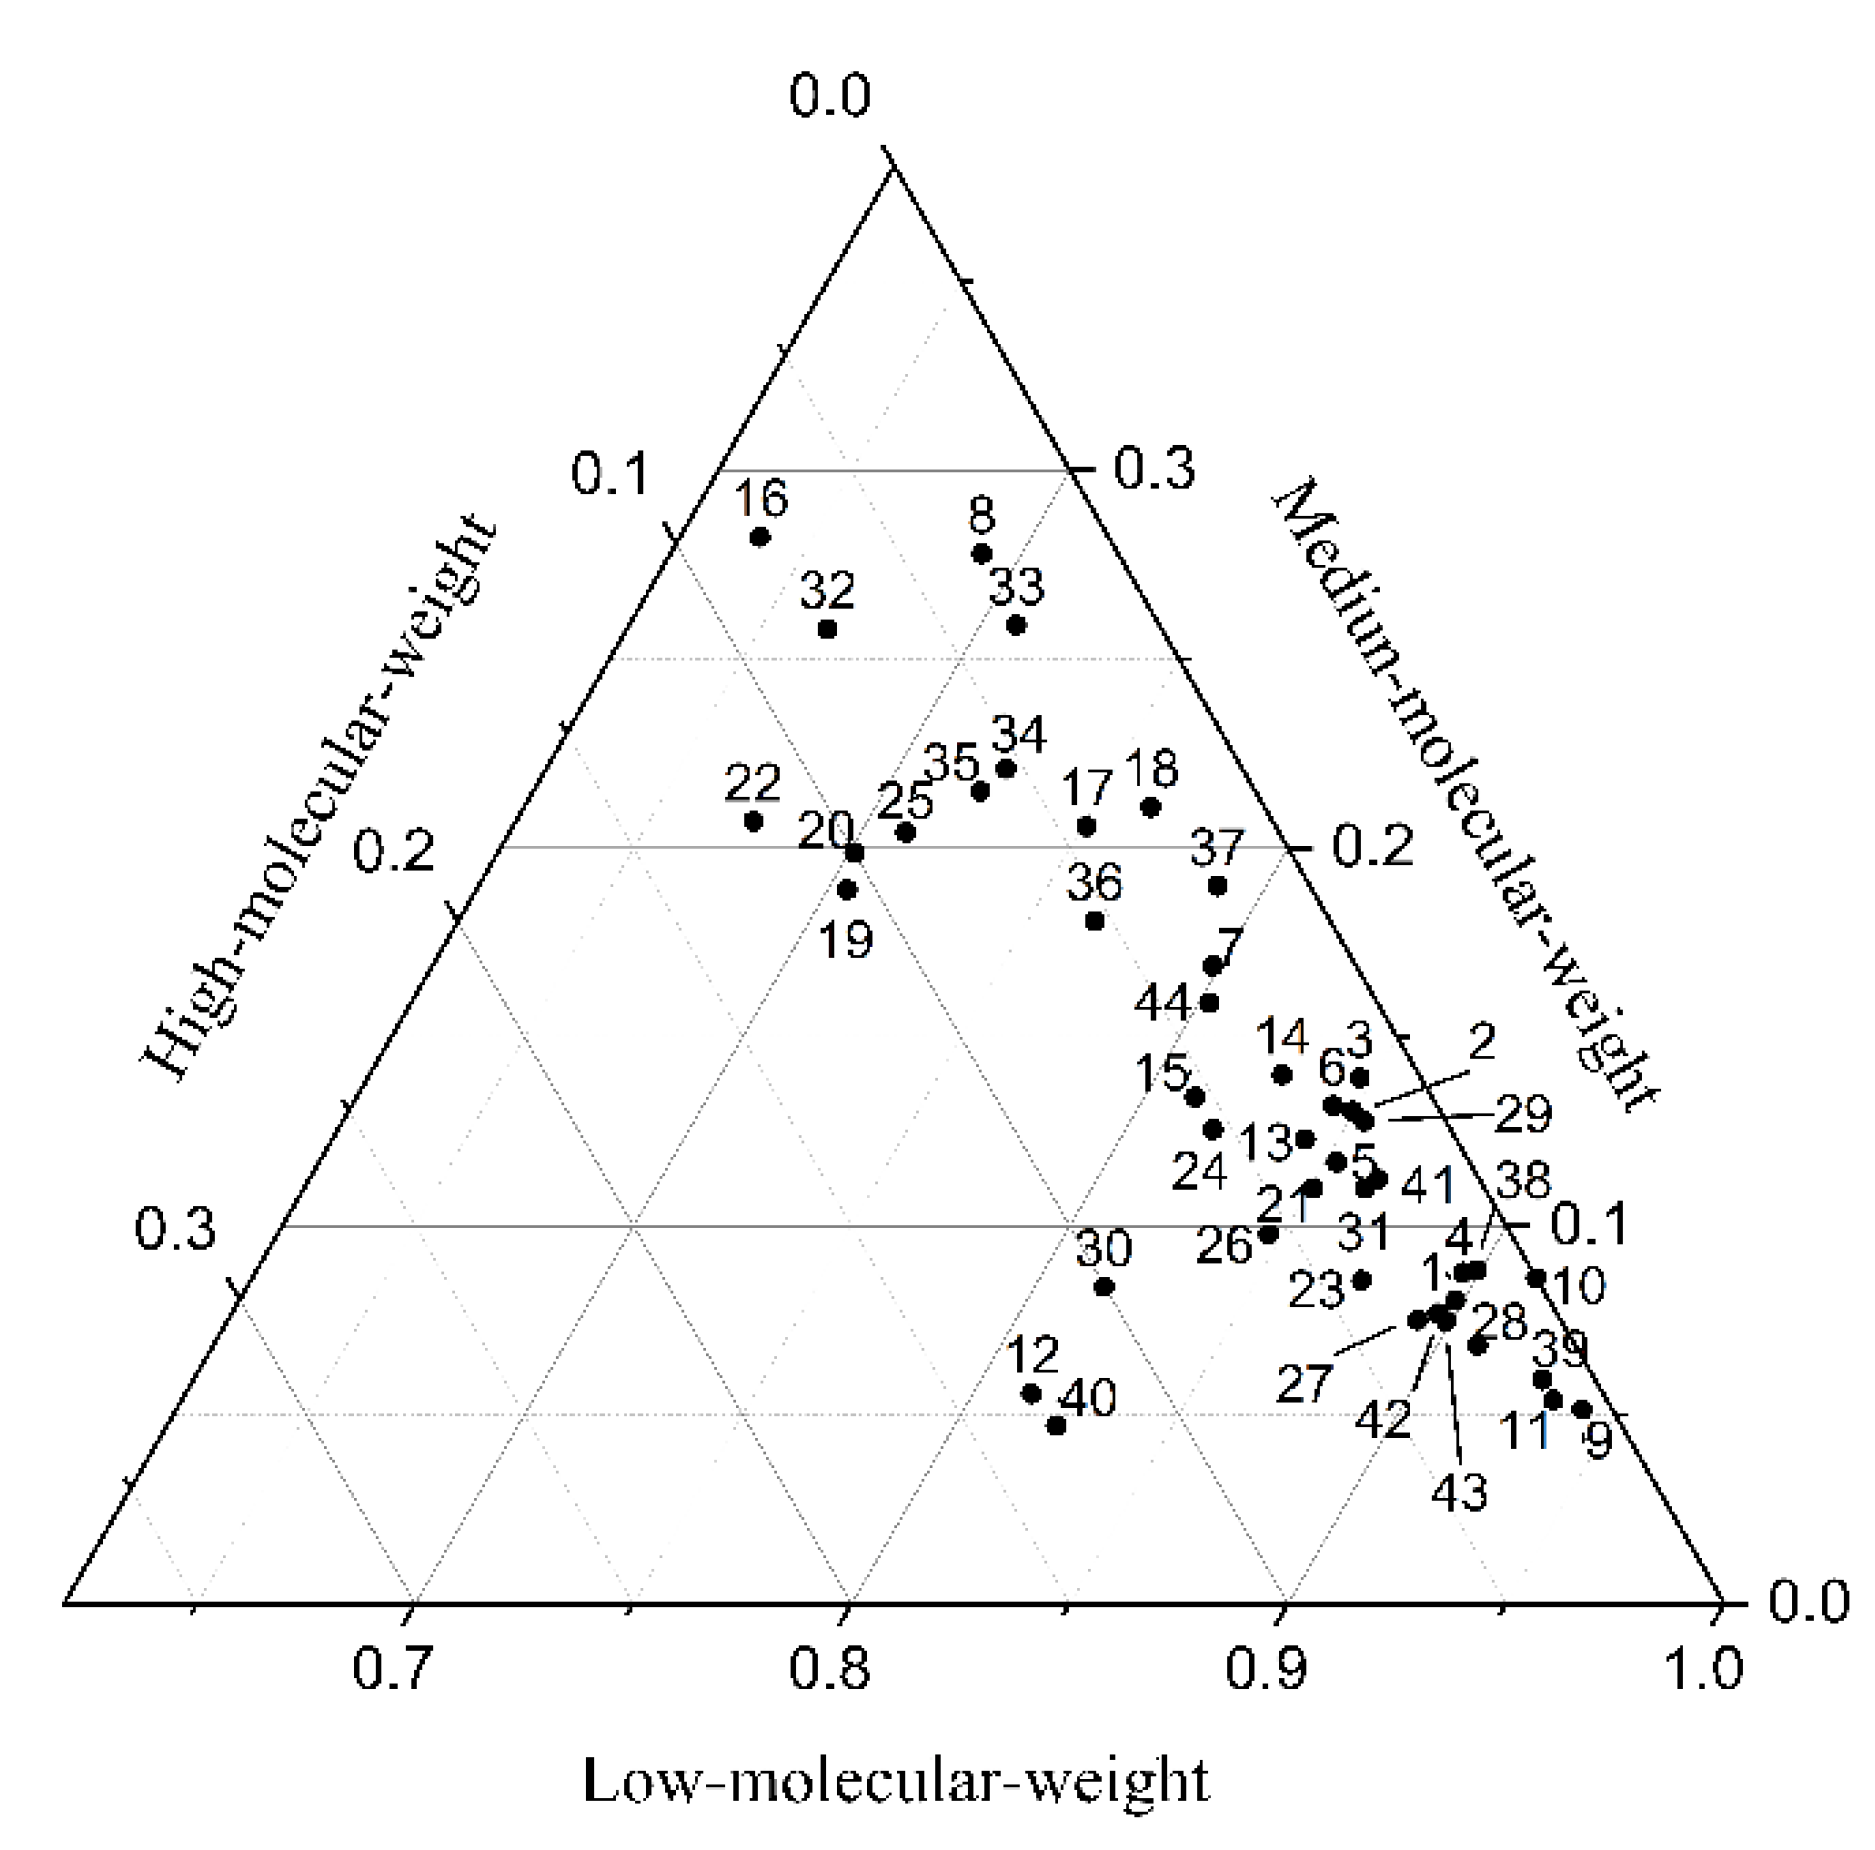
In different plant species, the compositions of PAHs were dominated by low-molecular-weight PAHs, the proportion of which was more than 60%. The proportion of high-molecular-weight PAHs was the lowest, all below 15%, and the proportion of medium-molecular-weight PAHs was below 30%. Except for the four plant samples, the proportion of medium-molecular-weight PAHs in the remaining plants was below 25% (Figure 7). In general, low-molecular-weight PAHs are dominant in different plants, followed by medium-molecular-weight PAHs. High-molecular-weight PAHs accounted for the least proportion. None of the high-molecular-weight PAHs in Compositae plants near Qiandao Lake (plant No. 10) reached the detection limit.

3.4. Possible sources of PAHs in soil and plants

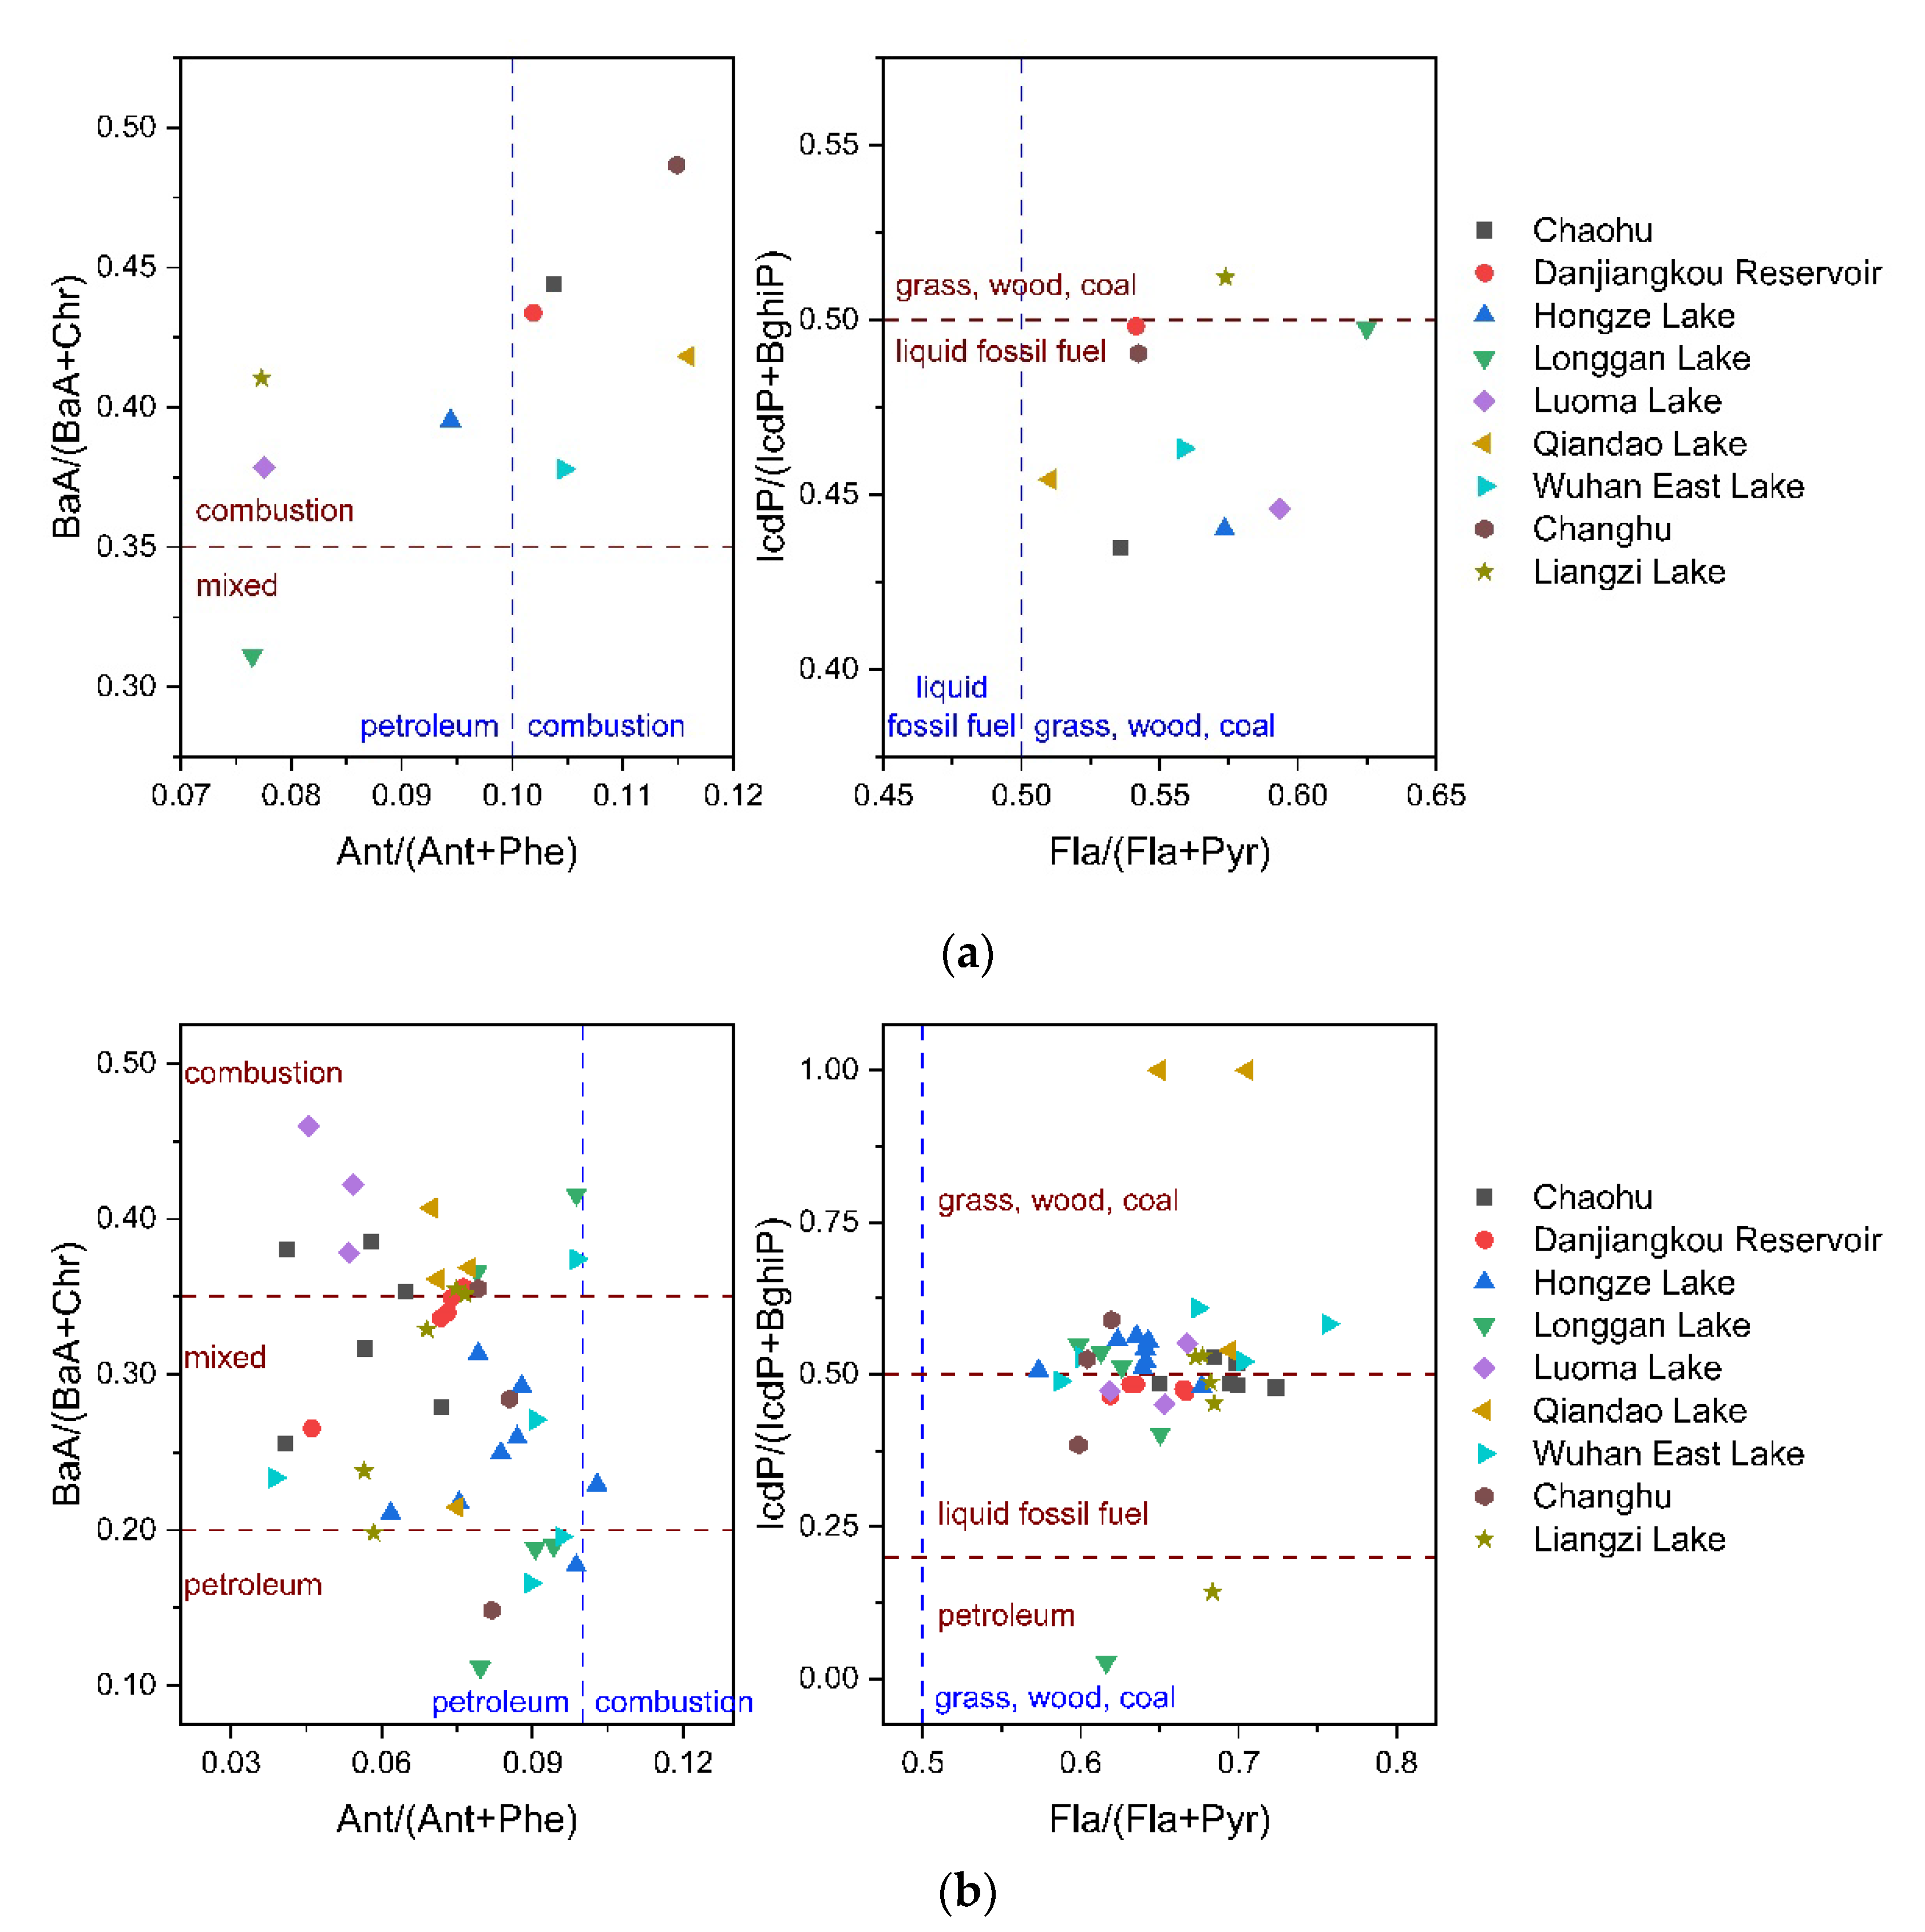
PAHs are always emitted as mixtures, and different emission processes result in different compositions of PAHs. The diagnostic ratios of PAHs are widely used to identify potential sources of PAHs [30,31]. In this study, four diagnostic ratios, Ant/(Ant+Phe), BaA/(BaA+Chr), Fla/(Fla+Pyr) and IcdP/(IcdP+BghiP), were selected for source identification of PAHs. Typical values for the four diagnostic ratios are shown in Table 2.
The diagnostic ratios of PAHs in the samples are shown in Figure 8. 5 soil samples were found with the ratio of Ant/(Ant+Phe) > 0.1, suggesting the combustion source of PAHs, while the values of BaA/(BaA+Chr) showed that the PAHs in the soil samples were all from combustion sources except the PAHs in the soil sample near Longgan Lake. All soil samples were found with Fla/(Fla+Pyr) values > 0.5, indicating combustion sources of grass, wood and coal. However, the ratios of IcdP/(IcdP+BghiP) suggested that only the PAHs in the soil sample near Liangzi Lake came from the combustion of grass, wood and coal, while the PAHs in the other samples came from the combustion of liquid fossil fuels. In general, PAHs in soil samples were mainly from combustion sources.
For plant samples, almost all samples (97.7%) were found with Ant/(Ant+Phe) values < 0.1, suggesting petroleum sources, while the ratios of BaA/(BaA+Chr) showed that only 18.6% of samples were associated with petroleum sources. 100% of samples were found with Fla/(Fla+Pyr) > 0.5, 55.8% of samples were found with IcdP/(IcdP+BghiP) > 0.5, indicating the combustion of grass, wood and coal.
To further investigate the possible sources of PAHs in plant samples, principal component analysis (PCA) was performed. Four principal components PC 1, PC 2, PC 3 and PC 4 with eigenvalue >1 were extracted and explained 52.5%, 14.8%, 9.62% and 7.19% (84.1% in total) of the total variance, respectively (Table 3). PC 1 was characterized by PAHs with four and five rings, indicating the contribution of coal and liquid fossil fuel. Pyr, Chr, BaA and BaP are markers of coal combustion [32,33]. BkF and BbF can be produced in diesel combustion [34]. PC 2 was loaded by Flu, Ace and DahA. Low-molecular-weight PAHs are the main PAHs emitted from coke ovens [35]. High-molecular-weight PAHs can be produced by lubricating oil combustion or industrial production [4]. Therefore, PC 2 represented the source of industrial processes. PC 1 and PC 2 together explained 67.3% of the total variance. Figure 9 shows the scores of PC1 and PC2 for all plant samples. PC 1 showed that the sources of PAHs in plants near Danjiangkou Reservoir and Wuhan East Lake were slightly different from those in plants near other lakes. However, in general, high similarity was found in scores for plant samples near different lakes, indicating similarity in the sources of PAHs.

3.5. Relationship between the Distribution and Composition of PAHs in Soil and Plants

3.5.1. Correlation between the distribution of PAHs in soil and plants

The PAH contents in 44 plant samples and the soil in which they grew were obtained. At a single location, the PAH monomers that were higher in the soil were generally higher in the plants (Figure S4). The Spearman’s rank correlation coefficient test showed that there was a significant correlation between the PAH monomer content of most plants and that of soil at the same location (Figure S5, Table S7). Therefore, the distribution of different PAH monomers may have similar trends in both soil and plants.
The correlation between the PAH contents of soil and plants was analyzed using the Spearman′s rank correlation coefficient. The results showed that there was no significant correlation between the total content of PAHs in soil and plants, and the same was true for the contents of high- medium-, and low-molecular-weight PAHs. Among the 16 PAH monomers, only Ace, Ant, BkF, BbF, and DahA showed significant correlations between the soil and plant samples (Table 4). The reason for the poor correlations may be the influence of plant species. Different plant species may have different PAH absorption and transformation processes. Plants also synthesize small amounts of endogenous PAHs, which may cause insignificant results.

3.5.2. Accumulation of PAHs in Plants

The plant concentration factor (PCF) was calculated by dividing the concentration of PAHs in plants by the concentration of PAHs in soil to characterize the accumulation of PAHs in plants. According to the PCF values, two species of Compositae, Bidens pilosa L. and Gaillardia pulchella Foug., showed relatively strong accumulation ability of Chr and Any, respectively. The Zea mays L. (corn) near Longgan Lake was found with a relatively higher PCF value of BghiP, but the corn near Chaohu did not show this characteristic. The PCF values of the four plants are shown in Table 5.

3.5.3. Effects of Physicochemical Properties on the Distribution of PAHs in Soil and Plants

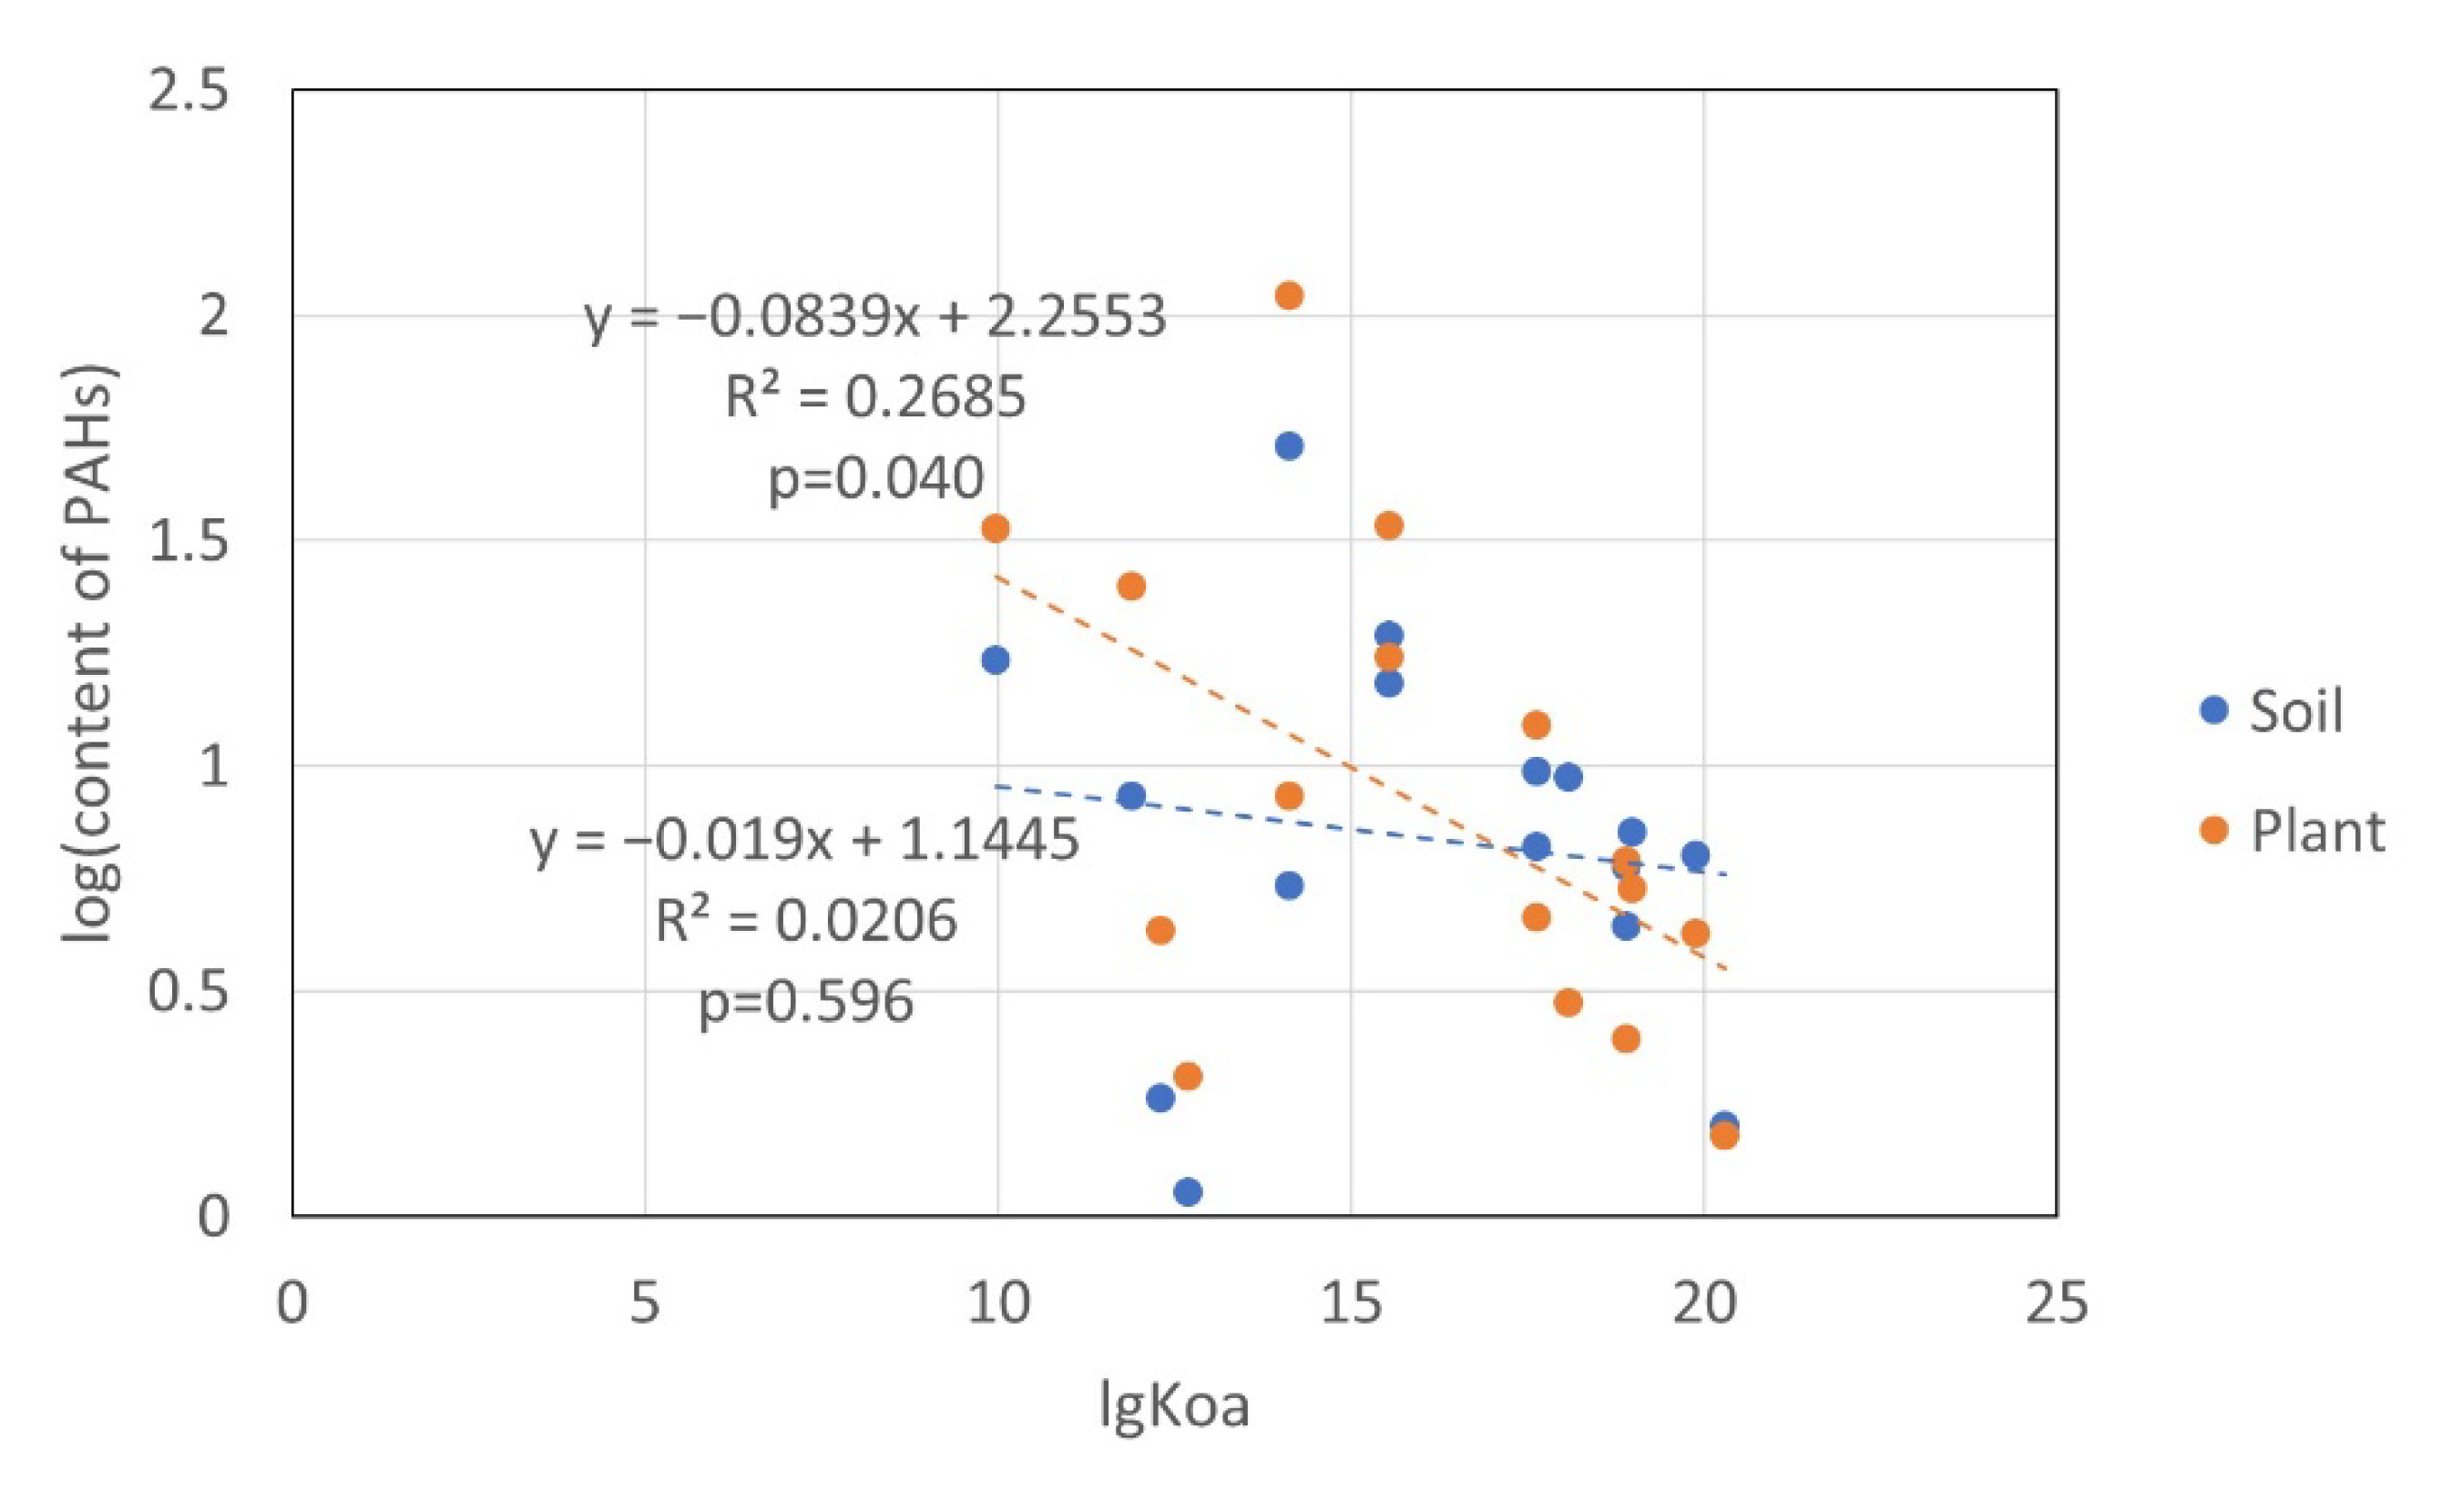
The physical and chemical properties of PAHs affect their environmental distribution. In this study, correlations between the PAH monomer contents in soil and plants and their octanol-water partition coefficients (Kow) and octanol-gas partition coefficients (Koa) were analyzed. The Pearson’s correlation coefficient was used to measure the correlation. There was no significant correlation between the PAH monomer content (logarithmic value) and lgKow values in either soil or plants. The PAH monomer content of plants (logarithmic value) had a significant negative correlation with lgKoa; that is, high-molecular-weight PAHs with higher lgKoa values were less abundant in plants. However, there was no significant correlation between the PAH monomer content (logarithmic value) and lgKoa values in soil (Table 6). The linear fit between the PAH monomer content in plants (logarithmic value) and lgKoa was stronger than that of soil (R2plant = 0.2685 > R2soil = 0.0206), indicating that the correlation between Koa and the PAH content in plants was stronger (Figure 10). Plants contain lipids, which may lead to a significant correlation between the content of PAHs in plants and Koa, whereas the content of PAHs in soil had no significant correlation with Koa. There is no significant correlation between the PAH monomer content in plants and their Kow, possibly because the mechanism by which plants absorb PAHs from soil was complex, not just distribution.

4. Discussion

The contents of 16 PAHs in the samples were determined. The highest concentrations of Phe were found in soil and plants. On the one hand, Phe is the second most emitted PAH in China, after Nap [36]. On the other hand, medium to low volatility atmospheric PAHs are more prone to wet and dry deposition [37], so Phe with lower volatility is more likely to enter soil and plants than Nap. For PAHs in soil, Phe is also dominant in rural soils in China [38] and in soils near Qinghai Lake [39]. In urban soils in China [31], soils of the Yangtze River Delta [40] and soils of the Yinma River Basin [41], the content of Phe is not the highest, but it still ranks in the forefront. For PAHs in plants, the dorminance of Phe has also been found in other studies [42,43].
The PAHs content in the soil near Qiandao Lake was the highest among the 9 soil samples, which may be caused by the proximity of Qiandao Lake to the main traffic road. The diagnostic ratio BaA/(BaA+Chr) of the soil sample near Qiandao Lake was above 0.35, indicating the source of vehicular emission of PAHs [44]. Liyang-Ningde Expressway and Shanghai-Jiaxing-Huzhou Interprovincial Expressway both pass near Qiandao Lake, and vehicle exhaust emissions may lead to the accumulation of PAHs [45]. Higher traffic volume can cause higher PAH contents in roadside soils [46]. The PAH contents in soil decrease with increasing distance from the road, but significant concentrations still can be found [47].
Sources of PAHs in the samples were identified using diagnostic ratios. The results of the four diagnostic ratios were inconsistent, which was also reported in other studies [31,48,49]. It may be due to the different degradation rates of PAHs during transport processes [50]. The air concentrations and molecular ratios of PAHs will change as the distance from the source increases [51]. Oxidation and biodegradation processes in the soil can also lead to changes in diagnostic rates [52]. Furthermore, considering that the accumulation of PAHs in plants can lead to changes in diagnostic ratios, caution is required when using diagnostic ratios in plants [53,54]. For these reasons, some authors have criticized the unquestioning application of PAH diagnosis ratios [55,56]. To further investigate the source of PAHs, PCA analysis was performed on plant samples. Figure 9 shows that spatial location had little effect on sources of PAHs in plants, indicating the effect of plant species on PAHs accumulation. However, PCA analysis was not available for PAHs in soil in our study due to the small amount of soil samples (n < 16). Compound-specific isotope analysis is another method for PAH source identification [57,58]. It can avoid the adverse effects of the selective degradation of PAHs, but suffers from overlapping of end-members for several sources [59]. The combined application of different methods will provide more valuable information on the sources of PAHs.
Phytoextraction is one of the main approaches for the removal of organic compounds from contaminated soils [60]. BCF values indicated the potential of Bidens pilosa L. and Gaillardia pulchella Foug in the Compositae family and cron in the Poaceae family for phytoremediation. The corn near Longgan Lake showed a relatively strong accumulation of BghiP, which is consistent with the study on corn in Changchun, China [61]. However, this accumulation characteristic was not reflected in corn near Chaohu, nor in corn grown in soil treated with sewage sludge [62]. The presence of other plants at the site may affect the accumulation of PAHs in the target plants [63]. Soil characteristics and the presence of other contaminants can also affect the uptake [64,65]. In addition to absorbing PAHs from the soil, corn can also absorb PAHs from the atmosphere through leaves [66], which may also contribute to differences in PCF values at different locations. More research is needed to determine the practicability of the three plants for phytoremediation. The tolerance of plants to PAHs pollution also needs to be considered when applied to remediation.

5. Conclusions

Plants can absorb PAHs from various aspects of the environment, such as the atmosphere, water, and soil. In this study, GC-MS was used to determine the contents of 16 priority PAHs in soil and typical plants near nine major lakes in eastern China to explore the distribution and correlation of PAHs in soil and plants.
The average total PAH content of the soil samples was 190.35 ng/g, and the concentration range was 99.17–552.10 ng/g. The content of PAHs in plants was higher than that in soil, with an average total content of 274.66 ng/g and a concentration range of 122.93–743.44 ng/g. In terms of composition, the PAHs in soil were dominated by medium- and low-molecular-weight PAHs, whereas the PAHs in plants were dominated by low-molecular-weight PAHs. Diagnostic ratios and PCA identified combustion source as the main source of PAHs in soil and plants.
The PAH monomer content of plants was negatively correlated with their physicochemical properties, Koa. Correlation analysis indicated that the correlation between PAH contents in plants and soil was weak. This may be caused by the selective accumulation of plants. PCF values showed Bidens pilosa L. and Gaillardia pulchella Foug in the Compositae family and cron in the Poaceae family with a relatively stronger accumulation of PAHs, indicating their potential for phytoremediation. Our work complements studies on PAH pollution in soil and plants and presents new possibilities for species used for phytoremediation.

Supplementary Materials

The following supporting information can be downloaded at: https://www.mdpi.com/article/10.3390/toxics10100577/s1, Table S1: Detailed information about the 9 major lakes from eastern China; Figure S1: Chromatograms of a standard solution (1000ng/mL) of 16 PAHs; Table S2: Recoveries of 16 PAHs in soil and plants; Figure S2: Frequency distribution histogram of PAHs in soil before (a) and after (b) logarithmic transformation; Table S3: Skewness, kurtosis and normal distribution test results of PAHs in soil before and after logarithmic transformation; Figure S3: Frequency distribution histogram of PAHs in plants before (a) and after (b) logarithmic transformation; Table S4: Skewness, kurtosis and normal distribution test results of PAHs in plants before and after logarithmic transformation; Table S5: Contents of PAHs in soil near each lake (ng/g); Table S6: Contents of PAHs in plants near each lake (ng/g); Figure S4: Contents of PAH monomers in soil and plants near different lakes; Figure S5: Correlation of PAH contents in soil and plants near different lakes; Table S7: Correlation coefficient, p, linear fitting function and R2 of PAH monomer contents in soil and plants in different lake areas.

Author Contributions

Conceptualization, Z.Z., W.H., R.W. and F.X.; methodology, Z.Z., W.H., R.W. and F.X.; validation, Z.Z., W.H. and R.W.; formal analysis, Z.Z.; investigation, Z.Z.; resources, F.X.; writing—original draft preparation, Z.Z.; writing—review and editing, W.H., R.W. and F.X.; supervision, F.X.; project administration, Z.Z., W.H., R.W. and F.X.; funding acquisition, F.X. All authors have read and agreed to the published version of the manuscript.

Funding

This research was funded by the National Natural Science Foundation of China, grant number 41977312.

Institutional Review Board Statement

Not applicable.

Informed Consent Statement

Not applicable.

Data Availability Statement

Not applicable.

Conflicts of Interest

The authors declare no conflict of interest.

References

  1. Mastral, A.M.; Callén, M.S. A Review on Polycyclic Aromatic Hydrocarbon (PAH) Emissions from Energy Generation. Environ. Sci. Technol. 2000, 34, 3051–3057. [Google Scholar] [CrossRef]
  2. Luo, J.; Han, Y.; Zhao, Y.; Huang, Y.; Liu, X.; Tao, S.; Liu, J.; Huang, T.; Wang, L.; Chen, K.; et al. Effect of northern boreal forest fires on PAH fluctuations across the arctic. Environ. Pollut. 2020, 261, 114186. [Google Scholar] [CrossRef] [PubMed]
  3. Barroso, P.M.; Winkler, J.; Oulehla, J.; Vaverková, M.D. Effect of Application of Soil Amendments on the PAHs Level in the Fire-Affected Forest Soil. J. Ecol. Eng. 2022, 23, 26–38. [Google Scholar] [CrossRef]
  4. Ravindra, K.; Sokhi, R.; van Grieken, R. Atmospheric polycyclic aromatic hydrocarbons: Source attribution, emission factors and regulation. Atmos. Environ. 2008, 42, 2895–2921. [Google Scholar] [CrossRef]
  5. Mohammed, M.O.A.; Song, W.W.; Ma, Y.L.; Liu, L.Y.; Ma, W.L.; Li, W.L.; Li, Y.F.; Wang, F.Y.; Qi, M.Y.; Lv, N.; et al. Distribution patterns, infiltration and health risk assessment of PM2.5-bound PAHs in indoor and outdoor air in cold zone. Chemosphere 2016, 155, 70–85. [Google Scholar] [CrossRef] [PubMed]
  6. Larsen, R.K.; Baker, J.E. Source Apportionment of Polycyclic Aromatic Hydrocarbons in the Urban Atmosphere:  A Comparison of Three Methods. Environ. Sci. Technol. 2003, 37, 1873–1881. [Google Scholar] [CrossRef] [PubMed]
  7. Eze, M.O.; George, S.C. The Potential of Oxygenates to Increase the Risk of Exposure to Polycyclic Aromatic Hydrocarbons through Groundwater Contamination. Water 2022, 14, 739. [Google Scholar] [CrossRef]
  8. Qian, W.; Dequan, L.; Yiran, X.; Fei, P.; Juan-Ying, L.; Feng, W.; Yanping, C.; Ruihua, S.; Siquan, T. Occurrence of polycyclic aromatic hydrocarbons (PAHs) in the seafood from an important fishing area in the East China Sea and a comparison between seafood from different origins. Environ. Monit. Assess. 2022, 194, 528. [Google Scholar] [CrossRef]
  9. Wentao, W.; Simonich, S.L.M.; Xue, M.; Zhao, J.; Zhang, N.; Wang, R.; Cao, J.; Tao, S. Concentrations, sources and spatial distribution of polycyclic aromatic hydrocarbons in soils from Beijing, Tianjin and surrounding areas, north China. Environ. Pollut. 2010, 158, 1245–1251. [Google Scholar]
  10. Khan, S.; Aijun, L.; Zhang, S.; Hu, Q.; Zhu, Y.G. Accumulation of polycyclic aromatic hydrocarbons and heavy metals in lettuce grown in the soils contaminated with long-term wastewater irrigation. J. Hazard. Mater. 2008, 152, 506–515. [Google Scholar] [CrossRef]
  11. Cristaldi, A.; Conti, G.O.; Jho, E.H.; Zuccarello, P.; Grasso, A.; Copat, C.; Ferrante, M. Phytoremediation of contaminated soils by heavy metals and PAHs. A brief review. Environ. Technol. Innov. 2017, 8, 309–326. [Google Scholar] [CrossRef]
  12. Ma, X.; Li, X.; Liu, J.; Cheng, Y.; Zhai, F.; Sun, Z.; Han, L. Enhancing Salix viminalis L.–mediated phytoremediation of polycyclic aromatic hydrocarbon–contaminated soil by inoculation with Crucibulum laeve (white-rot fungus). Environ. Sci. Pollut. Res. Int. 2020, 27, 41326–41341. [Google Scholar] [CrossRef] [PubMed]
  13. Johnsen, A.R.; Karlson, U. Diffuse PAH contamination of surface soils: Environmental occurrence, bioavailability, and microbial degradation. Appl. Microbiol. Biotechnol. 2007, 76, 533–543. [Google Scholar] [CrossRef]
  14. Wild, E.; Dent, J.; Thomas, G.O.; Jones, K.C. Visualizing the Air-To-Leaf Transfer and Within-Leaf Movement and Distribution of Phenanthrene:  Further Studies Utilizing Two-Photon Excitation Microscopy. Environ. Sci. Technol. 2006, 40, 907–916. [Google Scholar] [CrossRef]
  15. Holoubek, I.; Kořínek, P.; Šeda, Z.; Schneiderová, E.; Holoubková, I.; Pacl, A.; Tříska, J.; Cudlın, P.; Čáslavský, J. The use of mosses and pine needles to detect persistent organic pollutants at local and regional scales. Environ. Pollut. 2000, 109, 283–292. [Google Scholar] [CrossRef]
  16. Pokhrel, B.; Gong, P.; Wang, X.; Chen, M.; Wang, C.; Gao, S. Distribution, sources, and air–soil exchange of OCPs, PCBs and PAHs in urban soils of Nepal. Chemosphere 2018, 200, 532–541. [Google Scholar] [CrossRef] [PubMed]
  17. Apiratikul, R.; Pongpiachan, S.; Deelaman, W. Spatial distribution, sources and quantitative human health risk assessments of polycyclic aromatic hydrocarbons in urban and suburban soils of Chile. Environ. Geochem. Health 2021, 43, 2851–2870. [Google Scholar] [CrossRef]
  18. Akporhonor, E.E.; Emoyan, O.O.; Agbaire, P.O. Concentrations, origin, and human health risk of polycyclic aromatic hydrocarbons in anthropogenic impacted soils of the Niger Delta, Nigeria. Environ. Forensics 2022, 23, 127–140. [Google Scholar] [CrossRef]
  19. Xu, Z.; Wang, C.; Li, H.; Xu, S.; Du, J.; Chen, Y.; Ma, C.; Tang, J. Concentration, distribution, source apportionment, and risk assessment of surrounding soil PAHs in industrial and rural areas: A comparative study. Ecol. Indic. 2021, 125, 107513. [Google Scholar] [CrossRef]
  20. Peng, J.; Chen, Y.; Xia, Q.; Rong, G.; Zhang, J. Ecological risk and early warning of soil compound pollutants (HMs, PAHs, PCBs and OCPs) in an industrial city, Changchun, China. Environ. Pollut. 2021, 272, 116038. [Google Scholar] [CrossRef]
  21. Zhang, J.; Yuan, J.; Wang, Q.; Wang, J.; Liu, W.; Luo, Y.; Christie, P. Enhanced bioremediation of PAH-contaminated soil by wheat bran and microbial community response. Arch. Für Acker- Und Pflanzenbau Und Bodenkd. 2020, 66, 1089–1102. [Google Scholar] [CrossRef]
  22. Li, N.; Liu, R.; Chen, J.; Wang, J.; Hou, L.; Zhou, Y. Enhanced phytoremediation of PAHs and cadmium contaminated soils by a Mycobacterium. Sci. Total Environ. 2021, 754, 141198. [Google Scholar] [CrossRef] [PubMed]
  23. Kipopoulou, A.M.; Manoli, E.; Samara, C. Bioconcentration of polycyclic aromatic hydrocarbons in vegetables grown in an industrial area. Environ. Pollut. 1999, 106, 369–380. [Google Scholar] [CrossRef]
  24. Parrish, Z.D.; White, J.C.; Isleyen, M.; Gent, M.P.; Iannucci-Berger, W.; Eitzer, B.D.; Kelsey, J.W.; Mattina, M.I. Accumulation of weathered polycyclic aromatic hydrocarbons (PAHs) by plant and earthworm species. Chemosphere 2006, 64, 609–618. [Google Scholar] [CrossRef]
  25. Xiao, N.; Liu, R.; Jin, C.; Dai, Y. Efficiency of five ornamental plant species in the phytoremediation of polycyclic aromatic hydrocarbon (PAH)-contaminated soil. Ecol. Eng. 2015, 75, 384–391. [Google Scholar] [CrossRef]
  26. Song, X.; Li, C.; Chen, W. Phytoremediation potential of Bermuda grass (Cynodon dactylon (L.) pers.) in soils co-contaminated with polycyclic aromatic hydrocarbons and cadmium. Ecotoxicol. Environ. Saf. 2022, 234, 113389. [Google Scholar] [CrossRef] [PubMed]
  27. Ali, N.; Dashti, N.; Khanafer, M.; Al-Awadhi, H.; Radwan, S. Bioremediation of soils saturated with spilled crude oil. Sci. Rep. 2020, 10, 1116–1119. [Google Scholar] [CrossRef]
  28. Qi, P.; Qu, C.; Albanese, S.; Lima, A.; Cicchella, D.; Hope, D.; Cerino, P.; Pizzolante, A.; Zheng, H.; Li, J. Investigation of polycyclic aromatic hydrocarbons in soils from Caserta provincial territory, southern Italy: Spatial distribution, source apportionment, and risk assessment. J. Hazard. Mater. 2020, 383, 121158. [Google Scholar] [CrossRef]
  29. Liao, Q.; Liu, H.; Lu, C.; Liu, J.; Waigi, M.G.; Ling, W. Root exudates enhance the PAH degradation and degrading gene abundance in soils. Sci. Total Environ. 2021, 764, 144436. [Google Scholar] [CrossRef]
  30. Liu, Y.; Gao, P.; Su, J.; da Silva, E.B.; de Oliveira, L.M. PAHs in urban soils of two Florida cities: Background concentrations, distribution, and sources. Chemosphere 2019, 214, 220–227. [Google Scholar] [CrossRef]
  31. Wang, H.; Yang, Y.; Walker, T.R.; Wang, Y.; Wu, H.; Wang, X.; Luo, Q. Characterization, source apportionment, and risk assessment of polycyclic aromatic hydrocarbons (PAHs) in urban soils from 23 cities in China. Environ. Sci. Pollut. Res. Int. 2022, 29, 73401–73413. [Google Scholar] [CrossRef] [PubMed]
  32. Jiang, Y.; Hu, X.; Yves, U.J.; Zhan, H.; Wu, Y. Status, source and health risk assessment of polycyclic aromatic hydrocarbons in street dust of an industrial city, NW China. Ecotoxicol. Environ. Saf. 2014, 106, 11–18. [Google Scholar] [CrossRef] [PubMed]
  33. He, Y.; He, W.; Yang, C.; Liu, W.; Xu, F. Spatiotemporal toxicity assessment of suspended particulate matter (SPM)–bound polycyclic aromatic hydrocarbons (PAHs) in Lake Chaohu, China: Application of a source-based quantitative method. Sci. Total Environ. 2020, 727, 138690. [Google Scholar] [CrossRef] [PubMed]
  34. Gao, P.; Liu, S.; Feng, Y.; Lin, N.; Lu, B.; Zhang, Z.; Cui, F.; Xing, B.; Hammond, S.K. Concentrations of polycyclic aromatic hydrocarbons in resuspendable fraction of settled bus dust and its implications for human exposure. Environ. Pollut. 2015, 198, 1–7. [Google Scholar] [CrossRef]
  35. Khalili, N.R.; Scheff, P.A.; Holsen, T.M. PAH source fingerprints for coke ovens, diesel and, gasoline engines, highway tunnels, and wood combustion emissions. Atmos. Environ. 1995, 29, 533–542. [Google Scholar] [CrossRef]
  36. Wang, T.; Li, B.; Liao, H.; Li, Y. Spatiotemporal distribution of atmospheric polycyclic aromatic hydrocarbon emissions during 2013–2017 in mainland China. Sci. Total Environ. 2021, 789, 148003. [Google Scholar] [CrossRef] [PubMed]
  37. Kaya, E.; Dumanoglu, Y.; Kara, M.; Altiok, H.; Bayram, A.; Elbir, T.; Odabasi, M. Spatial and temporal variation and air–soil exchange of atmospheric PAHs and PCBs in an industrial region. Atmos. Pollut. Res. 2012, 3, 435–449. [Google Scholar] [CrossRef]
  38. Musa Bandowe, B.A.; Wei, C.; Han, Y.; Cao, J.; Zhan, C.; Wilcke, W. Polycyclic aromatic compounds (PAHs, oxygenated PAHs, nitrated PAHs and azaarenes) in soils from China and their relationship with geographic location, land use and soil carbon fractions. Sci. Total Environ. 2019, 690, 1268–1276. [Google Scholar] [CrossRef]
  39. Zhang, Z.; Zhu, Y.; Shao, T.; Wang, R.; Chen, Z.; Wei, P.; Xu, Z.; Li, D.; Fu, L.; Wang, F. A Study on PAHs in the surface soil of the region around Qinghai Lake in the Tibet plateau: Evaluation of distribution characteristics, sources and ecological risks. Environ. Res. Commun. 2021, 3, 041005. [Google Scholar] [CrossRef]
  40. Ping, L.F.; Luo, Y.M.; Zhang, H.B.; Li, Q.B.; Wu, L.H. Distribution of polycyclic aromatic hydrocarbons in thirty typical soil profiles in the Yangtze River Delta region, east China. Environ. Pollut. 2007, 147, 358–365. [Google Scholar] [CrossRef]
  41. Chen, Y.; Zhang, J.; Zhang, F.; Liu, X.; Zhou, M. Contamination and health risk assessment of PAHs in farmland soils of the Yinma River Basin, China. Ecotoxicol. Environ. Saf. 2018, 156, 383–390. [Google Scholar] [CrossRef] [PubMed]
  42. Liang, J.; Fang, H.; Zhang, T.; Wang, X. Polycyclic aromatic hydrocarbons in the leaves of twelve plant species along an urbanization gradient in Shanghai, China. Environ. Sci. Pollut. Res. 2017, 24, 9361–9369. [Google Scholar] [CrossRef] [PubMed]
  43. Wang, Y.; He, J.; Wang, S.; Luo, C.; Yin, H.; Zhang, G. Characterisation and risk assessment of polycyclic aromatic hydrocarbons (PAHs) in soils and plants around e-waste dismantling sites in southern China. Environ. Sci. Pollut. Res. 2017, 24, 22173–22182. [Google Scholar] [CrossRef] [PubMed]
  44. Tobiszewski, M.; Namieśnik, J. PAH diagnostic ratios for the identification of pollution emission sources. Environ. Pollut. 2012, 162, 110–119. [Google Scholar] [CrossRef]
  45. Yang, J.; Sun, P.; Zhang, X.; Wei, X.Y.; Huang, Y.P.; Du, W.N.; Qadeer, A.; Liu, M. Source apportionment of PAHs in roadside agricultural soils of a megacity using positive matrix factorization receptor model and compound-specific carbon isotope analysis. J. Hazard. Mater. 2021, 403, 123592. [Google Scholar] [CrossRef]
  46. Kim, S.-J.; Park, M.K.; Lee, S.E.; Go, H.J.; Cho, B.C.; Lee, Y.S.; Choi, S.D. Impact of traffic volumes on levels, patterns, and toxicity of polycyclic aromatic hydrocarbons in roadside soils. Environ. Sci. Processes Impacts 2019, 21, 174–182. [Google Scholar] [CrossRef]
  47. Kumar, V.; Kothiyal, N.C. Distribution behavior and carcinogenic level of some polycyclic aromatic hydrocarbons in roadside soil at major traffic intercepts within a developing city of India. Environ. Monit. Assess. 2012, 184, 6239–6252. [Google Scholar] [CrossRef]
  48. Sun, Y.; Sun, G.; Zhou, Q.; Xu, Y.; Wang, L.; Liang, X.; Sun, Y.; Qin, X. Polycyclic Aromatic Hydrocarbon (PAH) Contamination in the Urban Topsoils of Shenyang, China. Soil Sediment Contam. Int. J. 2012, 21, 901–917. [Google Scholar] [CrossRef]
  49. Deelaman, W.; Pongpiachan, S.; Tipmanee, D.; Choochuay, C.; Iadtem, N.; Suttinun, O.; Wang, Q.; Xing, L.; Li, G.; Han, Y.; et al. Source identification of polycyclic aromatic hydrocarbons in terrestrial soils in Chile. J. South Am. Earth Sci. 2020, 99, 102514. [Google Scholar] [CrossRef]
  50. Zhang, X.L.; Tao, S.; Liu, W.X.; Yang, Y.; Zuo, Q.; Liu, S.Z. Source Diagnostics of Polycyclic Aromatic Hydrocarbons Based on Species Ratios:  A Multimedia Approach. Environ. Sci. Technol. 2005, 39, 9109–9114. [Google Scholar] [CrossRef]
  51. Katsoyiannis, A.; Breivik, K. Model-based evaluation of the use of polycyclic aromatic hydrocarbons molecular diagnostic ratios as a source identification tool. Environ. Pollut. 2014, 184, 488–494. [Google Scholar] [CrossRef] [PubMed] [Green Version]
  52. Biache, C.; Mansuy-Huault, L.; Faure, P. Impact of oxidation and biodegradation on the most commonly used polycyclic aromatic hydrocarbon (PAH) diagnostic ratios: Implications for the source identifications. J. Hazard. Mater. 2014, 267, 31–39. [Google Scholar] [CrossRef] [PubMed]
  53. Ratola, N.; Amigo, J.M.; Lacorte, S.; Barceló, D.; Psillakis, E.; Alves, A. Comparison of PAH Levels and Sources in Pine Needles from Portugal, Spain, and Greece. Anal. Lett. 2012, 45, 508–525. [Google Scholar] [CrossRef]
  54. Fasani, D.; Fermo, P.; Barroso, P.J.; Martín, J.; Santos, J.L.; Aparicio, I.; Alonso, E. Analytical Method for Biomonitoring of PAH Using Leaves of Bitter Orange Trees (Citrus aurantium): A Case Study in South Spain. Water Air Soil Pollut. 2016, 227, 1. [Google Scholar] [CrossRef]
  55. Katsoyiannis, A.; Terzi, E.; Cai, Q.-Y. On the use of PAH molecular diagnostic ratios in sewage sludge for the understanding of the PAH sources. Is this use appropriate? Chemosphere 2007, 69, 1337–1339. [Google Scholar] [CrossRef]
  56. Lang, C.; Tao, S.; Wang, X.; Zhang, G.; Fu, J. Modeling polycyclic aromatic hydrocarbon composition profiles of sources and receptors in the Pear River Delta, China. Environ. Toxicol. Chem. Int. J. 2008, 27, 4–9. [Google Scholar] [CrossRef]
  57. Buczyńska, A.J.; Geypens, B.; Van Grieken, R.; De Wael, K. Stable carbon isotopic ratio measurement of polycyclic aromatic hydrocarbons as a tool for source identification and apportionment—A review of analytical methodologies. Talanta 2013, 105, 435–450. [Google Scholar] [CrossRef]
  58. Gao, P.; Li, H.; Wilson, C.P.; Townsend, T.G.; Xiang, P.; Liu, Y.; Ma, L.Q. Source identification of PAHs in soils based on stable carbon isotopic signatures. Crit. Rev. Environ. Sci. Technol. 2018, 48, 923–948. [Google Scholar] [CrossRef]
  59. Ya, M.; Wu, Y.; Wang, X.; Li, Y.; Su, G. The importance of compound-specific radiocarbon analysis in source identification of polycyclic aromatic hydrocarbons: A critical review. Crit. Rev. Environ. Sci. Technol. 2022, 52, 937–978. [Google Scholar] [CrossRef]
  60. Alagic, S.C.; Jovanović, V.P.S.; Mitić, V.D.; Cvetković, J.S.; Petrović, G.M.; Stojanović, G.S. Bioaccumulation of HMW PAHs in the roots of wild blackberry from the Bor region (Serbia): Phytoremediation and biomonitoring aspects. Sci. Total Environ. 2016, 562, 561–570. [Google Scholar] [CrossRef]
  61. Chen, Y.; Zhang, J.; Ma, Q.; Sun, C.; Ha, S.; Zhang, F. Human health risk assessment and source diagnosis of polycyclic aromatic hydrocarbons (PAHs) in the corn and agricultural soils along main roadside in Changchun, China. Hum. Ecol. Risk Assess. 2016, 22, 706–720. [Google Scholar] [CrossRef]
  62. Paraíba, L.C.; Queiroz, S.C.N.; Maia, A.D.H.N.; Ferracini, V.L. Bioconcentration factor estimates of polycyclic aromatic hydrocarbons in grains of corn plants cultivated in soils treated with sewage sludge. Sci. Total Environ. 2010, 408, 3270–3276. [Google Scholar] [CrossRef] [PubMed]
  63. Sojinu, O.S.; Sonibare, O.O.; Gayawan, E. Investigating Polycyclic Aromatic Hydrocarbons Profiles in Higher Plants Using Statistical Models. Int. J. Phytoremediation 2013, 15, 439–451. [Google Scholar] [CrossRef] [PubMed]
  64. Wu, F.; Tian, K.; Wang, J.; Bao, H.; Luo, W.; Zhang, H.; Hong, H. Accumulation and translocation of phenanthrene, anthracene and pyrene in winter wheat affected by soil water content. Ecotoxicol. Environ. Saf. 2019, 183, 109567. [Google Scholar] [CrossRef] [PubMed]
  65. Chen, J.; Xia, X.; Chu, S.; Wang, H.; Zhang, Z.; Xi, N.; Gan, J. Cation-π Interactions with Coexisting Heavy Metals Enhanced the Uptake and Accumulation of Polycyclic Aromatic Hydrocarbons in Spinach. Environ. Sci. Technol. 2020, 54, 7261–7270. [Google Scholar] [CrossRef]
  66. Lin, H.; Tao, S.; Zuo, Q.; Coveney, R.M. Uptake of polycyclic aromatic hydrocarbons by maize plants. Environ. Pollut. 2007, 148, 614–619. [Google Scholar] [CrossRef]
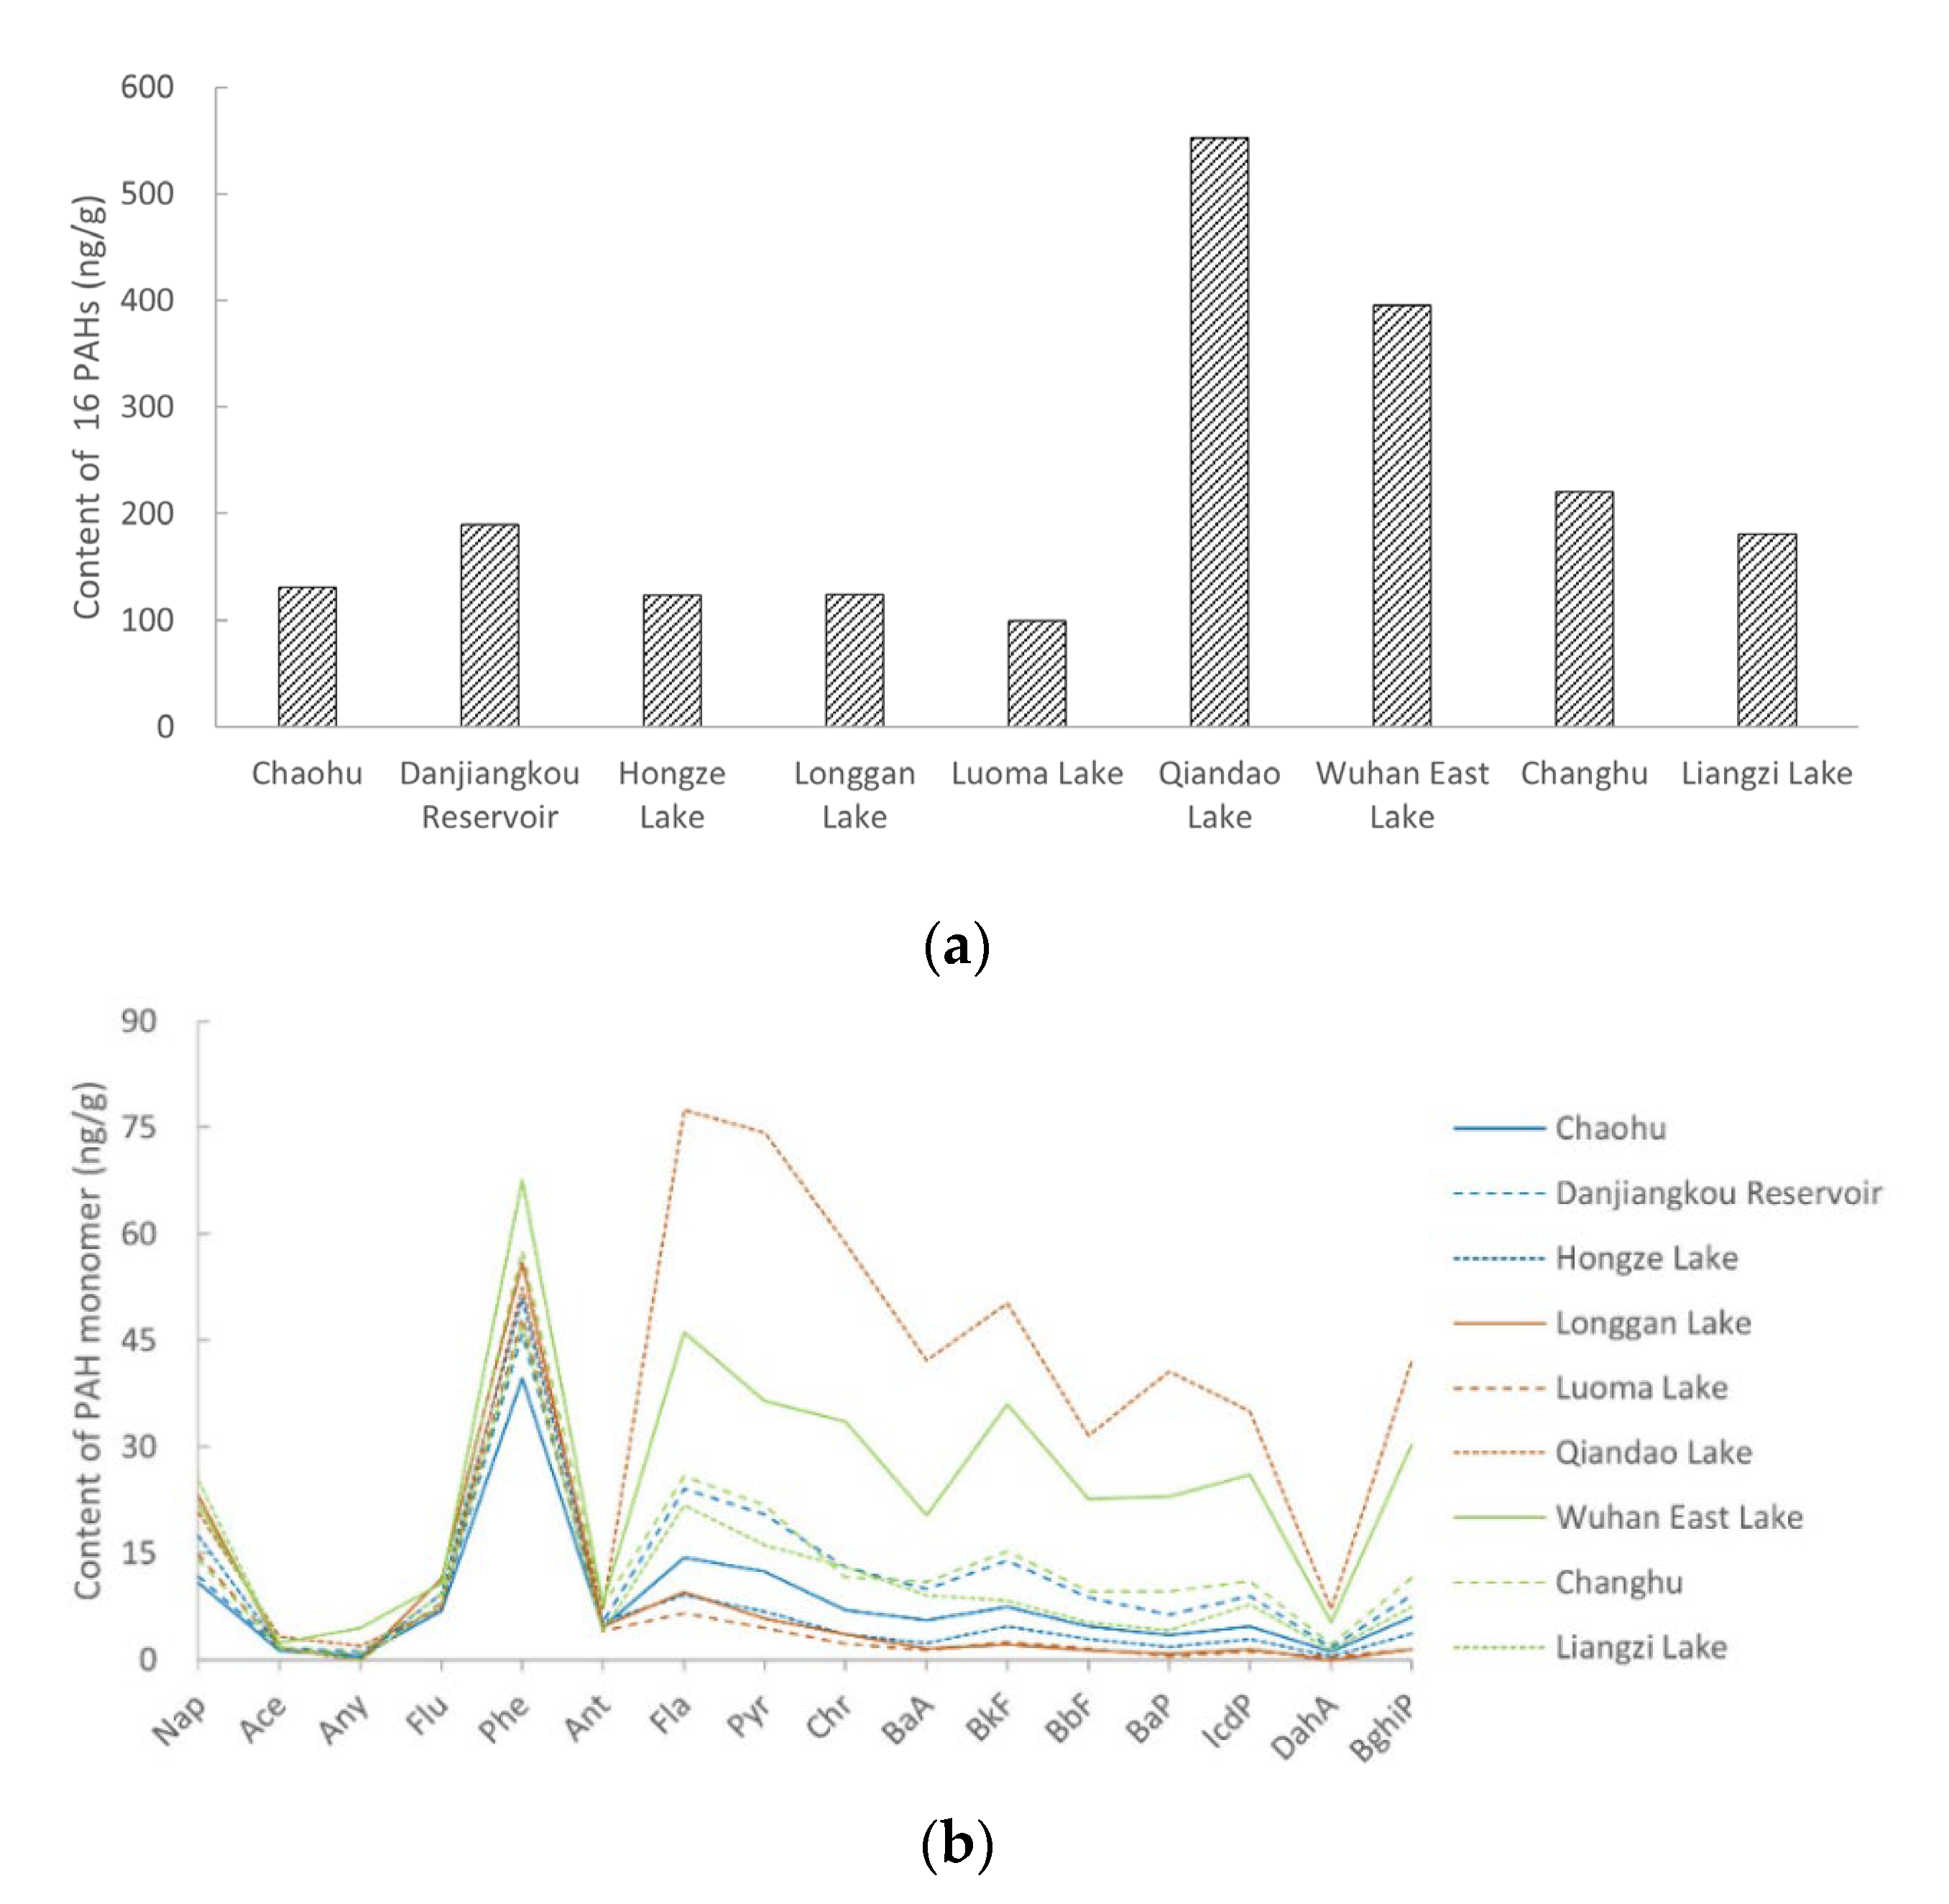
Figure 1. PAH contents in soil near the lake shores. (a) Total PAH content in soil; (b) PAH monomer content in soil.
Toxics 10 00577 g001
Figure 2. Ring chart of concentrations for 16 PAHs in soil near lake shores. L-PAHs: Low-molecular-weight PAHs. M-PAHs: Medium-molecular-weight PAHs. H-PAHs: High-molecular-weight PAHs.
Toxics 10 00577 g002
Figure 3. Composition of low-, medium- and high-molecular-weight PAHs in soil.
Toxics 10 00577 g003
Figure 4. Total PAH contents in plants from different species. × means mean, ○ means outlier and - means median; except for Fabaceae, Poaceae, Compositae and Amaranthaceae, there was only one plant sample for other families.
Toxics 10 00577 g004
Figure 5. Total contents of PAHs in Poaceae (n = 16) and Compositae (n = 19) plants near 9 lakes.
Toxics 10 00577 g005
Figure 6. Ring chart of concentrations for 16 PAHs in plants near lake shores. L-PAHs: Low-molecular-weight PAHs. M-PAHs: Medium-molecular-weight PAHs. H-PAHs: High-molecular-weight PAHs.
Toxics 10 00577 g006
Figure 7. Compositions of PAHs in plants (See Table S6 in Supplementary Materials for plant numbers).
Toxics 10 00577 g007
Figure 8. PAH diagnostic ratios of Ant/(Ant+Phe), BaA/(BaA+Chr), Fla/(Fla+Pyr) and IcdP/(IcdP+BghiP) in soil and plant samples. (a) Diagnostic ratios in soil. (b) Diagnostic ratios in plants.
Toxics 10 00577 g008
Figure 9. Scores of principal component 1 (PC 1) and principal component 2 (PC 2) for plants near different lakes.
Toxics 10 00577 g009
Figure 10. Relationship between the PAH contents and Koa.
Toxics 10 00577 g010
Table 1. Statistical features of PAH contents in soil and plants near the lake shores (ng/g).
PAHs 2MeanMedianMaximumMinimumDetection Rate
SoilPlantSoilPlantSoilPlantSoilPlantSoilPlant
Nap17.133.517.531.225.361.410.917.2100%100%
Ace1.834.291.714.133.256.591.302.65100%100%
Any1.132.040.501.274.4614.7ND 1ND 166.7%88.6%
Flu8.5724.98.1122.611.547.86.8614.3100%100%
Phe51.211050.910567.622639.757.1100%100%
Ant5.398.575.228.127.9020.83.964.06100%100%
Fla19.534.021.819.477.52086.567.39100%100%
Pyr15.217.416.210.574.31044.493.55100%100%
Chr9.7212.311.68.7958.749.22.271.52100%100%
BaA6.634.619.102.6942.218.21.380.98100%100%
BkF9.422.988.332.1450.210.22.11ND 1100%93.2%
BbF5.946.145.253.6931.620.91.330.95100%100%
BaP4.392.484.111.3640.611.70.52ND 1100%81.8%
IcdP6.334.257.752.4535.020.01.19ND 1100%97.7%
DahA1.591.501.42ND 17.1534.6ND 1ND 188.9%31.8%
BghiP7.125.327.382.4642.041.21.46ND 1100%93.2%
16 PAHs  319027518123455274399.2123
1 ND means not detected. 2 Nap—Naphthalene, Ace—Acenaphthene, Any—Acenaphthylene, Flu—Fluorene, Phe—Phenanthrene, Ant—Anthracene, Fla—Fluoranthene, Pyr—Pyrene, Chr—Chrysene, BaA—Benz[a]anthracene, BkF—Benzo[k]fluoranthene, BbF—Benzo[b]fluoranthene, BaP—Benzo[a]pyrene, IcdP—Indeno[1,2,3-cd]pyrene, DahA—Dibenzo[a,h]anthracene, BghiP—Benzo[g,h,i]perylene. 3  16 PAHs means the sum of 16 PAHs.
Table 2. Typical values for Ant/(Ant+Phe), BaA/(BaA+Chr), Fla/(Fla+Pyr) and IcdP/(IcdP+BghiP).
SourceAnt/(Ant+Phe)BaA/(BaA+Chr)Fla/(Fla+Pyr)IcdP/(IcdP+BghiP)
Petroleum<0.1<0.2<0.4<0.2
Combustion>0.1>0.35
Liquid fossil fuel combustion 0.4–0.50.2–0.5
Grass, wood, coal combustion >0.5>0.5
Table 3. Component matrix for principal component analysis (PCA) of PAHs in plant samples.
Principal Component
1234
Nap0.460.43−0.30−0.36
Ace0.610.61−0.053−0.27
Any0.460.170.630.39
Flu0.520.770.180.15
Phe0.840.240.30−0.16
Ant0.650.46−0.40−0.13
Fla0.77−0.250.43−0.31
Pyr0.84−0.220.29−0.35
Chr0.84−0.340.076−0.20
BaA0.92−0.290.008−0.044
BkF0.89−0.24−0.190.22
BbF0.92−0.31−0.120.11
BaP0.86−0.21−0.210.35
IcdP0.84−0.20−0.270.37
DahA0.150.530.350.37
BghiP0.500.29−0.440.12
Table 4. Correlation coefficient between PAH monomer content in soil and plants.
In Soil
NapAceAnyFluPheAntFlaPyrChrBaABkFBbFBaPIcdPDahABghiP
In
palnts
Nap−0.0420.0570.1800.2230.2750.2790.028−0.037−0.035−0.037−0.117−0.117−0.037−0.037−0.034−0.034
Ace0.2010.2770.1090.2550.1580.1350.013−0.0280.057−0.028−0.054−0.054−0.028−0.028−0.048−0.048
Any−0.151−0.0080.383 *−0.137−0.0420.1060.2970.2850.317 *0.2850.1090.1090.2850.2850.303 *0.303 *
Flu0.1490.1290.0090.2400.0630.027−0.101−0.135−0.065−0.135−0.052−0.052−0.135−0.135−0.170−0.170
Phe−0.0130.0250.0970.122−0.0760.015−0.063−0.0720.007−0.072−0.060−0.060−0.072−0.072−0.095−0.095
Ant0.2160.2570.1240.553 **0.327 *0.370 *−0.068−0.077−0.035−0.077−0.458 **−0.458 **−0.077−0.077−0.140−0.140
Fla−0.313 *−0.1100.343 *−0.052−0.2350.1010.0350.0860.1700.086−0.185−0.1850.0860.0860.0920.092
Pyr−0.280−0.1280.2930.082−0.1340.148−0.0250.0150.0800.015−0.299 *−0.299 *0.0150.0150.0170.017
Chr−0.205−0.0660.399 **0.1400.0140.2840.1520.1850.2120.185−0.394 **−0.394 **0.1850.1850.1710.171
BaA−0.388 **−0.2070.417 **−0.031−0.1480.1990.1140.1740.2010.174−0.299 *−0.299 *0.1740.1740.1870.187
BkF−0.327 *−0.1790.427 **0.1190.0030.2890.0910.1290.1390.129−0.391 **−0.391 **0.1290.1290.1320.132
BbF−0.386 **−0.2440.423 **0.050−0.0910.2340.0890.1280.1460.128−0.345 *−0.345 *0.1280.1280.1290.129
BaP−0.491 **−0.301 *0.485 **−0.152−0.1940.1610.1680.1950.2190.195−0.145−0.1450.1950.1950.2160.216
IcdP−0.416 **−0.2770.441 **−0.137−0.2150.1060.1900.2350.2590.235−0.182−0.1820.2350.2350.2550.255
DahA−0.383 *−0.0980.510 *−0.392 *−0.2550.1270.345 *0.358 *0.403 **0.358 *0.1860.1860.358 *0.358 *0.358 *0.358 *
BghiP−0.261−0.2780.239−0.064−0.217−0.0670.1140.1000.1440.100−0.059−0.0590.1000.1000.1090.109
* indicates that the correlation is significant at a confidence level of 0.05; ** indicates that the correlation is significant at a confidence level of 0.01.
Table 5. Values of plant concentration factor (PCF) of PAHs in Zea mays L. (corn), Bidens pilosa L. and Gaillardia pulchella Foug.
Plant Concentration Factor (PCF)
Bidens pilosa L.Gaillardia pulchella Foug.Corn near Longgan LakeCorn near Chaohu
Nap1.972.351.992.30
Ace3.382.853.322.89
Any3.2329.216.11
Flu2.756.963.932.98
Phe2.794.662.552.67
Ant1.771.733.371.38
Fla6.013.731.391.69
Pyr6.021.851.450.855
Chr11.71.490.5860.741
BaA4.771.150.9230.430
BkF1.080.5700.5110.273
BbF3.941.671.870.902
BaP1.731.570.000.528
IcdP1.601.460.8050.719
DahA0.002.500.000.00
BghiP1.221.2028.30.588
1 Any was not detected in soil near Longgan Lake.
Table 6. Correlation between the contents of PAHs in soil and plants and their Kow and Koa values.
lg(PAHs in Soil)lg(PAHs in Plants)
lgKowr−0.071−0.461
p0.7940.073
lgKoar−0.143−0.518 *
p0.5960.040
* Indicates that the correlation is significant at a confidence level of 0.05.
Publisher’s Note: MDPI stays neutral with regard to jurisdictional claims in published maps and institutional affiliations.