Quality Attributes of Cryoconcentrated Calafate (Berberis microphylla) Juice during Refrigerated Storage

 ,
,  , and
, and
Abstract
1. Introduction
2. Materials and Methods
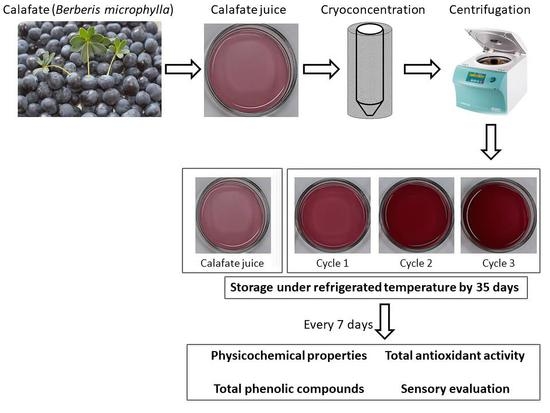
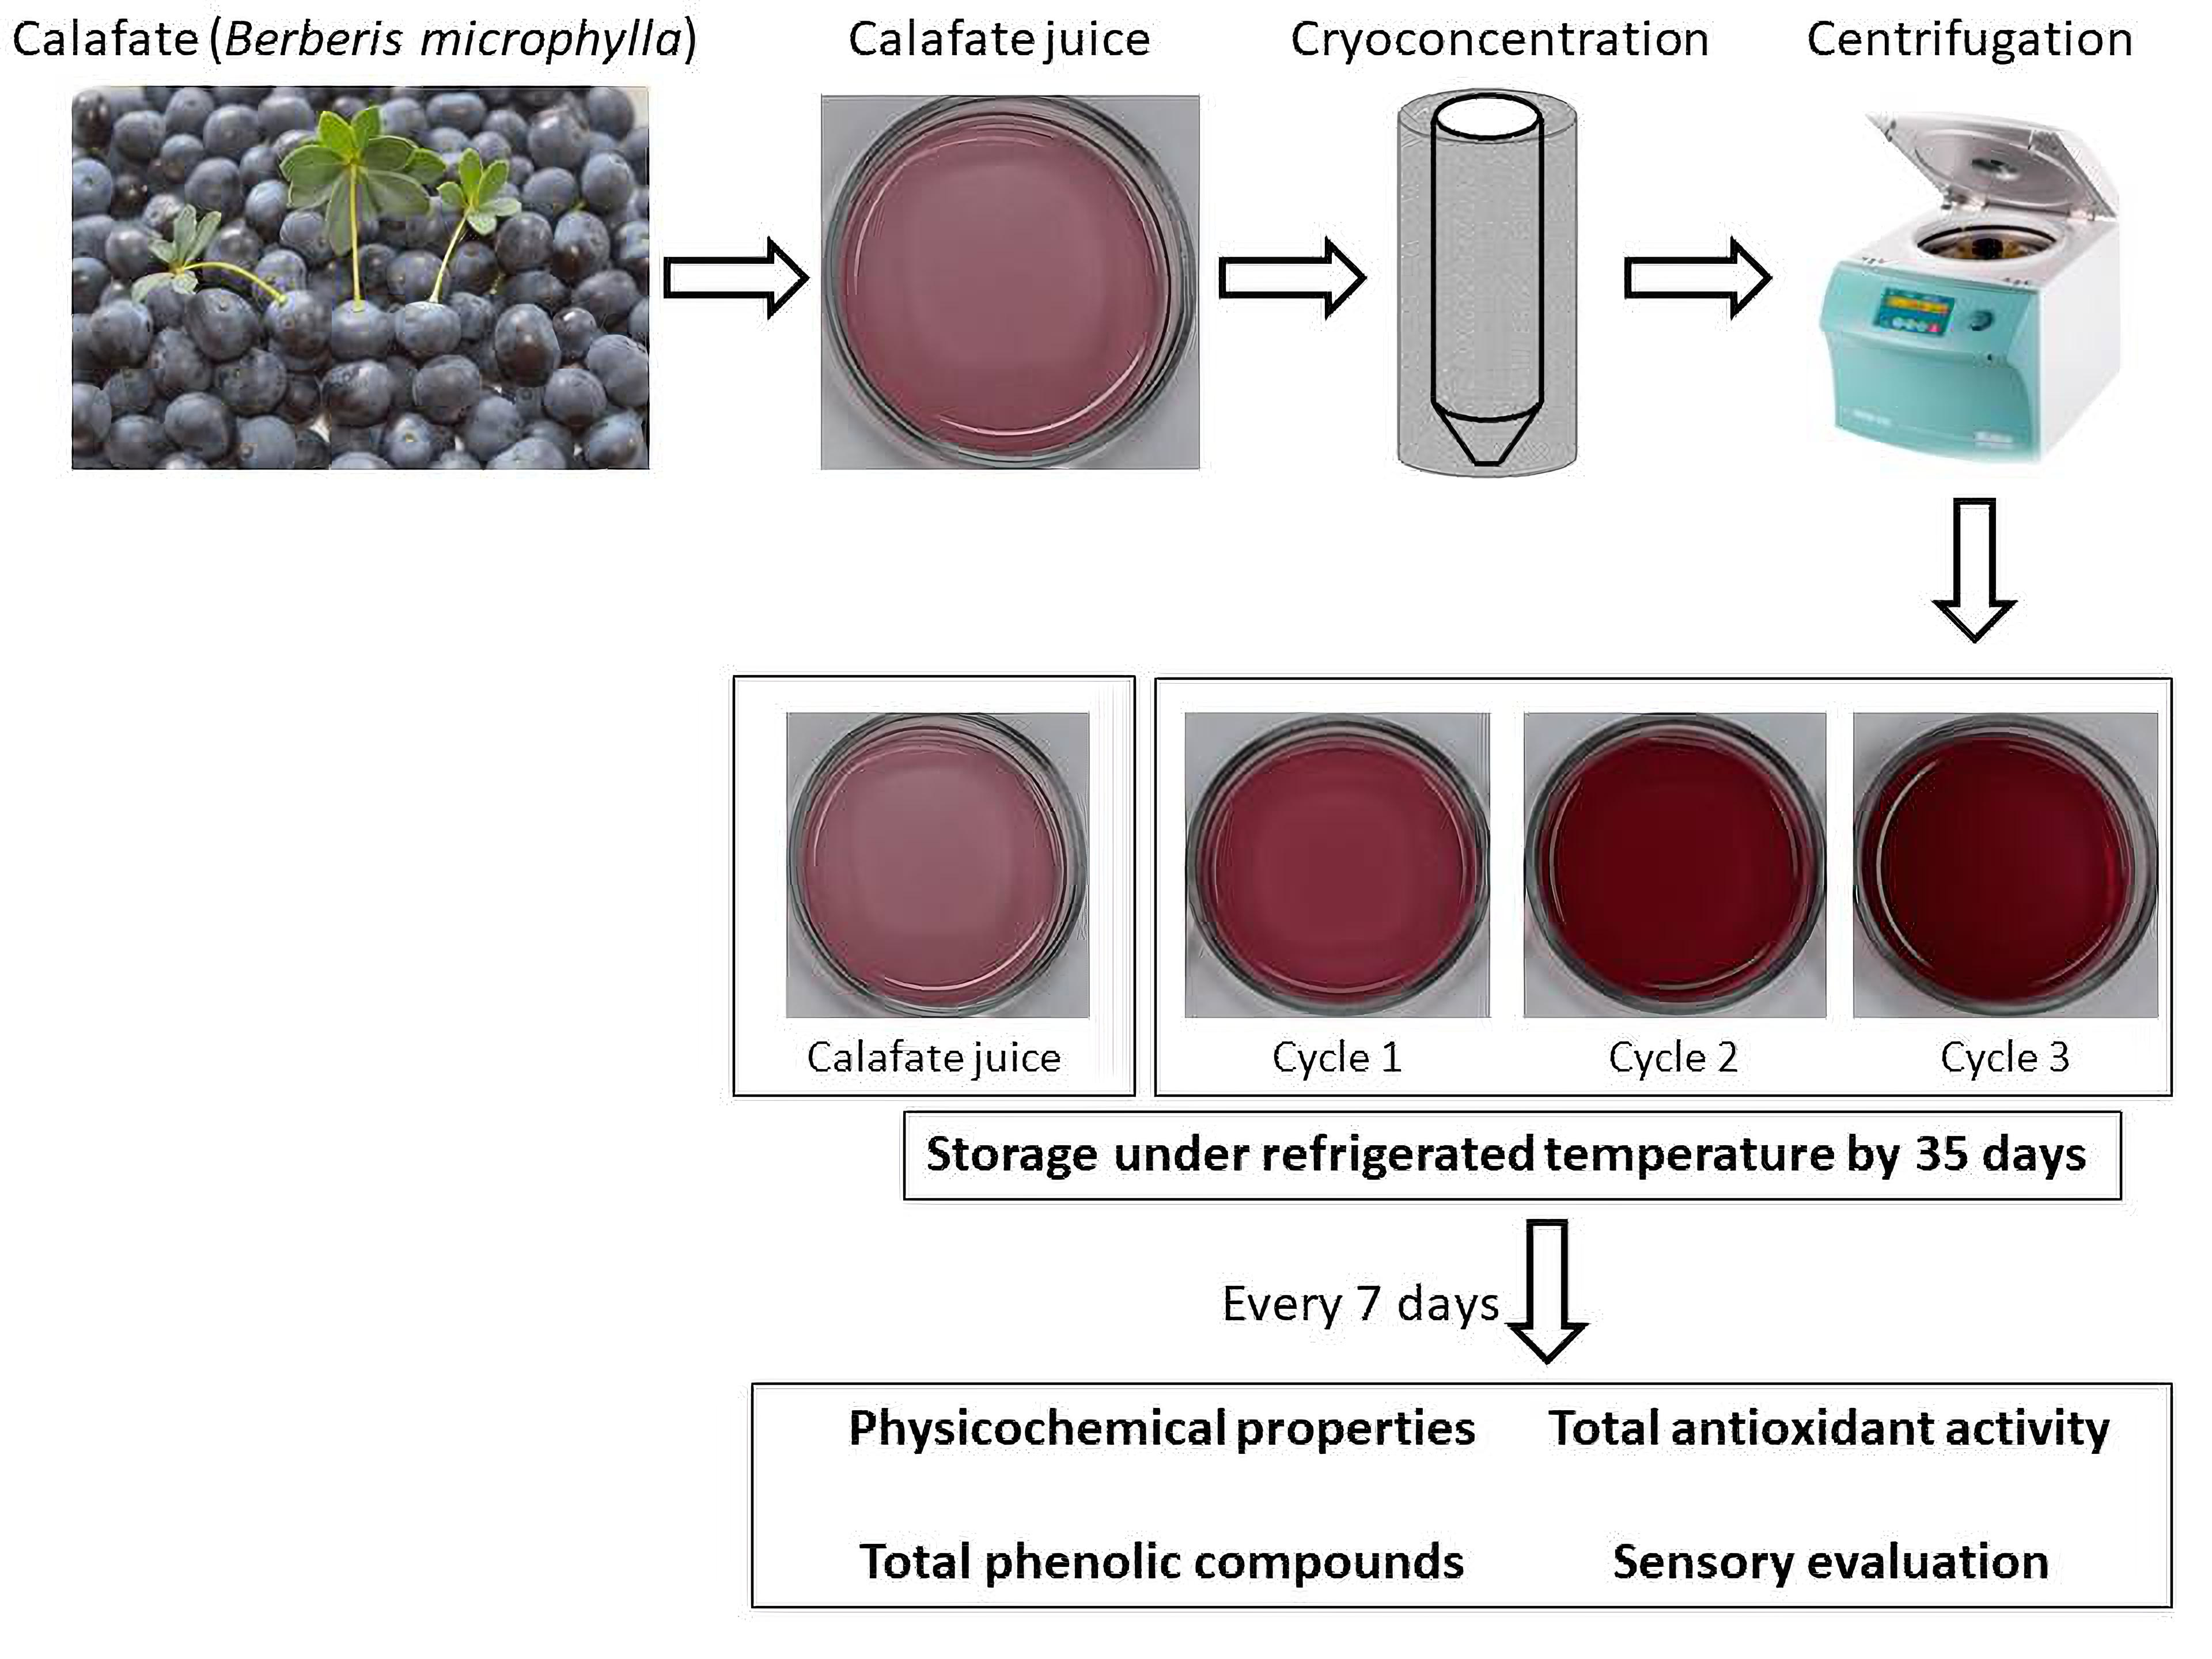
2.1. Calafate Juice Preparation
2.2. CBCC Protocol
2.3. Physicochemical Analysis
2.4. Quantification of Total Bioactive Compound (TBC)
2.5. Total Antioxidant Activity (TAA) Determinations
2.6. Storage Study
2.7. Sensory Evaluation
2.8. Statistical Analysis
3. Results and Discussion
3.1. Preliminary Centrifugation Results
3.2. TSS Results
3.3. Physicochemical Analysis
3.4. TBC of Fresh and Cryoconcentrated Samples
3.5. TAA of Fresh and Cryoconcentrated Samples
3.6. Correlation between TBC and TAA
3.7. Sensorial Analysis
4. Conclusions
Supplementary Materials
Author Contributions
Funding
Acknowledgments
Conflicts of Interest
References
- Ruiz, A.; Hermosin-Gutierrez, I.; Mardones, C.; Vergara, C.; Herlitz, E.; Vega, M.; Dorau, C.; Winterhalter, P.; von Baer, D. Polyphenols and antioxidant activity of calafate (Berberis microphylla) fruits and other native berries from Southern Chile. J. Agric. Food Chem. 2010, 58, 6081–6089. [Google Scholar] [CrossRef]
- Schmeda-Hirschmann, G.; Jiménez-Aspee, F.; Theoduloz, C.; Ladio, A. Patagonian berries as native food and medicine. J. Ethnopharmacol. 2019, 241, 111979. [Google Scholar] [CrossRef] [PubMed]
- Mariangel, E.; Reyes-Diaz, M.; Lobos, W.; Bensch, E.; Schalchli, H.; Ibarra, P. The antioxidant properties of calafate (Berberis microphylla) fruits from four different locations in southern Chile. Cien. Investig. Agrar. 2013, 40, 161–170. [Google Scholar] [CrossRef]
- Sadilova, E.; Stintzing, F.C.; Kammerer, D.R.; Carle, R. Matrix dependent impact of sugar and ascorbic acid addition on color and anthocyanin stability of black carrot, elderberry and strawberry single strength and from concentrate juices upon thermal treatment. Food Res. Int. 2009, 42, 1023–1033. [Google Scholar] [CrossRef]
- Hernández-Hernández, H.M.; Moreno-Vilet, L.; Villanueva-Rodríguez, S.J. Current status of emerging food processing technologies in Latin America: Novel non-thermal processing. Innov. Food Sci. Emerg. 2019, 58, 102233. [Google Scholar] [CrossRef]
- Petzold, G.; Orellana, P.; Moreno, J.; Junod, J.; Bugueño, G. Freeze concentration as a technique to protect valuable heat-labile components of foods. In Innovative Processing Technologies for Foods with Bioactive Compounds, 1st ed.; Moreno, J.J., Ed.; CRC Press: Boca Raton, FL, USA, 2016; pp. 184–190. [Google Scholar]
- Orellana-Palma, P.A. External Forces Assisted Cryoconcentration to Improve the Concentration Process and the Quality of Fruit Juices. Ph.D. Thesis, Universidad del Bío-Bío, Chillán, Chile, May 2018. [Google Scholar]
- Amran, N.A.; Samsuri, S.; Safiei, N.Z.; Zakaria, Z.Y.; Jusoh, M. Review: Parametric study on the performance of progressive cryoconcentration system. Chem. Eng. Commun. 2016, 203, 957–975. [Google Scholar] [CrossRef]
- Aider, M.; de Halleux, D. Passive and microwave-assisted thawing in maple sap cryoconcentration technology. J. Food Eng. 2008, 85, 65–72. [Google Scholar] [CrossRef]
- Orellana-Palma, P.; Petzold, G.; Andana, I.; Torres, N.; Cuevas, C. Retention of ascorbic acid and solid concentration via centrifugal freeze concentration of orange juice. J. Food Qual. 2017, 2017, 5214909. [Google Scholar] [CrossRef]
- Petzold, G.; Orellana, P.; Moreno, J.; Cerda, E.; Parra, P. Vacuum-assisted block freeze concentration applied to wine. Innov. Food Sci. Emerg. 2016, 36, 330–335. [Google Scholar] [CrossRef]
- Kawasaki, K.; Matsuda, A.; Kadota, H. Freeze concentration of equal molarity solutions with ultrasonic irradiation under constant freezing rate; effect of solute. Chem. Eng. Res. Des. 2006, 84, 107–112. [Google Scholar] [CrossRef]
- Petzold, G.; Aguilera, J.M. Centrifugal freeze concentration. Innov. Food Sci. Emerg. 2013, 20, 253–258. [Google Scholar] [CrossRef]
- Bastías-Montes, J.M.; Martín, V.S.; Muñoz-Fariña, O.; Petzold-Maldonado, G.; Quevedo-León, R.; Wang, H.; Yang, Y.; Céspedes-Acuña, C.L. Cryoconcentration procedure for aqueous extracts of maqui fruits prepared by centrifugation and filtration from fruits harvested in different years from the same localities. J. Berry Res. 2019, 9, 377–394. [Google Scholar] [CrossRef]
- Adorno, W.T.; Rezzadori, K.; Arend, G.D.; Chaves, V.C.; Reginatto, F.H.; Di Luccio, M.; Petrus, J.C. Enhancement of phenolic compounds content and antioxidant activity of strawberry (Fragaria×ananassa) juice by block freeze concentration technology. Int. J. Food Sci. Technol. 2017, 52, 781–787. [Google Scholar] [CrossRef]
- Orellana-Palma, P.; Zuñiga, R.N.; Takhar, P.S.; Gianelli, M.P.; Petzold, G. Effects of centrifugal block freeze crystallization on quality properties in pineapple juice. Chem. Eng. Technol. 2020, 43, 355–364. [Google Scholar] [CrossRef]
- Orellana-Palma, P.; Lazo-Mercado, V.; Gianelli, M.P.; Hernández, E.; Zuñiga, R.; Petzold, G. Influence of cryoconcentration on quality attributes of apple juice (Malus domestica cv. Red Fuji). Appl. Sci. 2020, 10, 959. [Google Scholar] [CrossRef]
- Orellana-Palma, P.; Petzold, G.; Guerra-Valle, M.; Astudillo-Lagos, M. Impact of block cryoconcentration on polyphenol retention in blueberry juice. Food Biosci. 2017, 20, 149–158. [Google Scholar] [CrossRef]
- AOAC. Official Methods of Analysis of the Association of Official Analytical Chemists (AOAC) International, 19th ed.; Helrich, K., Ed.; AOAC: Washington, DC, USA, 1990; pp. 910–928. [Google Scholar]
- Currie, L.A.; Svehla, G.Y.U.L.A. Nomenclature for the presentation of results of chemical analysis (IUPAC Recommendations 1994). Pure Appl. Chem. 1994, 66, 595–608. [Google Scholar] [CrossRef]
- Singleton, V.L.; Orthofer, R.; Lamuela-Raventós, R.M. Analysis of total phenols and other oxidation substrates and antioxidants by means of Folin-ciocalteu reagent. Methods Enzymol. 1999, 29, 152–178. [Google Scholar] [CrossRef]
- Lee, J.; Durst, R.W.; Wrolstad, R.E. Determination of total monomeric anthocyanin pigment content of fruit juices, beverages, natural colorants, and wines by the pH differential method: Collaborative study. J. AOAC Int. 2005, 88, 1269–1278. [Google Scholar] [CrossRef]
- Dewanto, V.; Wu, X.; Adom, K.K.; Liu, R.H. Thermal processing enhances the nutritional value of tomatoes by increasing total antioxidant activity. J. Agric. Food Chem. 2002, 50, 3010–3014. [Google Scholar] [CrossRef]
- Brand-Williams, W.; Cuvelier, M.E.; Berset, C. Use of a free radical method to evaluate antioxidant activity. LWT-Food Sci. Technol. 1995, 28, 25–30. [Google Scholar] [CrossRef]
- Re, R.; Pellegrini, N.; Proteggente, A.; Pannala, A.; Yang, M.; Rice, C. Antioxidant activity applying an improved ABTS radical cation decolorization assay. Free Radic. Biol. Med. 1999, 26, 1231–1237. [Google Scholar] [CrossRef]
- Benzie, I.F.F.; Strain, J.J. The ferric reducing ability of plasma (FRAP) as a measure of “Antioxidant Power”: The FRAP assay. Anal. Biochem. 1996, 239, 70–76. [Google Scholar] [CrossRef] [PubMed]
- Ou, B.; Hampsch, M.; Prior, R.L. Development and validation of an improved oxygen radical absorbance capacity assay using fluorescein as the fluorescent probe. J. Agric. Food Chem. 2001, 49, 4619–4626. [Google Scholar] [CrossRef]
- Petzold, G.; Orellana, P.; Moreno, J.; Valeria, P. Physicochemical properties of cryoconcentrated orange juice. Chem. Eng. Trans. 2019, 75, 37–42. [Google Scholar] [CrossRef]
- ODEPA. Catastro Frutícola Principales Resultados, Región de Los Lagos, Información Regional, Ministerio de Agricultura, Gobierno de Chile, Chile, 2019. Available online: https://www.odepa.gob.cl/wp-content/uploads/2019/09/catastro_aysen.pdf (accessed on 12 July 2020).
- Petzold, G.; Moreno, J.; Lastra, P.; Rojas, K.; Orellana, P. Block freeze concentration assisted by centrifugation applied to blueberry and pineapple juices. Innov. Food Sci. Emerg. 2015, 30, 192–197. [Google Scholar] [CrossRef]
- Moreno, F.L.; Quintanilla-Carvajal, M.X.; Sotelo, L.I.; Osorio, C.; Raventós, M.; Hernández, E.; Ruiz, Y. Volatile compounds, sensory quality and ice morphology in falling-film and block freeze concentration of coffee extract. J. Food Eng. 2015, 166, 64–71. [Google Scholar] [CrossRef]
- Ding, Z.; Qin, F.G.; Yuan, J.; Huang, S.; Jiang, R.; Shao, Y. Concentration of apple juice with an intelligent freeze concentrator. J. Food Eng. 2019, 256, 61–72. [Google Scholar] [CrossRef]
- Lemos, A.T.; Ribeiro, A.C.; Delgadillo, I.; Saraiva, J.A. Shelf-life extension of watermelon juice preserved by hyperbaric storage at room temperature compared to refrigeration. LWT-Food Sci. Technol. 2020, 117, 108695. [Google Scholar] [CrossRef]
- Wahia, H.; Zhou, C.; Mustapha, A.T.; Amanor-Atiemoh, R.; Mo, L.; Fakayode, O.A.; Ma, H. Storage effects on the quality quartet of orange juice submitted to moderate thermosonication: Predictive modeling and odor fingerprinting approach. Ultrason. Sonochem. 2020, 64, 104982. [Google Scholar] [CrossRef]
- Chia, S.L.; Rosnah, S.; Noranizan, M.A.; Ramli, W.W. The effect of storage on the quality attributes of ultraviolet-irradiated and thermally pasteurised pineapple juices. Int. Food Res. J. 2012, 19, 1001–1010. [Google Scholar]
- Arena, M.E.; Zuleta, A.; Dyner, L.; Constenla, D.; Ceci, L.; Curvetto, N. Berberis buxifolia fruit growth and ripening: Evolution in carbohydrate and organic acid contents. Sci. Hortic. 2013, 158, 52–58. [Google Scholar] [CrossRef]
- Khajehei, F.; Niakousari, M.; Eskandari, M.H.; Sarshar, M. Production of pomegranate juice concentrate by complete block cryoconcentration process. J. Food Process. Preserv. 2015, 38, 488–498. [Google Scholar] [CrossRef]
- Casas-Forero, N.; Orellana-Palma, P.; Petzold, G. Influence of block freeze concentration and evaporation on physicochemical properties, bioactive compounds and antioxidant activity in blueberry juice. Food Sci. Technol. 2020, in press. [Google Scholar] [CrossRef]
- Abid, M.; Jabbar, S.; Wu, T.; Hashim, M.M.; Hu, B.; Saeeduddin, M.; Zeng, X. Qualitative assessment of sonicated apple juice during storage. J. Food Process. Preserv. 2015, 39, 1299–1308. [Google Scholar] [CrossRef]
- Bhardwaj, R.L.; Pandey, S. Juice blends-a way of utilization of under-utilized fruits, vegetables, and spices: A review. Crit. Rev. Food Sci. Nutr. 2011, 51, 563–570. [Google Scholar] [CrossRef]
- Parish, M.E.; Worobo, R.W.; Danyluk, M.D. Juices and Juice-containing Beverages. In Compendium of Methods for the Microbiological Examination of Foods, 1st ed.; Salfinger, Y., Tortorello, M.L., Eds.; Apha Press: Philadelphia, PA, USA, 2015; pp. 115–156. [Google Scholar]
- Zia, S.; Khan, M.R.; Zeng, X.A.; Shabbir, M.A.; Aadil, R.M. Combined effect of microwave and ultrasonication treatments on the quality and stability of sugarcane juice during cold storage. Int. J. Food Sci. Technol. 2019, 54, 2563–2569. [Google Scholar] [CrossRef]
- Mesquita, T.C.; Schiassi, M.C.E.V.; Lago, A.M.T.; Careli-Gondim, Í.; Silva, L.M.; de Azevedo Lira, N.; Nunes Carvalho, E.E.; de Oliveira Lima, L.C. Grape juice blends treated with gamma irradiation evaluated during storage. Radiat. Phys. Chem. 2020, 168, 108570. [Google Scholar] [CrossRef]
- Mezey, J.; Mezeyová, I. Changes in the levels of selected organic acids and sugars in apple juice after cold storage. Czech J. Food Sci. 2018, 36, 175–180. [Google Scholar] [CrossRef]
- Orellana-Palma, P.; González, Y.; Petzold, G. Improvement of centrifugal cryoconcentration by ice recovery applied to orange juice. Chem. Eng. Technol. 2019, 42, 925–931. [Google Scholar] [CrossRef]
- Igual, M.; Contreras, C.; Camacho, M.M.; Martínez-Navarrete, N. Effect of thermal treatment and storage conditions on the physical and sensory properties of grapefruit juice. Food Bioprocess Technol. 2014, 7, 191–203. [Google Scholar] [CrossRef]
- Cano-Lamadrid, M.; Nowicka, P.; Hernández, F.; Carbonell-Barrachina, A.A.; Wojdyło, A. Phytochemical composition of smoothies combining pomegranate juice (Punica granatum L) and Mediterranean minor crop purées (Ficus carica, Cydonia oblonga, and Ziziphus jujube). J. Sci. Food Agric. 2018, 98, 5731–5741. [Google Scholar] [CrossRef] [PubMed]
- Zielinski, A.A.; Zardo, D.M.; Alberti, A.; Bortolini, D.G.; Benvenutti, L.; Demiate, I.M.; Nogueira, A. Effect of cryoconcentration process on phenolic compounds and antioxidant activity in apple juice. J. Sci. Food Agric. 2019, 99, 2786–2792. [Google Scholar] [CrossRef] [PubMed]
- Qin, F.G.; Ding, Z.; Peng, K.; Yuan, J.; Huang, S.; Jiang, R.; Shao, Y. Freeze concentration of apple juice followed by centrifugation of ice packed bed. J. Food Eng. 2020, 291, 110270. [Google Scholar] [CrossRef]
- Yildiz, G.; Aadil, R.M. Comparison of high temperature-short time and sonication on selected parameters of strawberry juice during room temperature storage. Int. J. Food Sci. Technol. 2020, 57, 1462–1468. [Google Scholar] [CrossRef]
- Wurlitzer, N.J.; Dionísio, A.P.; Lima, J.R.; dos Santos Garruti, D.; da Silva Araújo, I.M.; da Rocha, R.F.J.; Maia, J.L. Tropical fruit juice: Effect of thermal treatment and storage time on sensory and functional properties. J. Food Sci. Technol. 2019, 56, 5184–5193. [Google Scholar] [CrossRef]
- Pankaj, B.P.; Umezuruike, L.O.; Fahad, A.A. Colour measurement and analysis in fresh and processed foods: A review. Food Bioprocess Technol. 2013, 6, 36–60. [Google Scholar] [CrossRef]
- Brito, A.; Areche, C.; Sepúlveda, B.; Kennelly, E.J.; Simirgiotis, M.J. Anthocyanin characterization, total phenolic quantification and antioxidant features of some Chilean edible berry extracts. Molecules 2014, 19, 10936–10955. [Google Scholar] [CrossRef]
- Azhar, A.N.; Panirselvam, M.; Amran, N.A.; Ruslan, M.S.; Samsuri, S. Retention of total phenolic content and antioxidant activity in the concentration of broccoli extract by progressive freeze concentration. Int. J. Food Eng. 2020, in press. [Google Scholar] [CrossRef]
- Feng, X.; Zhou, Z.; Wang, X.; Bi, X.; Ma, Y.; Xing, Y. Comparison of high hydrostatic pressure, ultrasound, and heat treatments on the quality of strawberry–apple–lemon juice blend. Foods 2020, 9, 218. [Google Scholar] [CrossRef]
- Samsuri, S.; Li, T.H.; Ruslan, M.S.H.; Amran, N.A. Antioxidant recovery from pomegranate peel waste by integrating maceration and freeze concentration technology. Int. J. Food Eng. 2020. in Press. [Google Scholar] [CrossRef]
- Correa, L.J.; Ruiz, R.Y.; Moreno, F.L. Effect of falling-film freeze concentration on bioactive compounds in aqueous coffee extract. J. Food Process Eng. 2018, 41, e12606. [Google Scholar] [CrossRef]
- Orellana-Palma, P.; Petzold, G.; Pierre, L.; Pensaben, J.M. Protection of polyphenols in blueberry juice by vacuum-assisted block freeze concentration. Food Chem. Toxicol. 2017, 109, 1093–1102. [Google Scholar] [CrossRef]
- Tomadoni, B.; Cassani, L.; Viacava, G.; Moreira, M.D.R.; Ponce, A. Effect of ultrasound and storage time on quality attributes of strawberry juice. J. Food Process Eng. 2017, 40, e12533. [Google Scholar] [CrossRef]
- Lu, Q.; Li, L.; Xue, S.; Yang, D.; Wang, S. Stability of flavonoid, carotenoid, soluble sugar and vitamin C in ‘Cara Cara’ juice during storage. Foods 2019, 8, 417. [Google Scholar] [CrossRef]
- Rios-Corripio, G.; Guerrero-Beltrán, J.A. Physicochemical, antioxidant and sensory characteristics of black cherry (Prunus serotina subsp. capuli) fermented juice. Int. J. Fruit Sci. 2020, in press. [Google Scholar] [CrossRef]
- Walkling-Ribeiro, M.; Noci, F.; Cronin, D.A.; Lyng, J.G.; Morgan, D.J. Shelf life and sensory evaluation of orange juice after exposure to thermosonication and pulsed electric fields. Food Bioprod. Process. 2009, 87, 102–107. [Google Scholar] [CrossRef]
- Dette, S.S.; Jansen, H. Freeze concentration of black currant juice. Chem. Eng. Technol. 2010, 33, 762–766. [Google Scholar] [CrossRef]
- Ramos, F.A.; Delgado, J.L.; Bautista, E.; Morales, A.L.; Duque, C. Changes in volatiles with the application of progressive freeze-concentration to Andes berry (Rubus glaucus Benth). J. Food Eng. 2005, 69, 291–297. [Google Scholar] [CrossRef]


| Centrifugation | Cycle | TSS | Efficiency 1 | Cryoconcentrated Volume |
|---|---|---|---|---|
| Condition | (°Brix) | (Eff, %) | (CV, mL) | |
| Fresh juice | 0 | 14.6 ± 0.2 a | - | - |
| 1 | 27.2 ± 0.8 b | 68.9 ± 0.9 a | 28.6 ± 0.2 a | |
| 15 min, 4000 rpm, 20 °C | 2 | 37.6 ± 0.4 c | 57.9 ± 0.4 b | 22.4 ± 0.6 b |
| 3 | 44.5 ± 0.5 d | 52.3 ± 1.1 c | 15.2 ± 0.8 c | |
| 1 | 23.7 ± 0.7 b | 75.7 ± 1.0 a | 34.4 ± 0.6 a | |
| 20 min, 4000 rpm, 20 °C | 2 | 31.1 ± 0.6 c | 69.7 ± 0.9 b | 29.1 ± 1.0 b |
| 3 | 36.6 ± 0.3 d | 63.0 ± 0.5 c | 21.6 ± 0.7 c |
| Day | pH | TA (g MA/L) | Density (kg/m3) | |||||||||
|---|---|---|---|---|---|---|---|---|---|---|---|---|
| Fresh Juice | C1 | C2 | C3 | Fresh Juice | C1 | C2 | C3 | Fresh Juice | C1 | C2 | C3 | |
| 0 | 3.09 ± 0.01 a,A | 3.02 ± 0.01 b,A | 2.92 ± 0.02 c,A | 2.82 ± 0.02 d,A | 2.07 ± 0.01 a,A | 2.77 ± 0.05 b,A | 4.10 ± 0.09 c,A | 4.59 ± 0.06 d,A | 1030 ± 3.55 a,A | 1080 ± 5.92 b,A | 1110 ± 9.01 c,A | 1150 ± 3.77 d,A |
| 7 | 3.15 ± 0.02 a,B | 3.07 ± 0.02 b,B | 3.00 ± 0.03 c,B | 2.89 ± 0.00 d,B | 2.03 ± 0.02 a,B | 2.65 ± 0.02 b,B | 3.97 ± 0.02 c,B | 4.40 ± 0.08 d,B | 1040 ± 2.74 a,B | 1100 ± 10.14 b,B | 1140 ± 5.74 c,B | 1160 ± 4.58 d,B |
| 14 | 3.24 ± 0.01 a,C | 3.18 ± 0.00 b,C | 3.05 ± 0.01 c,C | 3.01 ± 0.01 d,C | 1.98 ± 0.00 a,C | 2.59 ± 0.01 b,C | 3.90 ± 0.01 c,C | 4.25 ± 0.05 d,C | 1060 ± 3.01 a,C | 1130 ± 6.63 b,C | 1160 ± 2.10 c,C | 1200 ± 10.15 d,C |
| 21 | 3.30 ± 0.03 a,D | 3.21 ± 0.01 b,D | 3.09 ± 0.02 c,D | 3.06 ± 0.00 d,D | 1.84 ± 0.02 a,D | 2.44 ± 0.00 b,D | 3.82 ± 0.03 c,D | 4.15 ± 0.03 d,D | 1090 ± 10.75 a,D | 1150 ± 11.25 b,D | 1180 ± 11.52 c,D | 1240 ± 12.00 d,D |
| 28 | 3.36 ± 0.01 a,E | 3.25 ± 0.02 b,E | 3.17 ± 0.03 c,E | 3.11 ± 0.01 d,E | 1.79 ± 0.01 a,E | 2.37 ± 0.01 b,E | 3.75 ± 0.02 c,E | 4.10 ± 0.01 d,D | 1120 ± 9.95 a,E | 1170 ± 4.12 b,E | 1210 ± 3.58 c,E | 1270 ± 6.83 d,E |
| 35 | 3.40 ± 0.02 a,F | 3.29 ± 0.01 b,F | 3.22 ± 0.01 c,F | 3.17 ± 0.02 d,F | 1.72 ± 0.03 a,F | 2.32 ± 0.01 b,F | 3.62 ± 0.04 c,F | 4.03 ± 0.04 d,E | 1150 ± 12.10 a,F | 1200 ± 6.58 b,F | 1250 ± 4.50 c,F | 1310 ± 4.45 d,F |
| Day | Sample | L* | a* | b* | ΔE* |
|---|---|---|---|---|---|
| 0 | Fresh juice | 33.95 ± 0.61 a | 31.21 ± 2.72 a | 3.11 ± 0.08 a | - |
| C1 | 21.71 ± 1.01 b | 39.58 ± 0.47 b | 2.68 ± 0.24 b | 14.84 ± 1.07 a | |
| C2 | 10.41 ± 0.51 c | 43.40 ± 0.34 c | 2.32 ± 0.21 b,c | 26.52 ± 0.34 b | |
| C3 | 7.22 ± 0.19 d | 46.71 ± 0.29 d | 1.71 ± 0.08 d | 30.92 ± 0.30 c | |
| 7 | Fresh juice | 32.05 ± 0.09 a | 33.71 ± 1.00 a | 3.04 ± 0.05 a | - |
| C1 | 16.85 ± 0.23 b | 41.44 ± 0.29 b | 2.02 ± 0.02 b | 17.08 ± 0.31 a | |
| C2 | 8.37 ± 0.14 c | 44.85 ± 0.25 c | 1.41 ± 0.13 c | 26.22 ± 0.24 b | |
| C3 | 5.49 ± 0.26 d | 48.45 ± 0.28 d | 0.99 ± 0.03 d | 30.44 ± 0.26 c | |
| 14 | Fresh juice | 31.12 ± 0.15 a | 34.07 ± 0.13 a | 3.00 ± 0.01 a | - |
| C1 | 16.05 ± 0.05 b | 41.94 ± 0.08 b | 1.65 ± 0.06 b | 17.05 ± 0.06 a | |
| C2 | 7.97 ± 0.03 c | 45.07 ± 0.07 c | 1.32 ± 0.01 c | 25.68 ± 0.04 b | |
| C3 | 4.96 ± 0.02 d | 49.18 ± 0.06 d | 0.91 ± 0.02 d | 30.28 ± 0.03 c | |
| 21 | Fresh juice | 25.84 ± 0.82 a | 37.36 ± 0.32 a | 2.79 ± 0.05 a | - |
| C1 | 13.10 ± 0.60 b | 43.41 ± 0.35 b | 1.17 ± 0.04 b | 14.20 ± 0.45 a | |
| C2 | 6.37 ± 0.16 c | 46.48 ± 0.35 c | 1.06 ± 0.06 c | 21.58 ± 0.27 b | |
| C3 | 3.10 ± 0.05 d | 50.46 ± 0.31 d | 0.75 ± 0.05 d | 26.32 ± 0.17 c | |
| 28 | Fresh juice | 20.25 ± 0.30 a | 39.60 ± 0.33 a | 2.33 ± 0.27 a | - |
| C1 | 9.49 ± 0.14 b | 45.30 ± 0.27 b | 0.92 ± 0.04 b | 12.26 ± 0.16 a | |
| C2 | 5.04 ± 0.07 c | 48.31 ± 0.33 c | 0.85 ± 0.04 c | 17.58 ± 0.20 b | |
| C3 | 1.97 ± 0.02 d | 52.34 ± 0.28 d | 0.50 ± 0.05 d | 22.36 ± 0.18 c | |
| 35 | Fresh juice | 13.57 ± 0.45 a | 41.73 ± 0.24 a | 1.99 ± 0.04 a | - |
| C1 | 6.13 ± 0.02 b | 47.67 ± 0.46 b | 0.53 ± 0.03 b | 9.63 ± 0.28 a | |
| C2 | 3.69 ± 0.15 c | 51.00 ± 0.41 c | 0.33 ± 0.03 c | 13.65 ± 0.38 b | |
| C3 | 0.51 ± 0.37 d | 55.00 ± 0.26 d | 0.06 ± 0.01 d | 18.72 ± 0.37 c |
| Day | TPC (mg GAE/g d.m.) | TAC (mg C3G/g d.m.) | TFC (mg CE/g d.m.) | |||||||||
|---|---|---|---|---|---|---|---|---|---|---|---|---|
| Fresh Juice | C1 | C2 | C3 | Fresh Juice | C1 | C2 | C3 | Fresh Juice | C1 | C2 | C3 | |
| 0 | 54.72 ± 0.02 a,A | 63.34 ± 0.66 b,A | 106.88 ± 0.77 c,A | 147.20 ± 0.04 d,A | 41.19 ± 0.07 a,A | 46.65 ± 0.65 b,A | 77.32 ± 0.48 c,A | 101.92 ± 0.53 d,A | 31.89 ± 0.45 a,A | 35.11 ± 0.58 b,A | 58.52 ± 0.34 c,A | 76.89 ± 0.41 d,A |
| 7 | 57.89 ± 0.20 a,B | 69.18 ± 0.38 b,B | 115.34 ± 1.25 c,B | 163.05 ± 2.30 d,B | 42.93 ± 0.50 a,B | 50.02 ± 0.40 b,B | 82.16 ± 0.59 c,B | 110.55 ± 5.35 d,B | 33.46 ± 1.29 a,B | 37.97 ± 1.05 b,B | 63.06 ± 0.55 c,B | 85.11 ± 0.08 d,B |
| 14 | 52.61 ± 0.38 a,C | 61.80 ± 0.31 b,C | 105.70 ± 4.34 c,C | 146.18 ± 3.73 d,C | 38.35 ± 0.59 a,C | 44.35 ± 0.21 b,C | 75.59 ± 0.53 c,C | 100.85 ± 4.28 d,C | 28.79 ± 0.52 a,C | 32.35 ± 1.27 b,C | 56.17 ± 0.56 c,C | 74.99 ± 1.25 d,C |
| 21 | 49.86 ± 0.39 a,D | 59.62 ± 0.39 b,D | 103.74 ± 0.97 c,D | 144.93 ± 0.77 d,D | 35.19 ± 0.66 a,D | 41.51 ± 0.73 b,D | 72.85 ± 0.06 c,D | 99.34 ± 3.59 d,D | 25.40 ± 0.51 a,D | 29.01 ± 0.55 b,D | 52.04 ± 0.34 c,D | 70.01 ± 0.64 d,D |
| 28 | 46.68 ± 0.17 a,E | 56.67 ± 1.09 b,E | 101.81 ± 1.79 c,E | 143.24 ± 1.23 d,E | 31.93 ± 0.44 a,E | 38.30 ± 0.18 b,E | 69.66 ± 0.12 c,E | 96.70 ± 0.93 d,E | 21.43 ± 0.39 a,E | 25.54 ± 0.27 b,E | 45.44 ± 0.85 c,E | 62.69 ± 1.08 d,E |
| 35 | 42.80 ± 0.56 a,F | 53.52 ± 1.85 b,F | 99.52 ± 1.64 c,F | 141.18 ± 1.71 d,F | 28.61 ± 0.31 a,F | 35.07 ± 0.47 b,F | 66.48 ± 0.38 c,F | 93.86 ± 4.29 d,F | 17.96 ± 0.28 a,F | 20.56 ± 1.23 b,F | 40.19 ± 0.06 c,F | 57.88 ± 0.80 d,F |
| Day | Sample | DPPH * | ABTS * | FRAP ** | ORAC ** |
|---|---|---|---|---|---|
| 0 | Fresh juice | 6.86 ± 0.51 a | 14.74 ± 2.73 a | 23.01 ± 1.87 a | 21.40 ± 1.25 a |
| C1 | 17.28 ± 1.47 b | 38.91 ± 3.23 b | 43.95 ± 3.04 b | 63.77 ± 3.79 b | |
| C2 | 26.61 ± 1.51 c | 57.04 ± 1.11 c | 67.19 ± 2.57 c | 87.95 ± 1.22 c | |
| C3 | 35.61 ± 2.04 d | 75.47 ± 7.34 d | 93.19 ± 5.74 d | 113.21 ± 5.96 d | |
| 7 | Fresh juice | 7.11 ± 0.91 a | 15.25 ± 0.77 a | 23.91 ± 2.12 a | 22.10 ± 1.77 a |
| C1 | 18.36 ± 1.30 b | 41.42 ± 2.15 b | 46.64 ± 1.41 b | 68.06 ± 1.14 b | |
| C2 | 28.95 ± 1.74 c | 61.71 ± 4.39 c | 72.51 ± 5.01 c | 95.20 ± 2.65 c | |
| C3 | 39.51 ± 1.62 d | 82.92 ± 2.55 d | 102.23 ± 5.39 d | 124.12 ± 3.24 d | |
| 14 | Fresh juice | 6.12 ± 0.25 a | 12.02 ± 0.37 a | 17.97 ± 1.71 a | 15.96 ± 2.11 a |
| C1 | 16.23 ± 0.91 b | 35.41 ± 1.84 b | 37.21 ± 3.27 b | 52.18 ± 4.16 b | |
| C2 | 25.36 ± 1.01 c | 53.62 ± 2.41 c | 59.32 ± 4.91 c | 74.63 ± 2.54 c | |
| C3 | 34.57 ± 2.21 d | 72.36 ± 1.99 d | 85.70 ± 3.22 d | 101.12 ± 5.37 d | |
| 21 | Fresh juice | 5.33 ± 0.33 a | 10.98 ± 0.78 a | 16.34 ± 1.41 a | 14.42 ± 1.24 a |
| C1 | 15.08 ± 1.41 b | 33.08 ± 1.02 b | 35.28 ± 4.34 b | 49.26 ± 2.04 b | |
| C2 | 24.24 ± 1.07 c | 50.99 ± 2.01 c | 56.76 ± 3.80 c | 71.88 ± 1.95 c | |
| C3 | 33.41 ± 2.57 d | 69.15 ± 2.07 d | 83.43 ± 4.51 d | 97.95 ± 3.35 d | |
| 28 | Fresh juice | 4.69 ± 0.40 a | 9.81 ± 0.81 a | 13.80 ± 1.71 a | 12.36 ± 1.23 a |
| C1 | 13.26 ± 1.02 b | 29.14 ± 2.17 b | 31.51 ± 2.36 b | 42.99 ± 3.04 b | |
| C2 | 22.33 ± 2.14 c | 45.48 ± 1.06 c | 51.04 ± 3.25 c | 62.45 ± 2.06 c | |
| C3 | 32.27 ± 0.43 d | 65.73 ± 1.94 d | 78.70 ± 2.74 d | 92.52 ± 4.33 d | |
| 35 | Fresh juice | 4.11 ± 0.72 a | 8.54 ± 1.99 a | 12.04 ± 1.95 a | 10.69 ± 2.54 a |
| C1 | 12.33 ± 1.36 b | 26.25 ± 0.77 b | 28.49 ± 1.21 b | 37.85 ± 1.74 b | |
| C2 | 20.96 ± 4.02 c | 42.11 ± 1.67 c | 45.38 ± 2.85 c | 57.12 ± 3.23 c | |
| C3 | 30.22 ± 2.74 d | 60.96 ± 7.25 d | 71.18 ± 4.14 d | 82.16 ± 4.47 d |
| TPC | TAC | TFC | DPPH | ABTS | FRAP | ORAC | |
|---|---|---|---|---|---|---|---|
| TPC | 1.00 | ||||||
| TAC | 0.97 * | 1.00 | |||||
| TFC | 0.96 * | 0.96 * | 1.00 | ||||
| DPPH | 0.94 * | 0.99 * | 0.98 * | 1.00 | |||
| ABTS | 0.90 * | 0.98 * | 0.99 * | 1.00 * | 1.00 | ||
| FRAP | 0.91 * | 0.97 * | 0.98 * | 0.99 * | 1.00 * | 1.00 | |
| ORAC | 0.90 * | 0.96 * | 0.97 * | 0.98 * | 0.99 * | 1.00 * | 1.00 |
© 2020 by the authors. Licensee MDPI, Basel, Switzerland. This article is an open access article distributed under the terms and conditions of the Creative Commons Attribution (CC BY) license (http://creativecommons.org/licenses/by/4.0/).
Share and Cite
Orellana-Palma, P.; Tobar-Bolaños, G.; Casas-Forero, N.; Zúñiga, R.N.; Petzold, G. Quality Attributes of Cryoconcentrated Calafate (Berberis microphylla) Juice during Refrigerated Storage. Foods 2020, 9, 1314. https://doi.org/10.3390/foods9091314
Orellana-Palma P, Tobar-Bolaños G, Casas-Forero N, Zúñiga RN, Petzold G. Quality Attributes of Cryoconcentrated Calafate (Berberis microphylla) Juice during Refrigerated Storage. Foods. 2020; 9(9):1314. https://doi.org/10.3390/foods9091314
Chicago/Turabian StyleOrellana-Palma, Patricio, Guisella Tobar-Bolaños, Nidia Casas-Forero, Rommy N. Zúñiga, and Guillermo Petzold. 2020. "Quality Attributes of Cryoconcentrated Calafate (Berberis microphylla) Juice during Refrigerated Storage" Foods 9, no. 9: 1314. https://doi.org/10.3390/foods9091314
APA StyleOrellana-Palma, P., Tobar-Bolaños, G., Casas-Forero, N., Zúñiga, R. N., & Petzold, G. (2020). Quality Attributes of Cryoconcentrated Calafate (Berberis microphylla) Juice during Refrigerated Storage. Foods, 9(9), 1314. https://doi.org/10.3390/foods9091314