Investigating the Relationships between Basic Tastes Sensitivities, Fattiness Sensitivity, and Food Liking in 11-Year-Old Children


Abstract
1. Introduction
2. Materials and Methods
2.1. Participants
2.2. Test Procedure: The Taste Detective Game
2.3. Samples
2.4. Taste Responsiveness and Taste Liking
2.5. Detection and Recognition Test
2.6. PROP Responsiveness
2.7. Fattiness Sensitivity Test
2.8. Food Liking Questionnaire
2.9. Data Analysis
3. Results
3.1. Subject Characteristics and the Taste Detective Game Approach
3.2. Children’s Basic Tastes Sensitivity and Liking in Water Solutions
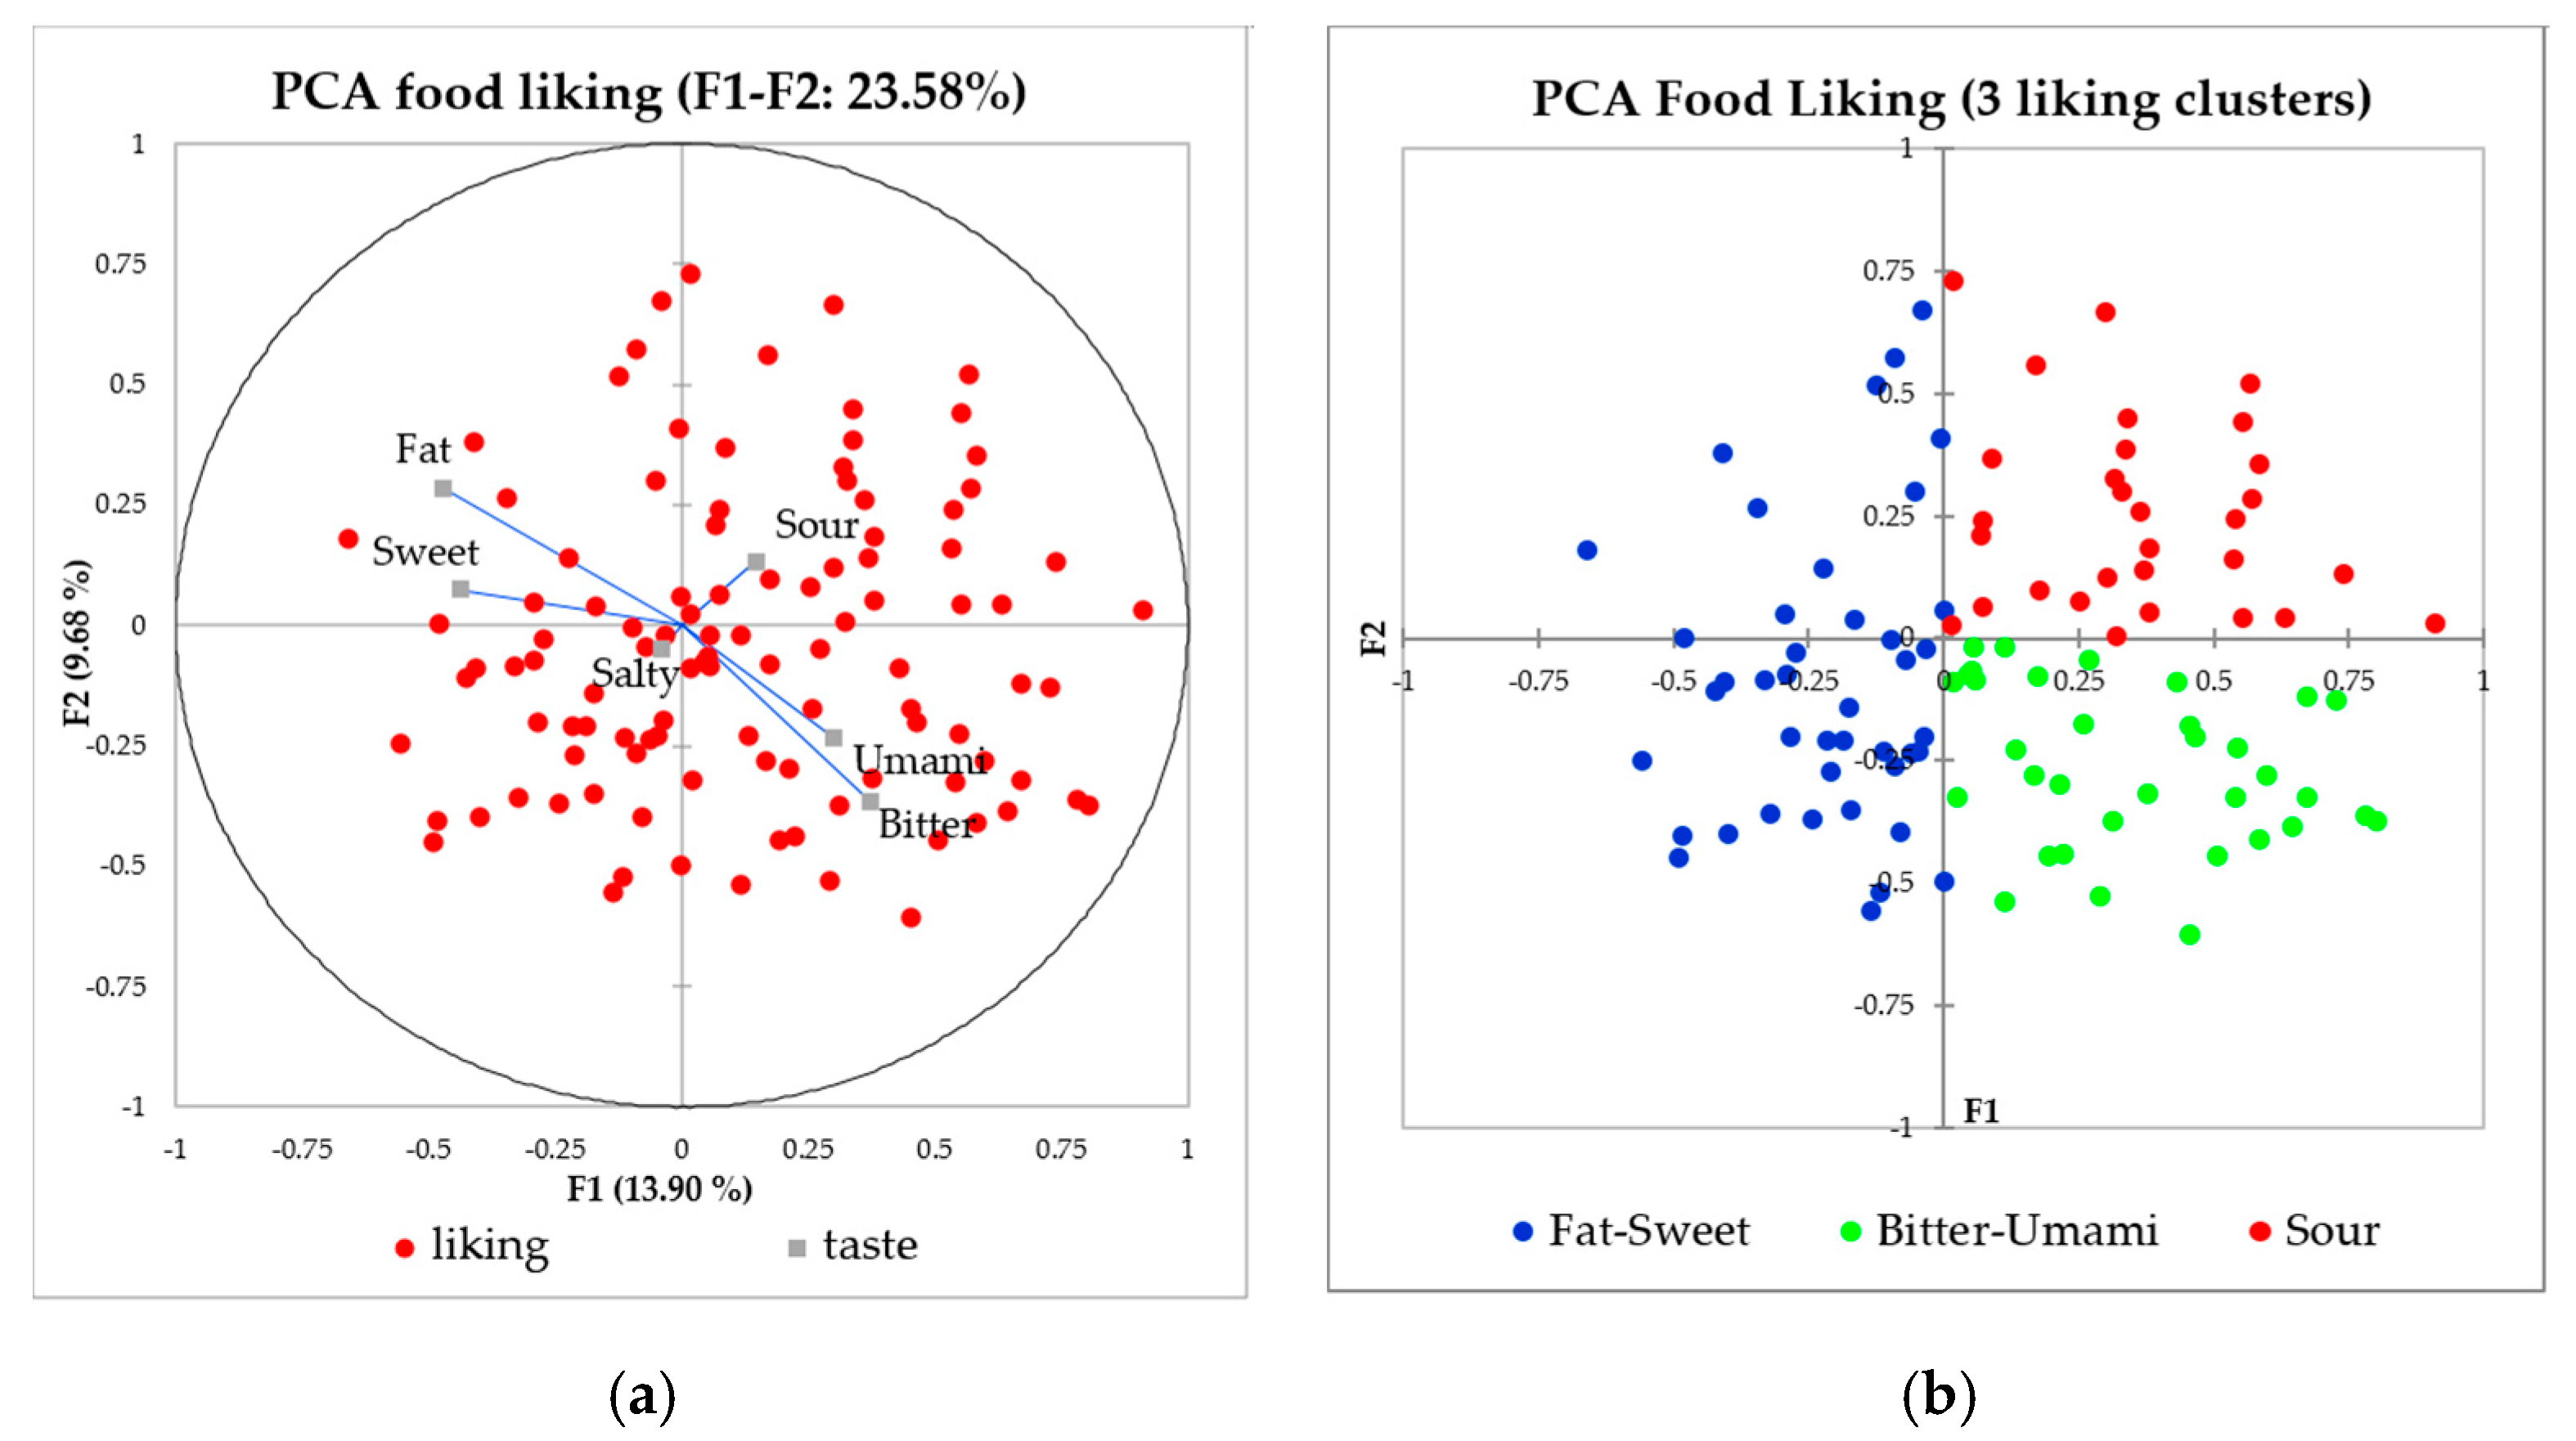
3.3. Children’s Stated Food Liking
3.4. Fattiness Sensitivity and Liking of Fatty Foods
4. Discussion
4.1. Basic Tastes Sensitivity in Children
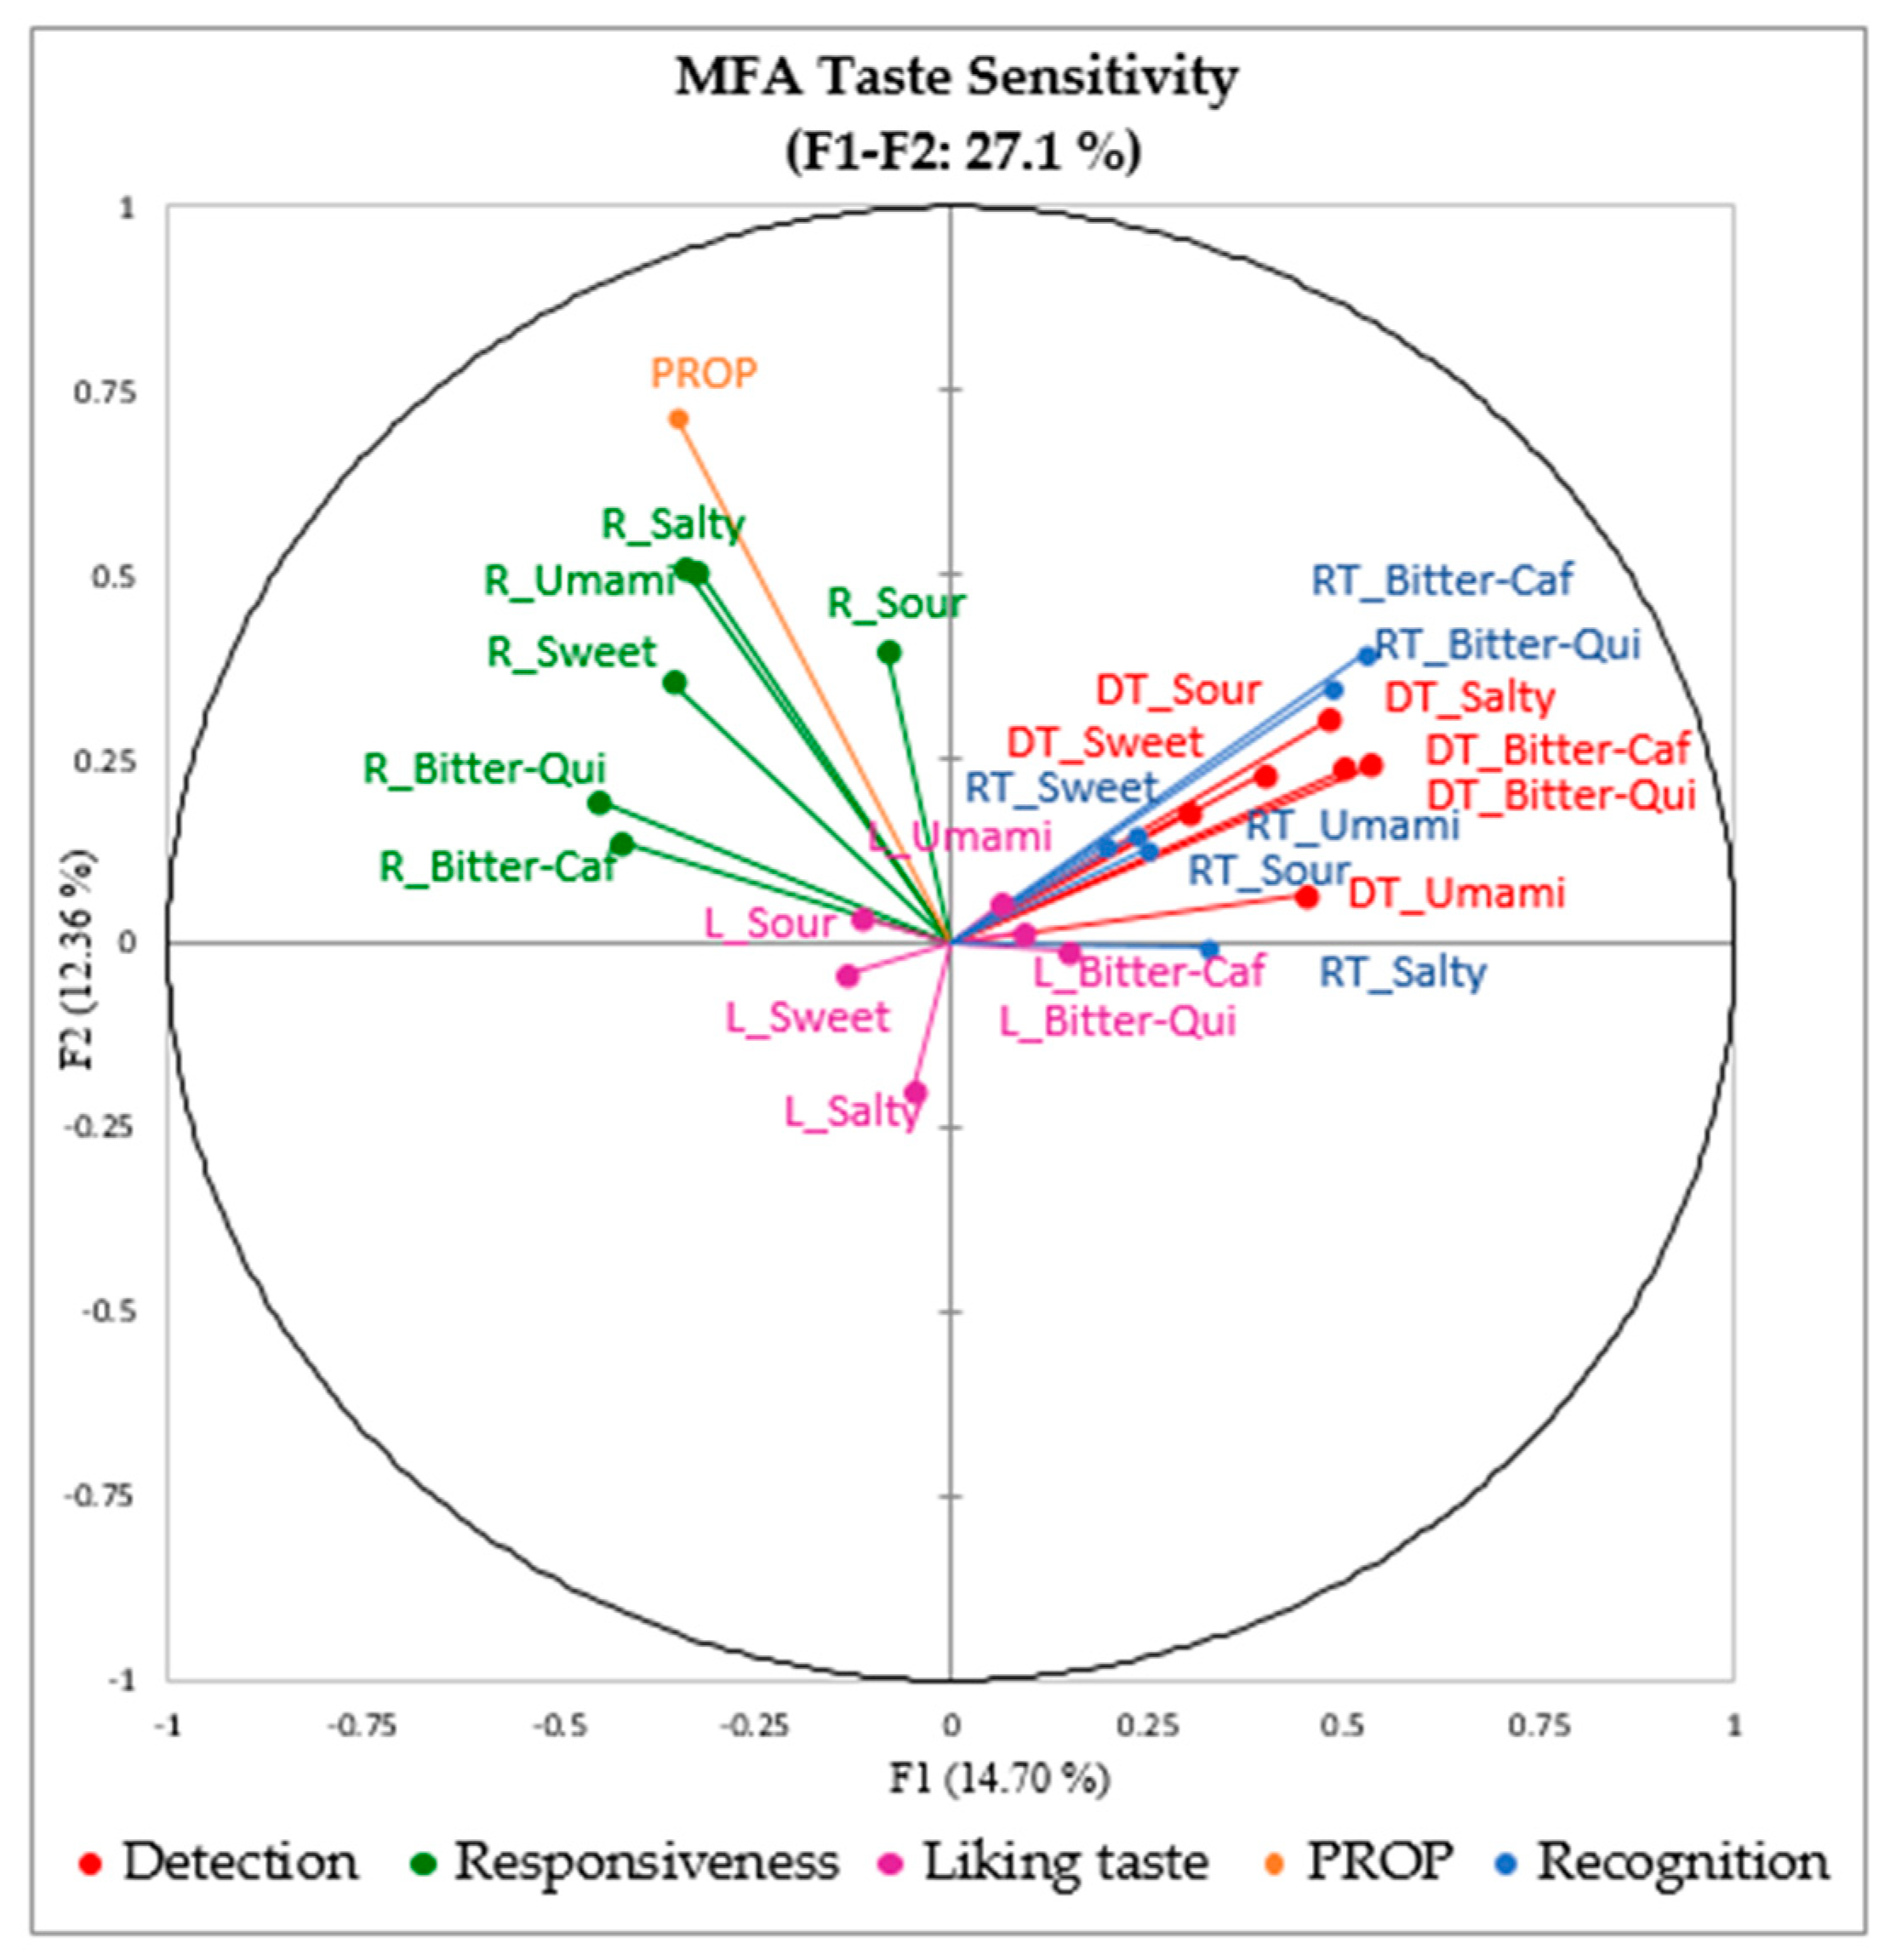
4.1.1. Relationships between Taste Sensitivities Measured by Different Methods
4.1.2. Bitterness Sensitivity to Caffeine, Quinine, and PROP
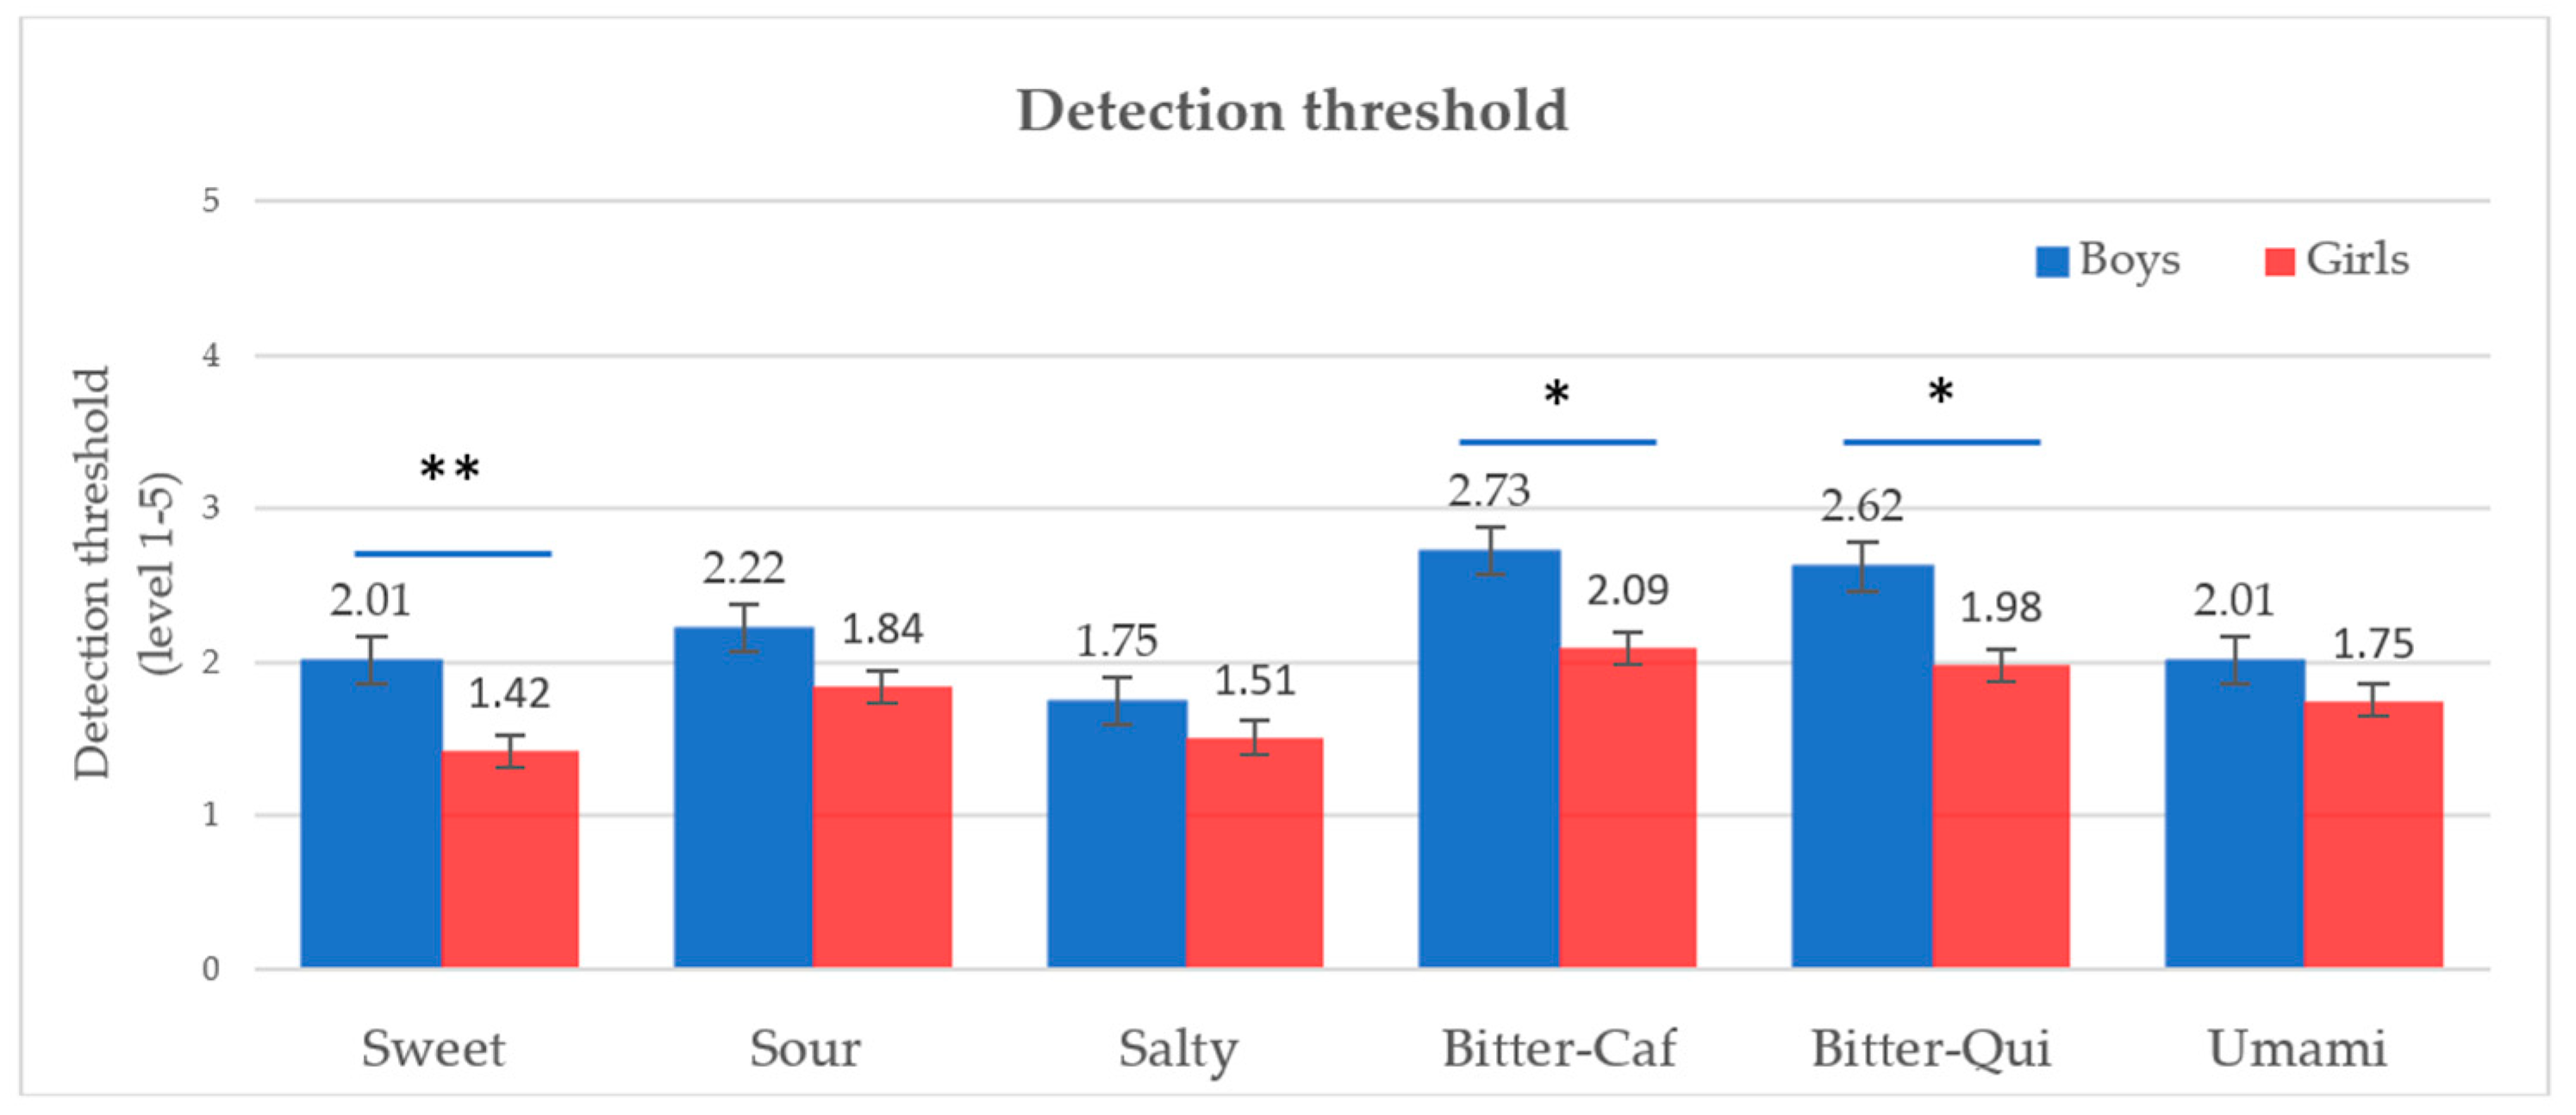
4.1.3. Gender Effect on Taste Sensitivity
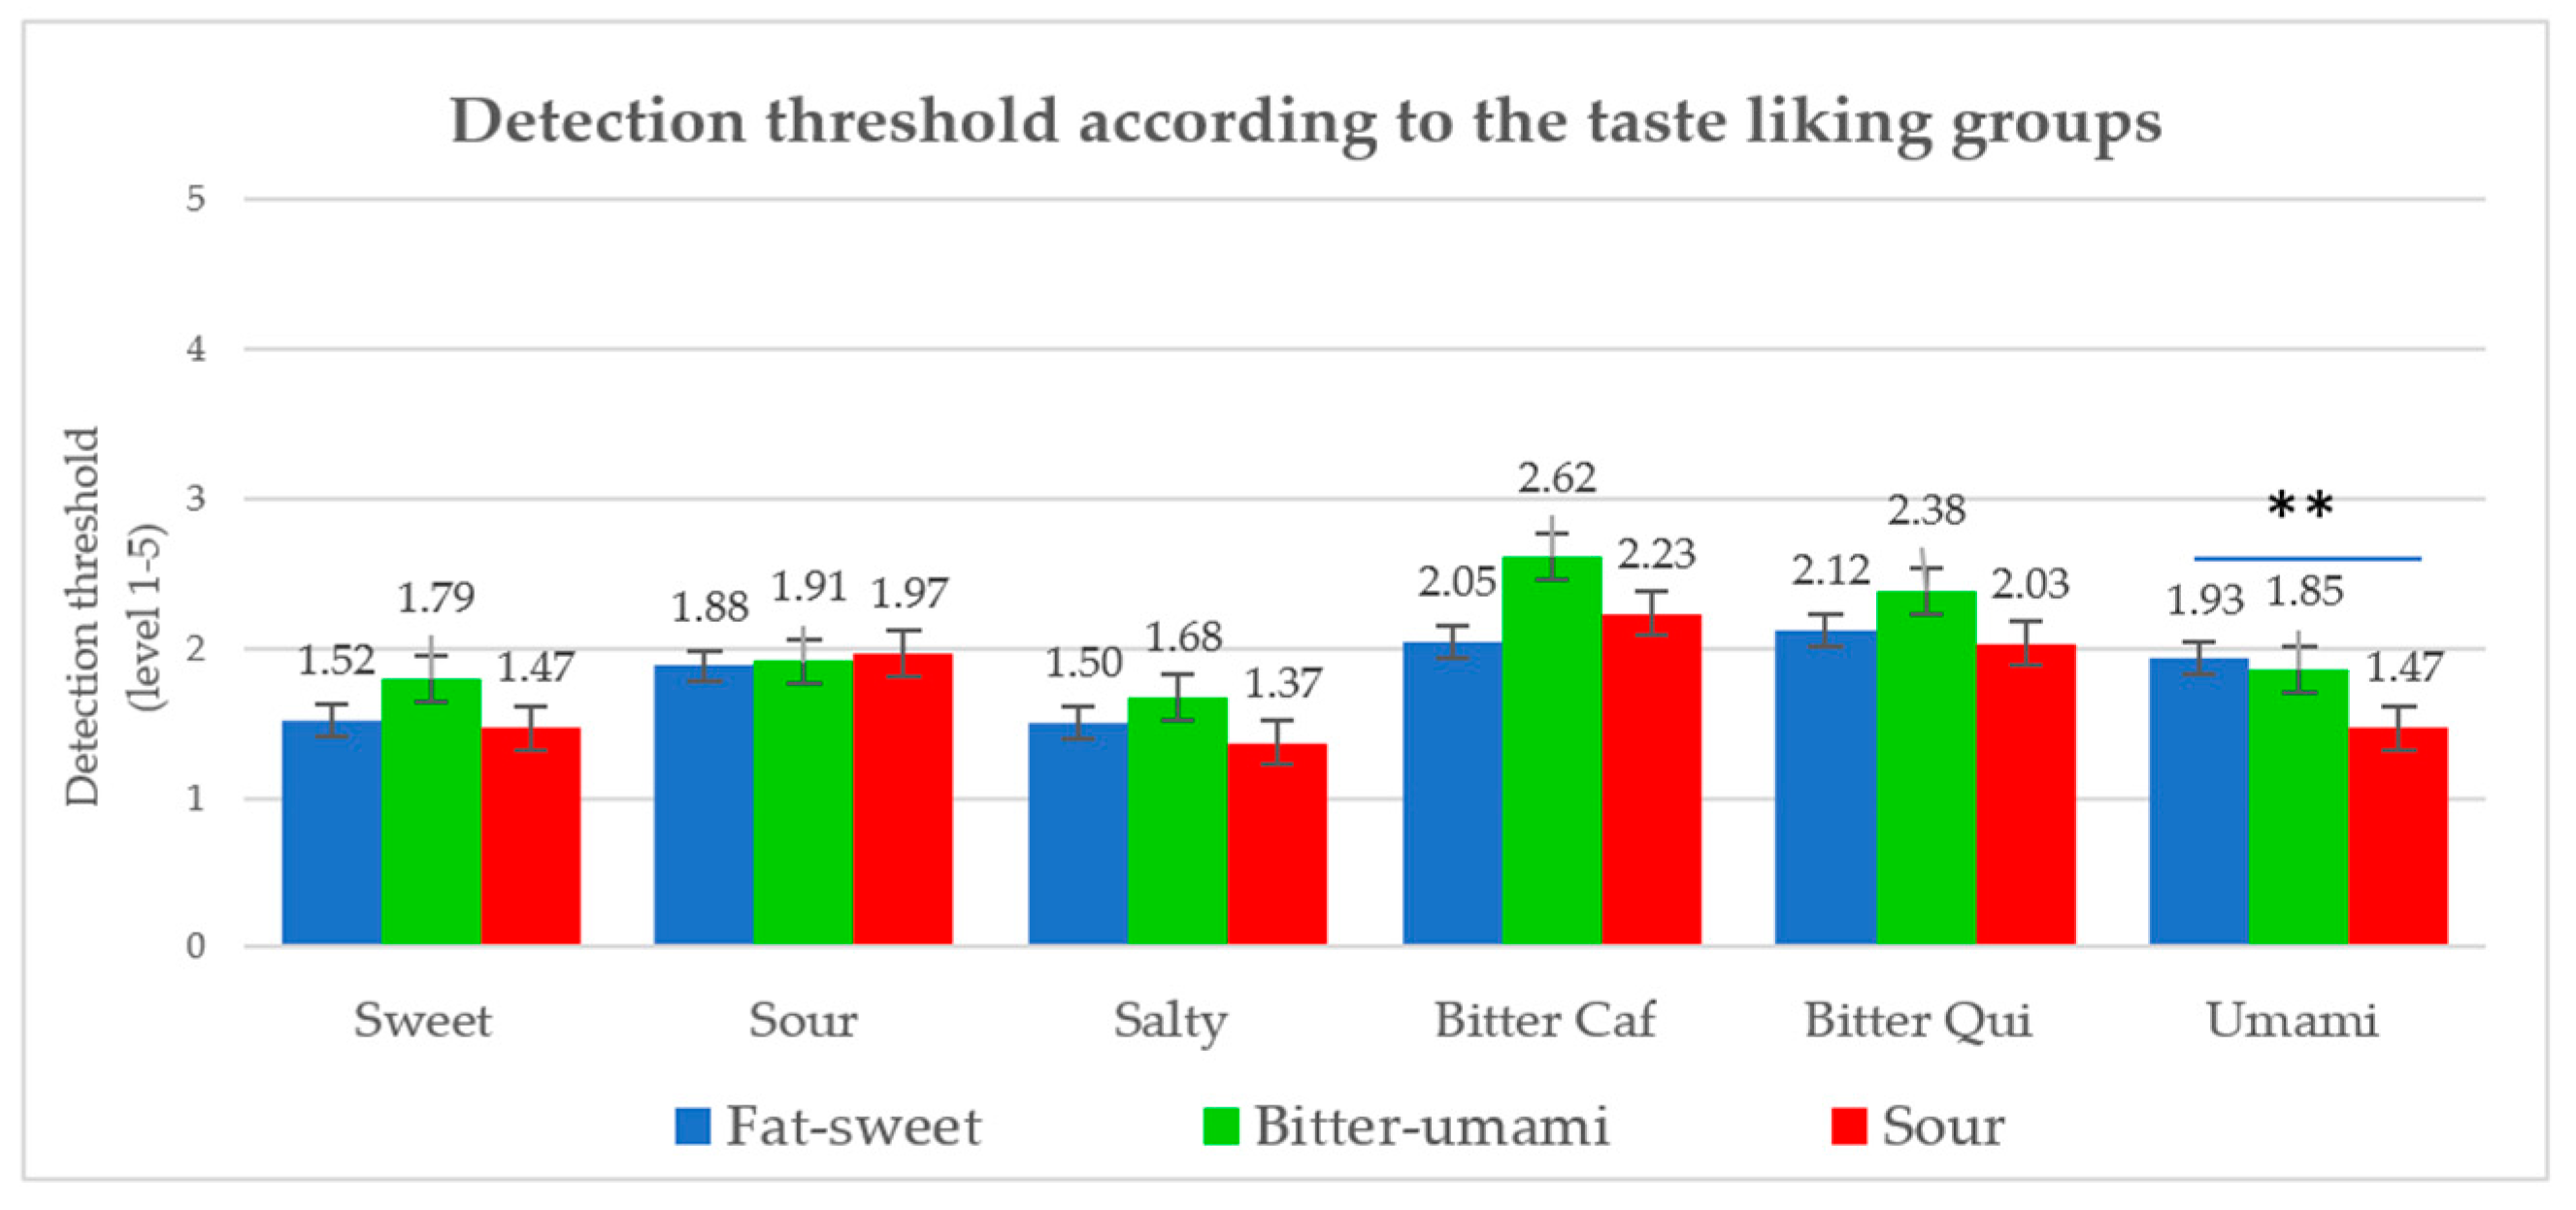
4.2. Children’s Taste Sensitivity and Food Liking
4.3. Fattiness Sensitivity and Food Liking
4.4. Methodological Approach and Limitations of the Study
5. Conclusions
Supplementary Materials
Author Contributions
Funding
Acknowledgments
Conflicts of Interest
References
- Negri, R.; Di Feola, M.; Di Domenico, S.; Scala, M.G.; Artesi, G.; Valente, S.; Smarrazzo, A.; Turco, F.; Morini, G.; Greco, L. Taste perception and food choices. J. Pediatr. Gastroenterol. Nutr. 2012, 54, 624–629. [Google Scholar] [CrossRef] [PubMed]
- Blissett, J.; Fogel, A. Intrinsic and extrinsic influences on children’s acceptance of new foods. Physiol. Behav. 2013, 121, 89–95. [Google Scholar] [CrossRef] [PubMed]
- Nguyen, S.P.; Girgis, H.; Robinson, J. Predictors of children’s food selection: The role of children’s perceptions of the health and taste of foods. Food Qual. Prefer. 2015, 40, 106–109. [Google Scholar] [CrossRef] [PubMed]
- Boesveldt, S.; De Graaf, K. The differential role of smell and taste for eating behavior. Perception 2017, 46, 307–319. [Google Scholar] [CrossRef] [PubMed]
- Oellingrath, I.M.; Hersleth, M.; Svendsen, M.V. Association between parental motives for food choice and eating patterns of 12- to 13-year-old Norwegian children. Public Health Nutr. 2013, 16, 2023–2031. [Google Scholar] [CrossRef]
- Hart, K.H.; Bishop, J.A.; Truby, H. An investigation into school children’s knowledge and awareness of food and nutrition. J. Hum. Nutr. Diet. 2002, 15, 129–140. [Google Scholar] [CrossRef]
- Joseph, P.V.; Reed, D.R.; Mennella, J.A. Individual differences among children in sucrose detection thresholds: Relationship with age, gender, and bitter taste genotype. Nurs. Res. 2016, 65, 3–12. [Google Scholar] [CrossRef]
- Winnie, D. Living Sensationally: Understanding Your Senses; Jessica Kingsley Publishers: London, UK, 2008. [Google Scholar]
- Webb, J.; Bolhuis, D.P.; Cicerale, S.; Hayes, J.E.; Keast, R. The relationships between common measurements of taste function. Chemosens. Percept. 2015, 8, 11–18. [Google Scholar] [CrossRef]
- Tepper, B.J. Nutritional implications of genetic taste variation: The role of PROP sensitivity and other taste phenotypes. Annu. Rev. Nutr. 2008, 28, 367–388. [Google Scholar] [CrossRef]
- Keast, R.; Roper, J. A complex relationship among chemical concentration, detection threshold, and suprathreshold intensity of bitter compounds. Chem. Senses 2007, 32, 245–253. [Google Scholar] [CrossRef]
- Galindo-Cuspinera, V.; Waeber, T.; Antille, N.; Hartmann, C.; Stead, N.; Martin, N. Reliability of threshold and suprathreshold methods for taste phenotyping: Characterization with PROP and sodium chloride. Chemosens. Percept. 2009, 2, 214–228. [Google Scholar] [CrossRef] [PubMed]
- Puputti, S.; Aisala, H.; Hoppu, U.; Sandell, M.A. Multidimensional measurement of individual differences in taste perception. Food Qual. Prefer. 2018, 65, 10–17. [Google Scholar] [CrossRef]
- Barthoshuk, L. Comparing sensory experiences across individuals: Recent psychophysical advances illuminate genetic variation in taste perception. Chem. Senses 2000, 25, 447–460. [Google Scholar] [CrossRef]
- Diószegi, J.; Llanaj, E.; Ádány, R. Genetic background of taste perception, taste preferences, and its nutritional implications: A systematic review. Front. Genet. 2019, 10, 1272. [Google Scholar] [CrossRef] [PubMed]
- Fischer, M.E.; Cruickshanks, K.J.; Pankow, J.S.; Pankratz, N.; Schubert, C.R.; Huang, G.-H.; Klein, B.E.; Klein, R.; Pinto, A. The associations between 6-n-propylthiouracil (PROP) intensity and taste intensities differ by TAS2R38 haplotype. J. Nutr. Nutr. 2015, 7, 143–152. [Google Scholar] [CrossRef]
- Duffy, V.B.; Davidson, A.C.; Kidd, J.R.; Kidd, K.K.; Speed, W.C.; Pakstis, A.J.; Reed, D.R.; Snyder, D.J.; Bartoshuk, L.M. Bitter receptor gene (TAS2R38), 6-n-propylthiouracil (PROP) bitterness and alcohol intake. Alcohol. Clin. Exp. Res. 2004, 28, 1629–1637. [Google Scholar] [CrossRef]
- Bufe, B.; Breslin, A.P.A.S.; Kühn, C.; Reed, D.R.; Tharp, C.D.; Slack, J.P.; Kim, U.-K.; Drayna, D.; Meyerhof, W. The molecular basis of individual differences in phenylthiocarbamide and propylthiouracil bitterness perception. Curr. Biol. 2005, 33, 322–327. [Google Scholar] [CrossRef]
- Drayna, D. Human Taste Genetics. Annu. Rev. Genom. Hum. Genet. 2005, 6, 217–235. [Google Scholar] [CrossRef]
- Wijtzes, A.I.; Jansen, W.; Bouthoorn, S.H.; Jong, J.C.K.D.; Jansen, P.W.; Franco, O.H.; Jaddoe, V.W.V.; Hofman, A.; Raat, H. PROP taster status, food preferences and consumption of high-calorie snacks and sweet beverages among 6-year-old ethnically diverse children. Matern. Child. Nutr. 2017, 13, e12240. [Google Scholar] [CrossRef]
- Keller, K.L.; Steinmann, L.; Nurse, R.J.; Tepper, B.J. Genetic taste sensitivity to 6-n-propylthiouracil influences food preference and reported intake in preschool children. Appetite 2002, 38, 3–12. [Google Scholar] [CrossRef]
- Zhao, L.; Kirkmeyer, S.V.; Tepper, B.J. A paper screening test to assess genetic taste sensitivity to 6-n-propylthiouracil. Physiol. Behav. 2003, 78, 625–633. [Google Scholar] [CrossRef]
- Oftedal, K.N.; Tepper, B.J. Influence of the PROP bitter taste phenotype and eating attitudes on energy intake and weight status in pre-adolescents: A 6-year follow-up study. Physiol. Behav. 2013, 118, 103–111. [Google Scholar] [CrossRef] [PubMed]
- Dinnella, C.; Monteleone, E.; Piochi, M.; Spinelli, S.; Prescott, J.; Pierguidi, L.; Gasperi, F.; Laureati, M.; Pagliarini, E.; Predieri, S.; et al. Individual variation in PROP status, fungiform papillae density, and responsiveness to taste stimuli in a large population sample. Chem. Senses 2018, 43, 697–710. [Google Scholar] [CrossRef]
- Feeney, E.; Hayes, J.E. Exploring associations between taste perception, oral anatomy and polymorphisms in the carbonic anhydrase (gustin) gene CA6. Physiol. Behav. 2014, 128, 148–154. [Google Scholar] [CrossRef] [PubMed]
- Piochi, M.; Pierguidi, L.; Torri, L.; Spinelli, S.; Monteleone, E.; Aprea, E.; Arena, E.; Borgogno, M.; Cravero, M.; Galassi, L.; et al. Individual variation in fungiform papillae density with different sizes and relevant associations with responsiveness to oral stimuli. Food Qual. Prefer. 2019, 78, 103729. [Google Scholar] [CrossRef]
- Hartley, I.E.; Liem, D.G.; Keast, R. Umami as an ‘alimentary’ taste. A new perspective on taste classification. Nutrients 2019, 11, 182. [Google Scholar] [CrossRef] [PubMed]
- Russell, S.J.K.; Andrew, C. Is fat the sixth taste primary? Evidence and implications. Flavor 2015, 4, 1–7. [Google Scholar]
- Besnard, P.; Passilly-Degrace, P.; Khan, N.A. Taste of fat: A sixth taste modality? Physiol. Rev. 2016, 96, 151–176. [Google Scholar] [CrossRef]
- García-Bailo, B.; Toguri, C.; Eny, K.M.; El-Sohemy, A. Genetic variation in taste and its influence on food selection. OMICS J. Integr. Biol. 2009, 13, 69–80. [Google Scholar] [CrossRef]
- Puputti, S. Individual Differences in Taste Perception Focus on Food-Related Behaviour; University of Turku: Turku, Finland, 2020. [Google Scholar]
- Coulthard, H.; Blissett, J.; Blissett, J. Fruit and vegetable consumption in children and their mothers. Moderating effects of child sensory sensitivity. Appetite 2009, 52, 410–415. [Google Scholar] [CrossRef]
- Hartvig, D.; Hausner, H.; Wendin, K.; Bredie, W.L. Quinine sensitivity influences the acceptance of sea-buckthorn and grapefruit juices in 9- to 11-year-old children. Appetite 2014, 74, 70–78. [Google Scholar] [CrossRef] [PubMed]
- Duffy, V.B.; Bartoshuk, L.M. Food acceptance and genetic variation in taste. J. Am. Diet. Assoc. 2000, 100, 647–655. [Google Scholar] [CrossRef]
- Bell, K.I.; Tepper, B.J. Short-term vegetable intake by young children classified by 6- n-propylthoiuracil bitter-taste phenotype. Am. J. Clin. Nutr. 2006, 84, 245–251. [Google Scholar] [CrossRef] [PubMed]
- Lanfer, A.; Knof, K.; Barba, G.; Veidebaum, T.; Papoutsou, S.; De Henauw, S.; Soós, T.; Moreno, L.A.; Ahrens, W.; Lissner, L. Taste preferences in association with dietary habits and weight status in European children: Results from the IDEFICS study. Int. J. Obes. 2012, 36, 27–34. [Google Scholar] [CrossRef]
- Vennerød, F.F.F.; Almli, V.L.; Berget, I.; Lien, N. Do parents form their children’s sweet preference? The role of parents and taste sensitivity on preferences for sweetness in pre-schoolers. Food Qual. Prefer. 2017, 62, 172–182. [Google Scholar] [CrossRef]
- Breslin, P.A. An evolutionary perspective on food and human taste. Curr. Biol. 2013, 23, R409–R418. [Google Scholar] [CrossRef]
- Mennella, J.A.; Spector, A.C.; Reed, D.R.; Coldwell, S.E. The bad taste of medicines: Overview of basic research on bitter taste. Clin. Ther. 2013, 35, 1225–1246. [Google Scholar] [CrossRef]
- Liem, D.G. Infants’ and children’s salt taste perception and liking: A review. Nutrients 2017, 9, 1011. [Google Scholar] [CrossRef]
- Liem, D.; Degraaf, C. Sweet and sour preferences in young children and adults: Role of repeated exposure. Physiol. Behav. 2004, 83, 421–429. [Google Scholar] [CrossRef]
- Ahrens, W. Sensory taste preferences and taste sensitivity and the association of unhealthy food patterns with overweight and obesity in primary school children in Europe—A synthesis of data from the IDEFICS study. Flavour 2015, 4, 8. [Google Scholar] [CrossRef]
- Baryłko-Pikielna, N.; Kostyra, E. Sensory interaction of umami substances with model food matrices and its hedonic effect. Food Qual. Prefer. 2007, 18, 751–758. [Google Scholar] [CrossRef]
- Overberg, J.; Hummel, T.; Krude, H.; Wiegand, S. Differences in taste sensitivity between obese and non-obese children and adolescents. Arch. Dis. Child. 2012, 97, 1048–1052. [Google Scholar] [CrossRef] [PubMed]
- Mustonen, S.; Rantanen, R.; Tuorila, H. Effect of sensory education on school children’s food perception: A 2-year follow-up study. Food Qual. Prefer. 2009, 20, 230–240. [Google Scholar] [CrossRef]
- Cecchini, M.P.; Knaapila, A.; Hoffmann, E.; Boschi, F.; Hummel, T.; Iannilli, E.; Paola, C.M.; Antti, K.; Eileen, H.; Thomas, H.; et al. A cross-cultural survey of umami familiarity in European countries. Food Qual. Prefer. 2019, 74, 172–178. [Google Scholar] [CrossRef]
- Stewart, J.E.; Newman, L.P.; Keast, R. Oral sensitivity to oleic acid is associated with fat intake and body mass index. Clin. Nutr. 2011, 30, 838–844. [Google Scholar] [CrossRef]
- Zhou, X.; Shen, Y.; Parker, J.; Kennedy, O.; Methven, L. Relative effects of sensory modalities on fat perception, and relationship between fat sensitivity, fat perception and preference. Appetite 2018, 123, 455. [Google Scholar] [CrossRef]
- Cox, D.N.; Hendrie, G.A.; Carty, D. Sensitivity, hedonics and preferences for basic tastes and fat amongst adults and children of differing weight status: A comprehensive review. Food Qual. Prefer. 2016, 48, 359–367. [Google Scholar] [CrossRef]
- Alexy, U.; Schaefer, A.; Sailer, O.; Busch-Stockfisch, M.; Huthmacher, S.; Kunert, J.; Kersting, M. Sensory preferences and discrimination ability of children in relation to their body weight status. J. Sens. Stud. 2011, 26, 409–412. [Google Scholar] [CrossRef]
- Mennella, J.A.; Finkbeiner, S.; Reed, D.R. The proof is in the pudding: Children prefer lower fat but higher sugar than do mothers. Int. J. Obes. 2012, 36, 1285–1291. [Google Scholar] [CrossRef]
- Jilani, H.; Peplies, J.; Buchecker, K. Assessment of Sensory Taste Perception in Children. In Instruments for Health Surveys in Children and Adolescents; Springer: Cham, Switzerland, 2019; pp. 257–275. [Google Scholar]
- Houldcroft, L.; Farrow, C.V.; Haycraft, E. Perceptions of parental pressure to eat and eating behaviours in preadolescents: The mediating role of anxiety. Appetite 2014, 80, 61–69. [Google Scholar] [CrossRef]
- Delwiche, J.F.; Buletic, Z.; Breslin, A.P.A.S. Covariation in individuals’ sensitivities to bitter compounds: Evidence supporting multiple receptor/transduction mechanisms. Percept. Psychophys. 2001, 63, 761–776. [Google Scholar] [CrossRef] [PubMed]
- Yokomukai, Y.; Cowart, B.J.; Beauchamp, G.K. Individual differences in sensitivity to bitter-tasting substances. Chem. Senses 1993, 18, 669–681. [Google Scholar] [CrossRef]
- Laureati, M.; Pagliarini, E.; Toschi, T.G.; Monteleone, E. Research challenges and methods to study food preferences in school-aged children: A review of the last 15years. Food Qual. Prefer. 2015, 46, 92–102. [Google Scholar] [CrossRef]
- Zverev, Y. Effects of caloric deprivation and satiety on sensitivity of the gustatory system. BMC Neurosci. 2004, 5, 5. [Google Scholar] [CrossRef]
- Knof, K.; IDEFICS Consortium; Lanfer, A.; Bildstein, M.O.; Buchecker, K.; Hilz, H. Development of a method to measure sensory perception in children at the European level. Int. J. Obes. 2011, 35 (Suppl. 1), S131–S136. [Google Scholar] [CrossRef] [PubMed][Green Version]
- Myhrer, K.; Carlehog, M.; Hersleth, M. Recognition threshold for the basic tastes: Which concentration to use? In Proceedings of the Eurosense Conference, Dijon, France, 11–14 September 2016. [Google Scholar]
- Vennerød, F.F.F.; Nicklaus, S.; Lien, N.; Almli, V.L. The development of basic taste sensitivity and preferences in children. Appetite 2018, 127, 130–137. [Google Scholar] [CrossRef]
- O’Mahony, M.; Goldenberg, M.; Stedmon, J.; Alford, J. Confusion in the use of the taste adjectives ‘sour’ and ‘bitter’. Chem. Senses 1979, 4, 301–318. [Google Scholar] [CrossRef]
- Pickering, G.J.; Simunkova, K.; Dibattista, D. Intensity of taste and astringency sensations elicited by red wines is associated with sensitivity to PROP (6-n-propylthiouracil). Food Qual. Prefer. 2004, 15, 147–154. [Google Scholar] [CrossRef]
- Green, B.G.; Dalton, P.; Cowart, B.; Shaffer, G.; Rankin, K.; Higgins, J. Evaluating the ‘labeled magnitude scale’ for measuring sensations of taste and smell. Chem. Senses 1996, 21, 323–334. [Google Scholar] [CrossRef]
- Goldstein, G.L.; Daun, H.; Tepper, B.J. Influence of PROP taster status and maternal variables on energy intake and body weight of pre-adolescents. Physiol. Behav. 2007, 90, 809–817. [Google Scholar] [CrossRef]
- Martin, C.; Visalli, M.; Lange, C.; Schlich, P.; Issanchou, S. Creation of a food taste database using an in-home “taste” profile method. Food Qual. Prefer. 2014, 36, 70–80. [Google Scholar] [CrossRef]
- Totland, T.H.; Benedicte, K.M.; Ninna, L.H.; Kaja-Marie, H.K.; Nikolai, A.L.; Jannicke, B.M.; Anne-Marte, W.J.; Elin, B.L.; Lene, F.A. Norkost 3; Directorate of Health and Food Safety Authority Norway: Norway, Oslo, 2012. [Google Scholar]
- Endrizzi, I.; Menichelli, E.; Johansen, S.; Olsen, N.V.; Næs, T. Handling of individual differences in rating-based conjoint analysis. Food Qual. Prefer. 2011, 22, 241–254. [Google Scholar] [CrossRef]
- Chamoun, E.; Liu, A.A.S.; Duizer, L.M.; Darlington, G.; Duncan, A.M.; Haines, J.; Ma, D.W. Taste sensitivity and taste preference measures are correlated in healthy young adults. Chem. Senses 2019, 44, 129–134. [Google Scholar] [CrossRef] [PubMed]
- Mojet, J.; Christ-Hazelhof, E.; Heidema, J. Taste perception with age: Pleasantness and its relationships with threshold sensitivity and supra-threshold intensity of five taste qualities. Food Qual. Prefer. 2005, 16, 413–423. [Google Scholar] [CrossRef]
- ISO. ISO 3972 methodology of sensory analysis. In Method of Investigating Sensitivity of Taste; The International Organization for Standardization: Geneva, Switzerland, 2011. [Google Scholar]
- Laureati, M.; Pagliarini, E. Chapter 13—New developments in sensory and consumer research with children. In Methods in Consumer Research; Ares, G., Varela, P., Eds.; Woodhead Publishing: Cambridge, UK, 2018; Volume 2, pp. 321–353. [Google Scholar]
- Keller, K.L.; Adise, S. Variation in the ability to taste bitter thiourea compounds: Implications for food acceptance, dietary intake, and obesity risk in children. Annu. Rev. Nutr. 2016, 36, 157–182. [Google Scholar] [CrossRef] [PubMed]
- Tepper, B.J.; Melis, M.; Koelliker, Y.; Gasparini, P.; Ahijevych, K.; Barbarossa, I.T. Factors influencing the phenotypic characterization of the oral marker, PROP. Nutrients 2017, 9, 1275. [Google Scholar] [CrossRef] [PubMed]
- Borazon, E.Q.; Villarino, B.J.; Magbuhat, R.M.T.; Sabandal, M.L. Relationship of PROP (6-n-propylthiouracil) taster status with body mass index, food preferences, and consumption of Filipino adolescents. Food Res. Int. 2012, 47, 229–235. [Google Scholar] [CrossRef]
- Mennella, J.A.; Pepino, M.Y.; Duke, F.F.; Reed, D.R. Age modifies the genotype-phenotype relationship for the bitter receptor TAS2R38. BMC Genet. 2010, 11, 60. [Google Scholar] [CrossRef] [PubMed]
- Meyerhof, W.; Batram, C.; Kuhn, C.; Brockhoff, A.; Chudoba, E.; Bufe, B.; Appendino, G.; Behrens, M. The molecular receptive ranges of human TAS2R bitter taste receptors. Chem. Senses 2010, 35, 157–170. [Google Scholar] [CrossRef]
- Hayes, J.E.; Feeney, E.; Nolden, A.A.; McGeary, J.E. Quinine bitterness and grapefruit liking associate with allelic variants in TAS2R31. Chem. Senses 2015, 40, 437–443. [Google Scholar] [CrossRef]
- Roura, E.; Aldayyani, A.; Thavaraj, P.; Prakash, S.; Greenway, D.; Thomas, W.G.; Meyerhof, W.; Roudnitzky, N.; Foster, S.R. Variability in human bitter taste sensitivity to chemically diverse compounds can be accounted for by differential TAS2R activation. Chem. Senses 2015, 40, 427–435. [Google Scholar] [CrossRef] [PubMed]
- Jane, L.E.; Noble, A.C. Comparison of bitterness of caffeine and quinine by a time—Intensity procedure. Chem. Senses 1986, 11, 339–345. [Google Scholar]
- Heinze, J.M.; Preissl, H.; Fritsche, A.; Frank, S. Controversies in fat perception. Physiol. Behav. 2015, 152, 479–493. [Google Scholar] [CrossRef] [PubMed]
- Spence, C. Do men and women really live in different taste worlds? Food Qual. Prefer. 2019, 73, 38–45. [Google Scholar] [CrossRef]
- Ohla, K.; Lundström, J.N. Sex differences in chemosensation: Sensory or emotional? Front. Hum. Neurosci. 2013, 7, 607. [Google Scholar] [CrossRef] [PubMed]
- Michon, C.; O’Sullivan, M.; Delahunty, C.; Kerry, J.P.; O’Sullivan, M.G. The investigation of gender-related sensitivity differences in food perception. J. Sens. Stud. 2009, 24, 922–937. [Google Scholar] [CrossRef]
- Pingel, J.; Ostwald, J.; Pau, H.W.; Hummel, T.; Just, T. Normative data for a solution-based taste test. Eur. Arch. Oto-Rhino-L 2010, 267, 1911–1917. [Google Scholar] [CrossRef]
- Bolhuis, D.P.; Costanzo, A.; Keast, R. Preference and perception of fat in salty and sweet foods. Food Qual. Prefer. 2018, 64, 131–137. [Google Scholar] [CrossRef]
- Forestell, A.C.; Mennella, J.A. The ontology of taste perception and preference throughout childhood. In Handbook of Olfaction and Gustation; Doty, R.L., Ed.; John Wiley & Sons Inc.: Hoboken, NJ, USA, 2015. [Google Scholar]
- Kurihara, K. Umami the fifth basic taste: History of studies on receptor mechanisms and role as a food flavor. BioMed Res. Int. 2015, 2015, 189402. [Google Scholar] [CrossRef]
- Shigemura, N.; Shirosaki, S.; Sanematsu, K.; Yoshida, R.; Ninomiya, Y. Genetic and molecular basis of individual differences in human umami taste perception. PLoS ONE 2009, 4, e6717. [Google Scholar] [CrossRef]
- Puputti, S.; Hoppu, U.; Sandell, M.A. Taste sensitivity is associated with food consumption behavior but not with recalled pleasantness. Foods 2019, 8, 444. [Google Scholar] [CrossRef] [PubMed]
- Pangborn, R.M.; Pecore, S.D. Taste perception of sodium chloride in relation to dietary intake of salt. Am. J. Clin. Nutr. 1982, 35, 510–520. [Google Scholar] [CrossRef] [PubMed]
- Boesveldt, S.; Bobowski, N.; McCrickerd, K.; Maître, I.; Sulmont-Rossé, C.; Forde, C. The changing role of the senses in food choice and food intake across the lifespan. Food Qual. Prefer. 2018, 68, 80–89. [Google Scholar] [CrossRef]
- Nicklaus, S. The role of food experiences during early childhood in food pleasure learning. Appetite 2016, 104, 3–9. [Google Scholar] [CrossRef]
- Jilani, H.; Intemann, T.; Bogl, L.H.; Eiben, G.; Molnár, D.; Moreno, L.A.; Pala, V.; Russo, P.; Siani, A.; Solea, A.; et al. Familial aggregation and socio-demographic correlates of taste preferences in European children. BMC Nutr. 2017, 3, 87. [Google Scholar] [CrossRef]
- Laureati, M.; Pagliarini, E. The effect of context on children’s eating behavior. In Context; Meiselman, H.L., Ed.; Woodhead Publishing: Cambridge, UK, 2019; pp. 287–305. [Google Scholar]
- Bolhuis, D.P.; Newman, L.P.; Keast, R. Effects of salt and fat combinations on taste preference and perception. Chem. Senses 2015, 41, 189–195. [Google Scholar] [CrossRef]
- Liang, L.C.; Sakimura, J.; May, D.; Breen, C.; Driggin, E.; Tepper, B.J.; Chung, W.K.; Keller, K.L. Fat discrimination: A phenotype with potential implications for studying fat intake behaviors and obesity. Physiol. Behav. 2011, 105, 470–475. [Google Scholar] [CrossRef]
- Lim, J.; Urban, L.; Green, B.G. Measures of individual differences in taste and creaminess perception. Chem. Senses 2008, 33, 493–501. [Google Scholar] [CrossRef]
- Drewnowski, A.; Henderson, S.A.; Barratt-Fornell, A. Genetic sensitivity to 6-n-propylthiouracil and sensory responses to sugar and fat mixtures. Physiol. Behav. 1997, 63, 771–777. [Google Scholar] [CrossRef]
- Yackinous, C.; Guinard, J.-X. Relation between PROP taster status and fat perception, touch, and olfaction. Physiol. Behav. 2001, 72, 427–437. [Google Scholar] [CrossRef]
- Spence, C. Crossmodal correspondences: A tutorial review. Atten. Percept. Psychophys. 2011, 73, 971–995. [Google Scholar] [CrossRef] [PubMed]


| Taste | Taste Compound | Level 1 (g/L) | Level 2 (g/L) | Level 3 (g/L) | Level 4 (g/L) | Level 5 (g/L) |
|---|---|---|---|---|---|---|
| Sweet | Saccharose | 3.0 | 6.0 | 9.0 | 12.0 | 16.0 |
| Sour | Citric acid | 0.05 | 0.1 | 0.16 | 0.2 | 0.25 |
| Salty | Sodium chloride | 0.2 | 0.4 | 0.8 | 1.2 | 1.6 |
| Umami | Monosodium glutamate | 0.1 | 0.3 | 0.6 | 1.2 | 1.5 |
| Bitter | Caffeine | 0.05 | 0.1 | 0.15 | 0.2 | 0.27 |
| Bitter | Quinine | 0.0014 | 0.0017 | 0.0023 | 0.0038 | 0.006 |
| Pair | Fat Content Differences | Samples |
|---|---|---|
| Low | 0.5% | 0.5% fat milk |
| 1.0% fat milk | ||
| Medium | 1.0% | 1.0% fat milk |
| 2.0% fat milk | ||
| High | 1.5% | 2.0% fat milk |
| 3.5% fat milk |
| Variables | Participants (n = 106) |
|---|---|
| Gender | Boy 46% (n = 49) |
| Girl 54% (n = 57) | |
| Age | 10-year-old 5% (n = 5) |
| 11-year-old 94% (n = 100) | |
| 12-year-old 1% (n = 1) | |
| PROP (6-n-propylthiouracil) status | Nontaster 13% (n = 13) |
| Medium-taster 51% (n = 55) | |
| Super-taster 36% (n = 39) | |
| Hunger level (scale 1–7) * | School A (n = 61) 3.5 ± 1.4 SD |
| School B (n = 45) 3.9 ± 1.9 SD | |
| Enjoyment of the game | Not fun 6% (n = 6) |
| So so 10% (n = 11) | |
| Fun 84% (n = 89) | |
| Difficulty of the game | Difficult 15% (n = 16) |
| So so 22% (n = 23) | |
| Easy 63% (n = 67) |
| Taste | Responsiveness (mm; Mean ± SD) | Detection (Mean ± SD) | Recognition (Mean ± SD) | Liking 3 (Mean ± SD) | ||
|---|---|---|---|---|---|---|
| Level 1 | Conc. (g/L) 2 | Level 1 | Conc. (g/L) 2 | |||
| Sweetness | 44.6 ± 29.6 a,b | 1.6 ± 0.7 b,c | 4.78 ± 2.09 | 3.2 ± 1.2 c | 9.81 ± 4.0 | 4.1 ± 1.9 a,b |
| Sourness | 30.6 ± 23.9 c,d | 1.9 ± 0.9 a,b | 0.09 ± 0.05 | 3.7 ± 1.3 a,b | 0.19 ± 0.06 | 4.2 ± 1.6 a |
| Saltiness | 42.7 ± 28.2 a,b | 1.5 ± 0.7 c | 0.32 ± 0.20 | 3.4 ± 1.3 b,c | 0.97 ± 0.49 | 2.6 ± 1.5 d,e |
| Bitterness (caffeine) | 23.8 ± 25.9 d | 2.3 ± 1.4 a | 0.12 ± 0.07 | 3.9 ± 1.4 a | 0.21 ± 0.07 | 3.5 ± 1.5 b,c |
| Bitterness (quinine) | 36.9 ± 31.8 b,c | 2.2 ± 1.3 a | 0.002 ± 0.001 | 3.9 ± 1.3 a,b | 0.004 ± 0.002 | 3.1 ± 1.6 d |
| Umami | 53.8 ± 29.6 a | 1.8 ± 1.2 b,c | 0.27 ± 0.21 | 3.7 ± 1.3 a,b | 0.99 ± 0.51 | 2.2 ± 1.4 e |
| Pair | Fat Difference | Correctly Identified | Incorrectly Identified | Correctly Identified and Prefer Low-Fat Sample | Incorrectly Identified and Prefer High-Fat Sample |
|---|---|---|---|---|---|
| Low | 0.5% | 49% (n = 43) | 51% (n = 44) | 70% (n = 30) | 68% (n = 30) |
| Medium | 1.0% | 49% (n = 43) | 51% (n = 44) | 60% (n = 26) | 68% (n = 30) |
| High | 1.5% | 56% (n = 49) | 44% (n = 38) | 61% (n = 30) | 74% (n = 28) |
| Variable | Methods | Tastes | Groups | Gender Effects |
|---|---|---|---|---|
| Sensitivity |
|
|
| Boys are marginally less sensitive than girls towards sweetness and bitterness according to DT (p = 0.08) |
| Taste liking | Taste liking does not correlate with taste sensitivity |
| NA | Marginally higher liking score for sweet and bitter tastes (p < 0.1) in boys compared to girls |
| Food liking | Food liking poorly correlates to basic taste sensitivity measures except for Umami sensitivity (DT) |
|
| No gender effect observed for food liking |
© 2020 by the authors. Licensee MDPI, Basel, Switzerland. This article is an open access article distributed under the terms and conditions of the Creative Commons Attribution (CC BY) license (http://creativecommons.org/licenses/by/4.0/).
Share and Cite
Ervina, E.; Berget, I.; L. Almli, V. Investigating the Relationships between Basic Tastes Sensitivities, Fattiness Sensitivity, and Food Liking in 11-Year-Old Children. Foods 2020, 9, 1315. https://doi.org/10.3390/foods9091315
Ervina E, Berget I, L. Almli V. Investigating the Relationships between Basic Tastes Sensitivities, Fattiness Sensitivity, and Food Liking in 11-Year-Old Children. Foods. 2020; 9(9):1315. https://doi.org/10.3390/foods9091315
Chicago/Turabian StyleErvina, Ervina, Ingunn Berget, and Valérie L. Almli. 2020. "Investigating the Relationships between Basic Tastes Sensitivities, Fattiness Sensitivity, and Food Liking in 11-Year-Old Children" Foods 9, no. 9: 1315. https://doi.org/10.3390/foods9091315
APA StyleErvina, E., Berget, I., & L. Almli, V. (2020). Investigating the Relationships between Basic Tastes Sensitivities, Fattiness Sensitivity, and Food Liking in 11-Year-Old Children. Foods, 9(9), 1315. https://doi.org/10.3390/foods9091315