Suckler Bulls Slaughtered at 15 Months of Age: Effect of Different Production Systems on the Fatty Acid Profile and Selected Quality Characteristics of Longissimus Thoracis

 ,
, 

Abstract
1. Introduction
2. Materials and Methods
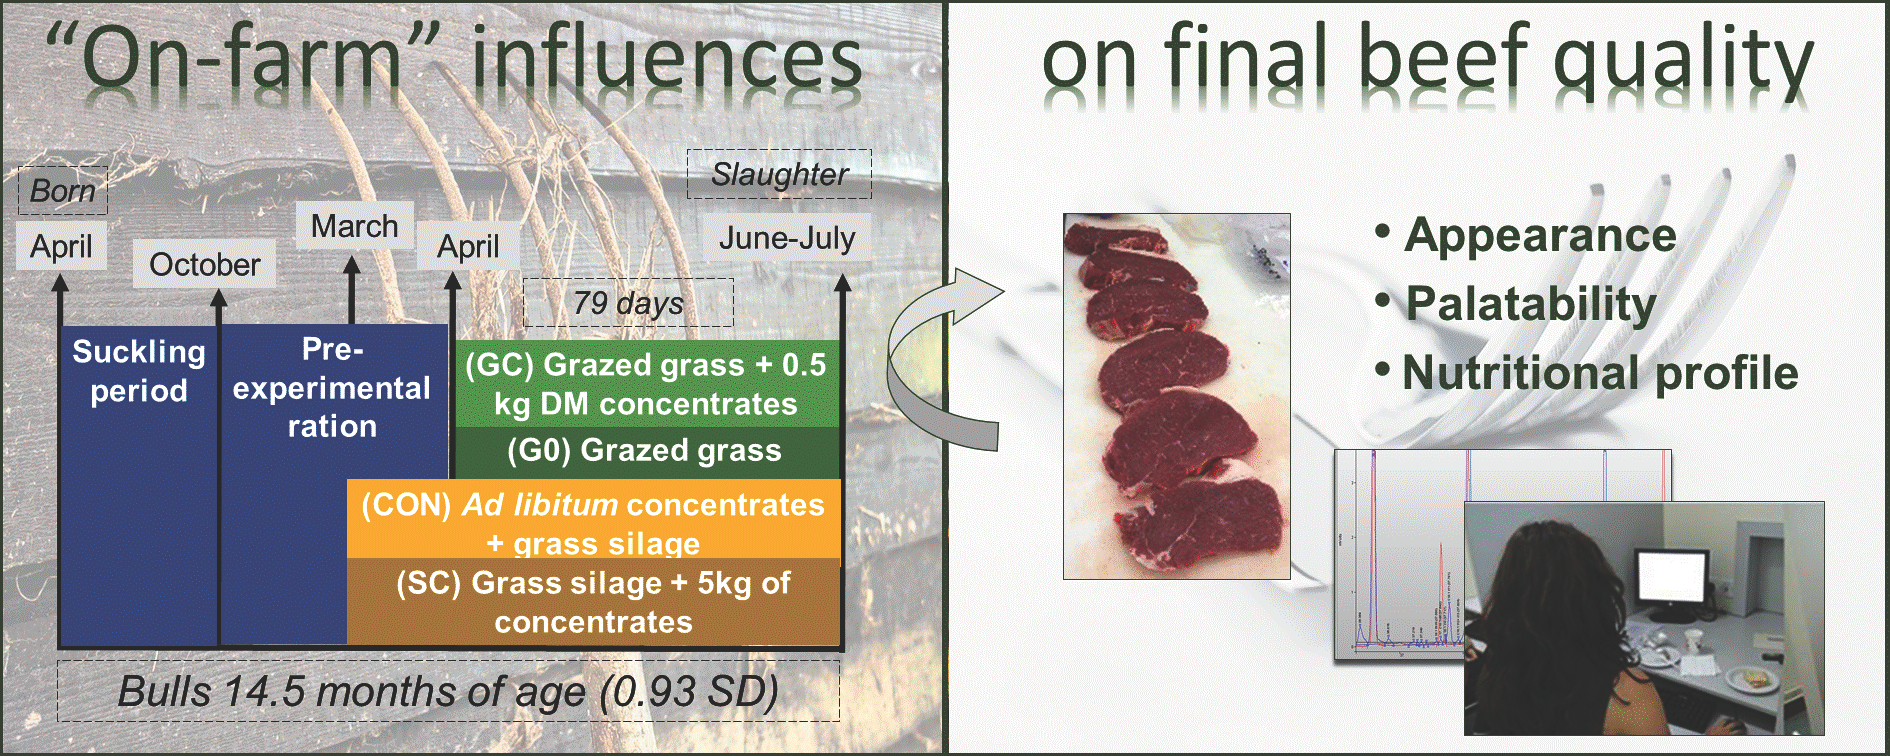
2.1. Animals, Management and Feed Analyses
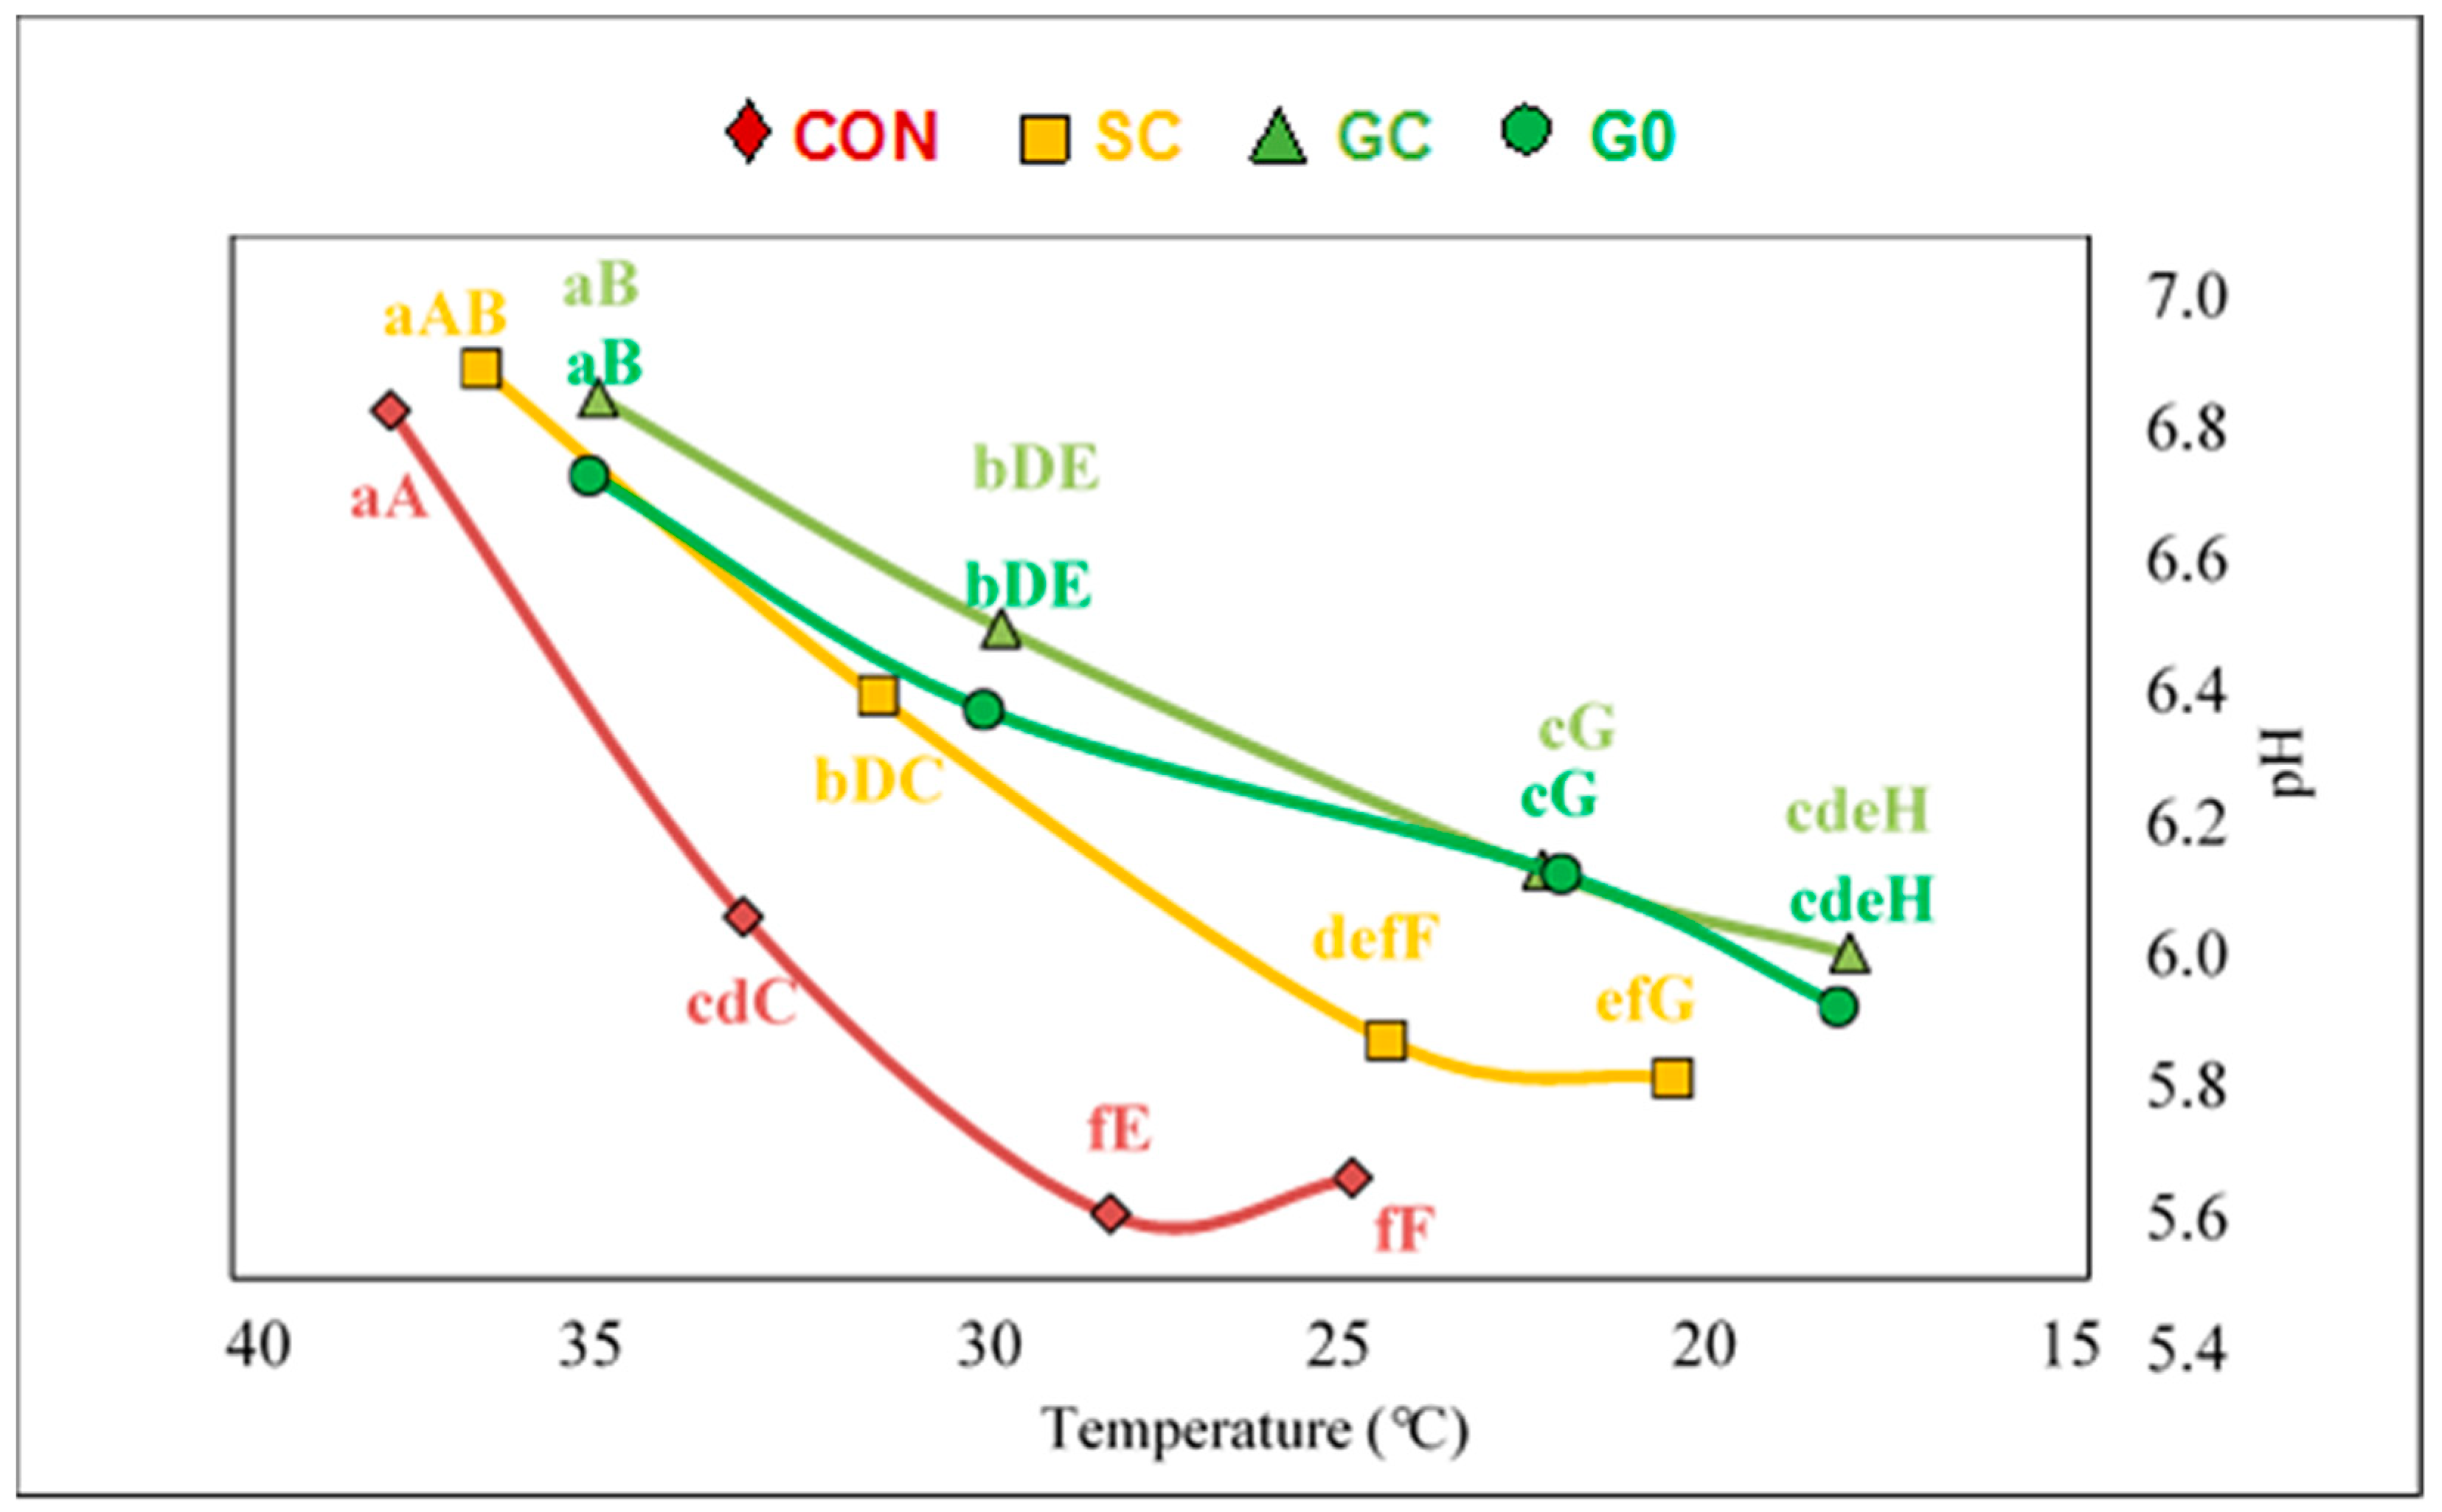
2.2. Slaughter, Sampling Procedures, PH and Colour Measurement
2.3. Meat Proximate Composition
2.4. Instrumental Texture and Sensory Evaluation
2.5. Meat Fatty Acid Analysis
2.6. Statistical Analysis
3. Results
3.1. Animal Performance, Meat Quality and Sensory Evaluation
3.2. Fatty Acid Profile
4. Discussion
4.1. Carcass Characteristics
4.2. Meat Quality
4.3. Fatty Acid Profile
5. Conclusions
Author Contributions
Funding
Acknowledgments
Conflicts of Interest
References
- Teagasc. Beef Production System Guidelines. Available online: https://www.teagasc.ie (accessed on 21 June 2019).
- Archer, J.A.; Richardson, E.C.; Herd, R.M.; Arthur, P.F. Potential for selection to improve efficiency of feed use in beef cattle: A review. Aust. J. Agric. Res. 1999, 50, 147. [Google Scholar] [CrossRef]
- Finneran, E.; Crosson, P.; O’Kiely, P.; Shalloo, L.; Forristal, D.; Wallace, M. Stochastic modelling of the yield and input price risk affecting home produced ruminant feed cost. J. Agric. Sci. 2011, 150, 123–139. [Google Scholar] [CrossRef]
- Bhandari, B.; Gillespie, J.; Scaglia, G. Labor use and profitability associated with pasture systems in grass-fed beef production. Sustain. Agric. Res. 2017, 6, 51–61. [Google Scholar] [CrossRef]
- Boogaard, B.; Boekhorst, L.; Oosting, S.; Sørensen, J. Socio-cultural sustainability of pig production: Citizen perceptions in the Netherlands and Denmark. Livest. Sci. 2011, 140, 189–200. [Google Scholar] [CrossRef]
- Musto, M.; Cardinale, D.; Lucia, P.; Faraone, D. Creating Public Awareness of How Goats Are Reared and Milk Produced May Affect Consumer Acceptability. J. Appl. Anim. Welf. Sci. 2016, 19, 2721–2734. [Google Scholar] [CrossRef] [PubMed]
- Van Wezemael, L.; Caputo, V.; Nayga, R.M., Jr.; Chryssochoidis, G.; Verbeke, W. European consumer preferences for beef with nutrition and health claims: A multi-country investigation using discrete choice experiments. Food Policy 2014, 44, 167–176. [Google Scholar] [CrossRef]
- Belew, J.; Brooks, J.; McKenna, D.; Savell, J.; Savell, J. Warner–Bratzler shear evaluations of 40 bovine muscles. Meat Sci. 2003, 64, 507–512. [Google Scholar] [CrossRef]
- Guillemin, N.; Bonnet, M.; Jurie, C.; Picard, B. Functional analysis of beef tenderness. J. Proteom. 2011, 75, 352–365. [Google Scholar] [CrossRef]
- Vestergaard, M.; Therkildsen, M.; Henckel, P.; Jensen, L.; Andersen, H.; Sejrsen, K. Influence of feeding intensity, grazing and finishing feeding on meat and eating quality of young bulls and the relationship between muscle fibre characteristics, fibre fragmentation and meat tenderness. Meat Sci. 2000, 54, 187–195. [Google Scholar] [CrossRef]
- Bonny, S.P.F.; Pethick, D.W.; Legrand, I.; Wierzbicki, J.; Allen, P.; Farmer, L.J.; Polkinghorne, R.J.; Hocquette, J.-F.; Gardner, G.E. European conformation and fat scores have no relationship with eating quality. Animal 2016, 10, 996–1006. [Google Scholar] [CrossRef]
- Noci, F.; Monahan, F.J.; French, P.; Moloney, A.P. The fatty acid composition of muscle fat and subcutaneous adipose tissue of pasture-fed beef heifers: Influence of the duration of grazing. J. Anim. Sci. 2005, 83, 1167–1178. [Google Scholar] [CrossRef] [PubMed]
- Hickey, J.M.; Keane, M.G.; Kenny, D.A.; Cromie, A.R.; Veerkamp, R.F. Genetic parameters for EUROP carcass traits within different groups of cattle in Ireland1. J. Anim. Sci. 2007, 85, 314–321. [Google Scholar] [CrossRef] [PubMed]
- Pearce, K.L.; Van De Ven, R.; Mudford, C.; Warner, R.D.; Hocking-Edwards, J.; Jacob, R.; Pethick, D.W.; Hopkins, D.L. Case studies demonstrating the benefits on pH and temperature decline of optimising medium-voltage electrical stimulation of lamb carcasses. Anim. Prod. Sci. 2010, 50, 1107–1114. [Google Scholar] [CrossRef]
- AOAC Official Methods of Analysis; Method No. 985.14; Association of Official Analytical Chemists: Gaithersburg, MD, USA, 2000.
- Folch, J.; Lees, M.; Stanley, G.H.S. A simple method for the isolation and purification of total lipides from animal tissues. J. Boil. Chem. 1957, 226, 497–509. [Google Scholar]
- AOAC Official Methods of Analysis; Method No. 992.15; Association of Official Analytical Chemist: Gaithersburg, MD, USA, 2000.
- AMSA Research Guidelines for Cookery, Sensory Evaluation and Instrumental Tenderness Measurements of Fresh Meat; American Meat Science Association: Chicago, IL, USA, 1995.
- Stone, H.; Bleibaum, R.N.; Thomas, H.A. Affective testing. In Sensory Evaluation Practices; Stone, H., Bleibaum, R.N., Thomas, H.A., Eds.; Elsevier: San Diego, CA, USA, 2012; pp. 291–325. [Google Scholar]
- Stone, H.; Sidel, J.L. Introduction to sensory evaluation. In Sensory Evaluation Practices; Stone, H., Sidel, J.L., Eds.; Elsevier Academic Press: San Diego, CA, USA, 2004; pp. 1–19. [Google Scholar]
- ISO 67.240—Sensory Analysis. 1998. Available online: https://www.une.org/encuentra-tu-norma/busca-tu-norma/norma/?c=N0040176 (accessed on 8 July 2019).
- Stone, H.; Bleibaum, R.N.; Thomas, H.A. Test Strategy and the Design of Experiments. In Sensory Evaluation Practices; Elsevier BV: Amsterdam, The Netherlands, 2012; pp. 117–165. [Google Scholar]
- AMSA Research Guidelines for Cookery, Sensory Evaluation and Instrumental Tenderness Measurements of Fresh Meat; National Livestock and Meat Board: Campaign, IL, USA, 2005; pp. 4–8.
- Shingfield, K.J.; Ahvenjärvi, S.; Toivonen, V.; Ärölä, A.; Nurmela, K.V.V.; Huhtanen, P.; Griinari, J.M. Effect of dietary fish oil on biohydrogenation of fatty acids and milk fatty acid content in cows. Anim. Sci. 2003, 77, 165–179. [Google Scholar] [CrossRef]
- Ulbricht, T.; Southgate, D. Coronary heart disease: Seven dietary factors. Lancet 1991, 338, 985–992. [Google Scholar] [CrossRef]
- French, P.; O’Riordan, E.; Monahan, F.; Caffrey, P.; Mooney, M.; Troy, D.; Moloney, A. The eating quality of meat of steers fed grass and/or concentrates. Meat Sci. 2001, 57, 379–386. [Google Scholar] [CrossRef]
- Priolo, A.; Micol, D.; Agabriel, J. Effects of grass feeding systems on ruminant meat colour and flavour. A review. Anim. Res. 2001, 50, 185–200. [Google Scholar] [CrossRef]
- French, P.; O’Riordan, E.; Monahan, F.; Caffrey, P.; Vidal, M.; Mooney, M.; Troy, D.; Moloney, A. Meat quality of steers finished on autumn grass, grass silage or concentrate-based diets. Meat Sci. 2000, 56, 173–180. [Google Scholar] [CrossRef]
- Banovic, M.; Chrysochou, P.; Grunert, K.G.; Rosa, P.J.; Gamito, P. The effect of fat content on visual attention and choice of red meat and differences across gender. Food Qual. Prefer. 2016, 52, 42–51. [Google Scholar] [CrossRef]
- Grunert, K.G. What’s in a steak? A cross-cultural study on the quality perception of beef. Food Qual. Prefer. 1997, 8, 157–174. [Google Scholar] [CrossRef]
- Grunert, K.G. Future trends and consumer lifestyles with regard to meat consumption. Meat Sci. 2006, 74, 149–160. [Google Scholar] [CrossRef] [PubMed]
- Polkinghorne, R.J.; Thompson, J.M. Meat standards and grading: A world view. Meat Sci. 2010, 86, 227–235. [Google Scholar] [CrossRef] [PubMed]
- Viljoen, H.; De Kock, H.; Webb, E.; De Kock, R. Consumer acceptability of dark, firm and dry (DFD) and normal pH beef steaks. Meat Sci. 2002, 61, 181–185. [Google Scholar] [CrossRef]
- Moran, L.; O’Sullivan, M.; Kerry, J.; Picard, B.; McGee, M.; O’Riordan, E.; Moloney, A.; Lobato, L.M.; O’Sullivan, M. Effect of a grazing period prior to finishing on a high concentrate diet on meat quality from bulls and steers. Meat Sci. 2017, 125, 76–83. [Google Scholar] [CrossRef] [PubMed]
- Field, R.A. Effect of Castration on Meat Quality and Quantity. J. Anim. Sci. 1971, 32, 849–858. [Google Scholar] [CrossRef]
- Katz, L.S. Sexual behavior of domesticated ruminants. Horm. Behav. 2007, 52, 56–63. [Google Scholar] [CrossRef]
- Vestergaard, M.; Oksbjerg, N.; Henckel, P. Influence of feeding intensity, grazing and finishing feeding on muscle fibre characteristics and meat colour of semitendinosus, longissimus dorsi and supraspinatus muscles of young bulls. Meat Sci. 2000, 54, 177–185. [Google Scholar] [CrossRef]
- Muir, P.D.; Deaker, J.M.; Bown, M.D. Effects of forage- and grain-based feeding systems on beef quality: A review. N. Z. J. Agric. Res. 1998, 41, 623–635. [Google Scholar] [CrossRef]
- Muchenje, V.; Dzama, K.; Chimonyo, M.; Strydom, P.; Hugo, A.; Raats, J. Some biochemical aspects pertaining to beef eating quality and consumer health: A review. Food Chem. 2009, 112, 279–289. [Google Scholar] [CrossRef]
- Caine, W.; Aalhus, J.; Best, D.; Dugan, M.; Jeremiah, L. Relationship of texture profile analysis and Warner-Bratzler shear force with sensory characteristics of beef rib steaks. Meat Sci. 2003, 64, 333–339. [Google Scholar] [CrossRef]
- Shackelford, S.D.; Wheeler, T.L.; Koohmaraie, M. Relationship between shear force and trained sensory panel tenderness ratings of 10 major muscles from Bos indicus and Bos taurus cattle1. J. Anim. Sci. 1995, 73, 3333–3340. [Google Scholar] [CrossRef] [PubMed]
- Hedrick, H.B.; Paterson, J.A.; Matches, A.G.; Thomas, J.D.; Morrow, R.E.; Stringer, W.G.; Lipsey, R.J. Carcass and Palatability Characteristics of Beef Produced on Pasture, Corn Silage and Corn Grain. J. Anim. Sci. 1983, 57, 791–801. [Google Scholar] [CrossRef]
- Koohmaraie, M. Effect of pH, temperature, and inhibitors on autolysis and catalytic activity of bovine skeletal muscle μ-calpain. J. Anim. Sci. 1992, 70, 3071–3080. [Google Scholar] [CrossRef] [PubMed]
- Pearson, A.M. Desirability of Beef—Its Characteristics and Their Measurement. J. Anim. Sci. 1966, 25, 843–854. [Google Scholar] [CrossRef]
- Smith, G.C.; Carpenter, Z.L. Eating Quality of Meat Animal Products and Their Fat Content, National Research Council (US). Available online: https://www.ncbi.nlm.nih.gov/books/NBK216525/ (accessed on 8 July 2019).
- Hornstein, I.; Crowe, P.F. Meat flavor—A review. J. Chromatogr. Sci. 1964, 2, 128–131. [Google Scholar] [CrossRef]
- Melton, S.L.; Amiri, M.; Davis, G.W.; Backus, W.R. Flavor and Chemical Characteristics of Ground Beef from Grass-, Forage-Grain- and Grain-Finished Steers. J. Anim. Sci. 1982, 55, 77–87. [Google Scholar] [CrossRef]
- Melton, S.L. Effects of feeds on flavor of red meat: A review. J. Anim. Sci. 1990, 68, 4421–4435. [Google Scholar] [CrossRef]
- Muir, P.D.; Smith, N.B.; Wallace, G.J.; Cruickshank, G.J.; Smith, D.R. The effect of short-term grain feeding on liveweight gain and beef quality. N. Z. J. Agric. Res. 1998, 41, 517–526. [Google Scholar] [CrossRef]
- Verbeke, W.; Pérez-Cueto, F.J.; De Barcellos, M.D.; Krystallis, A.; Grunert, K.G. European citizen and consumer attitudes and preferences regarding beef and pork. Meat Sci. 2010, 84, 284–292. [Google Scholar] [CrossRef]
- Hocquette, J.-F.; Botreau, R.; Picard, B.; Jacquet, A.; Pethick, D.W.; Scollan, N.D. Opportunities for predicting and manipulating beef quality. Meat Sci. 2012, 92, 197–209. [Google Scholar] [CrossRef]
- Van Elswyk, M.E.; McNeill, S.H. Impact of grass/forage feeding versus grain finishing on beef nutrients and sensory quality: The U.S. experience. Meat Sci. 2014, 96, 535–540. [Google Scholar] [CrossRef] [PubMed]
- Aldai, N.; Dugan, M.E.R.; Kramer, J.K.G.; Martinez, A.; López-Campos, Ó.; Mantecon, A.R.; Osoro, K. Length of concentrate finishing affects the fatty acid composition of grass-fed and genetically lean beef: An emphasis on trans-18:1 and conjugated linoleic acid profiles. Animal 2011, 5, 1643–1652. [Google Scholar] [CrossRef] [PubMed]
- Alfaia, C.P.; Alves, S.P.; Martins, S.I.; Costa, A.S.; Fontes, C.M.; Lemos, J.P.; Bessa, R.J.; Prates, J.A.; Prates, J.A.M. Effect of the feeding system on intramuscular fatty acids and conjugated linoleic acid isomers of beef cattle, with emphasis on their nutritional value and discriminatory ability. Food Chem. 2009, 114, 939–946. [Google Scholar] [CrossRef]
- Moreno, T.; Keane, M.; Noci, F.; Moloney, A. Fatty acid composition of M. Longissimus dorsi from Holstein–Friesian steers of New Zealand and European/American descent and from Belgian Blue×Holstein–Friesian steers, slaughtered at two weights/ages. Meat Sci. 2008, 78, 157–169. [Google Scholar] [CrossRef] [PubMed]
- Warren, H.; Scollan, N.; Enser, M.; Hughes, S.; Richardson, R.; Wood, J. Effects of breed and a concentrate or grass silage diet on beef quality in cattle of 3 ages. I: Animal performance, carcass quality and muscle fatty acid composition. Meat Sci. 2008, 78, 256–269. [Google Scholar] [CrossRef]
- Webb, E.; O’Neill, H. The animal fat paradox and meat quality. Meat Sci. 2008, 80, 28–36. [Google Scholar] [CrossRef]
- Braverman, N.E.; Moser, A.B. Functions of plasmalogen lipids in health and disease. Biochim. Biophys. Acta Mol. Basis Dis. 2012, 1822, 1442–1452. [Google Scholar] [CrossRef]
- Bessa, R.; Portugal, P.; Mendes, I.; Santos-Silva, J. Effect of lipid supplementation on growth performance, carcass and meat quality and fatty acid composition of intramuscular lipids of lambs fed dehydrated lucerne or concentrate. Livest. Prod. Sci. 2005, 96, 185–194. [Google Scholar] [CrossRef]
- Bauchart, D.; Roy, A.; Lorenz, S.; Chardigny, J.-M.; Ferlay, A.; Gruffat, D.; Sébédio, J.-L.; Chilliard, Y.; Durand, D. Butters Varying in trans 18:1 and cis-9, trans-11 Conjugated Linoleic Acid Modify Plasma Lipoproteins in the Hypercholesterolemic Rabbit. Lipids 2007, 42, 123–133. [Google Scholar] [CrossRef]
- Dugan, M.E.R.; Kramer, J.K.G.; Robertson, W.M.; Meadus, W.J.; Aldai, N.; Rolland, D.C. Comparing Subcutaneous Adipose Tissue in Beef and Muskox with Emphasis on trans 18:1 and Conjugated Linoleic Acids. Lipids 2007, 42, 509–518. [Google Scholar] [CrossRef] [PubMed]
- Nuernberg, K.; Dannenberger, D.; Nuernberg, G.; Ender, K.; Voigt, J.; Scollan, N.; Wood, J.; Nute, G.; Richardson, R. Effect of a grass-based and a concentrate feeding system on meat quality characteristics and fatty acid composition of longissimus muscle in different cattle breeds. Livest. Prod. Sci. 2005, 94, 137–147. [Google Scholar] [CrossRef]
- Nian, Y.; Allen, P.; Harrison, S.M.; Kerry, J.P. Effect of castration and carcass suspension method on the quality and fatty acid profile of beef from male dairy cattle. J. Sci. Food Agric. 2018, 98, 4339–4350. [Google Scholar] [CrossRef] [PubMed]
- Wood, J.; Richardson, R.; Nute, G.; Fisher, A.; Campo, M.M.; Kasapidou, E.; Sheard, P.; Enser, M. Effects of fatty acids on meat quality: A review. Meat Sci. 2004, 66, 21–32. [Google Scholar] [CrossRef]
- Moloney, F.; Yeow, T.-P.; Mullen, A.; Nolan, J.J.; Roche, H.M. Conjugated linoleic acid supplementation, insulin sensitivity, and lipoprotein metabolism in patients with type 2 diabetes mellitus. Am. J. Clin. Nutr. 2004, 80, 887–895. [Google Scholar] [CrossRef] [PubMed]
- Ip, C.; Singh, M.; Thompson, H.J.; Scimeca, J.A. Conjugated linoleic acid suppresses mammary carcinogenesis and proliferative activity of the mammary gland in the rat. Cancer Res. 1994, 54, 1212–1215. [Google Scholar] [PubMed]
- Park, Y.; Albright, K.J.; Liu, W.; Storkson, J.M.; Cook, M.E.; Pariza, M.W. Effect of conjugated linoleic acid on body composition in mice. Lipids 1997, 32, 853–858. [Google Scholar] [CrossRef] [PubMed]
- Turpeinen, A.M.; Mutanen, M.; Aro, A.; Salminen, I.; Basu, S.; Palmquist, D.L.; Griinari, J.M. Bioconversion of vaccenic acid to conjugated linoleic acid in humans. Am. J. Clin. Nutr. 2002, 76, 504–510. [Google Scholar] [CrossRef] [PubMed]
- Connor, W.E. Importance of n−3 fatty acids in health and disease. Am. J. Clin. Nutr. 2000, 71, 171S–175S. [Google Scholar] [CrossRef] [PubMed]
- Wood, J.; Enser, M.; Fisher, A.; Nute, G.; Sheard, P.; Richardson, R.; Hughes, S.; Whittington, F. Fat deposition, fatty acid composition and meat quality: A review. Meat Sci. 2008, 78, 343–358. [Google Scholar] [CrossRef]


| Grazed Grass | Grass Silage | Concentrates | |
|---|---|---|---|
| Dry matter (DM) (g/kg fresh matter) | 180 | 247 | 804 |
| pH | − | − | 3.92 |
| DM digestibility (g/kg) | 761 | 680 | − |
| Composition of DM (g/kg) | |||
| Starch | − | − | 544 |
| Ash | 112 | 92 | 55 |
| Crude protein | 163 | 130 | 144 |
| Neutral detergent fibre | 468 | 577 | 185 |
| Acid detergent fibre | − | − | 67 |
| Water soluble carbohydrate | 123 | − | − |
| Acid hydrolysis ether extract | − | − | 31 |
| Fatty acid profile (%) | |||
| 14:0 | 0.11 | 0.36 | 0.21 |
| 16:0 | 18.18 | 15.59 | 22.12 |
| 16:1 | 0.00 | 0.05 | 0.12 |
| 17:0 | 0.09 | 0.04 | 0.08 |
| 18:0 | 2.32 | 1.86 | 1.61 |
| 18:1-c11 | 0.18 | 0.69 | 0.76 |
| 18:1-nc9 | 3.00 | 2.77 | 14.33 |
| 18:2-nc6 | 13.49 | 17.50 | 54.06 |
| 18:3-n3 | 55.67 | 56.52 | 4.44 |
| 20:0 | 0.19 | 0.29 | 0.17 |
| 20:1 | 0.00 | 0.00 | 0.68 |
| 20:5-n3 | 0.51 | 0.00 | 0.32 |
| 21:0 | 0.06 | 0.00 | 0.00 |
| 22:0 | 0.66 | 0.96 | 0.24 |
| 22:1-n9 | 0.07 | 0.06 | 0.08 |
| 24:0 | 0.89 | 0.84 | 0.13 |
| Others | 4.52 | 2.47 | 0.58 |
| Variable | CON | SC | GC | G0 | SEM | P-Value |
|---|---|---|---|---|---|---|
| BW (kg) | 604 a | 557 b | 515 c | 498 c | 7.135 | <0.001 |
| Average daily weight (kg/day) | 2.00 a | 1.58 b | 1.47 b,c | 1.30 c | 0.048 | <0.001 |
| Carcass weight (kg) | 358 a | 314 b | 288 c | 277 c | 4.997 | <0.001 |
| Kill out proportion (%) | 59.2 a | 56.5 b | 56.0 b | 55.7 b | 0.320 | <0.001 |
| Fat score (1–15) | 7.27 a | 6.00 b | 4.27 c | 3.67 c | 0.231 | <0.001 |
| Conformation (1–15) | 9.93 a | 8.53 b | 8.40 b | 7.67 c | 0.168 | <0.001 |
| Crude protein (%) | 23.0 a | 22.9 a | 22.7 a | 21.6 b | 0.191 | 0.039 |
| Moisture (%) | 74.8 c | 75.2 b,c | 76.1 a,b | 76.7 a | 0.178 | <0.001 |
| Intramuscular fat (g/100 g meat) | 2.20 a | 1.85 b | 1.48 c | 1.59 b,c | 0.063 | <0.001 |
| Ultimate pH | 5.60 | 5.60 | 5.62 | 5.62 | 0.006 | 0.323 |
| L | 37.2 a | 34.7 b | 31.7 c | 32.5 c | 0.390 | <0.001 |
| a | 19.3 a | 19.2 a | 18.3 b | 18.4 b | 0.139 | 0.022 |
| b | 12.7 a,b | 12.8 a | 11.8 c | 12.2 b,c | 0.096 | 0.001 |
| Cook loss (%) | 25.7 | 27.7 | 28.6 | 27.6 | 0.369 | 0.056 |
| Warner–Bratzler shear force (N) | 35.8 | 33.6 | 35.3 | 32.5 | 0.936 | 0.587 |
| Slope (MPa) | 0.785 | 0.770 | 0.845 | 0.733 | 0.024 | 0.452 |
| Energy (J) | 0.230 | 0.229 | 0.237 | 0.219 | 0.006 | 0.733 |
| Tenderness (1–8) | 4.70 a,b | 5.22 a | 4.24 b | 4.60 b | 0.109 | <0.001 |
| Overall flavour (1–8) | 5.39 a,b | 5.74 a | 5.02 b | 5.22 b | 0.076 | 0.001 |
| Overall firmness (1–8) | 5.39 a | 5.11 a | 5.02 a,b | 4.69 b | 0.080 | 0.001 |
| Overall texture (1–8) | 5.02 a,b | 5.42 a | 4.71 b | 4.81 b | 0.087 | 0.001 |
| Overall acceptability (1–8) | 5.10 b | 5.56 a | 4.79 b | 5.02 b | 0.084 | 0.001 |
| CON | SC | GC | G0 | SEM | P-Value | |
|---|---|---|---|---|---|---|
| ∑FA | 1155 a | 823 b | 558 c | 575 c | 47.9 | <0.001 |
| SFA | 517 a | 340 b | 196 c | 208 c | 24.9 | <0.001 |
| MUFA | 478 a | 308 b | 169 c | 180 c | 25.3 | <0.001 |
| PUFA | 125 | 126 | 132 | 123 | 2.15 | 0.409 |
| trans-MUFA | 25.6 a | 17.4 b | 14.1 b | 16.2 b | 1.24 | 0.007 |
| cis-MUFA | 451 a | 291 b | 154 c | 164 c | 23.01 | <0.001 |
| PUFA-n3 | 26.4 c | 37.2 b | 43.9 a | 44.2 a | 1.31 | <0.001 |
| PUFA-n6 | 85.7 a | 77.4 a | 78.8 a | 67.7 b | 1.68 | 0.003 |
| HUFA | 35.5 b | 44.4 a | 47.0 a | 47.2 a | 1.10 | 0.001 |
| CLA | 3.62 | 2.46 | 2.15 | 2.94 | 0.212 | 0.076 |
| n6/n3 PUFA | 3.24 a | 2.16 b | 1.83 c | 1.55 d | 0.095 | <0.001 |
| t11/t10 18:1 | 0.860 b | 2.82 b | 11.67 a | 14.17 a | 1.131 | <0.001 |
| PUFA:SFA | 0.268 c | 0.423 b | 0.702 a | 0.636 a | 0.031 | <0.001 |
| Atherogenic index | 0.643 a | 0.553 b | 0.377 c | 0.408 c | 0.019 | <0.001 |
| Thrombogenic index | 1.65 a | 1.63 a | 1.36 b | 1.45 b | 0.027 | <0.001 |
| CON | SC | GC | G0 | SED | P-Value | |
|---|---|---|---|---|---|---|
| SFA | ||||||
| 8:0 | 0.017 c | 0.064 b | 0.086 a | 0.096 a | 0.006 | 0.003 |
| 10:0 | 1.01 c | 1.31 b | 1.85 a | 1.93 a | 0.083 | <0.001 |
| 11:0 | 0.125 b | 0.138 b | 0.242 a | 0.230 a | 0.013 | <0.001 |
| 12:0 | 0.066 b | 0.097 b | 0.115 a,b | 0.141 a | 0.007 | 0.002 |
| 14:0 | 2.19 a | 1.65 b | 0.940 c | 1.04 c | 0.091 | <0.001 |
| iso-15:0 | 0.159 b | 0.222 a,b | 0.251 a | 0.277 a | 0.014 | 0.045 |
| anteiso-15:0 | 0.162 b | 0.175 b | 0.218 a | 0.246 a | 0.007 | <0.001 |
| 15:0 | 0.483 | 0.536 | 0.508 | 0.537 | 0.014 | 0.529 |
| 16:0 | 22.9 a | 20.1 b | 15.2 c | 15.5 c | 0.525 | <0.001 |
| iso-17:0 2 | 1.12 a | 0.349 c | 0.875 b | 0.767 b | 0.054 | <0.001 |
| 17:0 | 1.09 c | 0.905 b | 0.670 a | 0.697 a | 0.030 | <0.001 |
| 18:0 | 13.9 | 14.2 | 13.1 | 13.4 | 0.191 | 0.229 |
| 19:0 3 | 0.151 | 0.150 | 0.143 | 0.145 | 0.005 | 0.955 |
| 20:0 | 0.234 a | 0.113 c | 0.182 b | 0.197 b | 0.029 | <0.001 |
| 24:0 | 0.107 | 0.131 | 0.100 | 0.098 | 0.030 | 0.975 |
| DMA | ||||||
| DMA 16:0 | 2.06 c | 3.14 b | 4.45 a | 4.75 a | 0.184 | <0.001 |
| DMA 18:0 | 1.20 c | 2.04 b | 2.90 a | 2.91 a | 0.122 | <0.001 |
| DMA 18:1 | 2.24 b | 2.97 b | 4.18 a | 4.55 a | 0.194 | <0.001 |
| CON | SC | GC | G0 | SEM | P-Value | |
|---|---|---|---|---|---|---|
| MUFA | ||||||
| 14:1 | 0.345 a | 0.230 b | 0.088 c | 0.103 c | 0.019 | <0.001 |
| cis MUFA | ||||||
| c7-16:1 | 0.179 b | 1.30 a | 1.54 a | 1.80 a | 0.115 | <0.001 |
| c9-16:1 | 2.77 a | 2.21 b | 1.39 c | 1.47 c | 0.100 | <0.001 |
| c5-17:1 | 0.094 d | 0.226 v | 0.363 b | 0.504 a | 0.025 | <0.001 |
| c7-17.1 | 0.110 c | 0.633 b | 0.518 a | 0.518 a | 0.029 | <0.001 |
| c9-17:1 | 0.700 a | 0.383 c | 0.602 a,b | 0.534 b | 0.024 | <0.001 |
| c10-17:1 | 0.303 a | 0.001 b | 0.093 b | <0.001 b | 0.022 | <0.001 |
| c11-17:1 | 0.798 b | 1.03 b | 1.52 a | 1.74 a | 0.075 | <0.001 |
| c9-18:1 | 27.9 a | 23.0 b | 16.2 c | 16.1 c | 0.854 | <0.001 |
| c11-18:1 | 1.53 a | 1.28 b,c | 1.36 b | 1.19 c | 0.029 | 0.001 |
| c12-18:1 | 0.314 | 0.389 | 0.376 | 0.275 | 0.023 | 0.276 |
| c13-18:1 | 0.187 a | 0.130 b | 0.098 b,c | 0.085 c | 0.010 | <0.001 |
| c14-18:1 | 0.046 | 0.131 | 0.090 | 0.100 | 0.012 | 0.144 |
| c16-18:1 | 0.106 a | 0.105 a | 0.072 b | 0.077 b | 0.005 | 0.010 |
| trans MUFA | ||||||
| t6+t8-18:1 | 0.145 | 0.112 | 0.105 | 0.090 | 0.006 | 0.064 |
| t9-18:1 | 0.145 | 0.144 | 0.115 | 0.143 | 0.006 | 0.173 |
| t10-18:1 | 0.726 a | 0.397 b | 0.230 b | 0.253 b | 0.062 | 0.023 |
| t11-18:1 | 0.546 b | 0.644 b | 1.26 a | 1.31 a | 0.084 | <0.001 |
| t12+ t13-18:1 | 0.159 a | 0.132 a,b | 0.092 b | 0.103 b | 0.007 | 0.028 |
| t15-18:1 2 | 0.024 b | 0.084 a | 0.197 a | 0.343 a | 0.039 | 0.017 |
| t16-18:1 | 0.205 a | 0.102 b | 0.097 b | 0.085 b | 0.013 | 0.070 |
| n-9 | ||||||
| 20:1n-9 | 0.147 | 0.136 | 0.122 | 0.123 | 0.005 | 0.291 |
| 22:1n-9 | 0.053 b | 0.114 a | 0.131 a | 0.107 a | 0.008 | 0.013 |
| 24:1n-9 | 0.069 | 0.061 | 0.122 | 0.092 | 0.020 | 0.639 |
| CON | SC | GC | G0 | SEM | P-Value | |
|---|---|---|---|---|---|---|
| PUFA | ||||||
| 20:2 | 0.071 c | 0.109 a,b | 0.130 a | 0.092 b | 0.006 | 0.009 |
| 22:2 | 0.132 b | 0.182 b | 0.271 a | 0.267 a | 0.014 | <0.001 |
| Non conjugated 18:2 | ||||||
| 9t,12t-18:2 | 0.128 | 0.110 | 0.107 | 0.094 | 0.006 | 0.444 |
| t10,c15-18:2 | 0.133 | 0.131 | 0.123 | 0.148 | 0.006 | 0.612 |
| t11,c15-18:2 | 0.127 | 0.159 | 0.149 | 0.132 | 0.009 | 0.555 |
| c9,c15-18:2 2 | 0.214 b | 0.254 b | 0.341 a | 0.348 a | 0.013 | <0.001 |
| CLA | ||||||
| c9,t11-CLA | 0.286 b | 0.279 b | 0.364 a,b | 0.471 a | 0.021 | 0.003 |
| t10,c12-CLA | 0.025 | 0.008 | 0.010 | 0.009 | 0.003 | 0.167 |
| n-6 | ||||||
| 18:2n-c6 | 6.04 b | 6.95 b | 9.94 a | 8.04 a,b | 0.338 | <0.001 |
| 18:3n-6 | 0.063 b | 0.100 b | 0.216 a | 0.190 a | 0.016 | 0.004 |
| 20:3n-6 | 0.421 c | 0.558 b | 0.804 a | 0.714 a | 0.029 | <0.001 |
| 20:4n-6 | 1.58 c | 2.32 b | 3.30 a | 3.30 a | 0.131 | <0.001 |
| n-3 | ||||||
| 18:3n-3 | 0.790 c | 1.58 b | 3.06 a | 3.15 a | 0.150 | <0.001 |
| 20:3n-3 | 0.076 | 0.046 | 0.087 | 0.069 | 0.007 | 0.130 |
| 22:5n-3 | 0.718 c | 1.30 b | 2.06 a | 2.15 a | 0.127 | <0.001 |
| 22:6n-3 | 0.106 | 0.461 | 0.444 | 0.365 | 0.068 | 0.315 |
| 20:5n-3 | 0.718 c | 1.29 b,a | 2.06 a | 2.15 a | 0.102 | <0.001 |
| n-9 | ||||||
| 20:3n-9 | 0.135 d | 0.229 c | 0.340 b | 0.398 a | 0.016 | <0.001 |
© 2019 by the authors. Licensee MDPI, Basel, Switzerland. This article is an open access article distributed under the terms and conditions of the Creative Commons Attribution (CC BY) license (http://creativecommons.org/licenses/by/4.0/).
Share and Cite
Moran, L.; Wilson, S.S.; McElhinney, C.K.; Monahan, F.J.; McGee, M.; O’Sullivan, M.G.; O’Riordan, E.G.; Kerry, J.P.; Moloney, A.P. Suckler Bulls Slaughtered at 15 Months of Age: Effect of Different Production Systems on the Fatty Acid Profile and Selected Quality Characteristics of Longissimus Thoracis. Foods 2019, 8, 264. https://doi.org/10.3390/foods8070264
Moran L, Wilson SS, McElhinney CK, Monahan FJ, McGee M, O’Sullivan MG, O’Riordan EG, Kerry JP, Moloney AP. Suckler Bulls Slaughtered at 15 Months of Age: Effect of Different Production Systems on the Fatty Acid Profile and Selected Quality Characteristics of Longissimus Thoracis. Foods. 2019; 8(7):264. https://doi.org/10.3390/foods8070264
Chicago/Turabian StyleMoran, Lara, Shannon S. Wilson, Cormac K. McElhinney, Frank J. Monahan, Mark McGee, Maurice G. O’Sullivan, Edward G. O’Riordan, Joseph P. Kerry, and Aidan P. Moloney. 2019. "Suckler Bulls Slaughtered at 15 Months of Age: Effect of Different Production Systems on the Fatty Acid Profile and Selected Quality Characteristics of Longissimus Thoracis" Foods 8, no. 7: 264. https://doi.org/10.3390/foods8070264
APA StyleMoran, L., Wilson, S. S., McElhinney, C. K., Monahan, F. J., McGee, M., O’Sullivan, M. G., O’Riordan, E. G., Kerry, J. P., & Moloney, A. P. (2019). Suckler Bulls Slaughtered at 15 Months of Age: Effect of Different Production Systems on the Fatty Acid Profile and Selected Quality Characteristics of Longissimus Thoracis. Foods, 8(7), 264. https://doi.org/10.3390/foods8070264