Beef Tenderness Prediction by a Combination of Statistical Methods: Chemometrics and Supervised Learning to Manage Integrative Farm-To-Meat Continuum Data


Abstract
1. Introduction
2. Materials and Methods
2.1. Experimental Design and Animal Characteristics and Rearing Factors
- (i)
- Questions related to the finishing period: part of hay, haylage and/or grass in the finishing diet (% w/w); daily and global amount of concentrate (kg); fattening duration (days); physical activity (% days out)
- (ii)
- Questions related to animal characteristics: animals with beef or dairy-ability; birth month/season; birth weight (kg); age at weaning (month); duration of the period between the last weaning and the beginning of the finishing period (days); age of first calving; number of calving; suckling value (0–10) and age at slaughter.
2.2. Slaughtering, Carcass Characteristics and Muscle Sampling
2.3. Muscle Characteristics Determination
- heat shock proteins (αB-crystallin, Hsp20, Hsp27, Hsp40, Hsp70-1A, Hsp70-1B, Hsp70-8 and Hsp70-Grp75);
- metabolism (Enolase 3 (ENO3) and Phosphoglucomutase 1 (PGM1));
- structure (α-actin, Myosin binding protein H (MyBP-H), Myosin light chain 1F (MyLC-1F) and Mysoin heavy chain IIx (MyHC-IIx));
- oxidative stress (Superoxide dismutase [Cu-Zn] (SOD1), Peroxiredoxin 6 (PRDX6) and Protein deglycase (DJ1));
- proteolysis (µ-calpain and m-calpain);
- apoptosis and signaling (Tumor protein p53 (TP53) and H2A Histone (H2AFX)).
- The conditions retained and suppliers for all primary antibodies dilutions and details of the protocol are exactly the same of our previous work using the same data [11]. The relative protein abundances of the biomarkers were based on the normalized volume and expressed in arbitrary units (A.U).
2.4. Meat Quality Traits
2.5. Statistical Analyses
3. Results and Discussion
- (i)
- IF (total collagen < 3.6 μg OH-proline/mg) AND (µ-calpain ≥ 169 AU) AND (ultimate pH < 5.55) THEN meat was very tender (mean WBSF values = 36.2 N/cm2, n = 12); or
- (ii)
- IF (total collagen < 3.6 μg OH-proline/mg) AND (µ-calpain < 169 AU) AND (age of weaning < 7.75 months) AND (fiber area < 3100 µm2) THEN meat was tender (mean WBSF values = 39.4 N/cm2, n = 30).
4. Conclusions
Author Contributions
Funding
Acknowledgments
Conflicts of Interest
References
- Miller, M.F.; Carr, M.A.; Ramsey, C.B.; Crockett, K.L.; Hoover, L.C. Consumer thresholds for establishing the value of beef tenderness. J. Anim. Sci. 2001, 79, 3062–3068. [Google Scholar] [CrossRef] [PubMed]
- Henchion, M.; McCarthy, M.; Resconi, V.C.; Troy, D. Meat Consumption: Trends and Quality Matters. Meat Sci. 2014, 98, 561–568. [Google Scholar] [CrossRef] [PubMed]
- Troy, D.J.; Kerry, J.P. Consumer perception and the role of science in the meat industry. Meat Sci. 2010, 86, 214–226. [Google Scholar] [CrossRef] [PubMed]
- McCarthy, S.N.; Henchion, M.; White, A.; Brandon, K.; Allen, P. Evaluation of beef eating quality by Irish consumers. Meat Sci. 2017, 132, 118–124. [Google Scholar] [CrossRef] [PubMed]
- Ferguson, D.M.; Bruce, H.L.; Thompson, J.M.; Egan, A.F.; Perry, D.; Shorthose, W.R. Factors affecting beef palatability - farmgate to chilled carcass. Aust. J. Exp. Agric. 2001, 41, 879–891. [Google Scholar] [CrossRef]
- Gagaoua, M.; Monteils, V.; Picard, B. Data from the farmgate-to-meat continuum including omics-based biomarkers to better understand the variability of beef tenderness: An integromics approach. J. Agric. Food Chem 2018, 66, 13552–13563. [Google Scholar] [CrossRef] [PubMed]
- Gagaoua, M.; Picard, B.; Monteils, V. Associations among animal, carcass, muscle characteristics, and fresh meat color traits in Charolais cattle. Meat Sci. 2018, 140, 145–156. [Google Scholar] [CrossRef] [PubMed]
- Gagaoua, M.; Picard, B.; Monteils, V. Assessment of cattle inter-individual cluster variability: The potential of continuum data from the farm-to-fork for ultimate beef tenderness management. J. Sci Food Agric. 2019, 99, 4129–4141. [Google Scholar] [CrossRef]
- Gagaoua, M.; Picard, B.; Soulat, J.; Monteils, V. Clustering of sensory eating qualities of beef: Consistencies and differences within carcass, muscle, animal characteristics and rearing factors. Livest. Sci. 2018, 214, 245–258. [Google Scholar] [CrossRef]
- Gagaoua, M.; Picard, B.; Monteils, V. Beef quality management based on the continuum data from farmgate-to-meat: Which statistical strategies for meat science metadata analyses? In Proceedings of 24. Rencontres autour des recherches Ruminants (3R), Paris, France, 5–6 December 2018; pp. 1–5. [Google Scholar]
- Gagaoua, M.; Monteils, V.; Couvreur, S.; Picard, B. Identification of Biomarkers Associated with the Rearing Practices, Carcass Characteristics, and Beef Quality: An Integrative Approach. J. Agric. Food Chem. 2017, 65, 8264–8278. [Google Scholar] [CrossRef]
- Couvreur, S.; Le Bec, G.; Micol, D.; Picard, B. Relationships Between Cull Beef Cow Characteristics, Finishing Practices and Meat Quality Traits of Longissimus thoracis and Rectus abdominis. Foods 2019, 8, 141. [Google Scholar] [CrossRef] [PubMed]
- Jurie, C.; Picard, B.; Hocquette, J.F.; Dransfield, E.; Micol, D.; Listrat, A. Muscle and meat quality characteristics of Holstein and Salers cull cows. Meat Sci. 2007, 77, 459–466. [Google Scholar] [CrossRef] [PubMed]
- Gagaoua, M.; Terlouw, E.M.C.; Micol, D.; Hocquette, J.F.; Moloney, A.P.; Nuernberg, K.; Bauchart, D.; Boudjellal, A.; Scollan, N.D.; Richardson, R.I.; et al. Sensory quality of meat from eight different types of cattle in relation with their biochemical characteristics. J. Integr. Agric. 2016, 15, 1550–1563. [Google Scholar] [CrossRef]
- Picard, B.; Barboiron, C.; Chadeyron, D.; Jurie, C. Protocol for high-resolution electrophoresis separation of myosin heavy chain isoforms in bovine skeletal muscle. Electrophoresis 2011, 32, 1804–1806. [Google Scholar] [CrossRef] [PubMed]
- Gagaoua, M.; Terlouw, E.M.C.; Picard, B. The study of protein biomarkers to understand the biochemical processes underlying beef color development in young bulls. Meat Sci. 2017, 134, 18–27. [Google Scholar] [CrossRef]
- Dubost, A.; Micol, D.; Meunier, B.; Lethias, C.; Listrat, A. Relationships between structural characteristics of bovine intramuscular connective tissue assessed by image analysis and collagen and proteoglycan content. Meat Sci. 2013, 93, 378–386. [Google Scholar] [CrossRef] [PubMed]
- Guillemin, N.; Meunier, B.; Jurie, C.; Cassar-Malek, I.; Hocquette, J.F.; Leveziel, H.; Picard, B. Validation of a Dot-Blot quantitative technique for large scale analysis of beef tenderness biomarkers. J. Physiol Pharm. 2009, 60 (Suppl. 3), 91–97. [Google Scholar]
- Folch, J.; Lees, M.; Sloane Stanley, G.H. A simple method for the isolation and purification of total lipides from animal tissues. J. Biol. Chem. 1957, 226, 497–509. [Google Scholar]
- Lepetit, J.; Culioli, J. Mechanical properties of meat. Meat Sci. 1994, 36, 203–237. [Google Scholar] [CrossRef]
- Gagaoua, M.; Terlouw, C.; Richardson, I.; Hocquette, J.F.; Picard, B. The associations between proteomic biomarkers and beef tenderness depend on the end-point cooking temperature, the country origin of the panelists and breed. Meat Sci. 2019, 157, 107871. [Google Scholar] [CrossRef]
- Picard, B.; Gagaoua, M.; Al Jammas, M.; Bonnet, M. Beef tenderness and intramuscular fat proteomic biomarkers: Effect of gender and rearing practices. J. Proteom. 2019, 200, 1–10. [Google Scholar] [CrossRef] [PubMed]
- Mehmood, T.; Liland, K.H.; Snipen, L.; Sæbø, S. A review of variable selection methods in Partial Least Squares Regression. Chemom. Intell. Lab. Syst. 2012, 118, 62–69. [Google Scholar] [CrossRef]
- Chong, I.-G.; Jun, C.-H. Performance of some variable selection methods when multicollinearity is present. Chemom. Intell. Lab. Syst. 2005, 78, 103–112. [Google Scholar] [CrossRef]
- Gagaoua, M.; Monteils, V.; Picard, B. Decision tree, a learning tool for the prediction of beef tenderness using rearing factors and carcass characteristics. J. Sci. Food Agric. 2019, 99, 1275–1283. [Google Scholar] [CrossRef] [PubMed]
- Belew, J.B.; Brooks, J.C.; McKenna, D.R.; Savell, J.W. Warner–Bratzler shear evaluations of 40 bovine muscles. Meat Sci. 2003, 64, 507–512. [Google Scholar] [CrossRef]
- Shackelford, S.D.; Morgan, J.B.; Cross, H.R.; Savell, J.W. Identification of Threshold Levels for Warner-Bratzler Shear Force in Beef Top Loin Steaks. J. Muscle Foods 1991, 2, 289–296. [Google Scholar] [CrossRef]
- Wheeler, T.L.; Shackelford, S.D.; Koohmaraie, M. Sampling, cooking, and coring effects on Warner-Bratzler shear force values in beef2. J. Anim. Sci. 1996, 74, 1553–1562. [Google Scholar] [CrossRef]
- Magnabosco, C.U.; Lopes, F.B.; Fragoso, R.R.; Eifert, E.C.; Valente, B.D.; Rosa, G.J.M.; Sainz, R.D. Accuracy of genomic breeding values for meat tenderness in Polled Nellore cattle1. J. Anim. Sci. 2016, 94, 2752–2760. [Google Scholar] [CrossRef] [PubMed]
- Jerez-Timaure, N.; Huerta-Leidenz, N.; Ortega, J.; Rodas-González, A. Prediction equations for Warner–Bratzler shear force using principal component regression analysis in Brahman-influenced Venezuelan cattle. Meat Sci. 2013, 93, 771–775. [Google Scholar] [CrossRef]
- Kass, G.V. An Exploratory Technique for Investigating Large Quantities of Categorical Data. J. R. Stat. Soc. Ser. C (Appl. Stat.) 1980, 29, 119–127. [Google Scholar] [CrossRef]
- Ture, M.; Tokatli, F.; Kurt, I. Using Kaplan–Meier analysis together with decision tree methods (C&RT, CHAID, QUEST, C4.5 and ID3) in determining recurrence-free survival of breast cancer patients. Expert Syst. Appl. 2009, 36, 2017–2026. [Google Scholar] [CrossRef]
- Nian, Y.; Zhao, M.; O’Donnell, C.P.; Downey, G.; Kerry, J.P.; Allen, P. Assessment of physico-chemical traits related to eating quality of young dairy bull beef at different ageing times using Raman spectroscopy and chemometrics. Food Res. Int. 2017, 99, 778–789. [Google Scholar] [CrossRef] [PubMed]
- Purslow, P.P. New developments on the role of intramuscular connective tissue in meat toughness. Annu. Rev. Food Sci. Technol. 2014, 5, 133–153. [Google Scholar] [CrossRef]
- Purslow, P.P. Contribution of collagen and connective tissue to cooked meat toughness; some paradigms reviewed. Meat Sci. 2018, 144, 127–134. [Google Scholar] [CrossRef] [PubMed]
- Blanco, M.; Jurie, C.; Micol, D.; Agabriel, J.; Picard, B.; Garcia-Launay, F. Impact of animal and management factors on collagen characteristics in beef: A meta-analysis approach. Animal 2013, 7, 1208–1218. [Google Scholar] [CrossRef] [PubMed]
- Dransfield, E.; Martin, J.-F.; Bauchart, D.; Abouelkaram, S.; Lepetit, J.; Culioli, J.; Jurie, C.; Picard, B. Meat quality and composition of three muscles from French cull cows and young bulls. Anim. Sci. 2003, 76, 387–399. [Google Scholar] [CrossRef]
- Lepetit, J. A theoretical approach of the relationships between collagen content, collagen cross-links and meat tenderness. Meat Sci. 2007, 76, 147–159. [Google Scholar] [CrossRef] [PubMed]
- Lepetit, J. Collagen contribution to meat toughness: Theoretical aspects. Meat Sci. 2008, 80, 960–967. [Google Scholar] [CrossRef]
- Beldarrain, L.R.; Aldai, N.; Picard, B.; Sentandreu, E.; Navarro, J.L.; Sentandreu, M.A. Use of liquid isoelectric focusing (OFFGEL) on the discovery of meat tenderness biomarkers. J. Proteom. 2018, 183, 25–33. [Google Scholar] [CrossRef]
- Gagaoua, M.; Terlouw, E.M.; Micol, D.; Boudjellal, A.; Hocquette, J.F.; Picard, B. Understanding Early Post-Mortem Biochemical Processes Underlying Meat Color and pH Decline in the Longissimus thoracis Muscle of Young Blond d’Aquitaine Bulls Using Protein Biomarkers. J. Agric. Food Chem. 2015, 63, 6799–6809. [Google Scholar] [CrossRef]
- Kendall, T.L.; Koohmaraie, M.; Arbona, J.R.; Williams, S.E.; Young, L.L. Effect of pH and ionic strength on bovine m-calpain and calpastatin activity. J. Anim. Sci. 1993, 71, 96–104. [Google Scholar] [CrossRef] [PubMed][Green Version]
- Hwang, I.H.; Thompson, J.M. The interaction between pH and temperature decline early postmortem on the calpain system and objective tenderness in electrically stimulated beef Longissimus dorsi muscle. Meat Sci. 2001, 58, 167–174. [Google Scholar] [CrossRef]
- Ouali, A.; Gagaoua, M.; Boudida, Y.; Becila, S.; Boudjellal, A.; Herrera-Mendez, C.H.; Sentandreu, M.A. Biomarkers of meat tenderness: Present knowledge and perspectives in regards to our current understanding of the mechanisms involved. Meat Sci. 2013, 95, 854–870. [Google Scholar] [CrossRef] [PubMed]
- Dransfield, E.; Etherington, D.J.; Taylor, M.A.J. Modelling post-mortem tenderisation—II: Enzyme changes during storage of electrically stimulated and non-stimulated beef. Meat Sci. 1992, 31, 75–84. [Google Scholar] [CrossRef]
- Listrat, A.; Gagaoua, M.; Picard, B. Study of the Chronology of Expression of Ten Extracellular Matrix Molecules during the Myogenesis in Cattle to Better Understand Sensory Properties of Meat. Foods 2019, 8, 97. [Google Scholar] [CrossRef] [PubMed]
- Moloney, A.P.; McGee, M. Factors Influencing the Growth of Meat Animals. In Lawrie’s Meat Science, Eight Edition; Toldrá, F., Ed.; Woodhead Publishing: Sawston, UK, 2017; pp. 19–47. [Google Scholar]
- Meyer, D.L.; Kerley, M.S.; Walker, E.L.; Keisler, D.H.; Pierce, V.L.; Schmidt, T.B.; Stahl, C.A.; Linville, M.L.; Berg, E.P. Growth rate, body composition, and meat tenderness in early vs. traditionally weaned beef calves1,2. J. Anim. Sci. 2005, 83, 2752–2761. [Google Scholar] [CrossRef] [PubMed]


| Variables | n | Mean | SD | Min | Max |
|---|---|---|---|---|---|
| Birth weight (kg) | 100 | 49.9 | 4.91 | 38 | 66 |
| Month of birth (1–12) | 110 | - | - | 1 | 12 |
| Genetic type (0: Beef or 1: Dairy) | 110 | - | - | 0 | 1 |
| Age of weaning (month) | 107 | 7.2 | 1.07 | 5 | 11 |
| Weaning duration 2 | 110 | 8.7 | 9.41 | 0 | 36 |
| Age at first calving (month) | 110 | 32.4 | 4.09 | 18 | 43 |
| Number of calving | 110 | 3 | 2.05 | 1 | 9 |
| Suckling score (0–10) | 103 | 5.9 | 1.36 | 3 | 9 |
| Fattening duration (day) | 110 | 98.6 | 29.96 | 37 | 203 |
| Haylage diet (%) | 110 | 27.8 | 36.98 | 0 | 100 |
| Hay diet (%) | 110 | 48.2 | 37.39 | 0 | 100 |
| Grass diet (%) | 110 | 24 | 32.1 | 0 | 100 |
| Daily concentrate diet (kg) | 110 | 7.7 | 2.13 | 2 | 13 |
| Global concentrate diet (kg) | 110 | 738 | 244 | 178 | 1330 |
| Activity (%) | 110 | 54 | 46.21 | 0 | 100 |
| Age at slaughter (month) | 110 | 67.5 | 24.79 | 34 | 120 |
| Variables | n | Mean | SD | Min | Max |
|---|---|---|---|---|---|
| Carcass weight (kg) | 110 | 438.2 | 36.09 | 380 | 553 |
| Conformation score (1–15 scale) 1 | 107 | 7.8 | 0.82 | 6 | 10 |
| 5th rib weight (g) | 110 | 3079 | 638 | 1793 | 5640 |
| Muscle carcass weight (g) 2 | 110 | 1882 | 403 | 1145 | 3478 |
| Fat carcass weight (g) 2 | 110 | 582 | 190 | 216 | 1338 |
| Fat-to-muscle ratio in the 5th rib (% w/w) | 110 | 31.3 | 10.17 | 16 | 85 |
| Color score of the carcass (1–5) 3 | 105 | 2.9 | 0.38 | 2 | 4 |
| Tenderness score of the carcass (1–5) 4 | 105 | 3.4 | 0.65 | 2 | 5 |
| Variables | Mean | SD | Min | Max |
|---|---|---|---|---|
| a. Contractile properties by myosin fibers characterization | ||||
| Fiber area. µm2 | 2906 | 646 | 1762 | 5203 |
| MyHC-I, % | 31.2 | 7.37 | 15.22 | 69 |
| MyHC-IIa, % | 56.6 | 12.78 | 23.76 | 84.78 |
| MyHC-IIx/b, % | 12.2 | 14.03 | 0 | 53.91 |
| b. Metabolic properties by metabolic enzyme activities | ||||
| LDH (μmol·min−1·g−1) | 1.05 | 0.33 | 0.31 | 2.26 |
| ICDH (μmol·min−1·g−1) | 703 | 109 | 491 | 939 |
| c. Intramuscular connective tissue properties | ||||
| Total collagen μg OH-prol·mg−1 DM | 3.1 | 0.42 | 2.08 | 4.06 |
| Insoluble collagen μg OH-prol·mg−1 DM | 2.4 | 0.33 | 1.61 | 3.26 |
| Soluble collagen % | 20.8 | 2.94 | 14.85 | 26.58 |
| d. Protein biomarkers quantified by Dot-Blot (in arbitrary units) | ||||
| Heat shock proteins | ||||
| CRYAB | 226.4 | 83.96 | 59.04 | 576.89 |
| Hsp20 | 164.8 | 45.45 | 59.84 | 306.74 |
| Hsp27 | 79.7 | 19.83 | 36.88 | 134.56 |
| Hsp40 | 130.5 | 20.97 | 96.09 | 280.56 |
| Hsp70-1A | 111.4 | 24.81 | 61.29 | 180.36 |
| Hsp70-1B | 120.1 | 26.16 | 70.38 | 187.36 |
| Hsp70-8 | 184.5 | 49.43 | 50.12 | 432.19 |
| Hsp70-Grp75 | 144.5 | 30.5 | 87.12 | 213.24 |
| Metabolism | ||||
| Enolase 3 (ENO3) | 144.3 | 36.22 | 78.74 | 258.12 |
| Phosphoglucomutase 1 (PGM1) | 101 | 27.26 | 46.88 | 254.36 |
| Structure | ||||
| α-Actin | 122.7 | 40.37 | 56.99 | 266.14 |
| Myosin binding protein H (MyBP-H) | 90.2 | 27.49 | 42.05 | 184.32 |
| Myosin light chain 1F (MyLC-1F) | 63.8 | 12.91 | 33.23 | 91.06 |
| Mysoin heavy chain IIx (MyHC-IIx) | 124.9 | 18.55 | 80.91 | 182.28 |
| Oxidative stress | ||||
| Superoxide dismutase [Cu-Zn] (SOD1) | 101.5 | 37.92 | 23.95 | 167.44 |
| Peroxiredoxin 6 (PRDX6) | 106.2 | 17.41 | 73.78 | 163.74 |
| Protein deglycase (DJ1) | 90.6 | 13.9 | 58.12 | 146.92 |
| Proteolysis | ||||
| µ-calpain | 151.7 | 38.24 | 75.28 | 281.08 |
| m-calpain | 96.1 | 12.62 | 64.69 | 124.75 |
| Apoptosis and signaling | ||||
| Tumor protein p53 (TP53) | 118.3 | 22.31 | 78.36 | 175.78 |
| H2A Histone Family Member X (H2AFX) | 98.7 | 19.01 | 58.72 | 153.83 |
| Variables | n | Mean | SD | Min | Max |
|---|---|---|---|---|---|
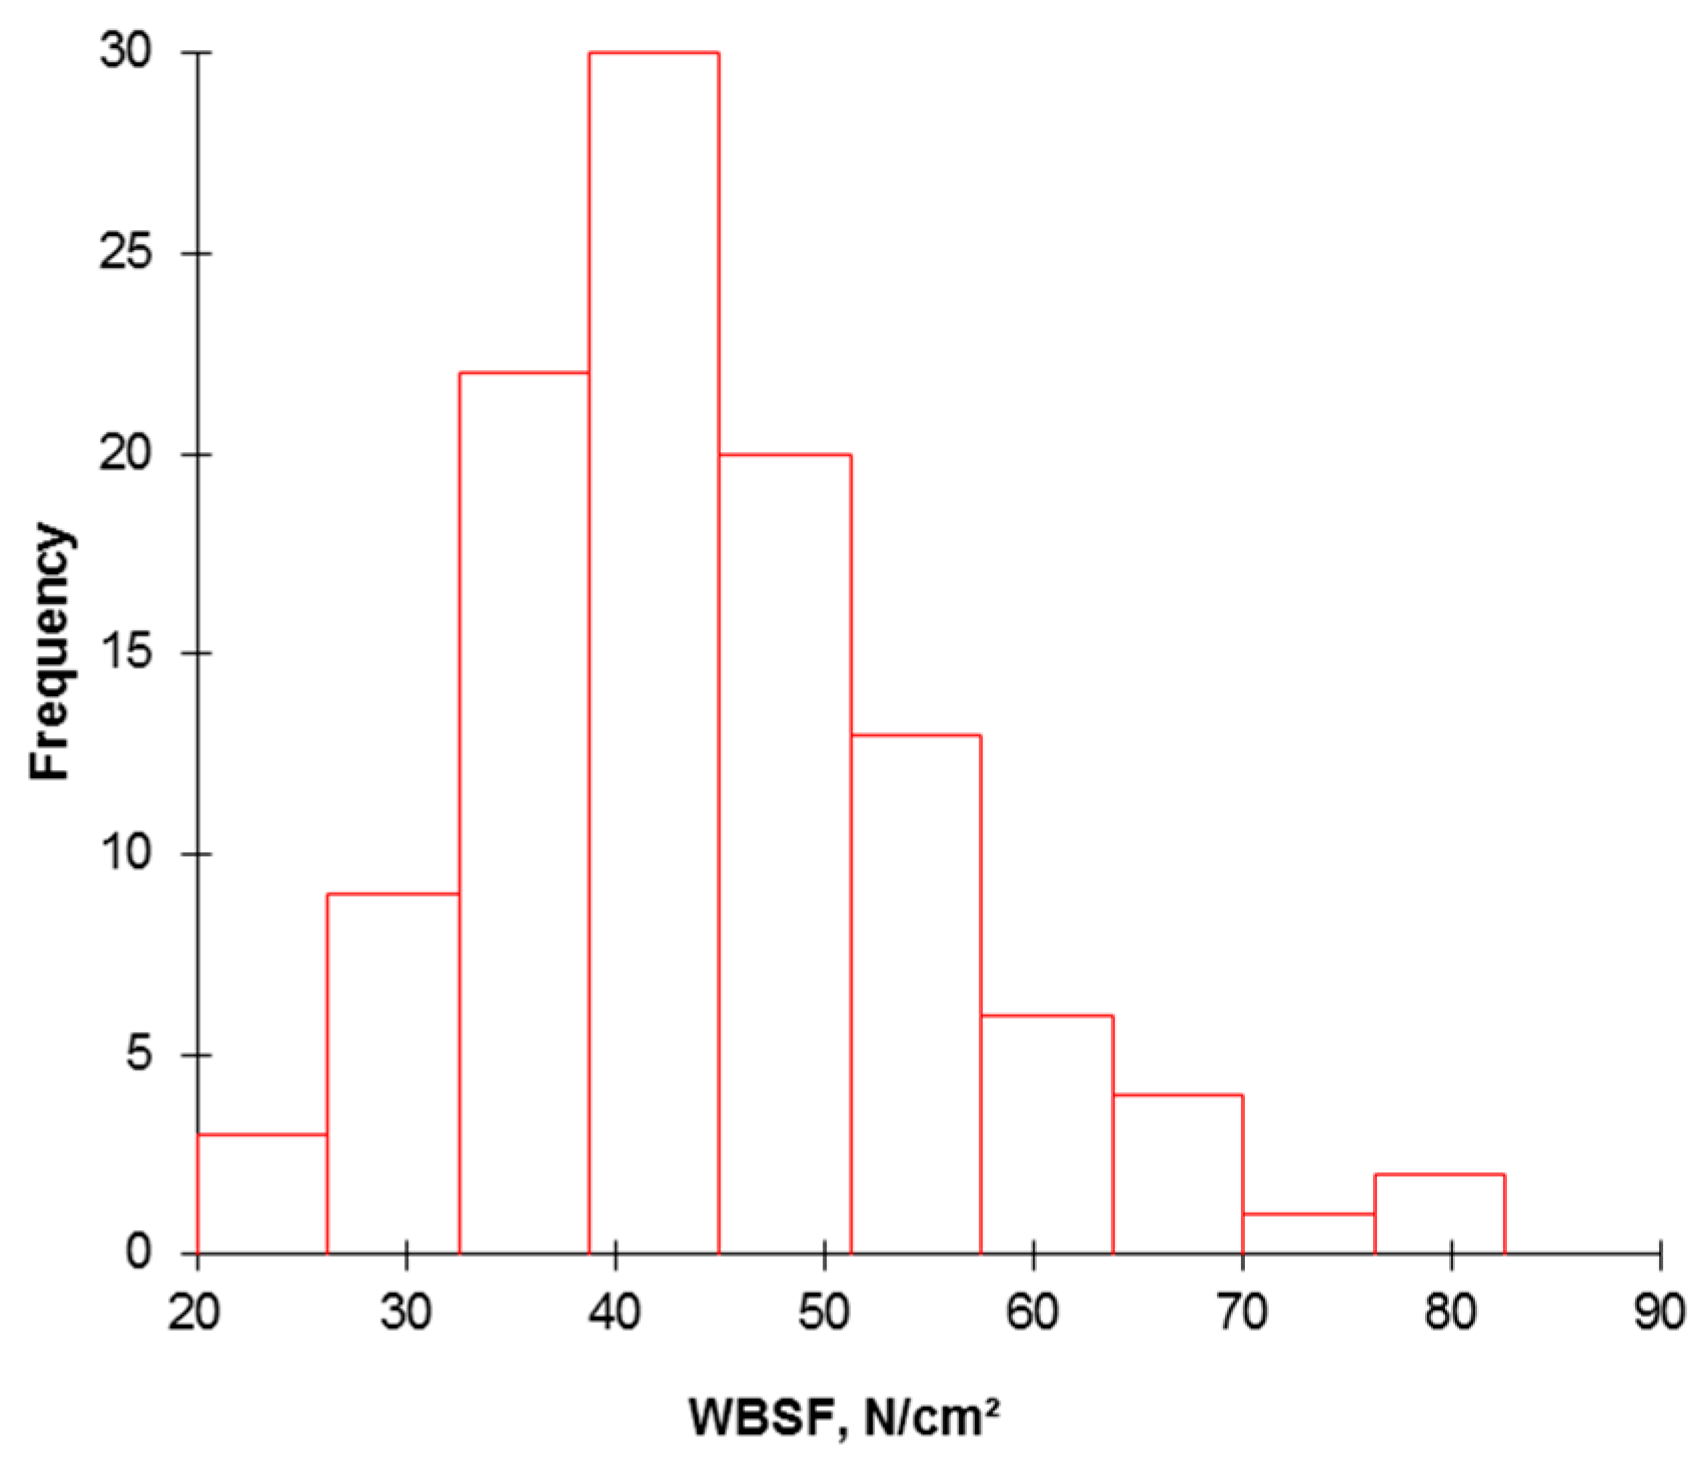
| Warner-Bratzler shear force (N/cm2) | 110 | 44.6 | 11.21 | 23.55 | 81.49 |
| Intramuscular fat (IMF) content (% w/w) | 110 | 16.3 | 6.18 | 6.15 | 40.34 |
| Ultimate pH (pHu) | 107 | 5.6 | 0.1 | 5.34 | 6.22 |
| Lightness (L*) | 110 | 39.7 | 2.3 | 34.36 | 46.84 |
| Redness (a*) | 110 | 8.8 | 1.24 | 4.17 | 11.77 |
| Yellowness (b*) | 110 | 7.4 | 1.43 | 4.02 | 11.42 |
| Variables of the Continuum from Farm-To-Meat Data | Rank | VIP |
|---|---|---|
| Farm level: rearing factors and animal characteristics | ||
| Age of weaning, month | 3 | 1.99 |
| Grass diet, % | 10 | 1.31 |
| Haylage diet, % | 14 | 1.12 |
| Birth month | 15 | 1.11 |
| Type of animal (meat or dairy) | 16 | 0.97 |
| Physical activity at farm, % | 24 | 0.84 |
| Slaughterhouse level: carcass characteristics | ||
| Color score, 1–5 scale | 5 | 1.8 |
| Carcass tenderness score, 1–5 scale | 21 | 0.9 |
| Ribeye weight, g | 20 | 0.94 |
| EUROP Conformation score, 1–15 scale | 23 | 0.87 |
| Muscle level: protein biomarkers | ||
| Fiber area, µm2 | 2 | 2.01 |
| SOD1, AU | 4 | 1.94 |
| m-calpain, AU | 6 | 1.64 |
| ICDH, μmol·min−1·g−1 | 7 | 1.57 |
| Protein deglycase (DJ-1), AU | 9 | 1.51 |
| PGM1, AU | 11 | 1.27 |
| Insoluble collagen, μg OH-proline/mg DM | 13 | 1.18 |
| HSP70-8, AU | 17 | 0.97 |
| µ-calpain, AU | 18 | 0.96 |
| Total collagen, μg OH-proline/mg DM | 19 | 0.96 |
| LDH, μmol·min−1·g−1 | 22 | 0.89 |
| Meat level: meat quality traits | ||
| pHu | 1 | 3.29 |
| Redness (a*) | 8 | 1.53 |
| Yellowness (b*) | 12 | 1.27 |
© 2019 by the authors. Licensee MDPI, Basel, Switzerland. This article is an open access article distributed under the terms and conditions of the Creative Commons Attribution (CC BY) license (http://creativecommons.org/licenses/by/4.0/).
Share and Cite
Gagaoua, M.; Monteils, V.; Couvreur, S.; Picard, B. Beef Tenderness Prediction by a Combination of Statistical Methods: Chemometrics and Supervised Learning to Manage Integrative Farm-To-Meat Continuum Data. Foods 2019, 8, 274. https://doi.org/10.3390/foods8070274
Gagaoua M, Monteils V, Couvreur S, Picard B. Beef Tenderness Prediction by a Combination of Statistical Methods: Chemometrics and Supervised Learning to Manage Integrative Farm-To-Meat Continuum Data. Foods. 2019; 8(7):274. https://doi.org/10.3390/foods8070274
Chicago/Turabian StyleGagaoua, Mohammed, Valérie Monteils, Sébastien Couvreur, and Brigitte Picard. 2019. "Beef Tenderness Prediction by a Combination of Statistical Methods: Chemometrics and Supervised Learning to Manage Integrative Farm-To-Meat Continuum Data" Foods 8, no. 7: 274. https://doi.org/10.3390/foods8070274
APA StyleGagaoua, M., Monteils, V., Couvreur, S., & Picard, B. (2019). Beef Tenderness Prediction by a Combination of Statistical Methods: Chemometrics and Supervised Learning to Manage Integrative Farm-To-Meat Continuum Data. Foods, 8(7), 274. https://doi.org/10.3390/foods8070274