Characterization of Bioactive Compounds, Mineral Content and Antioxidant Capacity in Bean Varieties Grown in Semi-Arid Conditions in Zacatecas, Mexico

Abstract
:1. Introduction
2. Materials and Methods
2.1. Plant Material
2.2. Sample Preparation.
2.3. Plant Analysis
2.3.1. Physical Properties
Seed Dimensions
Seed Weight
Seed Color
2.3.2. Physico-Chemical Properties
Moisture Determination
Ash Determination
- P = mass of the crucible with ash in grams;
- p = mass of the empty crucible in grams;
- M = mass of the sample in grams.
Fat Determination
Fiber Determination
Carbohydrate Determination
Energy Determination
3.3.3. Mineral Analysis
Microelements
Macroelements
2.3.4. Antioxidant Capacity
- Asample = Absorbance of the sample;
- Ablank = Absorbance of the blank;
- Areference = Absorbance of the reference containing the radical DPPH.
2.3.5. Reducing Power
2.3.6. Bioactive Compounds
Total Phenols
Flavonoids
Anthocyanins
2.3.7. Statistical analysis
3. Results and Discussion
3.1. Physical Characteristics
3.1.1. Grain Color
3.1.2. Length, Width, Thickness and Weight
3.2. Physico-Chemical Analysis
3.3. Mineral Analysis
3.3.1. Microelements
3.3.2. Macroelements
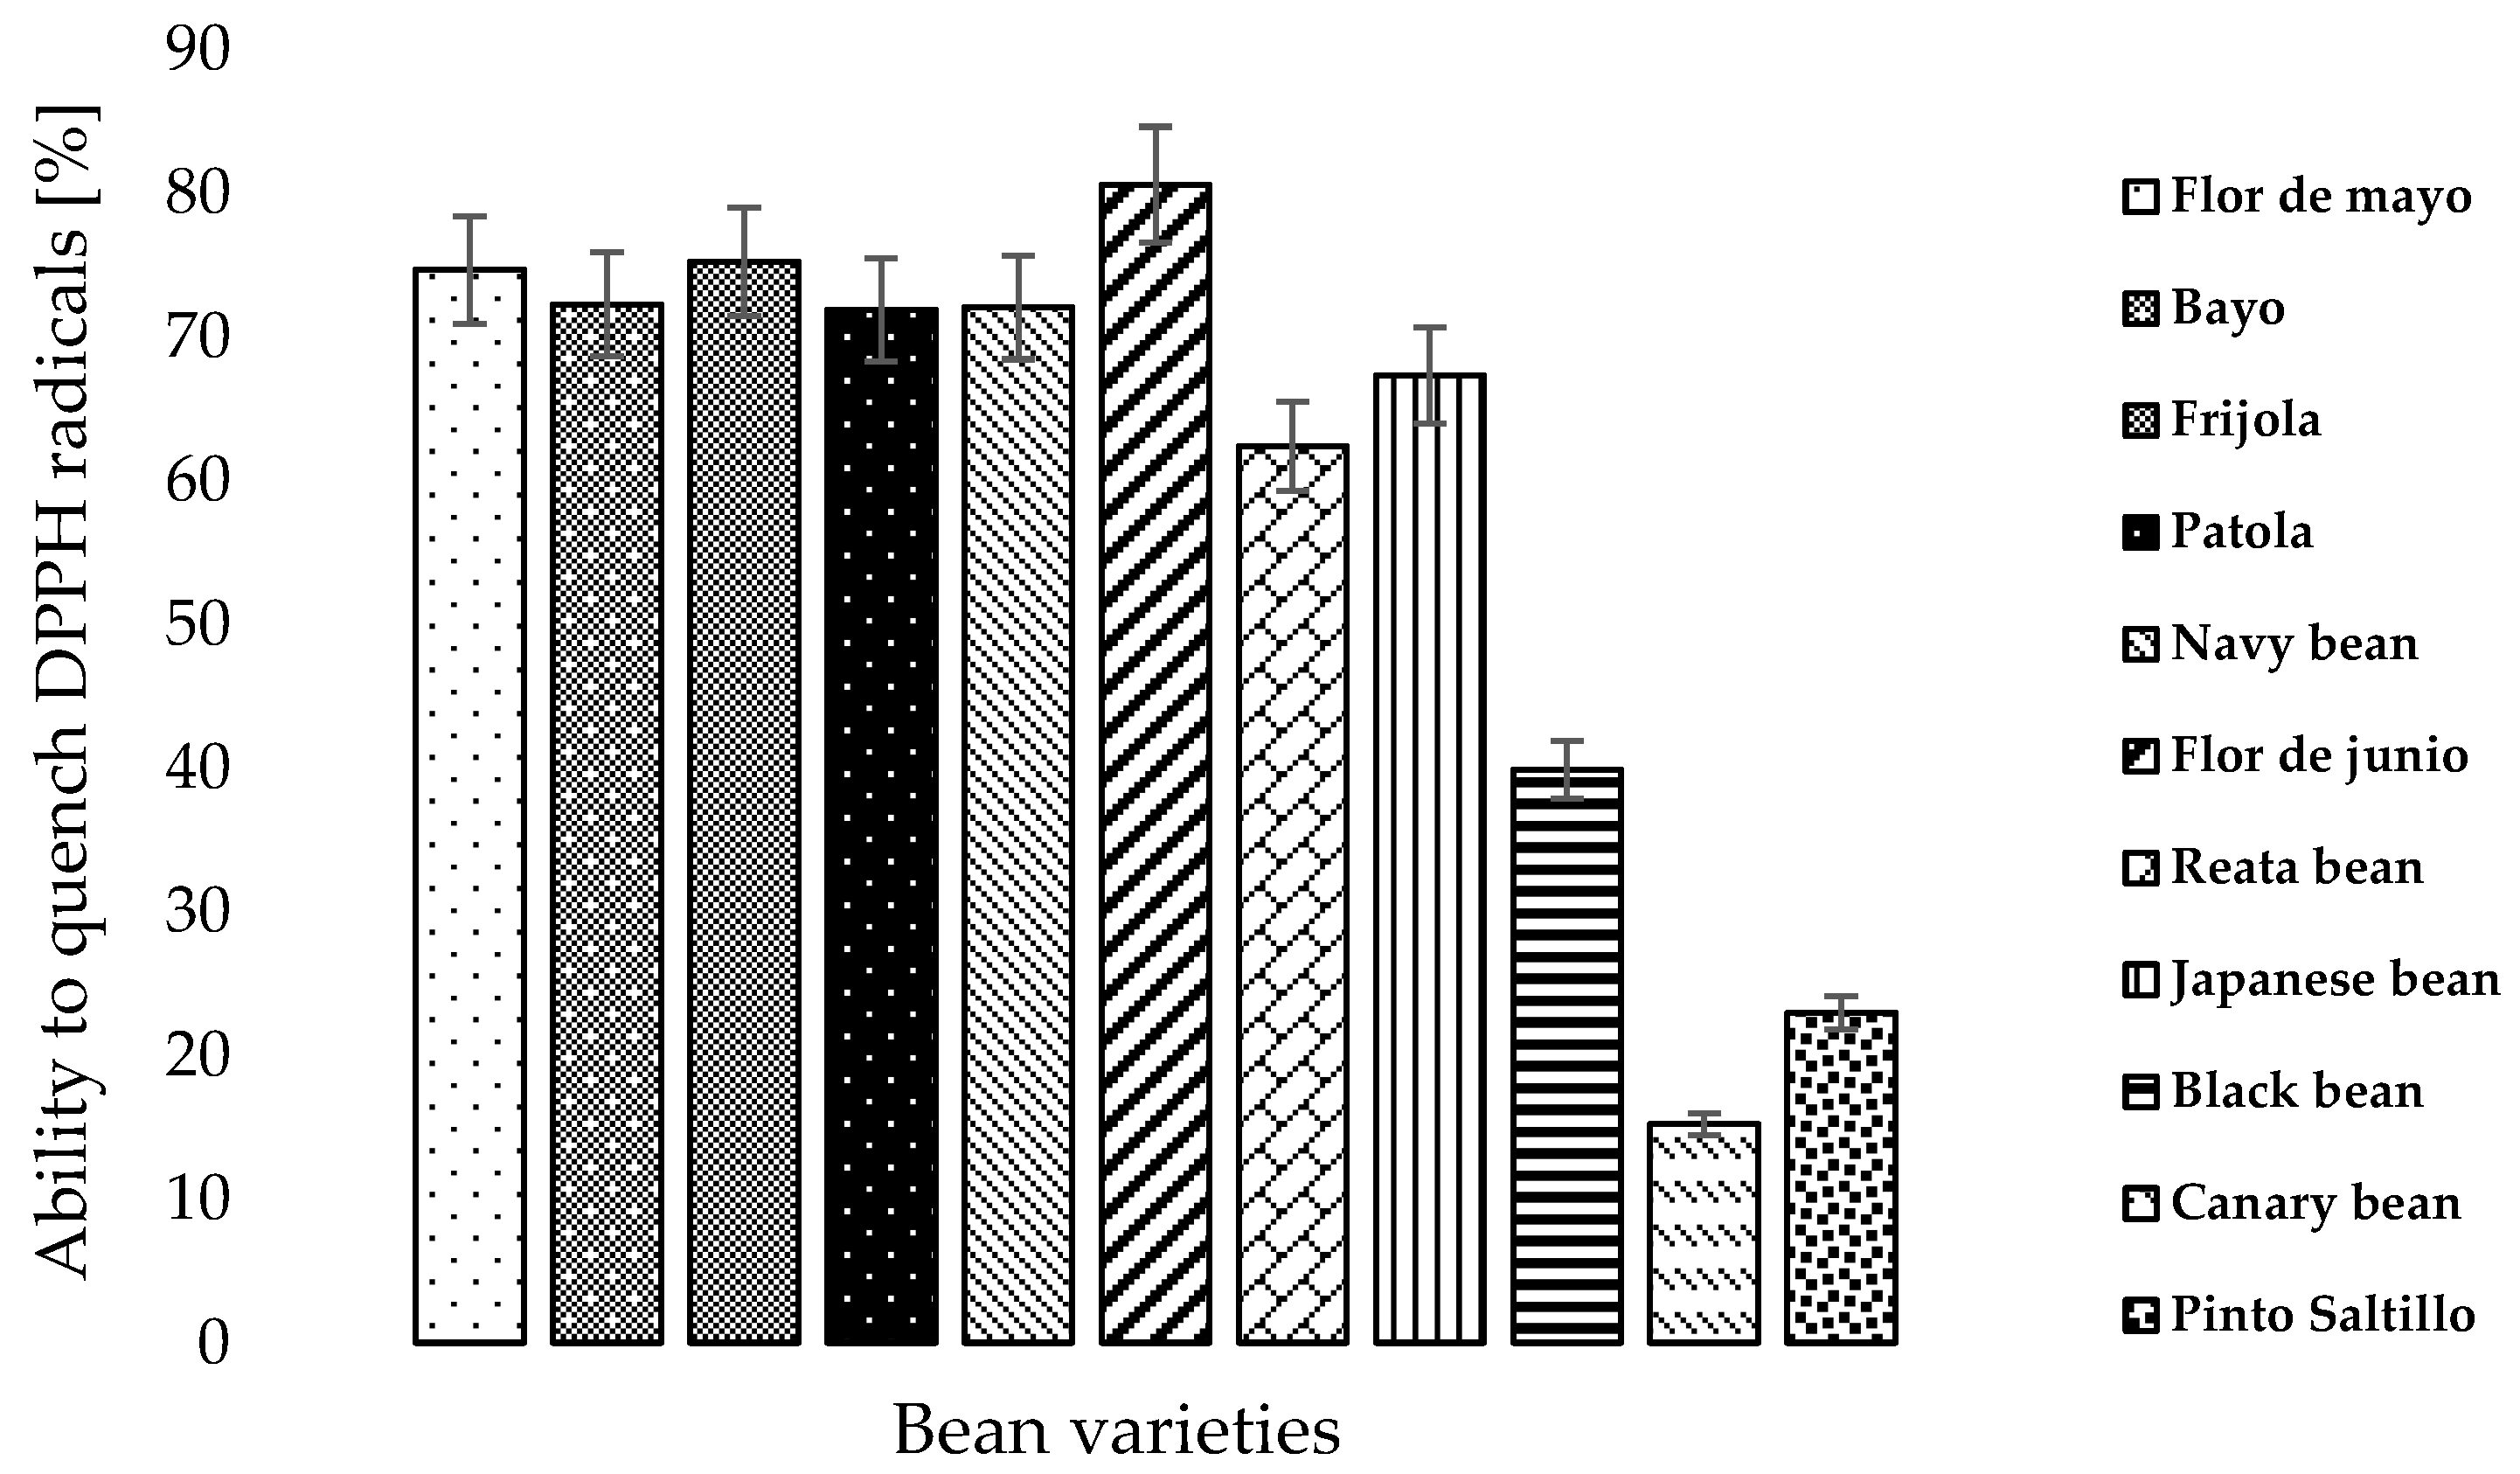
3.4. Antioxidant Capacity
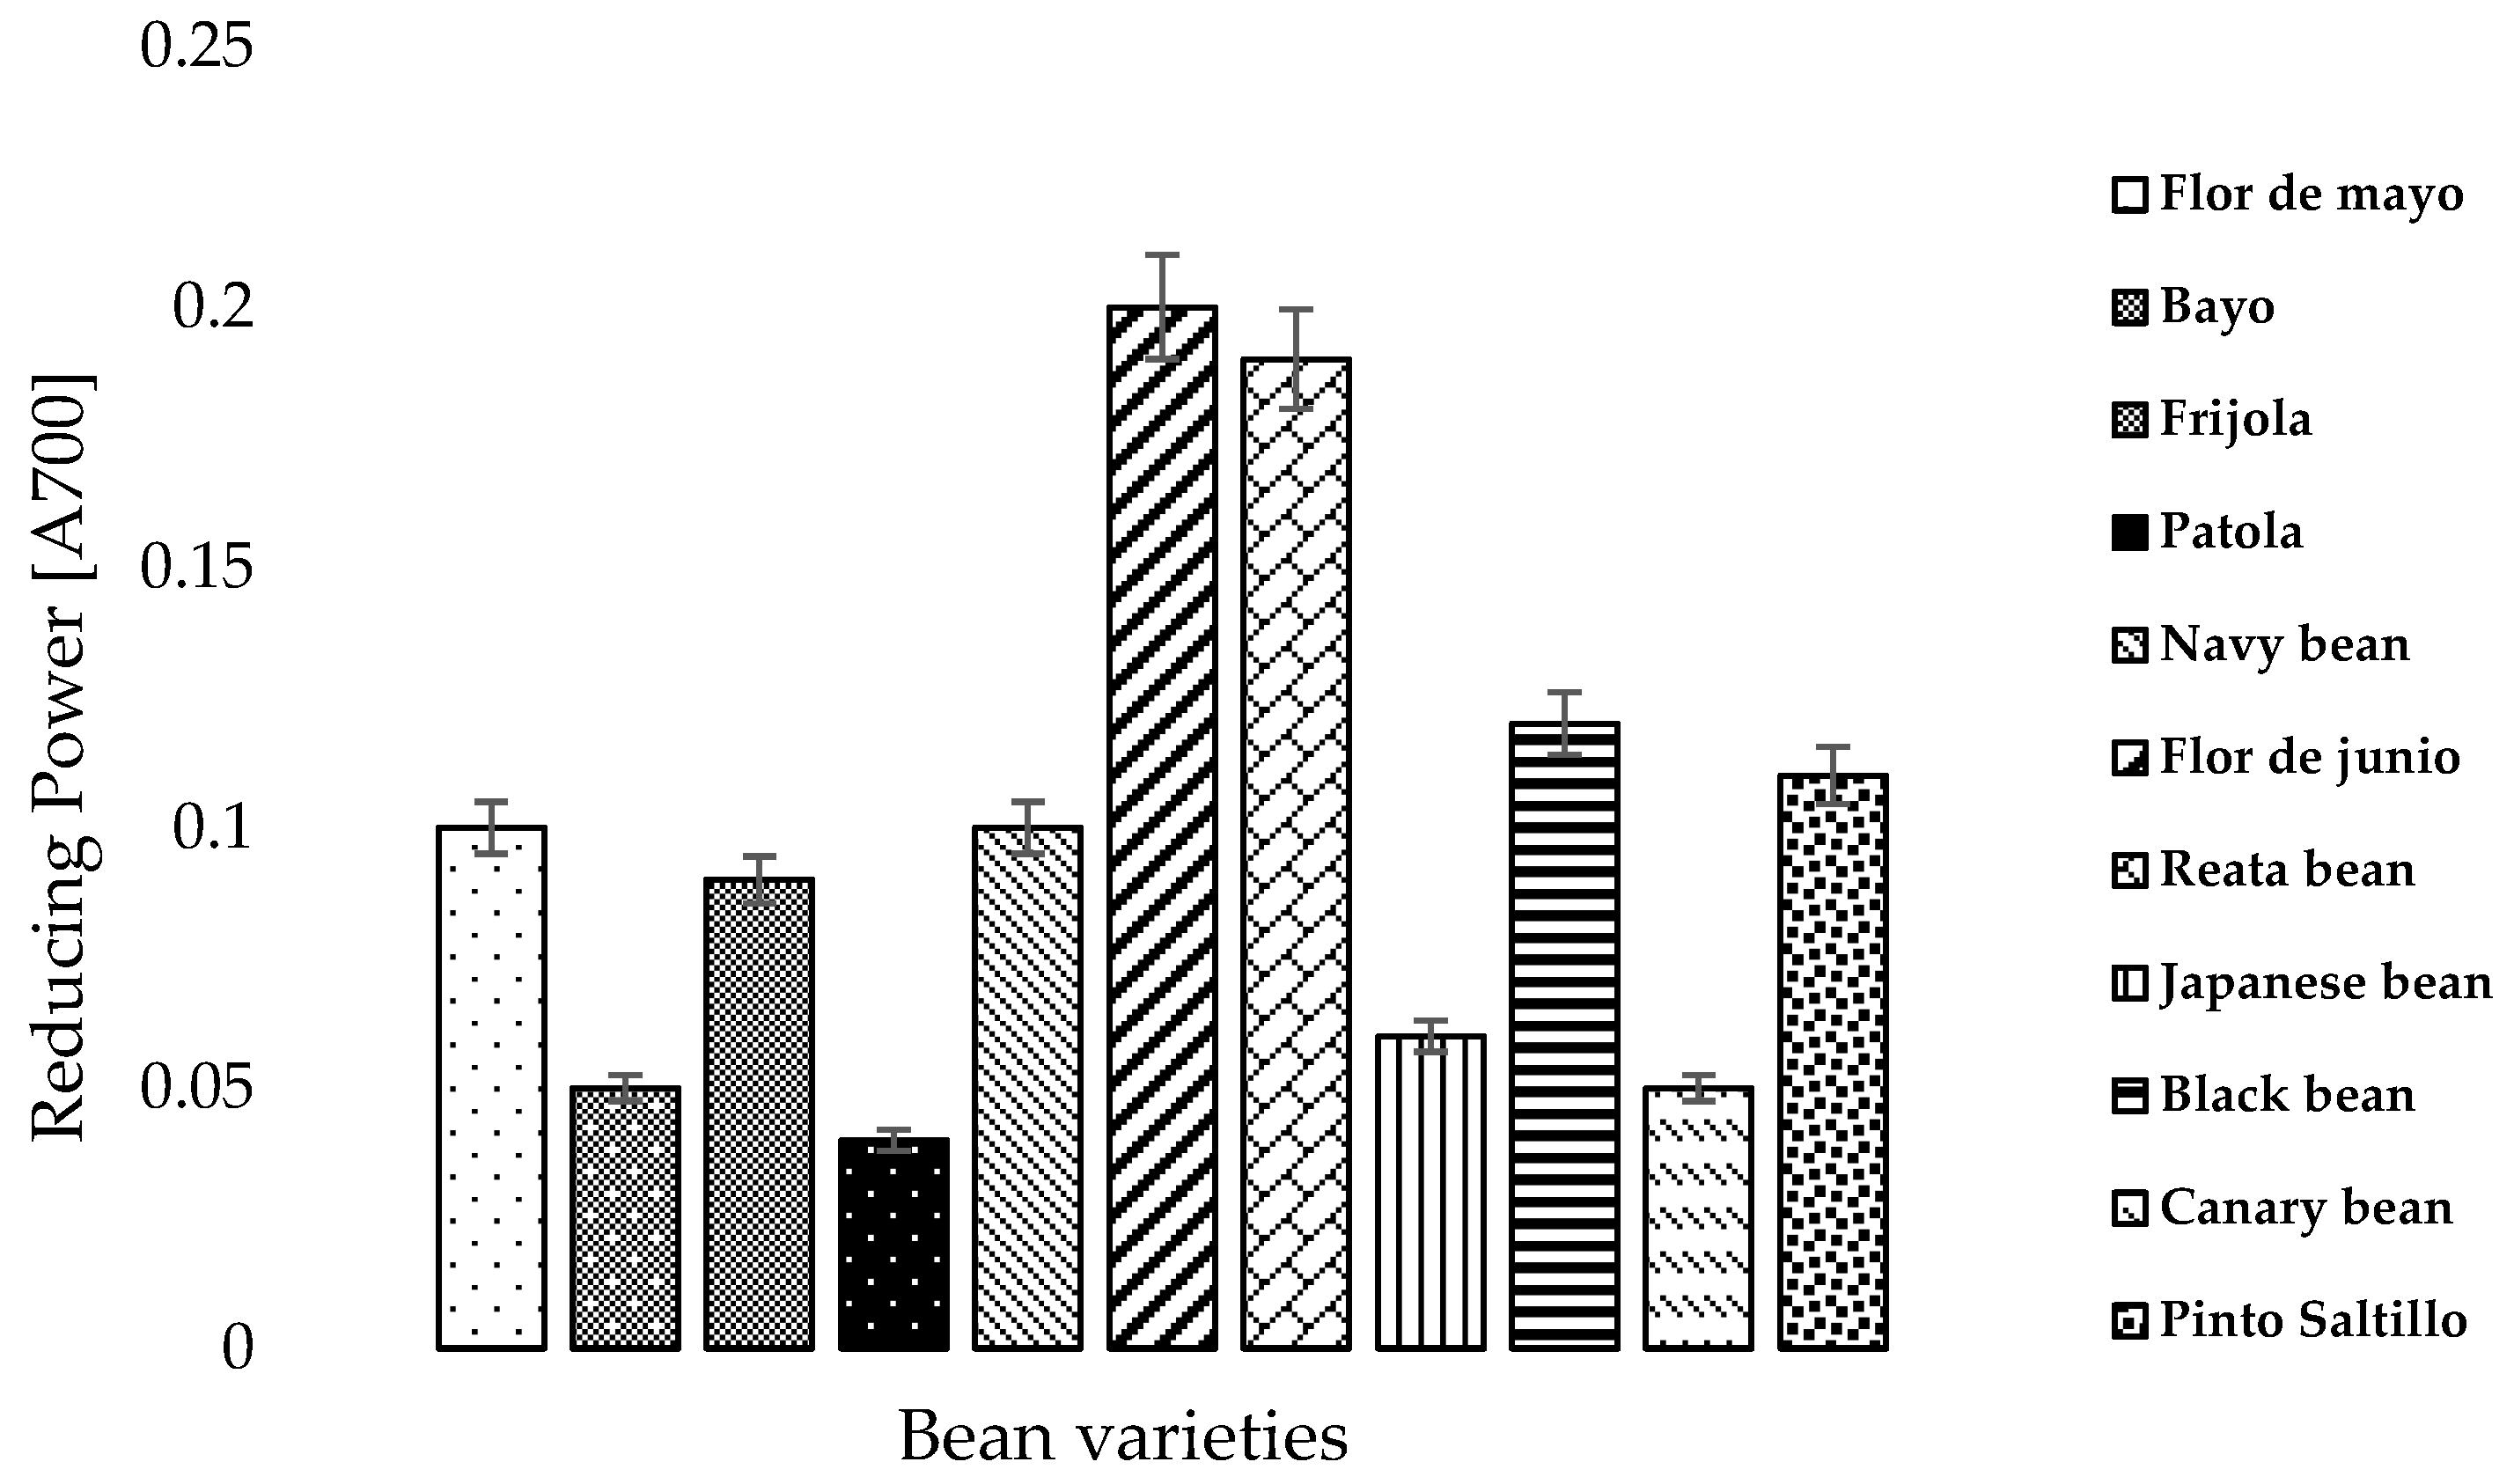
3.5. Reducing Power
3.6. Bioactive Compounds
3.6.1. Total Phenols
3.6.2. Flavonoids
3.6.3. Anthocyanins
4. Conclusions
Author Contributions
Funding
Conflicts of Interest
References
- White, P.J.; Broadley, M.R. Biofortifying crops with essential mineral elements. Trends Plant Sci. 2005, 10, 586–593. [Google Scholar] [CrossRef] [PubMed]
- Espinosa-Alonso, L.G.; Lyging, A.; Widholm, J.M.; Valverde, M.E.; Paredes-López, O. Polyphenols in Wild and Weedy Mexican Common Beans (Phaseolus vulgaris L.). J. Agric. Food Chem. 2006, 54, 4436–4444. [Google Scholar] [CrossRef] [PubMed]
- Guzman-Maldonado, S.H.; Acosta-Gallegos, J.A.; Álvarez-Muñoz, M.A.; García-Delgado, S.; Loarca-Piña, G. Calidad alimentaria y potencial nutracéutico del frijol (Phaseolus vulgaris L.), México. Agric. técnica en México 2002, 28, 159–173. [Google Scholar]
- Suárez-Martínez, S.E.; Ferriz-Martínez, R.A.; Campos-Vega, R.; Elton-Puente, J.E.; de la Torre-Carbot, K.; García-Gasca, T. Bean sedes: Leading nutraceutical source for human health. CyTA-J. Food 2015, 14, 131–137. [Google Scholar] [CrossRef]
- Servicio de Información Agroalimentaria y Pesquera. Available online: http://www.gob.mx/siap/articulos/frijol-alta-disponibilidad-y-tradicion-cultural-que-impulsa-nuestra-producción?idiom=es (accessed on 15 July 2018).
- Chávez-Mendoza, C.; Sánchez, E. Bioactive compounds from Mexican varieties of the common bean (Phaseolus vulgaris): Implications for health. Molecules 2017, 22, 8. [Google Scholar] [CrossRef] [PubMed]
- Gutierrez-Zavala, A.; Ledesma-Rivero, L.; García-García, I.; Grajales-Castillejos, O. Capacidad antioxidante total en alimentos convencionales y regionales de Chiapas, México. Rev. Cubana Salud Pública 2007, 33, 1. [Google Scholar] [CrossRef]
- Silva-Cristobal, L.; Osorio-Díaz, P.; Tovar, J.; Bello-Pérez, L.A. Chemical composition, carbohydrate digestibility, and antioxidant capacity of cooked black bean, chickpea, and lentil Mexican varieties. CyTA-J. Food 2010, 8, 7–14. [Google Scholar] [CrossRef]
- Food and Agriculture Organization (FAO). Organización de las Naciones Unidas para la Alimentación y la Agricultura. Available online: http://www.fao.org/faostat/en/#data/QC/visualize (accessed on 15 July 2018).
- Reynoso-Camacho, E.; Ramos-Gómez, M.; Loarca-Pina, G. Bioactive components in common beans (Phaseolus vulgaris L.). In Advances in Agricultural and Food Biotechnology; Research Signpost: Trivandrum, India, 2006; pp. 217–236. [Google Scholar]
- Aguirre-Santos, E.A.; Gómez-Aldapa, C.A. Evaluación de las características fisicoquímicas en la especie de frijol Phaseolus vulgaris de las variedades; pinto saltillo, bayo victoria y negro San Luis. Rev. Salud Pública Nutr. Ed. Espec. 2010, 9, 1101–1108. [Google Scholar]
- Association of Official Analytical Chemist (AOAC). Official Methods of Analysis of AOAC International, 17th ed.; AOAC: Oakville, MD, USA, 2000. [Google Scholar]
- NMX-F-066-S-1978. Determinación de cenizas en alimentos. Normas Mexicanas. Dirección General de Normas. Available online: http://www.colpos.mx/bancodenormas/nmexicanas/NMX-F-066-S-1978.PDF (accessed on 15 July 2018).
- Harris, G.K.; Marshall, M.R. Ash analysis. In Food Analysis, 5th ed.; Nielsen, S.S., Ed.; Springer: New York, NY, USA, 2017. [Google Scholar]
- NMX-F-427-1982. Alimentos. Determinación de grasa (método de hidrólisis ácida). Foods. Determination of fat (acid hydrolysis method). Normas mexicanas. Dirección general de normas. 1982. Available online: http://www.colpos.mx/bancodenormas/nmexicanas/NMX-F-427-1982.PDF (accessed on 15 July 2018).
- Sánchez, E.; Ruiz, J.M.; Romero, L.; Preciado-Rangel, P.; Flores-Córdova, M.A.; Márquez-Quiroz, C. Son los pigmentos fotosintéticos indicadores de la relación del nitrógeno, fósforo y potasio en el frijol ejotero? Ecosistemas y Recursos Agropecuarios 2018, 15, 387–398. [Google Scholar]
- NOM-F-90-S-1978. Determinación de fibra cruda en Alimentos. Foodstuff determination of crude fiber. Norma Oficial Mexicana. Available online: https://www.colpos.mx/bancodenormas/nmexicanas/NMX-F-090-S-1978.PDF (accessed on 15 July 2018).
- Association of Official Analytical Chemist (AOAC). Official Methods of Analysis of AOAC International, 16th ed.; AOAC: Oakville, MD, USA, 1996. [Google Scholar]
- Brand-Williams, W.; Cuvelier, M.E.; Berset, C.L.W.T. Use of a free radical method to evaluate antioxidant activity. LWT-Food Sci. Technol. 1995, 28, 25–30. [Google Scholar] [CrossRef]
- Oyaizu, M. Studies on product of browning reaction prepared from glucose amine. Jpn. J. Nutr. 1986, 44, 307–315. [Google Scholar] [CrossRef]
- Singleton, V.L.; Rossi, J.A. Colorimetry of total phenolics with phosphomolybdic phosphotungstic acid reagents. Am. J. Enol. Vitic. 1965, 16, 144–158. [Google Scholar]
- Singleton, V.L.; Salgues, M.; Zaya, J.; Trousdale, E. Caftaric acid disappearance and conversion to products of enzymatic oxidation in grape must and wine. Am. J. Enol. Vitic. 1985, 36, 50–56. [Google Scholar]
- Wrolstad, R.E. Color and pigment analyses in fruit products. Or. State Univ. Agric. Exp. Stn. Bull. 1976, 624, 1–7. [Google Scholar]
- SAS/STAT 9.0 Users Guide; SAS Institute, Inc.: Cary, NC, USA, 2002.
- Aguirre-Santos, E.A.; Rodríguez-Miranda, J.; Rosales-Serna, R.; Castro-Rosas, J.; Ochoa-Martínez, L.A.; Valle-Cervantes, S.; Gómez-Aldapa, C.A. Determinación de tiempos de cocción de frijol común var. Pinto Saltillo utilizando dos métodos. In Proceedings of the XXXII Encuentro Nacional y 1er Congreso Internacional AMIDIQ, Riviera Maya, Quintana Roo, Mexico, 3–6 May 2011; pp. 2812–2818. [Google Scholar]
- Castellanos, J.Z.; Guzman-Maldonado, H.S.; Jiménez, A.; Mejia, C.; Muñoz-Ramos, J.J.; Acosta-Gallegos, J.A.; Hoyos, G.; Lopez-Salinas, E.; Gonzalez-Eguiarte, D.; Salinas-Perez, R.; et al. Preferential habits of consumers of common bean (Phaseolus vulgaris L.) in Mexico. Arch. Latinoam. Nutr. 1997, 47, 163–167. [Google Scholar]
- Possobom, M.T.D.F.; Ribeiro, N.D.; Zemolin, A.E.M.; Arns, F.D. Genetic control of the seed coat colour of Middle American and Andean bean seeds. Genetica 2015, 143, 45–54. [Google Scholar] [CrossRef] [PubMed]
- Pérez-Herrera, P.; Esquivel-Esquivel, G.; Rosales-Serna, R.; Acosta-Gallegos, J.A. Caracterización física, culinaria y nutricional de frijol del altiplano subhúmedo de México. Archivos Latinoamericanos de Nutrición 2002, 52, 172–180. [Google Scholar]
- Iniestra-González, J.J.; Ibarra-Pérez, F.J.; Gallegos-Infante, J.A.; Rocha-Guzmán, N.E.; González-Laredon, Y.R.F. Factores antinutricios y actividad antioxidante en variedades mejoradas de frijol común (Phaseolus vulgaris). Agrociencia 2005, 39, 603–610. [Google Scholar]
- Arns, F.D.; Ribeiro, N.D.; Mezzomo, H.C.; Steckling, S.D.M.; Kläsener, G.R.; Casagrande, C.R. Combined selection in carioca beans for grain size, slow darkening and fast-cooking after storage times. Euphytica 2018, 214, 66. [Google Scholar] [CrossRef]
- Sida-Arreola, J.P.; Sánchez-Chávez, E.; Ávila-Quezada, G.D.; Zamudio-Flores, P.B.; Acosta, M.C. Iron biofortification and its impact on antioxidant system, yield and biomass in common bean. Plant Soil Environ. 2015, 61, 573–576. [Google Scholar]
- Ulloa, J.A.; Rosas-Ulloa, P.; Ramírez-Ramírez, J.C.; Ulloa-Rangel, B.E. El frijol (Phaseolus vulgaris): Su importancia nutricional y como fuente de fitoquímicos. Rev. Fuente 2011, 8, 5–9. [Google Scholar]
- Campos-Vega, R.; Reynoso-Camacho, R.; Pedraza-Aboytes, G.; Acosta-Gallegos, J.; Guzman-Maldonado, S.; Paredes-López, O.; Loarca-Piña, G. Chemical composition and in vitro polysaccharide fermentation of different beans (Phaseolus vulgaris L.). J. Food Sci. 2009, 74, 59–65. [Google Scholar] [CrossRef] [PubMed]
- Lijiao-Kan, S.N. Nutrients, phytochemicals and antioxidant activities of 26 kidney bean cultivars. Food Chem. Toxicol. 2017, 108, 467–477. [Google Scholar]
- Acosta-Gallegos, J.; Mendoza-Hernández, F.; Guzman-Maldonado, S.; Hernández, J.; Herrera, M. Contenido de proteína y minerales en la semilla de frijol silvestre y domesticado. Rev. Mexicana de ciencias agrícolas 2016, 17, 3281–3291. [Google Scholar]
- Welch, R.M. Linkages between trace elements in food crops and human health. In Micronutrient Deficiencies in Global Crop Production; Alloway, B.J., Ed.; Springer: New York, NY, USA, 2008; pp. 287–309. [Google Scholar]
- Guzmán-Maldonado, S.H.; Acosta-Gallegos, J.; Paredes-López, O. Protein and mineral content of a novel collection of wild and weedy common bean (Phaseolus vulgaris L.). J. Sci. Food Agric. 2000, 80, 1874–1881. [Google Scholar] [CrossRef]
- Koehler, H.H.; Chang, C.H.; Scheier, G.; Burke, D.W. Nutrient composition, protein quality, and sensory properties of thirty-six cultivars of dry beans (Phaseolus vulgaris L.). J. Food Sci. 1987, 52, 1335–1340. [Google Scholar] [CrossRef]
- Sida-Arreola, J.P.; Sánchez, E.; Ojeda-Barrios, D.L.; Ávila-Quezada, G.D.; Flores-Córdova, M.A.; Márquez-Quiroz, C.; Preciado-Rangel, P. Can biofortification of zinc improve the antioxidant capacity and nutritional quality of beans? Emir. J. Food Agric. 2017, 29, 237–242. [Google Scholar]
- Anwar, F.; Latif, S.; Przybylski, R.; Sultana, B.; Ashraf, M. Chemical composition and antioxidant activity of seeds of different cultivars of mungbean. J. Food Sci. 2007, 72, 503–510. [Google Scholar] [CrossRef]
- Alejandro, G.N.M. Cuantificación de fenoles y flavonoides totales en extractos naturales. Universidad Autónoma de Querétaro. Rev Acad. 2009, 1, 1–4. [Google Scholar]

| Bean Variety | Origin | Date Obtained | Picture |
|---|---|---|---|
| Flor de mayo | Calera, Zacatecas | 4 June 2018 |  |
| Bayo | Calera, Zacatecas | 4 June 2018 |  |
| Frijola | Calera, Zacatecas | 4 June 2018 | 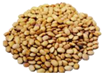 |
| Patola | Calera, Zacatecas | 4 June 2018 | 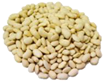 |
| Navy bean | Calera, Zacatecas | 4 June 2018 |  |
| Flor de junio | Calera, Zacatecas | 4 June 2018 |  |
| Reata bean | Calera, Zacatecas | 4 June 2018 | 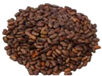 |
| Japanese bean | Calera, Zacatecas | 4 June 2018 |  |
| Black bean | Calera, Zacatecas | 4 June 2018 |  |
| Canary bean | Calera, Zacatecas | 4 June 2018 | 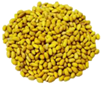 |
| Pinto saltillo | Calera, Zacatecas | 4 June 2018 | 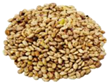 |
| Bean Variety | L* | a* | b* | Chroma | Hue |
|---|---|---|---|---|---|
| Flor de mayo | 53.13 | 14.68 | 7.60 | 16.54 | 0.47 |
| Bayo | 65.44 | 7.11 | 20.01 | 21.23 | 1.22 |
| Frijola | 66.75 | 6.41 | 19.58 | 20.60 | 1.25 |
| Patola | 81.84 | 1.55 | 13.99 | 14.05 | 1.46 |
| Navy bean | 79.54 | 2.05 | 10.31 | 10.51 | 1.37 |
| Flor de junio | 52.04 | 14.19 | 9.13 | 16.90 | 0.57 |
| Reata bean | 46.86 | 13.08 | 8.87 | 15.82 | 0.59 |
| Japanese bean | 55.98 | 11.57 | 15.34 | 19.22 | 0.92 |
| Black bean | 27.55 | 0.78 | −2.18 | 2.31 | −1.22 |
| Canary bean | 67.63 | −0.006 | 30.84 | 30.84 | −0.52 |
| Pinto Saltillo | 65.06 | 5.71 | 13.54 | 14.69 | 1.17 |
| Significance | *** | *** | *** | *** | *** |
| LSD | 4.8888 | 1.3998 | 1.9912 | 1.813 | 1.6055 |
| Bean Variety | Length (mm) | Width (mm) | Thickness (mm) | Weight of 100 Grains (g) |
|---|---|---|---|---|
| Flor de mayo | 13.26 | 7.73 | 5.66 | 29.49 |
| Bayo | 12.03 | 9.10 | 5.83 | 35.26 |
| Frijola | 13.73 | 9.63 | 6.03 | 47.80 |
| Patola | 18.03 | 11.06 | 7.30 | 83.72 |
| Navy bean | 12.26 | 7.96 | 6.43 | 34.31 |
| Flor de junio | 11.40 | 7.60 | 6.00 | 28.86 |
| Reata bean | 16.23 | 8.66 | 6.30 | 47.94 |
| Japanese bean | 11.46 | 9.06 | 7.23 | 40.98 |
| Black bean | 10.70 | 7.76 | 5.40 | 30.75 |
| Canary bean | 12.86 | 7.63 | 6.43 | 45.01 |
| Pinto Saltillo | 12.60 | 8.00 | 4.83 | 32.70 |
| Significance | NS | NS | NS | NS |
| MSD | 1.8275 | 1.2914 | 1.6455 | 3.6038 |
| Bean Variety | Ash | Fat | Moisture | Fiber | Carbohydrates | Protein | Energy |
|---|---|---|---|---|---|---|---|
| (%) | (%) | (%) | (%) | (%) | (%) | (kcal) | |
| Flor de mayo | 4.14 | 1.03 | 6.36 | 3.64 | 63.47 | 21.36 | 348.59 |
| Bayo | 4.15 | 1.39 | 7.12 | 2.71 | 62.53 | 22.10 | 351.03 |
| Frijola | 4.41 | 2.19 | 6.72 | 2.82 | 59.57 | 24.29 | 355.15 |
| Patola | 4.72 | 2.09 | 7.17 | 3.48 | 60.60 | 21.94 | 348.97 |
| Navy bean | 4.24 | 1.11 | 6.46 | 3.24 | 61.79 | 23.16 | 349.79 |
| Flor de junio | 3.89 | 1.74 | 6.69 | 3.22 | 65.26 | 19.20 | 353.50 |
| Reata bean | 4.40 | 1.73 | 6.66 | 3.17 | 57.16 | 26.88 | 351.73 |
| Japanese bean | 4.42 | 0.97 | 6.14 | 2.88 | 62.67 | 22.92 | 351.09 |
| Black bean | 4.12 | 0.78 | 6.35 | 2.82 | 65.79 | 20.14 | 350.74 |
| Canary bean | 4.26 | 1.08 | 7.42 | 2.93 | 59.30 | 25.01 | 346.96 |
| Pinto Saltillo | 4.29 | 1.11 | 6.73 | 3.44 | 58.65 | 25.78 | 347.71 |
| Significance | *** | *** | *** | *** | *** | *** | *** |
| MSD | 0.0515 | 0.0763 | 0.0545 | 0.0832 | 0.2659 | 0.05 | 0.3854 |
| Bean Variety | Copper | Nickel | Manganese | Iron | Zinc |
|---|---|---|---|---|---|
| Flor de mayo | 10.15 | 8.98 | 25.45 | 55.78 | 31.00 |
| Bayo | 13.24 | 2.03 | 10.07 | 76.48 | 48.18 |
| Frijola | 10.14 | 7.89 | 12.16 | 97.76 | 8.52 |
| Patola | 9.85 | 10.12 | 25.42 | 65.74 | 7.09 |
| Navy bean | 12.38 | 4.89 | 30.60 | 53.90 | 18.12 |
| Flor de junio | 8.95 | 2.78 | 12.86 | 90.97 | 27.23 |
| Reata bean | 11.19 | 7.54 | 6.07 | 65.57 | 17.09 |
| Japanese bean | 12.76 | 10.40 | 15.90 | 21.62 | 6.74 |
| Black bean | 8.34 | 5.64 | 38.54 | 84.59 | 13.11 |
| Canary bean | 10.72 | 3.29 | 28.48 | 105.29 | 27.20 |
| Pinto Saltillo | 11.82 | 6.04 | 5.41 | 62.48 | 25.96 |
| Significance | NS | *** | ***x | *** | *** |
| MSD | 5.7385 | 5.1612 | 25.183 | 46.342 | 28.372 |
| Bean Ariety | Nitrogen | Phosphorus | Potassium | Magnesium | Sodium | Calcium |
|---|---|---|---|---|---|---|
| Flor de mayo | 3.41 | 0.16 | 1.04 | 0.13 | 0.002 | 0.14 |
| Bayo | 3.53 | 0.13 | 1.32 | 0.02 | 0.004 | 0.17 |
| Frijola | 3.88 | 0.40 | 0.74 | 0.08 | 0.004 | 0.22 |
| Patola | 3.51 | 0.18 | 0.78 | 0.16 | 0.002 | 0.12 |
| Navy bean | 3.70 | 0.13 | 1.08 | 0.08 | 0.003 | 0.29 |
| Flor de junio | 3.07 | 0.17 | 0.43 | 0.02 | 0.003 | 0.24 |
| Reata bean | 4.30 | 0.18 | 0.63 | 0.10 | 0.003 | 0.25 |
| Japanese bean | 3.66 | 0.19 | 1.32 | 0.16 | 0.003 | 0.21 |
| Black bean | 3.22 | 0.14 | 1.25 | 0.08 | 0.003 | 0.25 |
| Canary bean | 4.00 | 0.16 | 0.41 | 0.05 | 0.004 | 0.14 |
| Pinto Saltillo | 4.12 | 0.16 | 0.86 | 0.11 | 0.004 | 0.25 |
| Significance | ** | ** | ** | * | *** | * |
| MSD | 0.008 | 0.0647 | 0.7354 | 0.1421 | 0.0017 | 0.1026 |
| Bean Variety | Total Phenols (mg gallic acid/g−1 dw) | Flavonoids (mg catechin/g−1 dw) | Anthocyanins (mgEC3G/g−1 dw) |
|---|---|---|---|
| Flor de mayo | 83.58 | 1.70 | 0.62 |
| Bayo | 89.83 | 1.10 | 0.50 |
| Frijola | 114.29 | 1.16 | 0.27 |
| Patola | 59.92 | 2.18 | 0.33 |
| Navy bean | 46.75 | 0.35 | 2.57 |
| Flor de junio | 94.82 | 1.30 | 0.44 |
| Reata bean | 94.35 | 1.20 | 0.20 |
| Japanese bean | 101.50 | 0.97 | 0.70 |
| Black bean | 80.33 | 0.33 | 0.43 |
| Canary bean | 68.01 | 0.46 | 1.16 |
| Pinto Saltillo | 90.16 | 0.82 | 0.59 |
| Significance | * | *** | *** |
| MSD | 65.988 | 0.6481 | 0.659 |
© 2018 by the authors. Licensee MDPI, Basel, Switzerland. This article is an open access article distributed under the terms and conditions of the Creative Commons Attribution (CC BY) license (http://creativecommons.org/licenses/by/4.0/).
Share and Cite
Herrera-Hernández, I.M.; Armendáriz-Fernández, K.V.; Muñoz-Márquez, E.; Sida-Arreola, J.P.; Sánchez, E. Characterization of Bioactive Compounds, Mineral Content and Antioxidant Capacity in Bean Varieties Grown in Semi-Arid Conditions in Zacatecas, Mexico. Foods 2018, 7, 199. https://doi.org/10.3390/foods7120199
Herrera-Hernández IM, Armendáriz-Fernández KV, Muñoz-Márquez E, Sida-Arreola JP, Sánchez E. Characterization of Bioactive Compounds, Mineral Content and Antioxidant Capacity in Bean Varieties Grown in Semi-Arid Conditions in Zacatecas, Mexico. Foods. 2018; 7(12):199. https://doi.org/10.3390/foods7120199
Chicago/Turabian StyleHerrera-Hernández, Ibeth Marlene, Karen Vanesa Armendáriz-Fernández, Ezequiel Muñoz-Márquez, Juan Pedro Sida-Arreola, and Esteban Sánchez. 2018. "Characterization of Bioactive Compounds, Mineral Content and Antioxidant Capacity in Bean Varieties Grown in Semi-Arid Conditions in Zacatecas, Mexico" Foods 7, no. 12: 199. https://doi.org/10.3390/foods7120199
APA StyleHerrera-Hernández, I. M., Armendáriz-Fernández, K. V., Muñoz-Márquez, E., Sida-Arreola, J. P., & Sánchez, E. (2018). Characterization of Bioactive Compounds, Mineral Content and Antioxidant Capacity in Bean Varieties Grown in Semi-Arid Conditions in Zacatecas, Mexico. Foods, 7(12), 199. https://doi.org/10.3390/foods7120199