


Effect of Fertilization on Phenolics of Rapeseeds and Their Antioxidant Potential

 , , , , , , and
Abstract
1. Introduction
2. Materials and Methods
2.1. Plant Material
2.2. Chemicals
2.3. Extraction Procedure
2.4. Determination of Total Phenolics
2.5. Trolox Equivalent Antioxidant Capacity Determination
2.6. Ferric-Reducing Antioxidant Power Determination
2.7. Determination of DPPH Radical Scavenging Activity
2.8. HPLC Analysis
2.9. Statistical Analysis
3. Results
4. Discussion
5. Conclusions
Author Contributions
Funding
Institutional Review Board Statement
Informed Consent Statement
Data Availability Statement
Conflicts of Interest
References
- Zagoskina, N.V.; Zubova, M.Y.; Nechaeva, T.L.; Kazantseva, V.V.; Goncharuk, E.A.; Katanskaya, V.M.; Baranova, E.N.; Aksenova, M.A. Polyphenols in plants: Structure, biosynthesis, abiotic stress, regulation, and practical applications. Int. J. Mol. Sci. 2023, 24, 13874. [Google Scholar] [CrossRef]
- Pratyusha, S. Phenolic compounds in the plant development and defense: An overview. In Plant Stress Physiology—Perspectives in Agriculture; Hasanuzzaman, M., Nahar, K., Eds.; IntechOpen: London, UK, 2022; pp. 1–17. [Google Scholar] [CrossRef]
- Singh, S.; Kaur, I.; Kariyat, R. The multifunctional roles of polyphenols in plant-herbivore interactions. Int. J. Mol. Sci. 2021, 22, 1442. [Google Scholar] [CrossRef]
- Shahidi, F.; Hossain, A. Importance of insoluble-bound phenolics to the antioxidant potential is dictated by source material. Antioxidants 2023, 12, 203. [Google Scholar] [CrossRef]
- Amarowicz, R.; Pegg, R.B. Natural antioxidants of plant origin. Adv. Food Nutr. Res. 2019, 90, 1–81. [Google Scholar] [CrossRef]
- Rasouli, H.; Farzaei, M.H.; Khodarahmi, R. Polyphenols and their benefits: A review. Int. J. Food Prop. 2017, 20, 1700–1741. [Google Scholar] [CrossRef]
- Loganes, C.; Ballali, S.; Minto, C. Main properties of canola oil components: A descriptive review of current knowledge. Open Agric. J. 2016, 10, 69–74. [Google Scholar] [CrossRef]
- Mupondwa, E.; Li, X.; Wanasundara, J.P.D. Technoeconomic prospects for commercialization of Brassica (Cruciferous) plant proteins. J. Am. Oil Chem. Soc. 2018, 95, 903–922. [Google Scholar] [CrossRef]
- Chmielewska, A.; Kozłowska, M.; Rachwał, D.; Wnukowski, P.; Amarowicz, R.; Nebesny, E.; Rosicka-Kaczmarek, J. Canola/rapeseed protein–nutritional value, functionality and food application: A review. Crit. Rev. Food Sci. Nutr. 2020, 61, 3836–3856. [Google Scholar] [CrossRef]
- Naczk, M.; Amarowicz, R.; Sullivan, A.; Shahidi, F. Current research developments on polyphenolics of rapeseed/canola: A review. Food Chem. 1998, 62, 489–502. [Google Scholar] [CrossRef]
- Szydłowska-Czerniak, A. Rapeseed and its products—sources of bioactive compounds: A review of their characteristics and analysis. Crit. Rev. Food Sci. Nutr. 2013, 53, 307–330. [Google Scholar] [CrossRef]
- Rękas, A.; Ścibisz, I.; Siger, A.; Wroniak, M. The effect of microwave pretreatment of seeds on the stability and degradation kinetics of phenolic compounds in rapeseed oil during long-term storage. Food Chem. 2017, 222, 43–52. [Google Scholar] [CrossRef]
- Shrestha, K.; Stevens, C.V.; de Meulenaer, B. Isolation and identification of a potent radical scavenger (canolol) from roasted high erucic mustard seed oil from Nepal and its formation during roasting. J. Agric. Food Chem. 2012, 60, 7506–7512. [Google Scholar] [CrossRef]
- Naczk, M.; Amarowicz, R.; Pink, D.; Shahidi, F. Insoluble condensed tannins of canola/rapeseed. J. Agric. Food Chem. 2000, 48, 1758–1762. [Google Scholar] [CrossRef]
- Amarowicz, R.; Naczk, M.; Shahidi, F. Antioxidant activity of crude tannins of canola and rapeseed hulls. J. Am. Oil Chem. Soc. 2000, 77, 957–961. [Google Scholar] [CrossRef]
- Szydłowska-Czerniak, A.; Tułodziecka, A. Antioxidant capacity of rapeseed extracts obtained by conventional and ultrasound-assisted extraction. J. Am. Oil Chem. Soc. 2014, 91, 2011–2019. [Google Scholar] [CrossRef]
- Szydłowska-Czerniak, A.; Amarowicz, R.; Szłyk, E. Antioxidant capacity of rapeseed meal and rapeseed oils enriched with meal extract. Eur. J. Lipid Sci. Technol. 2010, 112, 750–760. [Google Scholar] [CrossRef]
- Amarowicz, R.; Fornal, J.; Karamać, M. Effect of seed moisture on phenolic acids in rapeseed oil cake. Grasas Y Aceites 1995, 46, 354–356. [Google Scholar] [CrossRef]
- Amarowicz, R.; Fornal, J.; Karamać, M.; Shahidi, F. Antioxidant activity of extracts of phenolic compounds from rapeseed oil cakes. J. Food Lipids 2001, 8, 65–74. [Google Scholar] [CrossRef]
- Thiyam, U.; Stöckmann, H.; Zum Felde, T.; Schwarz, K. Antioxidative effect of the main sinapic acid derivatives from rapeseed and mustard oil by-products. Eur. J. Lipid Sci. Technol. 2006, 108, 239–248. [Google Scholar] [CrossRef]
- Björkman, M.; Klingen, I.; Birch, A.N.E.; Bones, A.M.; Bruce, T.J.B.; Johansen, T.J.; Meadow, R.; Mølmann, J.; Seljåsen, R.; Smart, L.E.; et al. Phytochemicals of Brassicaceae in plant protection and human health—Influences of climate, environment and agronomic practice. Phytochemistry 2011, 72, 538–556. [Google Scholar] [CrossRef] [PubMed]
- Butkutė, B.; Mašauskienė, A.; Šidlauskas, G.; Sliesaravičienė, L. The effect of agronomic factors and growth conditions on protein and fat content in the seed of spring oilseed rape and on the variation of fatty acids. Agriculture 2000, 70, 160–175. [Google Scholar]
- Zhao, F.M.; McGrath, S.P.; Blake-Kalff, M.M.A.; Link, A.; Tucker, M. Crop responses to sulphur fertilization in Europe. Biogeochemistry of sulphur in agricultural systems. Part II. Fertilizers and fertilization. Proc. Int. Fertl. Soc. 2003, 16, 26–51. [Google Scholar]
- Podleśna, A.; Cacak–Pietrzak, G.; Sowiński, M. Response of winter wheat to fertilizing S in the field experiment. Fert. Fertil. 2003, 4, 169–179. [Google Scholar]
- Zhao, X.; Nechols, J.R.; Williams, K.; Wangc, W.; Carey, E.E. Comparison of phenolic acids in organically and conventionally grown pac choi (Brassica rapa L. chinensis). J. Sci. Food. Agric. 2009, 89, 940–946. [Google Scholar] [CrossRef]
- Romani, A.; Ieri, F. Plant polyphenol content, soil fertilization and agricultural management: A review. Eur. Food Res. Technol. 2017, 243, 1107–1115. [Google Scholar] [CrossRef]
- Nguyen, P.M.; Niemeyer, E.D. Effects of nitrogen fertilization on the phenolic composition and antioxidant properties of basil (Ocinum basilicum L.). J. Agric. Food Chem. 2008, 56, 8685–8691. [Google Scholar] [CrossRef]
- Salminen, J.P.; Maarit, K. Chemical ecology of tannins and other phenolics: We need a change in approach. Func. Ecol. 2011, 25, 325–338. [Google Scholar] [CrossRef]
- Cwalina-Ambroziak, B.; Stępień, A.; Kurowski, T.P.; Głosek-Sobieraj, M.; Wiktorski, A. The health status and yield of winter rapeseed (Brassica napus L.) grown in monoculture and in crop rotation under different agricultural production systems. Arch. Agron. Soil Sci. 2016, 62, 1722–1732. [Google Scholar] [CrossRef]
- Stepień, A.; Wojtkowiak, K.; Pietrzak-Fiecko, R. Nutrient content, fat yield and fatty acid profile of winter rapeseed (Brassica napus L.) grown under different agricultural production systems. Chilean J. Agric. Res. 2017, 77, 266–272. [Google Scholar] [CrossRef]
- Amarowicz, R.; Wanasundara, U.N.; Karamać, M.; Shahidi, F. Antioxidant activity of ethanolic extract of mustard seed. Nahrung—Food 1996, 40, 261–263. [Google Scholar] [CrossRef]
- Naczk, M.; Shahidi, F. The effect of methanol-ammonia-water treatment on the content of phenolic acids of canola. Food Chem. 1989, 31, 159–164. [Google Scholar] [CrossRef]
- Re, R.; Pellegrini, N.; Proteggente, A.; Pannala, A.; Yang, M.; Rice-Evans, C. Antioxidant activity applying an improved ABTS radical cation decolorization assay. Free Rad. Biol. Med. 1999, 26, 1231–1237. [Google Scholar] [CrossRef]
- Benzie, I.F.; Strain, J.J. The ferric reducing ability of plasma (FRAP) as a measure of “antioxidant power”: The FRAP assay. Anal. Biochem. 1999, 239, 70–76. [Google Scholar] [CrossRef]
- Amobonye, A.; Bhagwat, P.; Ruzengwe, F.M.; Singh, S.; Pillai, S. Pear juice clarification using polygalacturonase from Beauveria bassiana: Effects on rheological, antioxidant and quality properties. Pol. J. Food Nutr. Sci. 2022, 72, 57–67. [Google Scholar] [CrossRef]
- Brand-Williams, W.; Cuvelier, M.E.; Berset, C. Use of a free radical method to evaluate antioxidant activity. LWT Food Sci. Technol. 1995, 28, 25–30. [Google Scholar] [CrossRef]
- Sulewska, K.; Rybarczyk-Płońska, A.; Karamać, M. Antioxidant capacity of lentil flour hydrolysates obtained with pancreatin. Pol. J. Food Nutr. Sci. 2022, 72, 381–391. [Google Scholar] [CrossRef]
- Karamać, M.; Gai, F.; Peiretti, P.G. Effect of the growth stage of false flax (Camelina sativa L.) on the phenolic compound content and antioxidant potential of the aerial part of the plant. Pol. J. Food Nutr. Sci. 2020, 70, 189–198. [Google Scholar] [CrossRef]
- Mert-Türk, F.; Kemal, Ü.L.; Egesel, Ö. Nitrogen and fungicide applications against Erysiphe cruciferarum affect quality components of oilseed rape. Mycopathologia 2008, 165, 27–35. [Google Scholar] [CrossRef] [PubMed]
- Siger, A.; Nogala-Kałucka, M.M.; Lampart-Szczapa, E.E.; Hoffmann, A.A. Phenolic compound contents in new rape varieties. Oilseed Crops 2004, 25, 263–274. [Google Scholar]
- Eberhardt, M.V.; Kobira, K.; Keck, A.S.; Juvik, J.A.; Jeffery, E.H. Correlation analyses of phytochemical composition, chemical, and cellular measures of antioxidant activity of broccoli (Brassica oleracea L. var. italica). J. Agric. Food Chem. 2005, 53, 7421–7431. [Google Scholar] [CrossRef]
- Singh, A.; Upadhyay, K.; Prasad, A.; Bahadur, A.; Rai, M. Variability of carotenes, vitamin C, E and phenolics in brassica vegetables. J. Food Comp. Anal. 2007, 20, 106–112. [Google Scholar] [CrossRef]
- Reungoat, V.; Allais, F.; Ducatel, H.; Ioannou, I. Extraction and purification processes of sinapic acid derivatives from rapeseed and mustard seed by-products. Separ. Purific. Rev. 2022, 51, 521–544. [Google Scholar] [CrossRef]
- De Pascale, S.; Maggio, A.; Pernice, R.; Fogliano, V.; Barbieri, G. Sulphur fertilization may improve the nutritional value of Brassica rapa L. subsp. sylvestris. Eur. J. Agron. 2007, 26, 418–424. [Google Scholar] [CrossRef]
- Biesiada, A.; Nawirska-Olszańska, A.; Kucharska, A.; Sokół-Łętowska, K.; Kędra. The effect of nitrogen fertilization on nutritive value and antioxidative activity of red cabbage. Acta Sci Pol. Hortorum Cultus 2010, 9, 13–21. [Google Scholar]
- Sady, W.; Domagała-Świątek, I.; Rożek, S. Effect of nitrogen fertilization on sugars, ascorbic acid and phenolic compounds in white cabbage (Brassica oleracea var. capitata alba L.). Acta Sci. Pol. Hortorum Cultus 2010, 9, 41–51. [Google Scholar]
- Li, J.; Zhu, Z.; Gerendas, J. Effects of nitrogen and sulfur on total phenolics and antioxidant activity in two genotypes of leaf mustard. J. Plant Nutr. 2008, 31, 1642–1655. [Google Scholar] [CrossRef]
- Fortier, E.; Desjardins, Y.; Tremblay, N.; Bčlec, C.; Côtč, M. Influence of irrigation and nitrogen fertilization on broccoli polyphenolics concentration. Acta Hortic. 2010, 856, 55–62. [Google Scholar] [CrossRef]
- Jones, R.B.; Imsic, M.; Franz, P.; Tomkins, B.T. High nitrogen during growth reduced glucoraphanin and flavonol content in broccoli (Brassica oleracea var. italica) heads. Aust. J. Exp. Agric. 2007, 47, 1498–1505. [Google Scholar] [CrossRef]
- Zhu, W.; Lin, X.; Jin, C.; Zhang, Y.; Fang, P. Effects of nitrogen application rates on antioxidant contents and antioxidative activities in Chinese cabbage (Brassica chinensis L.). J. Zhejiang Univ. Agric. Life Sci. 2009, 35, 299–306. [Google Scholar]
- Zhao, X.; Carey, E.E.; Young, J.E.; Wang, W.; Iwamoto, T. Influences of organic fertilization, high tunnel environment, and postharvest storage on phenolic compounds in lettuce. HortScience 2007, 42, 71–76. [Google Scholar] [CrossRef]
- Johnson, W.A.; Cloyd, R.A.; Nechols, J.R.; Williams, K.A.; Nelson, N.O.; Rotenberg, D.; Kennelly, M.M. Effect of nitrogen source on pac choi (Brassica rapa L.) chemistry and interactions with the diamondback moth (Plutella xylostella L.). HortiScience 2012, 47, 1457–1465. [Google Scholar] [CrossRef]
- Lo Scalzo, R.; Picchi, V.; Migliori, C.A.; Campanelli, G.; Leteo, F.; Ferrari, V.; Di Cesare, L.F. Variations in the phytochemical contents and antioxidant capacity of organically and conventionally grown Italian cauliflower (Brassica oleracea L. subsp. botrytis): Results from a three-year field study. J. Agric. Food Chem. 2013, 61, 10335–10344. [Google Scholar] [CrossRef]
- Conversa, G.; Bonasia, A.; Lazzizera, C.; Elia, A. Bio-physical, physiological, and nutritional aspects of ready-to-use cima di rapa (Brassica rapa L. subsp. sylvestris L. Janch. var. esculenta Hort.) as affected by conventional and organic growing systems and storage time. Sci. Hortic. 2016, 213, 76–86. [Google Scholar] [CrossRef]
- Łata, B. Variability in enzymatic and non-enzymatic antioxidants in red and green-leafy kale in relation to soil type and N-level. Sci. Hortic. 2014, 168, 38–45. [Google Scholar] [CrossRef]
- Picchi, V.; Migliori, C.; Lo Scalzo, R.; Campanelli, G.; Ferrari, V.; Di Cesare, L.F. Phytochemical content in organic and conventionally grown Italian cauliflower. Food Chem. 2012, 130, 501–509. [Google Scholar] [CrossRef]
- Valverde, J.; Reilly, K.; Villacreces, S.; Gaffney, M.; Granta, J.; Brunton, N. Variation in bioactive content in broccoli (Brassica oleracea var. italica) grown under conventional and organic production systems. J. Sci. Food Agric. 2015, 95, 1163–11761. [Google Scholar] [CrossRef]
- Ibrahim, M.H.; Jaafar, H.Z.E. Involvement of carbohydrate, protein and phenylanine ammonia lyase in up-regulation of secondary metabolites in Labisia pumila under various CO2 and N2 level. Molecules 2011, 16, 4172–4190. [Google Scholar] [CrossRef]
- Zhang, Y.; Ma, X.-M.; Wang, X.-C.; Liu, J.-H.; Huang, B.-Y.; Guo, X.-Y.; Xiong, S.P.; La, G.-X. UPLC-QTOF analysis reveals metabolomic changes in the flag leaf of wheat (Triticum aestivum L.) under low-nitrogen stress. Plant Physiol. Bioch. 2017, 111, 30–38. [Google Scholar] [CrossRef]
- Deng, B.; Li, Y.; Xu, D.; Ye, Q.; Liu, G. Nitrogen availability alters flavonoid accumulation in Cyclocarya paliurus via the effects on the internal carbon/nitrogen balance. Sci. Rep. 2019, 9, 2370. [Google Scholar] [CrossRef]
- Sun, Y.; Guo, J.; Li, Y.; Luo, G.; Li, L.; Yuan, H.; Mur, L.A.J.; Guo, S. Negative effects of the simulated nitrogen deposition on plant phenolic metabolism: A meta-analysis. Sci. Total Environ. 2020, 719, 137442. [Google Scholar] [CrossRef] [PubMed]
- Pozzo, L.; Grande, T.; Raffaelli, A.; Longo, V.; Weidner, S.; Amarowicz, R.; Karamać, M. Characterization of antioxidant and antimicrobial activity and phenolic compound profile of extracts from seeds of different Vitis species. Molecules 2023, 28, 4924. [Google Scholar] [CrossRef] [PubMed]


| Fertilization | Experimental Group | ||
|---|---|---|---|
| Control | Intensive | Spare | |
| Phosphorus: Autumn | 60 | 80 | 40 |
| Potassium: Autumn | 120 | 150 | 60 |
| Nitrogen: Autumn | 30 | 30 | 30 |
| Nitrogen: Spring I | 120 | 120 | 120 |
| Nitrogen: Spring II | 60 | 80 | 40 |
| Sulphur: Spring | 45 | 60 | - |
| Assay | Unit | Cultivar | Experimental Group | ||
|---|---|---|---|---|---|
| Control | Intensive | Spare | |||
| Total Phenolics | mg SAE/g extract | California | 60.9 ± 2.6 ab | 59.5 ± 0.7 a | 57.1 ± 0.8 b |
| Castilla | 48.9 ± 1.9 ab | 48.3 ± 0.4 a | 49.4 ± 0.5 b | ||
| Nelson F1 | 53.9 ± 0.4 a | 49.8 ± 1.2 b | 53.2 ± 0.3 a | ||
| mg SAE/g seed FM | California | 5.21 ± 0.22 a | 5.16 ± 0.06 a | 4.60 ± 0.06 b | |
| Castilla | 4.49 ± 0.17 a | 4.52 ± 0.12 a | 4.47 ± 0.05 a | ||
| Nelson F1 | 6.04 ± 0.04 a | 5.18± 0.12 b | 5.26 ± 0.03 b | ||
| TEAC | mmol TE/g extract | California | 0.468 ± 0.039 a | 0.417 ± 0.035 a | 0.469 ± 0.035 a |
| Castilla | 0.366 ± 0.033 a | 0.360 ± 0.033 a | 0.365 ± 0.032 a | ||
| Nelson F1 | 0.411 ± 0.015 a | 0.418 ± 0.020 a | 0.432 ± 0.015 a | ||
| mmol TE/g seed FM | California | 0.040 ± 0.003 a | 0.036 ± 0.003 a | 0.038 ± 0.003 a | |
| Castilla | 0.034 ± 0.003 a | 0.034 ± 0.003 a | 0.033 ± 0.003 a | ||
| Nelson F1 | 0.033 ± 0.003 b | 0.043 ± 0.002 a | 0.043 ± 0.002 a | ||
| FRAP | mmol Fe2+/g extract | California | 1.61 ± 0.03 a | 1.66 ± 0.05 a | 1.43 ± 0.05 b |
| Castilla | 1.34 ± 0.0 a | 1.30 ± 0.06 a | 1.30 ± 0.08 a | ||
| Nelson F1 | 1.35 ± 0.11 a | 1.15 ± 0.05 b | 1.31 ± 0.04 a | ||
| mmol Fe2+/g seed FM | California | 0.138 ± 0.003 a | 0.144 ± 0.004 a | 0.115 ± 0.004 b | |
| Castilla | 0.123 ± 0.007 a | 0.122 ± 0.006 a | 0.122 ± 0.007 a | ||
| Nelson F1 | 0.151 ± 0.012 a | 0.120 ± 0.005 b | 0.129 ± 0.004 b | ||
| Compound | Unit | Cultivar | Experimental Group | ||
|---|---|---|---|---|---|
| Control | Intensive | Spare | |||
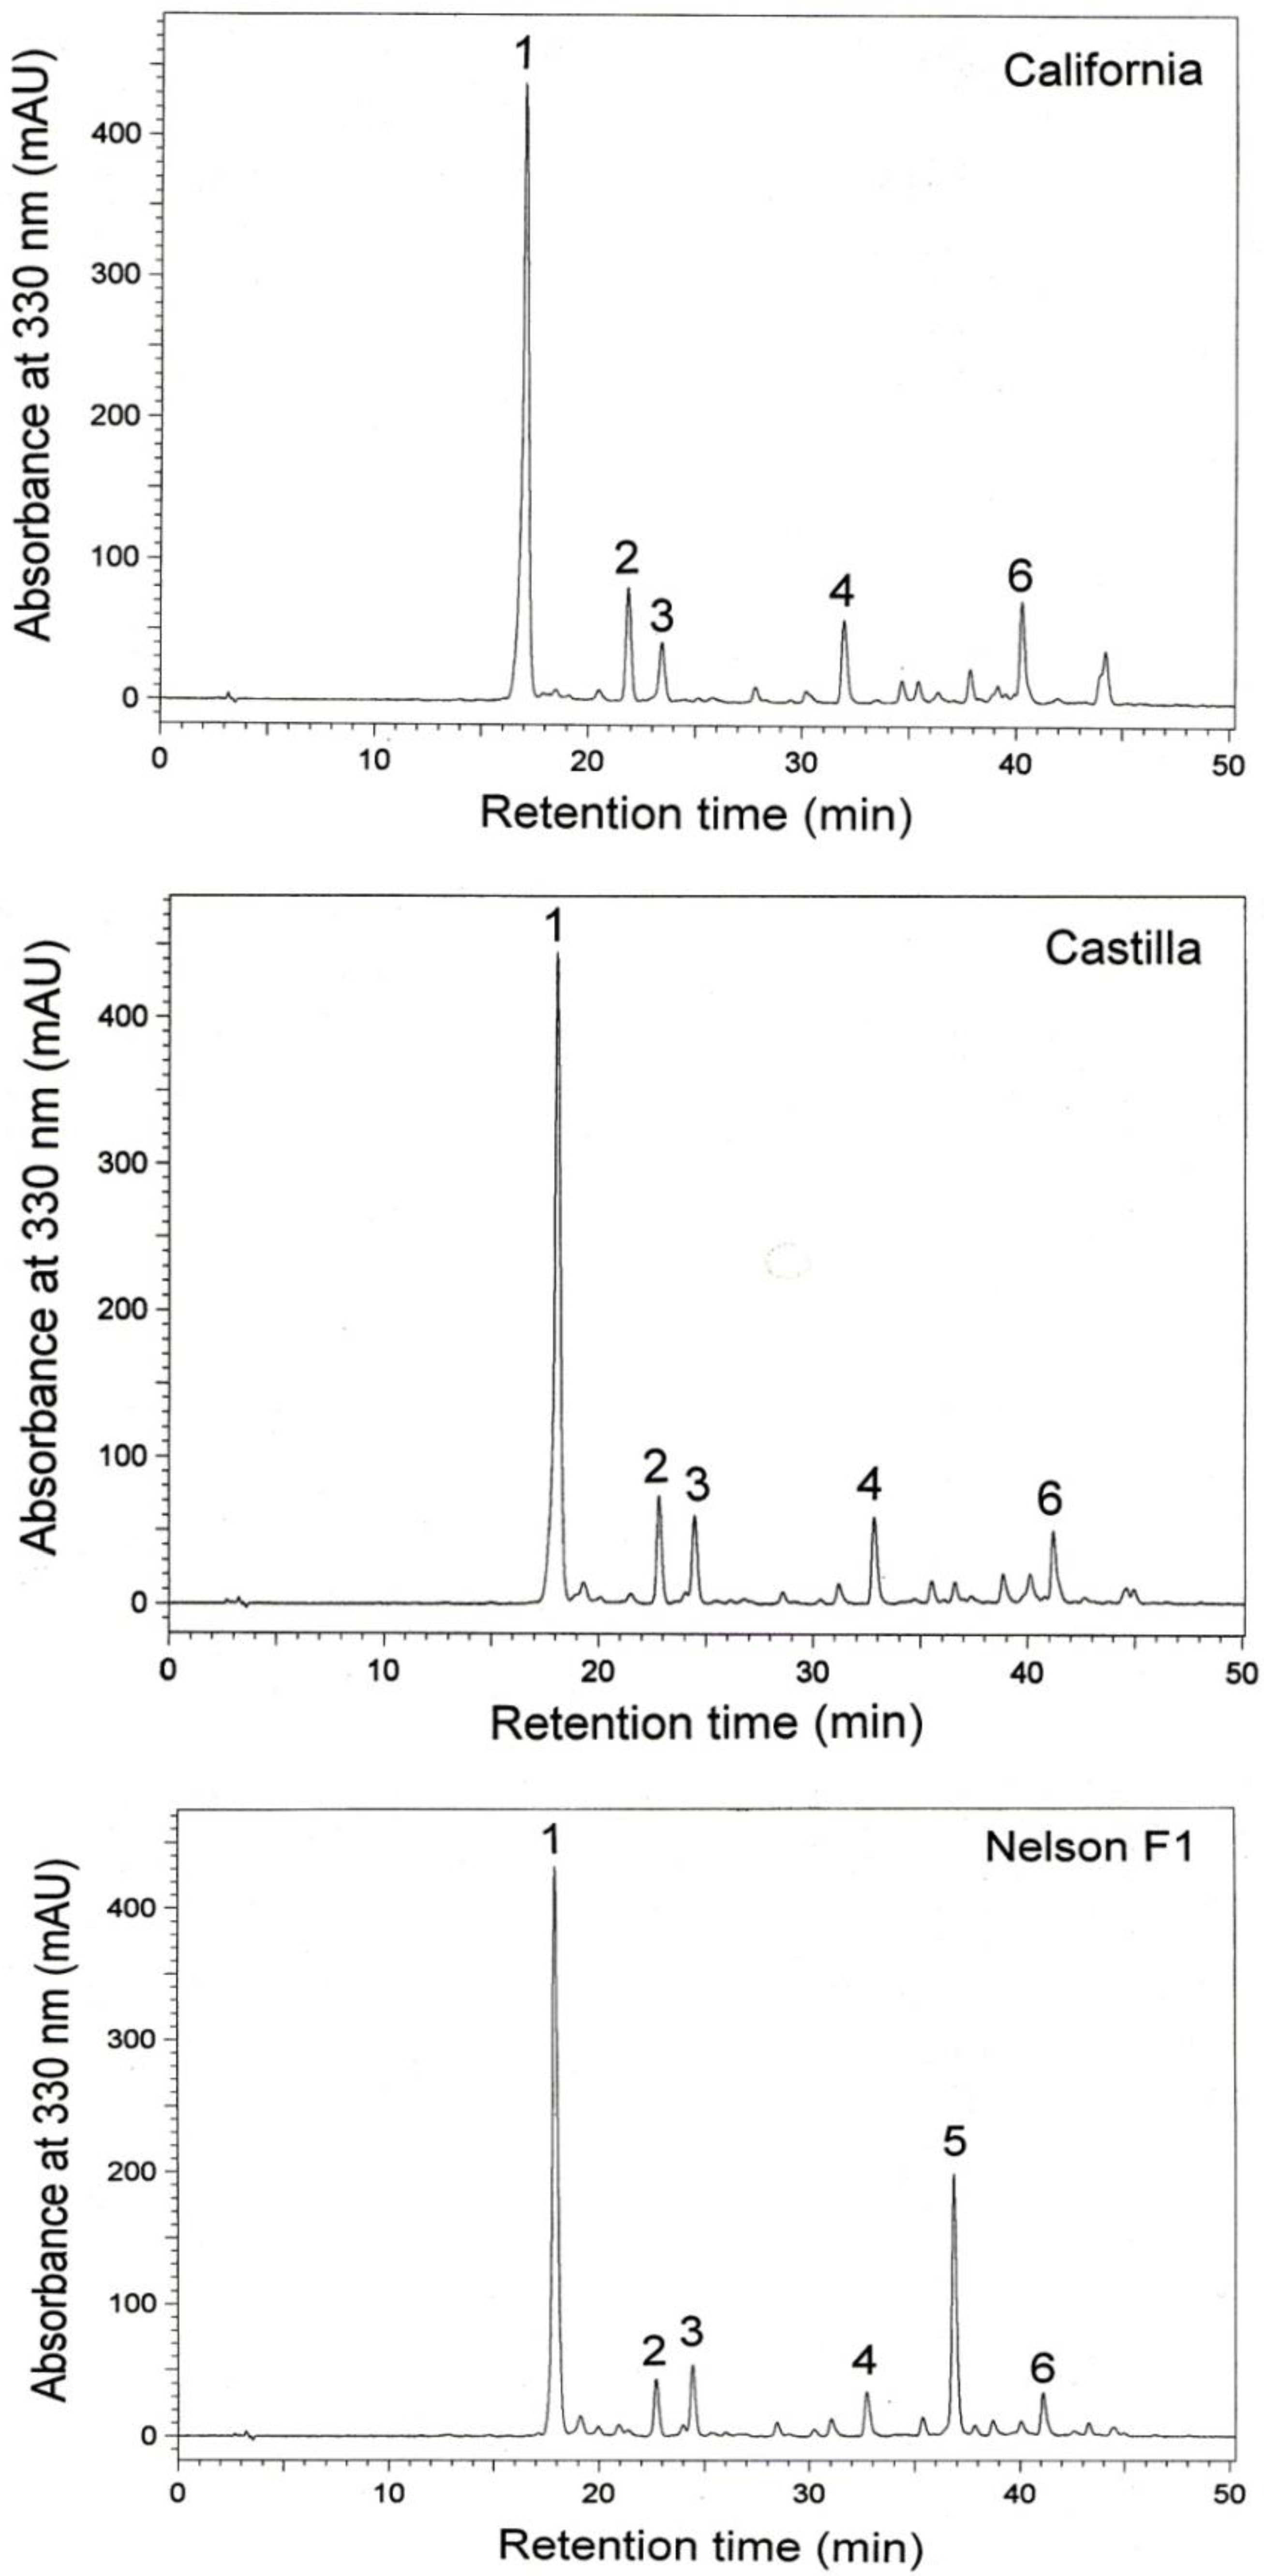
| 1 (Sinapine) | mg/g extract | California | 80.1 ± 1.4 a | 81.9 ± 5.1 a | 76.2 ± 4.0 a |
| Castilla | 76.3 ± 3.4 a | 73.0 ± 5.6 a | 70.1 ± 1.4 a | ||
| Nelson F1 | 65.8 ± 3.0 a | 64.5 ± 3.3 a | 70.8 ± 5.3 a | ||
| mg/g seed FM | California | 6.8 ± 0.1 a | 7.0 ± 0.4 a | 6.2 ± 0.3 a | |
| Castilla | 7.0 ± 0.3 a | 6.8 ± 0.5 a | 6.3 ± 0.1 a | ||
| Nelson F1 | 7.4 ± 0.3 a | 6.7 ± 0.3 a | 7.0 ± 0.5 a | ||
| 2 (Sinapic acid derivative) | mg/g extract | California | 8.4 ± 1.4 a | 7.7 ± 0.6 a | 7.6 ± 0.6 a |
| Castilla | 7.1 ± 0.9 a | 7.1 ± 1.2 a | 6.4 ± 0.2 a | ||
| Nelson F1 | 4.0 ± 0.1 a | 2.5 ± 0.2 b | 3.1 ± 0.8 ab | ||
| mg/g seed FM | California | 0.72 ± 0.03 a | 0.67 ± 0.05 a | 0.61 ± 0.05 a | |
| Castilla | 0.65 ± 0.08 a | 0.66 ± 0.11 a | 0.58 ± 0.02 a | ||
| Nelson F1 | 0.45 ± 0.01 a | 0.26 ± 0.02 b | 0.31 ± 0.08 b | ||
| 3 (Sinapic acid derivative) | mg/g extract | California | 5.6 ± 0.3 a | 5.1 ± 0.2 a | 5.1 ± 0.3 a |
| Castilla | 5.9 ± 0.5 a | 5.9 ± 1.0 a | 5.4 ± 0.5 a | ||
| Nelson F1 | 5.2 ± 0.1 a | 4.9 ± 0.2 a | 5.0 ± 0.6 a | ||
| mg/g seed FM | California | 0.48 ± 0.03 a | 0.44 ± 0.02 a | 0.41 ± 0.02 a | |
| Castilla | 0.54 ± 0.06 a | 0.49 ± 0.06 a | 0.50 ± 0.01 a | ||
| Nelson F1 | 0.58 ± 0.01 a | 0.51 ± 0.02 b | 0.50 ± 0.04 b | ||
| 4 (Sinapic acid) | mg/g extract | California | 6.3 ± 0.4 a | 6.2 ± 0.2 a | 6.1 ± 0.3 a |
| Castilla | 5.9 ± 0.7 a | 5.2 ± 0.6 a | 5.5 ± 0.1 a | ||
| Nelson F1 | 3.8 ± 0.2 a | 3.9 ± 0.5 a | 4.4 ± 0.8 a | ||
| mg/g seed FM | California | 0.54 ± 0.04 a | 0.54 ± 0.03 a | 0.49 ± 0.02 a | |
| Castilla | 0.54 ± 0.06 a | 0.49 ± 0.06 a | 0.50 ± 0.01 a | ||
| Nelson F1 | 0.43 ± 0.02 a | 0.41 ± 0.05 a | 0.44 ± 0.08 a | ||
| 5 (Sinapic acid derivative) | mg/g extract | California | - | - | - |
| Castilla | - | - | - | ||
| Nelson F1 | 18.3 ± 0.5 a | 16.9 ± 1.0 a | 17.1 ± 0.9 a | ||
| mg/g seed FM | California | - | - | - | |
| Castilla | - | - | - | ||
| Nelson F1 | 2.05 ± 0.06 a | 1.76 ± 0.01 b | 1.69 ± 0.09 b | ||
| 6 (Sinapic acid derivative) | mg/g extract | California | 8.5 ± 0.5 a | 8.3 ± 0.2 a | 7.6 ± 0.5 a |
| Castilla | 6.0 ± 0.7 a | 5.7 ± 0.2 a | 6.4 ± 1.5 a | ||
| Nelson F1 | 3.8 ± 0.4 a | 3.2 ± 0.4 a | 3.5 ± 0.8 a | ||
| mg/g seed FM | California | 0.73 ± 0.04 a | 0.72 ± 0.02 a | 0.61 ± 0.04 a | |
| Castilla | 0.55 ± 0.05 a | 0.53 ± 0.05 a | 0.58 ± 0.05 a | ||
| Nelson F1 | 0.43 ± 0.04 a | 0.33 ± 0.04 b | 0.35 ± 0.08 b | ||
| Variables | Regression Equation | Correlation Coefficient |
|---|---|---|
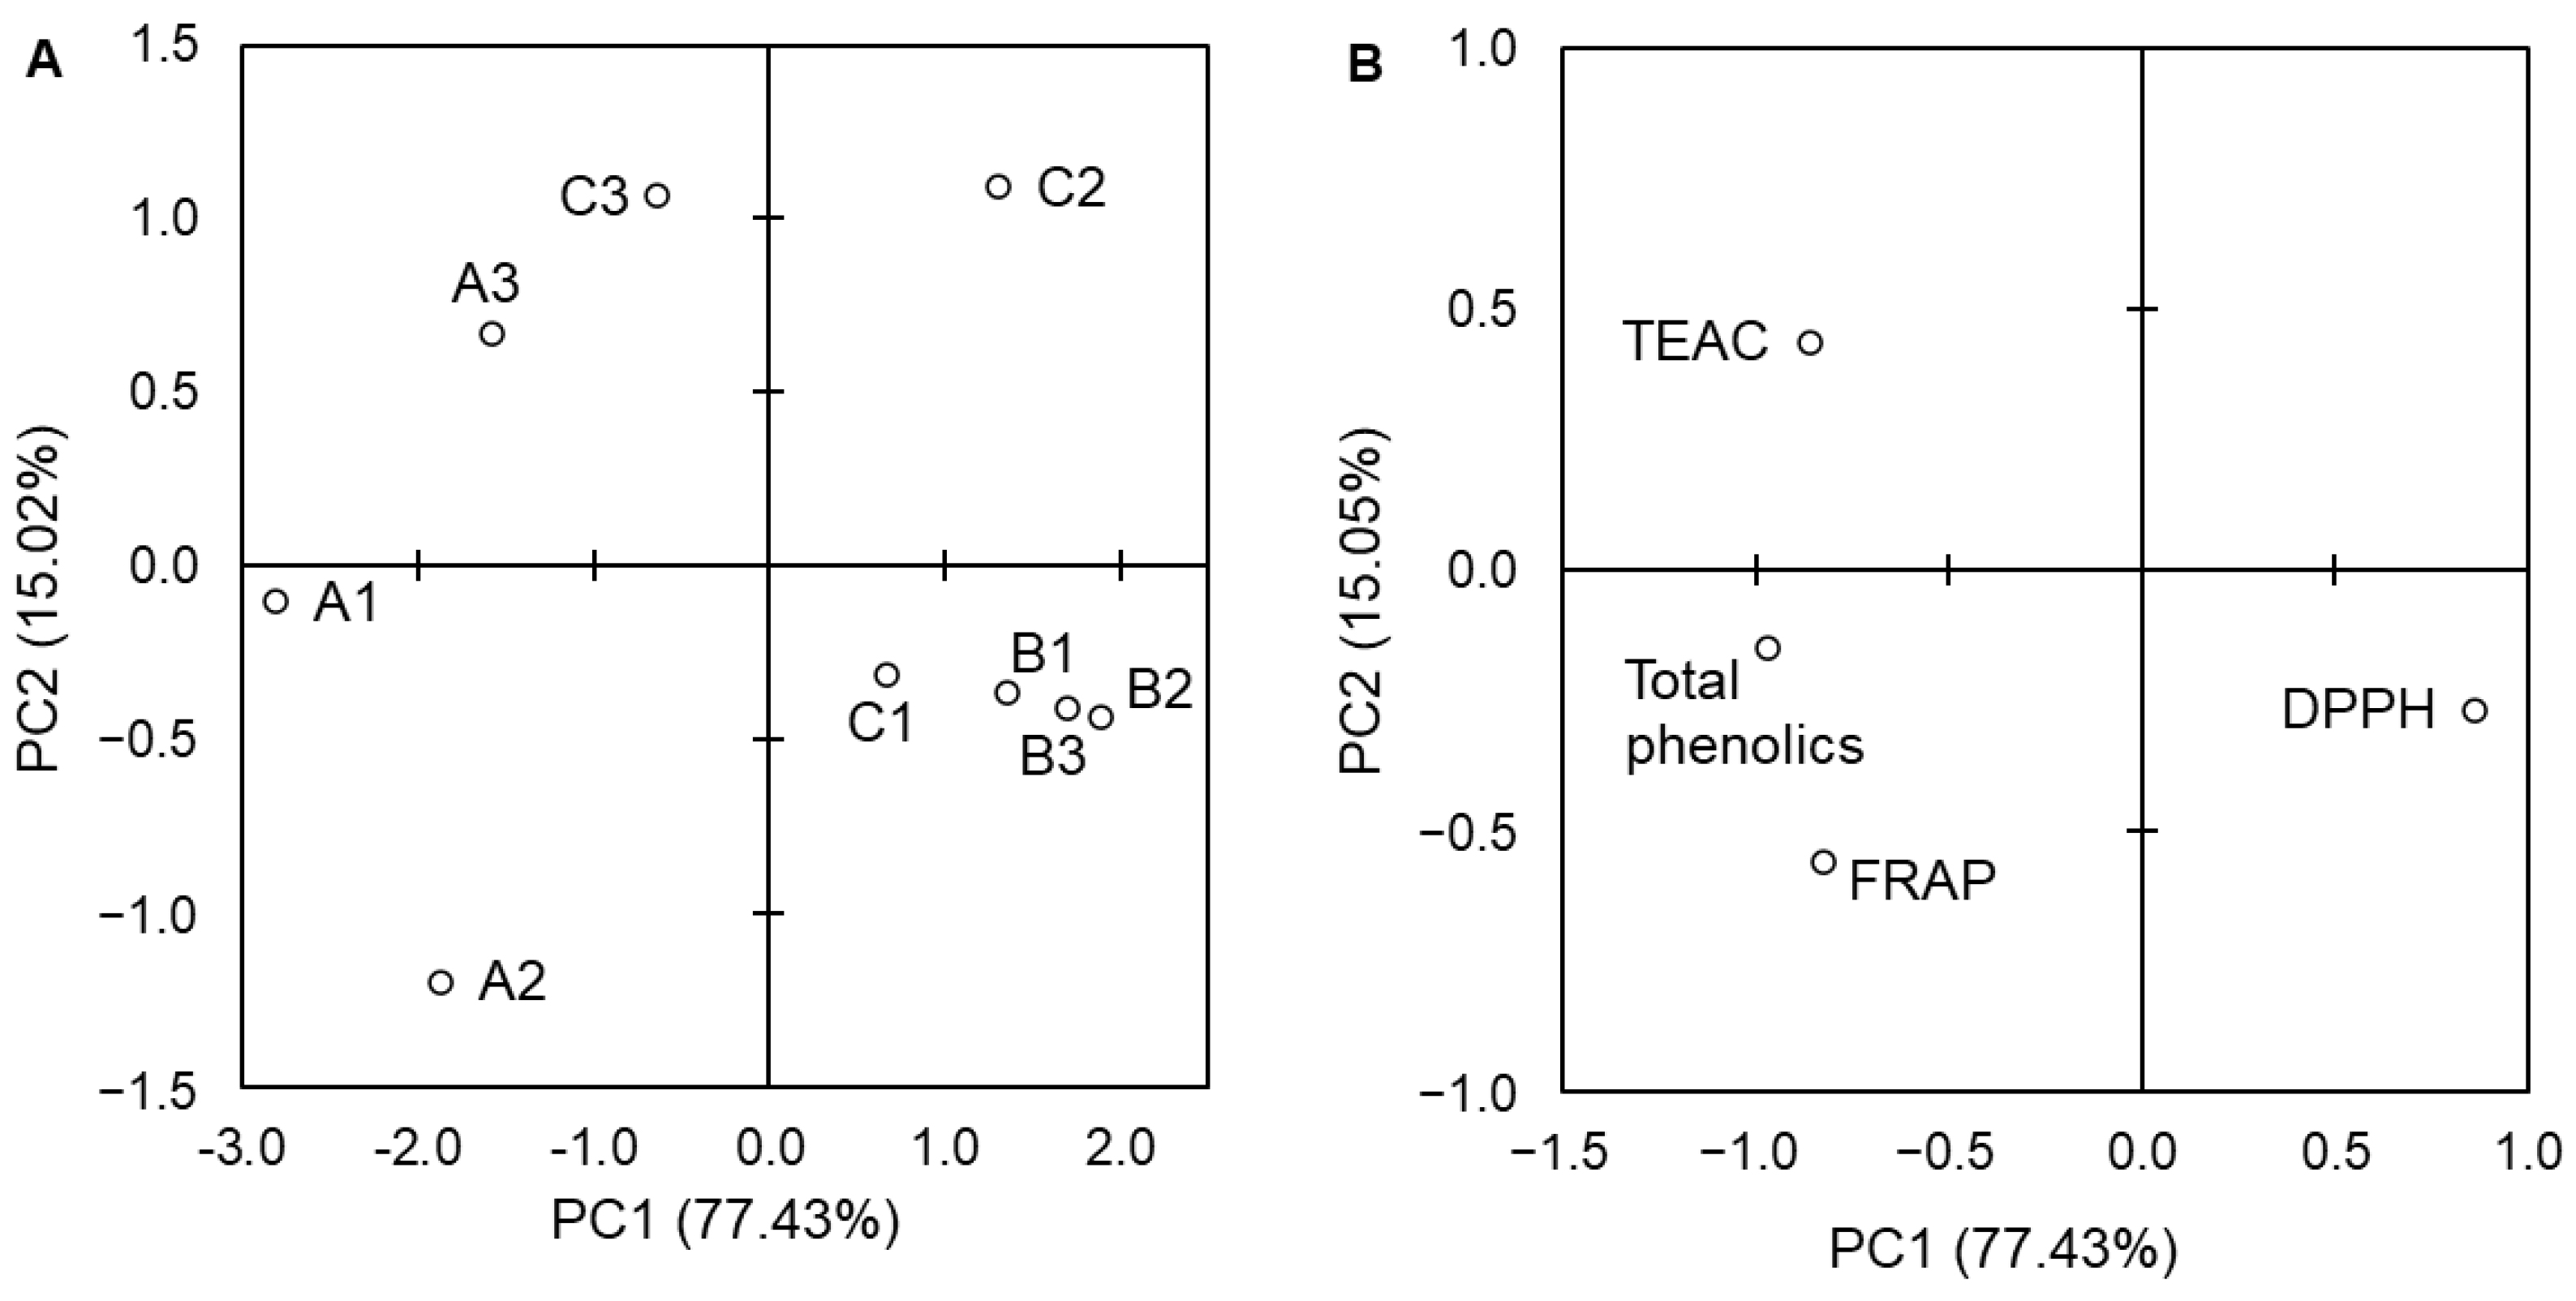
| Total phenolics vs. TEAC | y = 0.0071x + 0.0327 | 0.814 * |
| Total phenolics vs. FRAP | y = 0.0293x + 0.5733 | 0.871 * |
| Total phenolics vs. DPPH | y = −0.0027x + 0.4418 | −0.271 |
| TEAC vs. FRAP | y = 1.740x + 0.667 | 0.672 * |
| TEAC vs. DPPH | y = −0.2182x + 0.3864 | −0.190 |
| FRAP vs. DPPH | y = −0.076x + 0.4016 | −0.255 |
Disclaimer/Publisher’s Note: The statements, opinions and data contained in all publications are solely those of the individual author(s) and contributor(s) and not of MDPI and/or the editor(s). MDPI and/or the editor(s) disclaim responsibility for any injury to people or property resulting from any ideas, methods, instructions or products referred to in the content. |
© 2024 by the authors. Licensee MDPI, Basel, Switzerland. This article is an open access article distributed under the terms and conditions of the Creative Commons Attribution (CC BY) license (https://creativecommons.org/licenses/by/4.0/).
Share and Cite
Amarowicz, R.; Cwalina-Ambroziak, B.; Janiak, M.A.; Damszel, M.; Stępień, A.; Sulewska, K.; Karamać, M.; Penkacik, K. Effect of Fertilization on Phenolics of Rapeseeds and Their Antioxidant Potential. Foods 2024, 13, 561. https://doi.org/10.3390/foods13040561
Amarowicz R, Cwalina-Ambroziak B, Janiak MA, Damszel M, Stępień A, Sulewska K, Karamać M, Penkacik K. Effect of Fertilization on Phenolics of Rapeseeds and Their Antioxidant Potential. Foods. 2024; 13(4):561. https://doi.org/10.3390/foods13040561
Chicago/Turabian StyleAmarowicz, Ryszard, Bożena Cwalina-Ambroziak, Michał Adam Janiak, Marta Damszel, Arkadiusz Stępień, Katarzyna Sulewska, Magdalena Karamać, and Kamila Penkacik. 2024. "Effect of Fertilization on Phenolics of Rapeseeds and Their Antioxidant Potential" Foods 13, no. 4: 561. https://doi.org/10.3390/foods13040561
APA StyleAmarowicz, R., Cwalina-Ambroziak, B., Janiak, M. A., Damszel, M., Stępień, A., Sulewska, K., Karamać, M., & Penkacik, K. (2024). Effect of Fertilization on Phenolics of Rapeseeds and Their Antioxidant Potential. Foods, 13(4), 561. https://doi.org/10.3390/foods13040561