Article

Use of Acetic Acid to Partially Replace Lactic Acid for Decontamination against Escherichia coli O157:H7 in Fresh Produce and Mechanism of Action

1
College of Food and Chemical Engineering, Shaoyang University, Shaoyang 422000, China
2
Institute of Rice Research, Guizhou Academy of Agricultural, Guiyang 550009, China
*
Author to whom correspondence should be addressed.
Foods 2021, 10(10), 2406; https://doi.org/10.3390/foods10102406
Submission received: 6 September 2021 / Revised: 6 October 2021 / Accepted: 7 October 2021 / Published: 11 October 2021

Abstract

:
Escherichia coli O157:H7 is frequently detected in ready-to-eat produce and causes serious food-borne diseases. The decontamination efficacy of lactic acid (LA) is clearly established. In this study, LA was mixed with acetic acid (AA) to reduce costs while achieving consistent or better inhibitory effects. Time-kill curves and inoculation experiments using fresh-cut spinach and arugula indicated that 0.8%LA+0.2%AA shows similar antibacterial effects to those of 1%LA. To determine whether 1%LA and 0.8%LA+0.2%AA exert antibacterial effects by similar mechanisms, proteomics analysis was used. The proteins related to macromolecule localization, cellular localization, and protein unfolding were uniquely altered after the treatment with 1%LA, and the proteins related to taxis, response to stress, catabolic process, and the regulation of molecular function were uniquely altered after the treatment with 0.8%LA+0.2%AA. Based on these findings, combined with the results of a network clustering analysis, we speculate that cell membrane damage is greater in response to LA than to 0.8%LA+0.2%AA. This prediction was supported by cell membrane permeability experiments (analyses of protein, nucleotide, ATP, and alkaline phosphatase leakage), which showed that LA causes greater membrane damage than 0.8%LA+0.2%AA. These results provide a theoretical basis for the application of an acid mixture to replace LA for produce decontamination.

1. Introduction

Fruits and vegetables are rich in essential vitamins, minerals, and fiber [1]. The FDA recommends the daily intake of three to five different vegetables and two to four different fruits [2]. With the acceleration of daily activities, demand for ready-to-eat fruits and vegetables has increased. However, because they are not cooked at high temperatures, there is a higher risk of diseases caused by foodborne pathogens [3]. Escherichia coli O157:H7 is often detected in ready-to-eat foods, particularly in fresh-cut vegetables [4]. According to a report from the United States Centers for Disease Control (CDC), in 2018–2020, there were 539 cases of infection by Escherichia coli O157:H7, of which 489 cases were related to leafy greens. The most serious events occurred in 2018, when romaine lettuce from the Yuma growing region caused 210 infections in 36 states, including 96 hospitalizations, 27 patients who developed a type of kidney failure called hemolytic uremic syndrome, and five deaths in Arkansas, California, Minnesota, and New York (CDC: Reports of Selected E. coli Outbreak Investigations) [5]. Therefore, decontamination is an effective method to ensure the safety of ready-to-eat vegetables.
For fresh fruits and vegetables, non-thermal technologies have shown antibacterial effects without affecting the quality. For example, bacteriophages, cold plasma, and pulsed light technologies have been effectively applied to fresh produce [6,7]. However, the technical equipment is relatively expensive, and the methods are not suitable for the large-scale decontamination of fresh produce. Chemical decontamination methods benefit from a low cost and moderate efficacy; among the established chemical sanitizers, chlorine-based agents have the lowest cost and moderate efficacy, and the concentration of free chlorine was recommended as 10–200 mg/L [6,8,9]. Recent research on chlorine sanitizers is focused on the prevention of the cross-contamination of the washing water [10,11,12,13]. However, chlorine sanitizers were criticized because they generate carcinogenic byproducts (e.g., trihalomethanes, haloacetic acids, haloketones, and chloropicrin) and form chlorate during fresh produce decontamination [6,14,15].
As another type of sanitizer, most organic acids are listed as generally recognized as safe (GRAS) by the FDA, and some studies have indicated that they have a higher efficacy than that of chlorine [16,17,18]. Lactic acid (LA) is the most widely used GRAS organic acid for fresh produce decontamination. However, lactic acid (LA) is relatively expensive. Among the GRAS organic acids (i.e., citric acid, acetic acid, lactic acid, malic acid, succinic acid, tartaric acid, and propionic acid), acetic acid (AA) has the lowest cost, which is about one-third that of LA [2].
In this study, the use of AA to partially replace LA for decontamination was evaluated. Fresh-cut baby spinach and arugula were selected as the models for the analyses of decontamination against E. coli O157:H7. Furthermore, the antibacterial activities of organic acids can be attributed to cellular anion accumulation, which is determined by the proportion of undissociated molecules. Compared with dissociated anions, undissociated acidic molecules have stronger lipophilicity, allowing them to penetrate the microbial cell membrane more easily. After penetration, the higher intracellular pH in the environment will promote acid molecule dissociation, and the dissociated anions will accumulate in the cell and exert toxic effects on DNA, RNA, and ATP synthesis [14,19] and promote acid-sensitive protein denaturation and changes in osmotic pressure [20]. We speculate that the effects of the acid mixture (AM) and LA are mediated by different underlying mechanisms, irrespective of the count reduction, due to the addition of dissociated acetate anions. Therefore, another objective of this work was to evaluate the difference in the mechanism underlying the effects of LA and AM using quantitative proteomic technology.

2. Materials and Methods

2.1. Time-Kill Curve Analysis

A single colony of E. coli O157:H7 (NCTC12900) was inoculated into nutrient broth (Hopebio, Qingdao, China) and cultured overnight at 37 °C. After adjusting the culture to 107–108 CFU/mL, 5 mL was centrifuged at 12,000× g for 10 min to obtain the cell pellet, followed by three washing steps using 0.85% NaCl solution. Then, the cells were resuspended in 1 mL of sterilized distilled water and supplemented with 4 mL of sanitizer to obtain the desired sanitizer concentration. The treatment groups were treated with 0.8%LA+0.2%AA, 0.6%LA+0.4%AA, 1%LA, and 1% AA, and the control group was treated with sterilized distilled water. After reaction for 0, 20, 40, 60, and 90 s, 1 mL of the above mixture was mixed with 5 mL of 0.04 M K2HPO4·3H2O to neutralize the sanitizer [21].
After serial dilution, the suspension (0.1 mL) was surface-plated on modified sorbitol MacConkey agar (Hopebio, Qingdao, China) for the quantification of E. coli O157:H7.

2.2. Sample Preparation

Baby spinach and arugula were purchased from Microgreens (Guangzhou, China). After removing the stem and broken leaves, the remaining parts were rinsed for 30 s to remove dirt. The obtained samples were drained using a manual salad spinner sterilized with 75% ethanol.

2.3. Inoculation

The inoculation procedure followed our previously described methods [3,14]. A single colony of E. coli O157:H7 was inoculated into nutrient broth and cultured overnight at 37 °C. After adjusting the suspension to 109 CFU/mL, 0.5 or 5 mL was added into two stomacher bags containing 200 mL of sterilized 0.85% NaCl solution. Then, 10 g of sample was added to the bag and massaged for 20 min. The sample was then placed on a sterilized plastic tray in a biosafety cabinet for air drying and stored at 4 °C for 12 h to ensure sufficient bacterial attachment. The resulting samples showed a low inoculation level (103–104 CFU/g) and high inoculation level (106–107 CFU/g).

2.4. Decontamination and Microbiological Analysis

Minimizing water consumption and wastewater discharge rates remain challenging in the food industry [8]; thus, a ratio of 1:20 (w/v) that was sufficient to cover fresh-cut baby spinach and arugula was selected in this study. Inoculated samples were added to the sanitizers (as described in Section 2.1) and disinfected for 1.5 min under shaking at 120 rpm. The samples were then washed with tap water for 15 s to remove the residual sanitizer. The samples were transferred to a polyethylene terephthalate box (18 × 13 × 4 cm), packaged using a polyvinyl chloride cling film (Nan Ya, Taiwan, China), and stored at 4 °C [19]. The samples were analyzed on days 3, 5, and 7 [14]. Fifteen grams of each sample were homogenized with 85 mL of sterilized 0.85% NaCl solution for 1.5 min in a stomacher bag [14]. The microbiological counts were obtained as described in Section 2.1.

2.5. Sensory Analysis

Sensory analysis was performed at the end of storage (day 7). Nine trained panelists (ages 24–39 years) from Shijiashike Co. Ltd. (Liaoyang, Liaoning, China) were invited to evaluate sensory color, flavor, and crispness. A 3-point scale method, as described by Wang et al. [14], was used for evaluation: 0 ‘dislike extremely, no characteristic of the product’, 5 ‘neither like nor dislike, acceptability threshold’, and 10 ‘like extremely, very good product characteristics’. The plates containing samples were marked on the bottom and reordered before analysis. During the evaluation, only one person was allowed into the room (equipped with a 40-W white light without windows) and was not allowed to communicate with another person after evaluation. Between each time analysis of the flavor, drinking water was used to rinse the mouth three times, and the next evaluation was performed after 30 s.

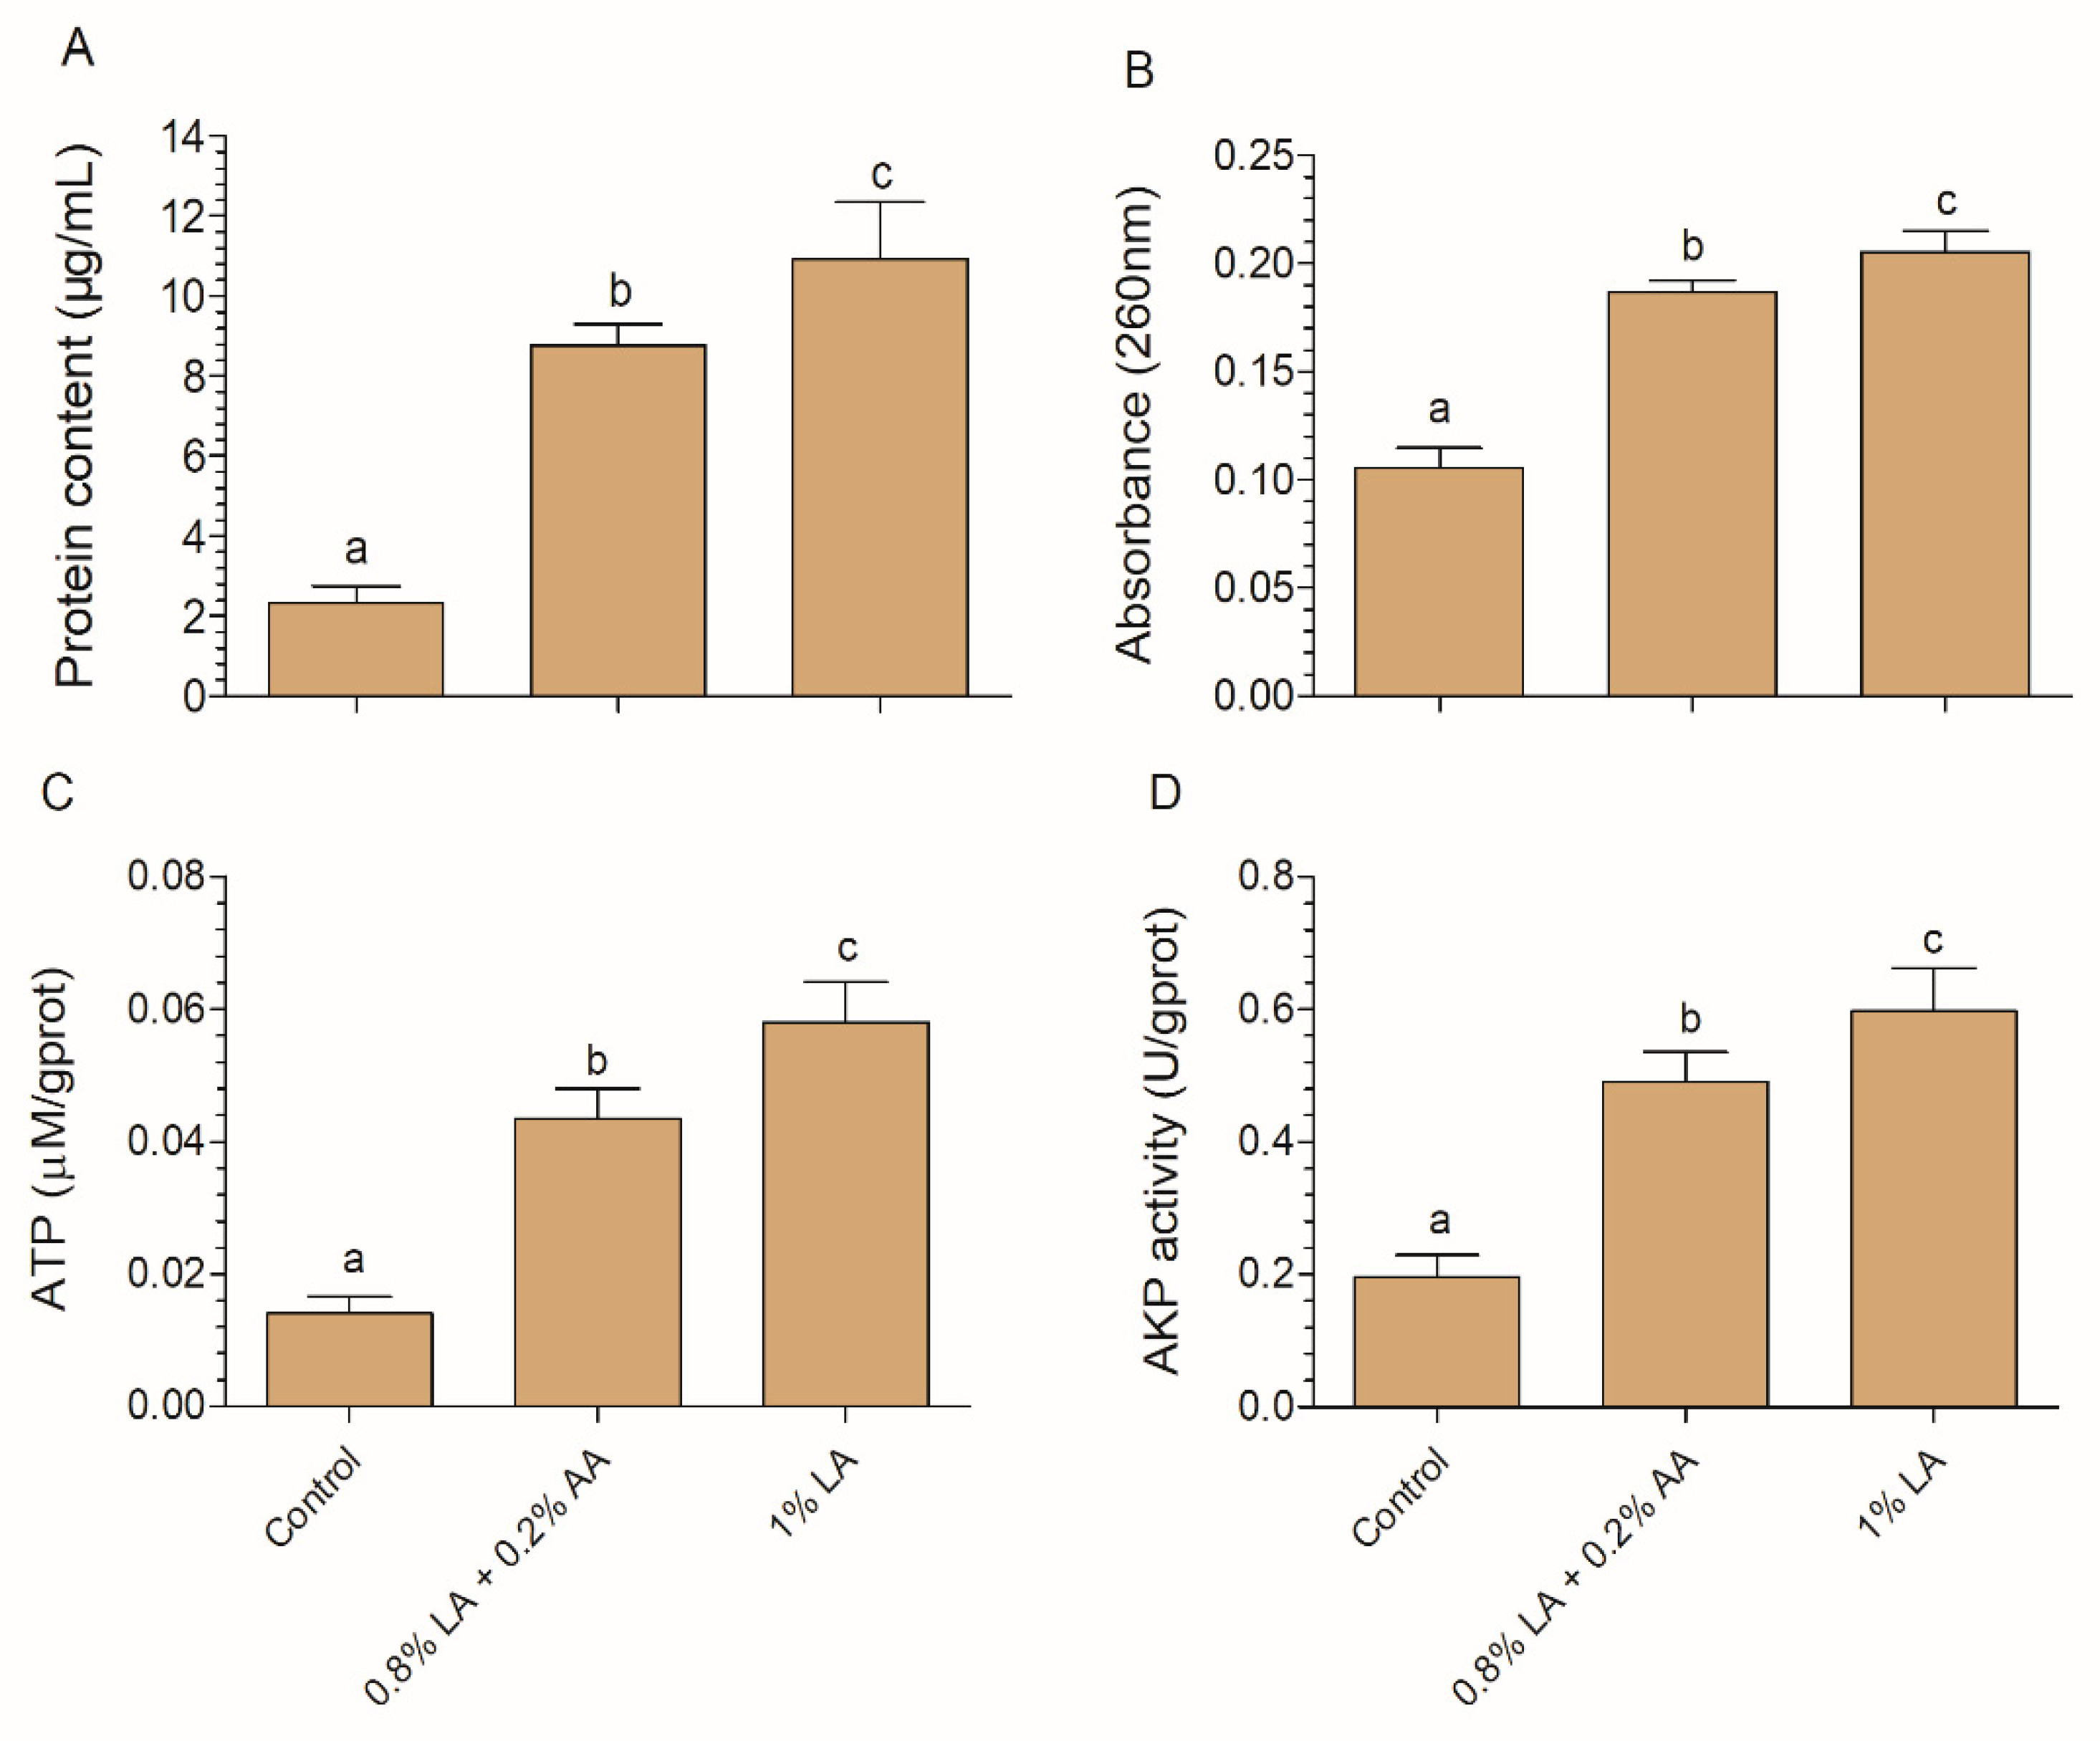
2.6. Protein, Nucleotide, ATP, and AKP Leakage Analysis

After disinfection (treatment for 20 s) and neutralization, as described in Section 2.1, cells were centrifugated at 12,000× g for 10 min. The supernatants were filtered through 0.22 μm filters. The protein and nucleotide concentration in the supernatants was measured by a micro protein assay [22] and at a wavelength of 260 nm [23], respectively. ATP concentration and alkaline phosphatase (AKP) activity in the supernatants was measured using test kit (Jiancheng, Nanjing, China).

2.7. Proteomic Analysis

2.7.1. Protein Preparation

After disinfection (treatment for 20 s) and neutralization as described in Section 2.1, the cells were collected from the neutralization fluid using a membrane filter (0.22 µm; Millipore, Darmstadt, Germany). The cells on the membrane were washed off using SDT buffer (4% SDS, 100 mM Tris–HCl, 100 mM DTT, pH 8.0), followed by grinding under liquid nitrogen. The samples were then placed in a 100 °C boiling water bath for 10 min, subjected to ultrasonic treatment for 5 min in an ice bath (25 W for 3 s at intervals of 7 s), added to a 100 °C boiling water bath for 5 min, and centrifuged at 14,000× g for 30 min. The samples were filtered in a ultrafiltration tube (0.22 μm), and the protein concentration was quantified using BCA Test Kit (Beyotime, Shanghai, China).

2.7.2. Protein Digestion and Peptide Labeling

Total protein from each sample was digested using filter-aided proteome preparation (FASP) method, as described by Wisniewski et al. [24]. The peptide mixture was labeled using the 10-plex™ Isobaric Mass Tagging Kit (Thermo Scientific, Waltham, MA, USA) according to the manufacturer’s instructions.

2.7.3. Peptide Fractionation

To improve the peptide identification quality, fractionation was performed using the Dionex UltiMate3000 HPLC System (Thermo Fisher, Waltham, MA, USA). The Gemini-NX 4.6 × 150 mm column (3 µm, 110 Å) (00F-4453-E0; Phenomenex, Torrance, CA, USA) was used as the chromatographic column. Elution was performed at a flow rate of 400 μL/min with a gradient of 100% buffer A (10 mM ammonium acetate, pH 10.0) for 5 min, 0–40% buffer B (10 mM ammonium acetate in 90% ACN, pH 10.0) for 20 min, 40–100% buffer B for 7 min, and 0–100% buffer A for 8 min. After fractionation, 40 fractions were subjected to vacuum centrifugation, reconstituted into 10 parts, and freeze-dried. The samples were stored at −80 °C until LC–MS/MS.

2.7.4. LC–MS/MS

After equilibrating the Thermo Scientific separation column (75 μm × 25 cm, 5 μm, 100 Å, C18) with 95% buffer A (0.1% formic acid), the sample was automatically loaded on the Thermo Scientific EASY Trap Column (100 μm × 2 cm, 5 μm, 100 Å, C18) and then separated with a linear gradient: 5–28% buffer B (0.1% formic acid in acetonitrile) for 40 min; 28% to 90% buffer B for 2 min; 90% buffer B for 18 min. Orbitrap-ELite (Thermo Finnigan, San Jose, CA, USA) mass spectrometer was used for the analysis. The detailed mass spectrometry parameters were as follows: detection mode: positive ion; scan range of precursor ions: 350–2000 m/z; resolution of MS: 60,000 at m/z 200; AGC target: 1e6; Maximum IT for MS: 10 ms; number of scan ranges: 1; dynamic exclusion: 30 s; most intense signals for MS/MS: top 15; MS2 activation type: HCD; isolation window: 2 m/z; resolution of MS/MS: 15,000 at m/z 100; microscans: 1; maximum IT for MS/MS: 100 ms; AGC target: 5e4; normalized collision energy: 35 eV; underfill ratio: 0.1%.

2.7.5. Database Searching and Data Analysis

The raw data obtained as described in Section 2.7.4 were processed using Proteome Discover 2.3. A search for fragmentation spectra was performed using the Mascot search engine embedded in Proteome Discoverer against the uniprot_Escherichia_coli_O157:H7. fasta database. The search parameters were as follows: Type of search: MS/MS Ion search; Enzyme: Trypsin; Mass Values: Monoisotopic; Max Missed Cleavages: 2; Fixed modifications: Carbamidomethyl (C), TMT 10plex (N-term), TMT 10plex (K); Variable modifications: Oxidation (M); Peptide Mass Tolerance: ±20 ppm; Instrument type: ESI-TRAP; Fragment Mass Tolerance: 0.1 Da; Protein Mass; Unrestricted; Decoy database pattern: Ture; Database: uniprot-Escherichia_coli_O157:H7.fasta. Peptide identification results were filtered against the standard for a false discovery rate of <1%. Peptide ion peak intensities were collected, and the median peptide ratio was calculated. Then, protein quantification data from each channel were processed by the median normalization method to obtain the final protein quantification results.

2.8. Bioinformatics and Statistical Analysis

A fold change of >1.2 and p < 0.05 were thresholds for the identification of differentially expressed proteins (DEPs) [25]. A Gene Ontology (GO) enrichment analysis was performed using Blast2GO (https://www.blast2go.com/ (accessed on 1 May 2021)) [26]. Protein–protein interaction networks were analyzed using STRING (http://string-db.org/ (accessed on 10 July 2021)) [27], and the interaction score was set to 0.7.
Data for sensory characteristics, microbial counts, protein, and nucleotide leakage were analyzed using SPSS 22.0. Differences in mean values were analyzed using Duncan’s multiple range tests, and p-values of <0.05 were considered significant. All data were expressed as means ± standard deviations. All experiments were independently replicated three times. Three samples were taken on each sampling day and were analyzed in duplicate for a total of six analyses per replicate.

3. Results and Discussion

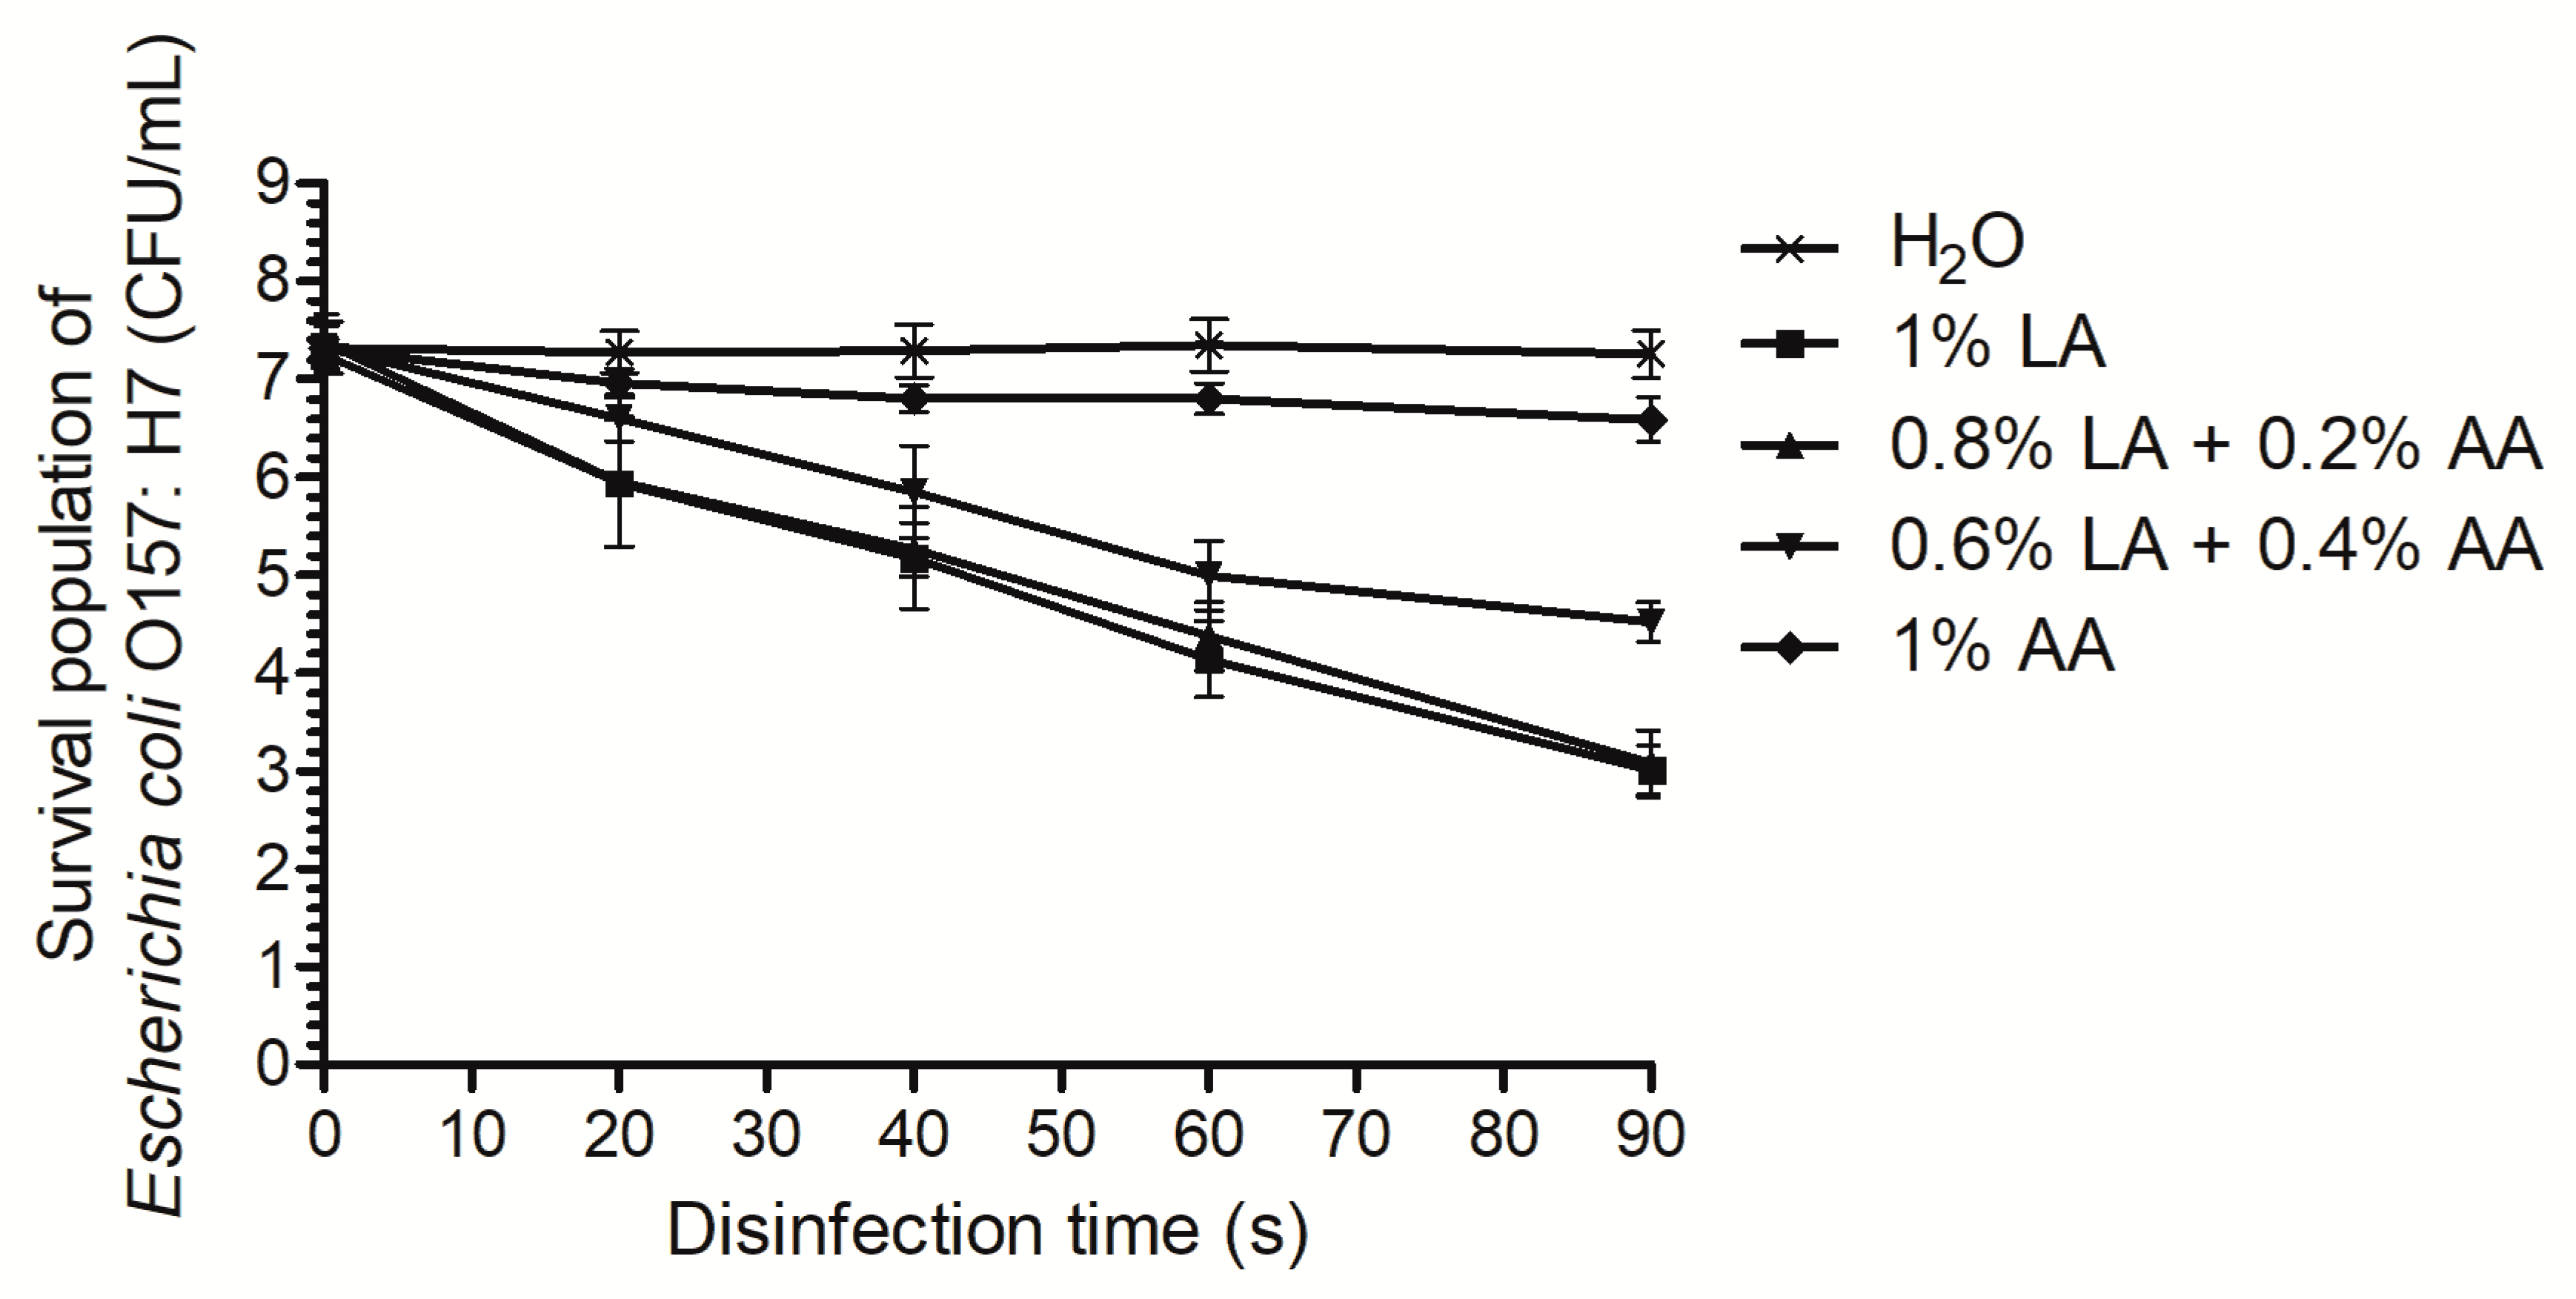
3.1. Time-Kill Curves

Before the fresh produce decontamination and proteomic analyses, it is necessary to determine the time-kill curves under pure culture conditions. We found that 1%AA had the weakest antibacterial effect. After disinfection for 20 s, 1%AA only resulted in a 0.35 log reduction of the E. coli O157:H7, and, at the end of the disinfection period (90 s), only a 0.73 log reduction was observed (Figure 1). When the LA was included, the antibacterial effect was improved. In particular, 0.6%LA+0.4%AA reduced the E. coli O157:H7 by 0.73 log after 20 s and by 2.81 log at 90 s. When the concentration of LA was increased, 0.8%LA+0.2%AA resulted in a 4.29 log reduction in the E. coli O157:H7 within 90 s and showed a similar effect to that of 1% LA. Since long-term disinfection may alter the expression of most proteins, short disinfection periods should be selected for further proteomics analysis [25,28]. Therefore, 0.6%LA+0.4%AA, 0.8%LA+0.2%AA, and 1%LA were selected as the treatment groups for subsequent analyses of the decontamination of fresh produce, and 0.8%LA+0.2%AA and 1%LA for 20 s were selected for a proteomic analysis.

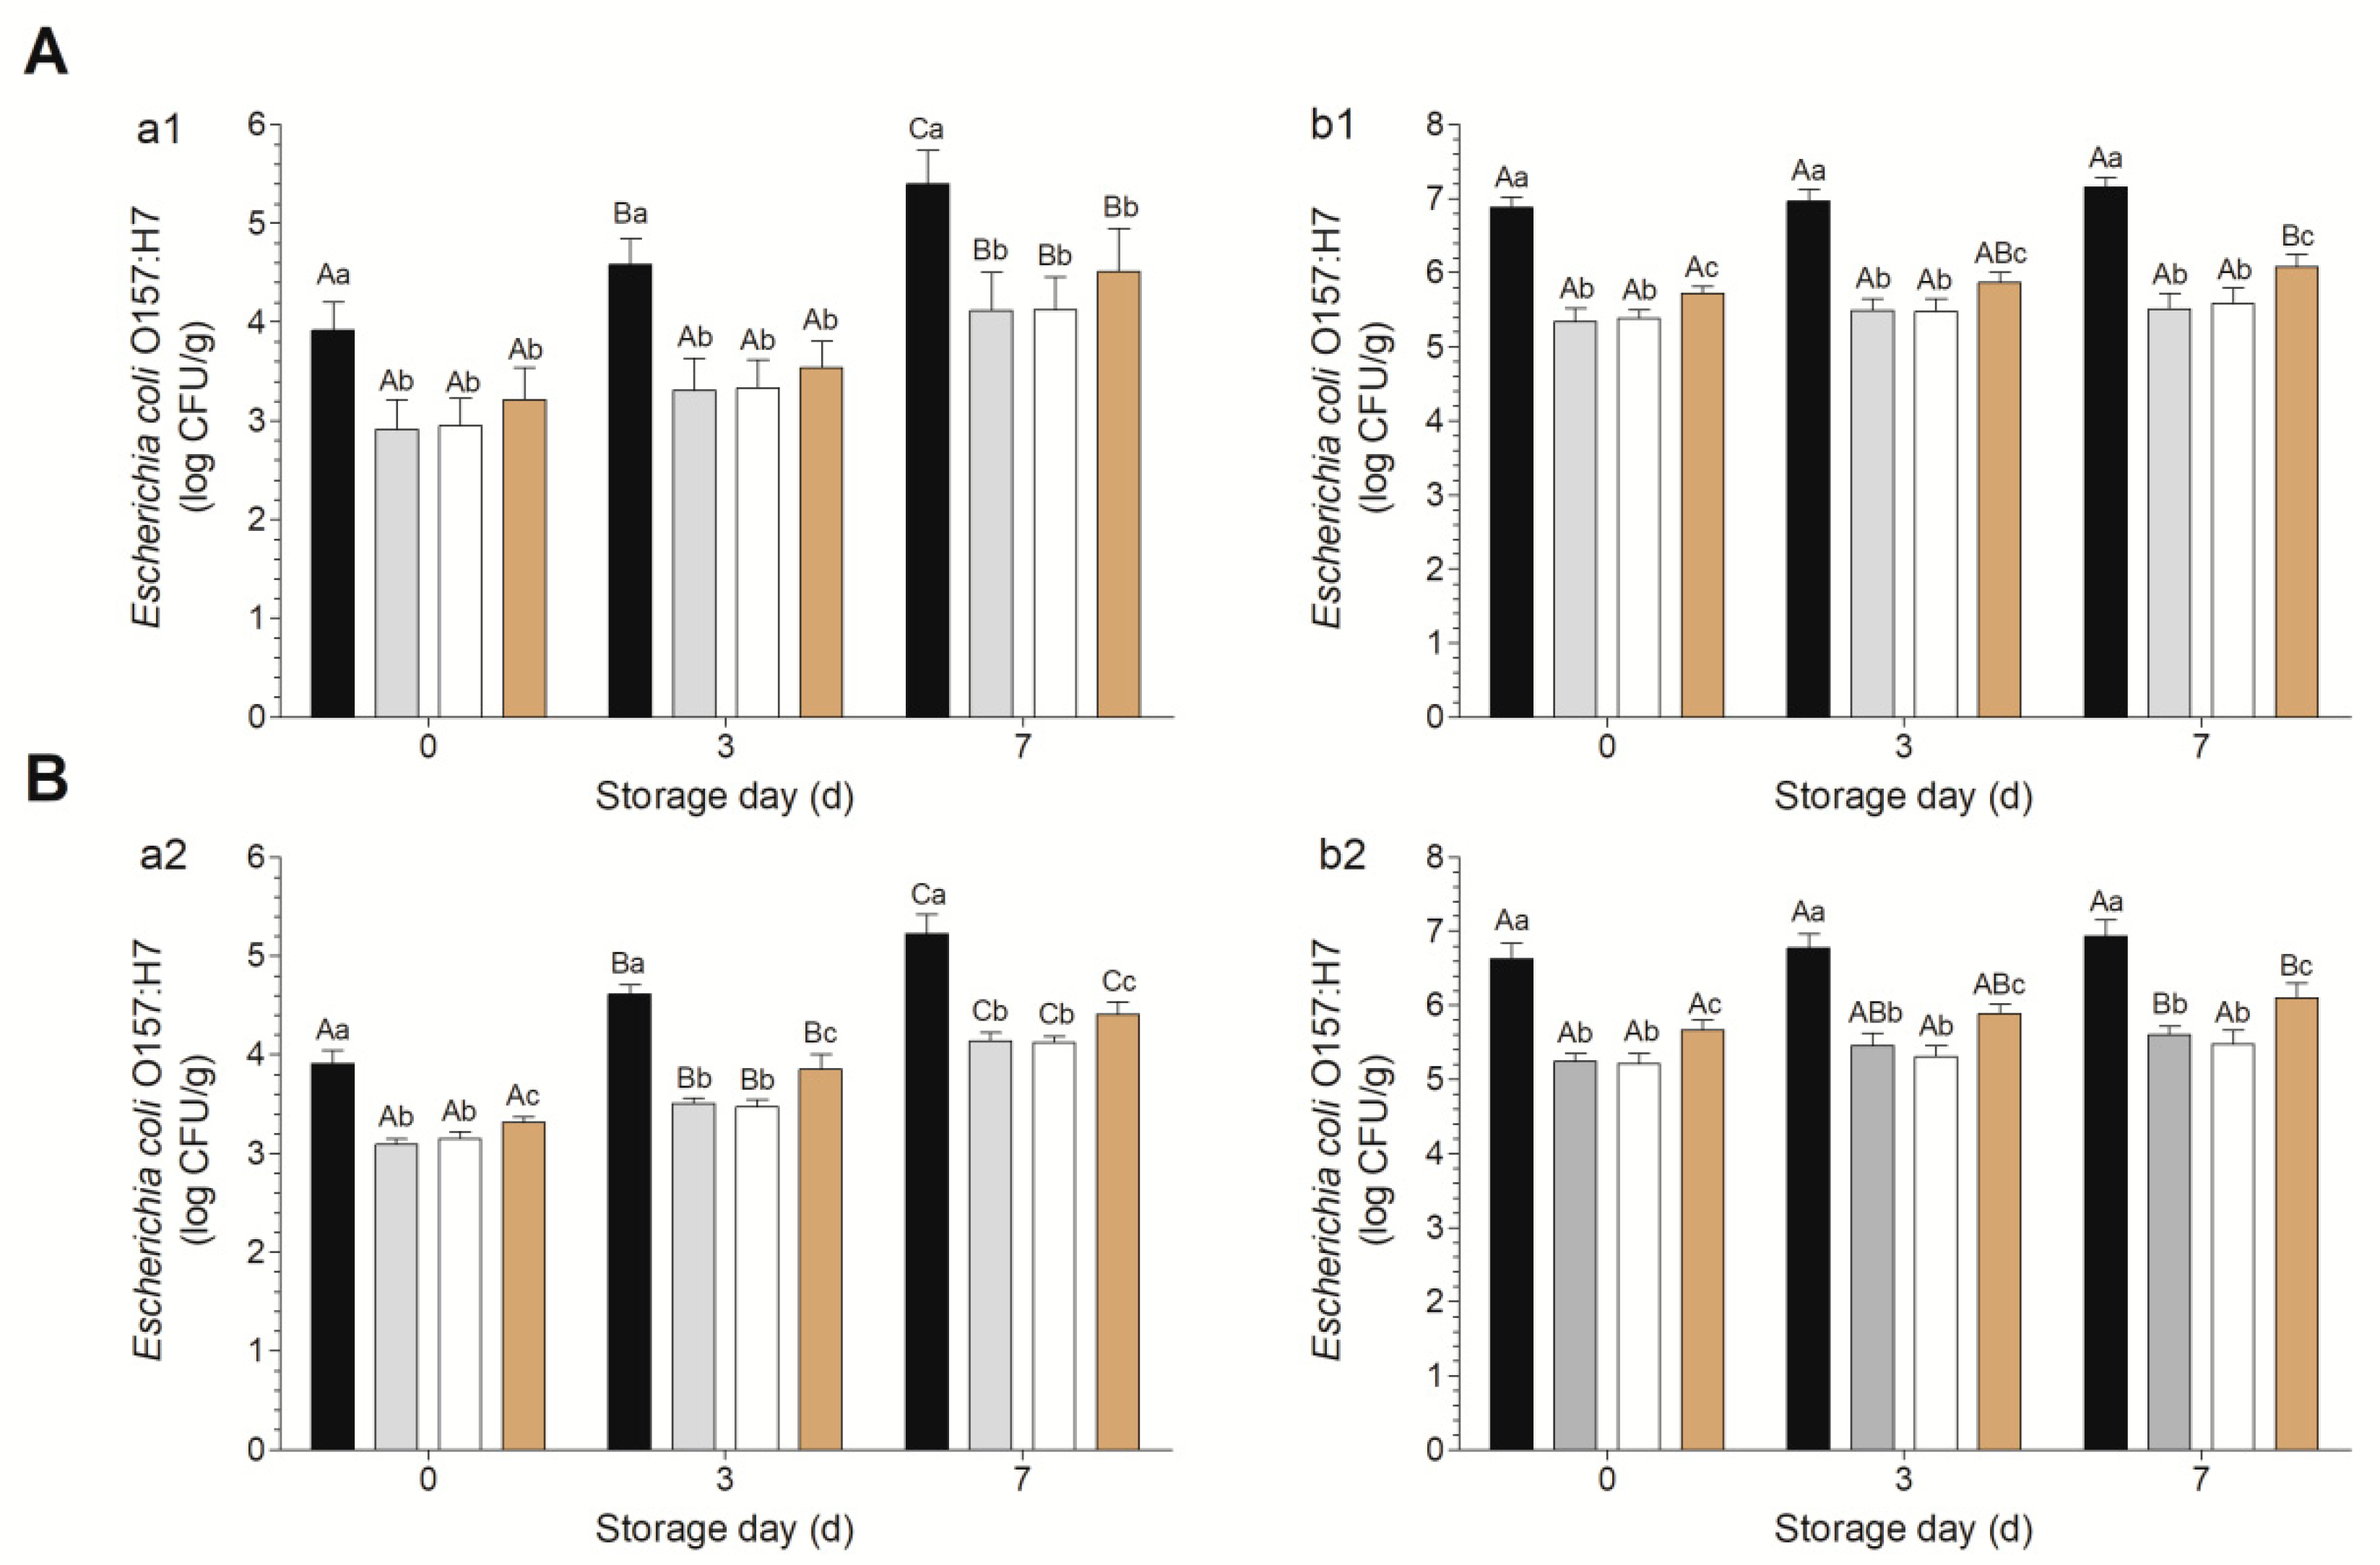
3.2. Decontamination Efficacies of Various Combinations against Escherichia coli O157:H7 on Fresh-Cut Baby Spinach and Arugula

Owing to the complex and diverse contamination conditions for fresh-cut vegetables [29], two levels of contamination were evaluated in this study, low (103–104 CFU/g) and high (106–107 CFU/g). Under low contamination conditions, the E. coli O157:H7 on fresh-cut spinach and arugula increased significantly as the storage time increased (Figure 2a1,a2). The treatment with 1%LA and 0.8%LA+0.2%AA resulted in the lowest counts, with no significant difference between these two groups. From days 3 to 7, the effect of 0.6%LA+0.4%AA was significantly greater than those of the other two groups on fresh-cut arugula (Figure 2a2). For high contamination, the E. coli in the control group did not increase significantly from days 0 to 7, consistent with the results of previous studies [14,30], and the effects of 1%LA were similar to those of 0.8%LA+0.2%AA from days 0 to 7, and these two groups showed significantly lower E. coli O157:H7 counts than those of the 0.6% LA+0.4%AA group (Figure 2b1,b2). Counts on day 0 and day 7 differed significantly in the 0.6% LA+0.4%AA group but not in the other two groups (Figure 2b1,b2), indicating that 1%LA and 0.8%LA+0.2%AA are more suitable than 0.6%LA+0.4%AA for the decontamination of fresh-cut spinach and arugula with high E. coli O157:H7 contamination. In summary, irrespective of the contamination level, 1% LA and 0.8%LA+0.2%AA are recommended, consistent with the results of the time-kill curve analyses.

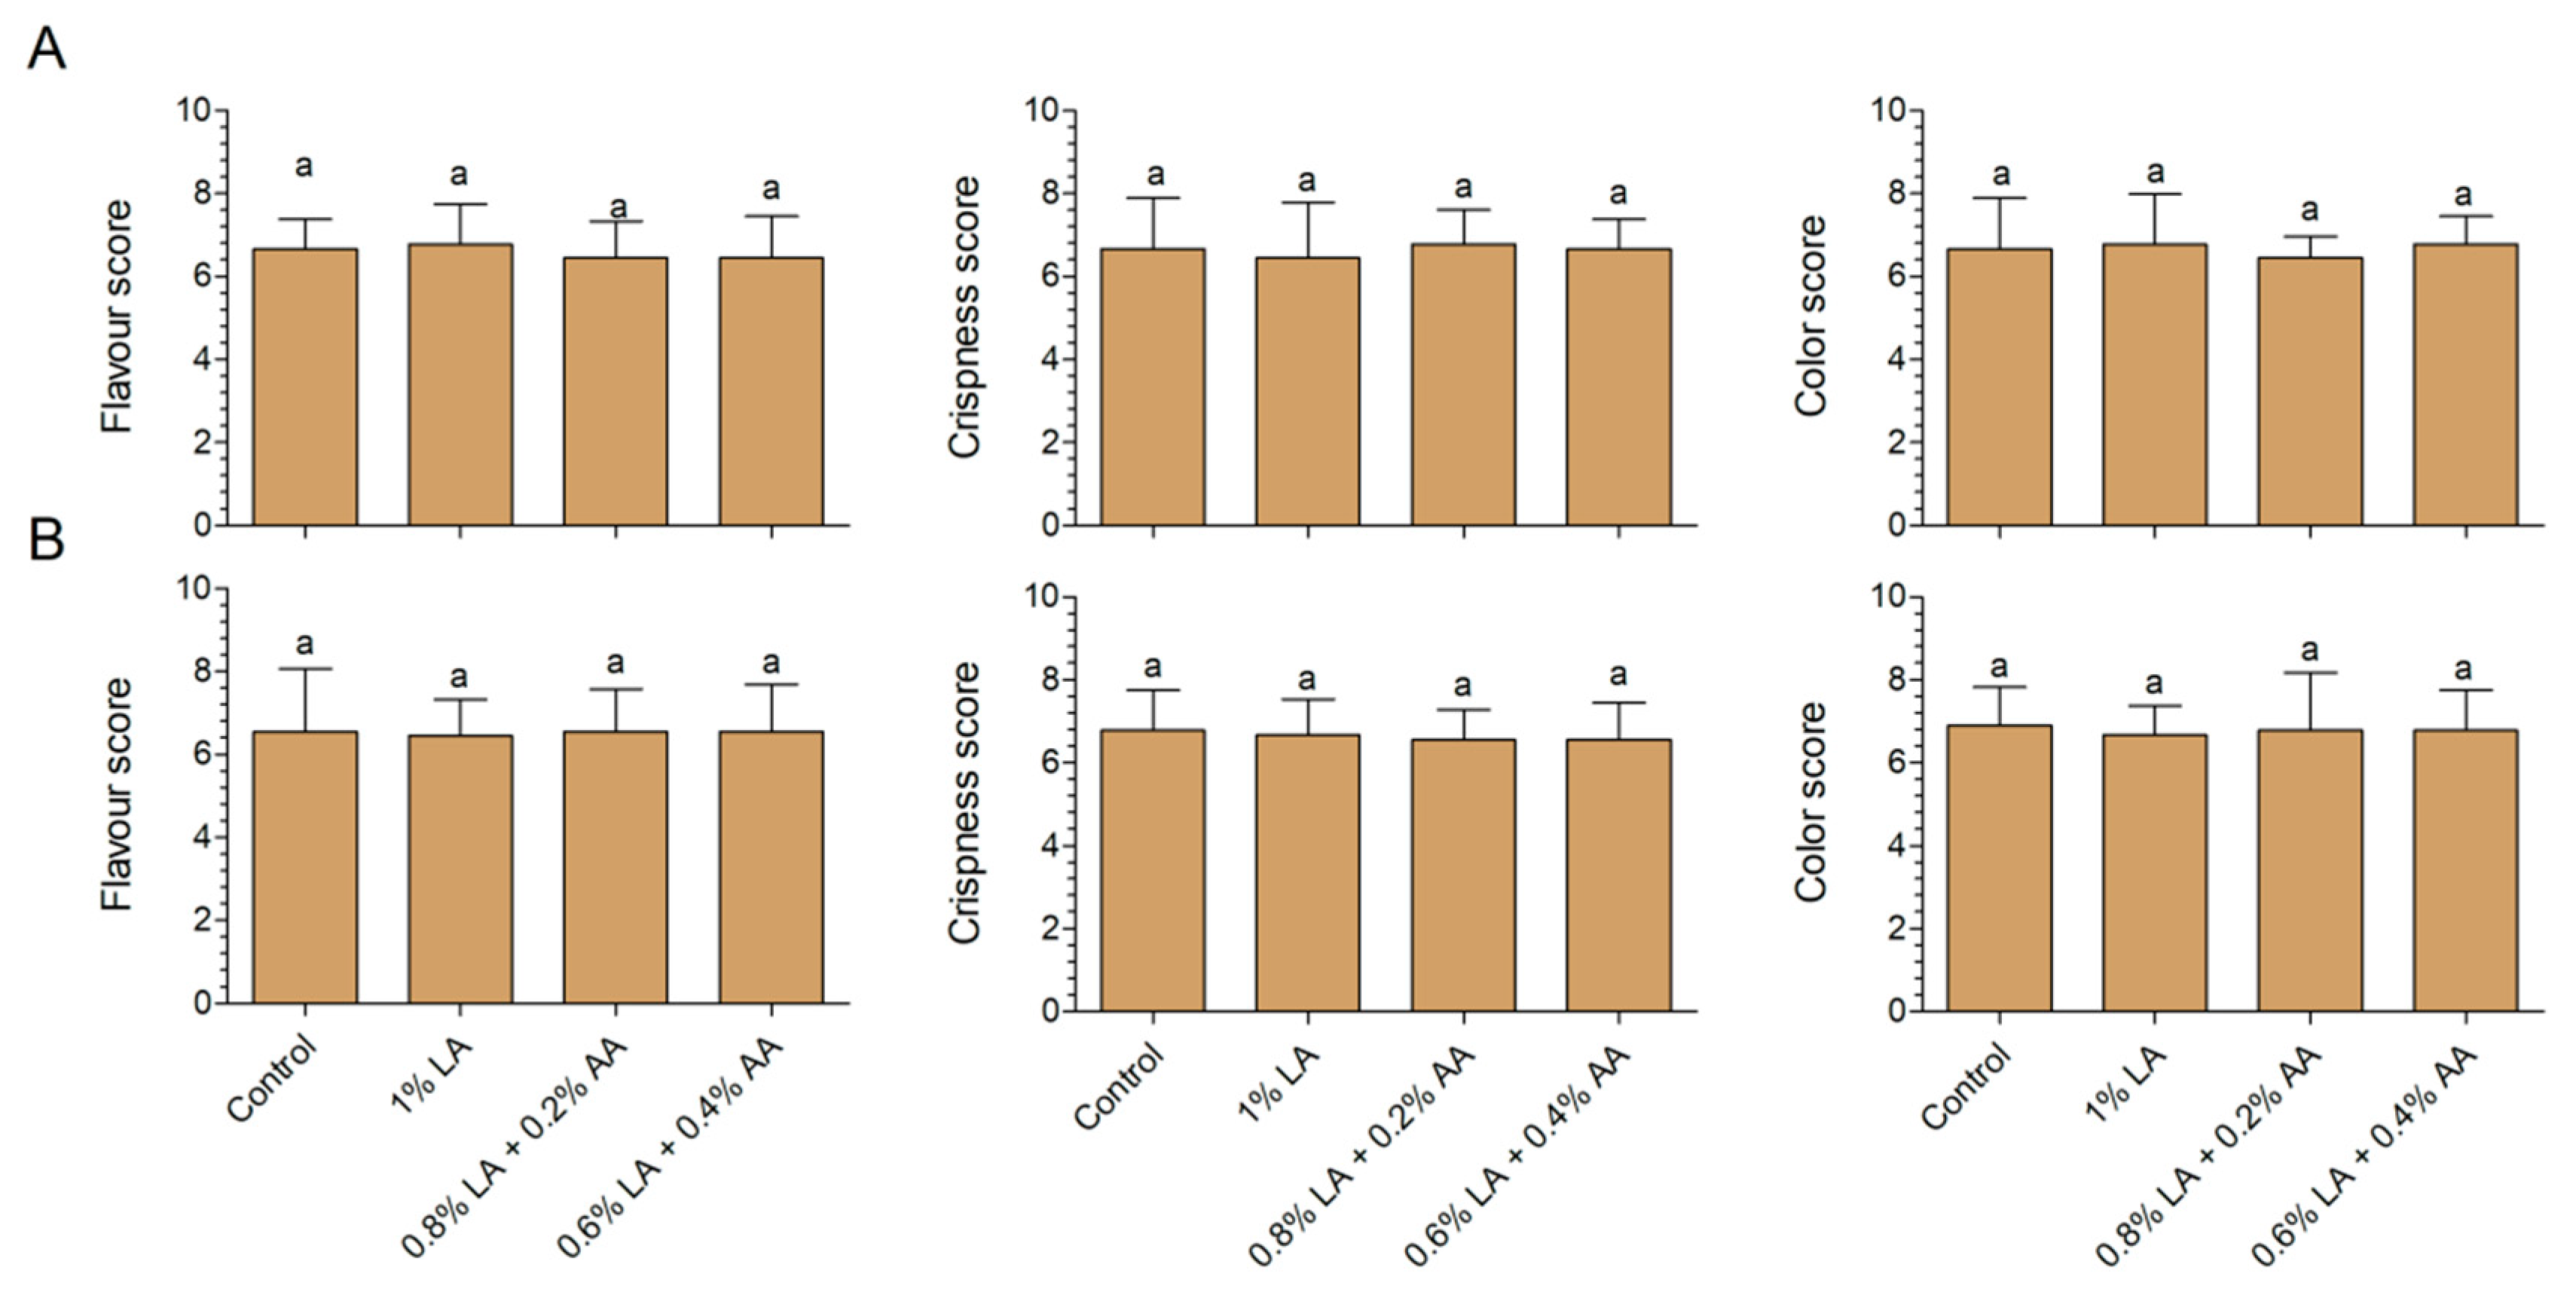
3.3. Effects of Sanitizers on Sensory Characteristics of Fresh-Cut Baby Spinach and Arugula

Decontamination will cause damage to the surface of fresh-cut vegetables [14,31]. If the damage is minor, fresh produce will repair itself [32]. If the damage is serious, it will cause a loss of flavor, browning, and water loss [33]. Damage to fresh-cut vegetables is not observed immediately; instead, it appears gradually during storage. In this study, the color, flavor, and crispness at the end of storage (7 d) were evaluated. The three treatments did not negatively affect the sensory qualities compared with those in the control group (Figure 3A,B). However, according to previous studies, AA concentrations exceeding 1% had negative effects on the quality of fresh-cut vegetables. For example, Wang et al. [34] observed browning blots on 1%AA-treated fresh-cut lettuce after storage for 5 d. Vijayakumar and Wolfhall [35] used 6%AA to disinfect fresh-cut lettuce and observed significant reductions in parameters related to appearance, taste, texture, and overall acceptance compared with lettuce treated with lemon juice, apple vinegar, and bleaching powder. When fresh-cut spinach and lettuce were stored for 7 d, the a * value in the AA treatment group was significantly higher than that of the control group [36].

3.4. Effects of Sanitizers on the Proteome

Compared with gel-based proteomics, mass spectrometry-based proteomic analyses are now widely used owing to their high-throughput capacity, repeatability, and high success rate for protein identification [37]. In the present study, 15,376 peptides (Table S1) corresponding to 2430 proteins (Table S2) were successfully identified. There were 1755 DEPs (794 upregulated and 961 downregulated) in the LA–CK comparison and 1835 DEPs (761 upregulated and 1074 downregulated) in the AM–CK comparison, indicating that over 50% of the identified proteins were differentially expressed after 20 s of treatment. In AM–LA, 155 DEPs (65 upregulated and 90 downregulated) were found, with substantial overlap between the DEPs in the LA–CK and AM–CK comparisons, which may reflect the slight difference in the LA concentrations. Although the LA concentration differs by 0.2% between the groups, it is possible to achieve similar antibacterial effects via different biological processes.

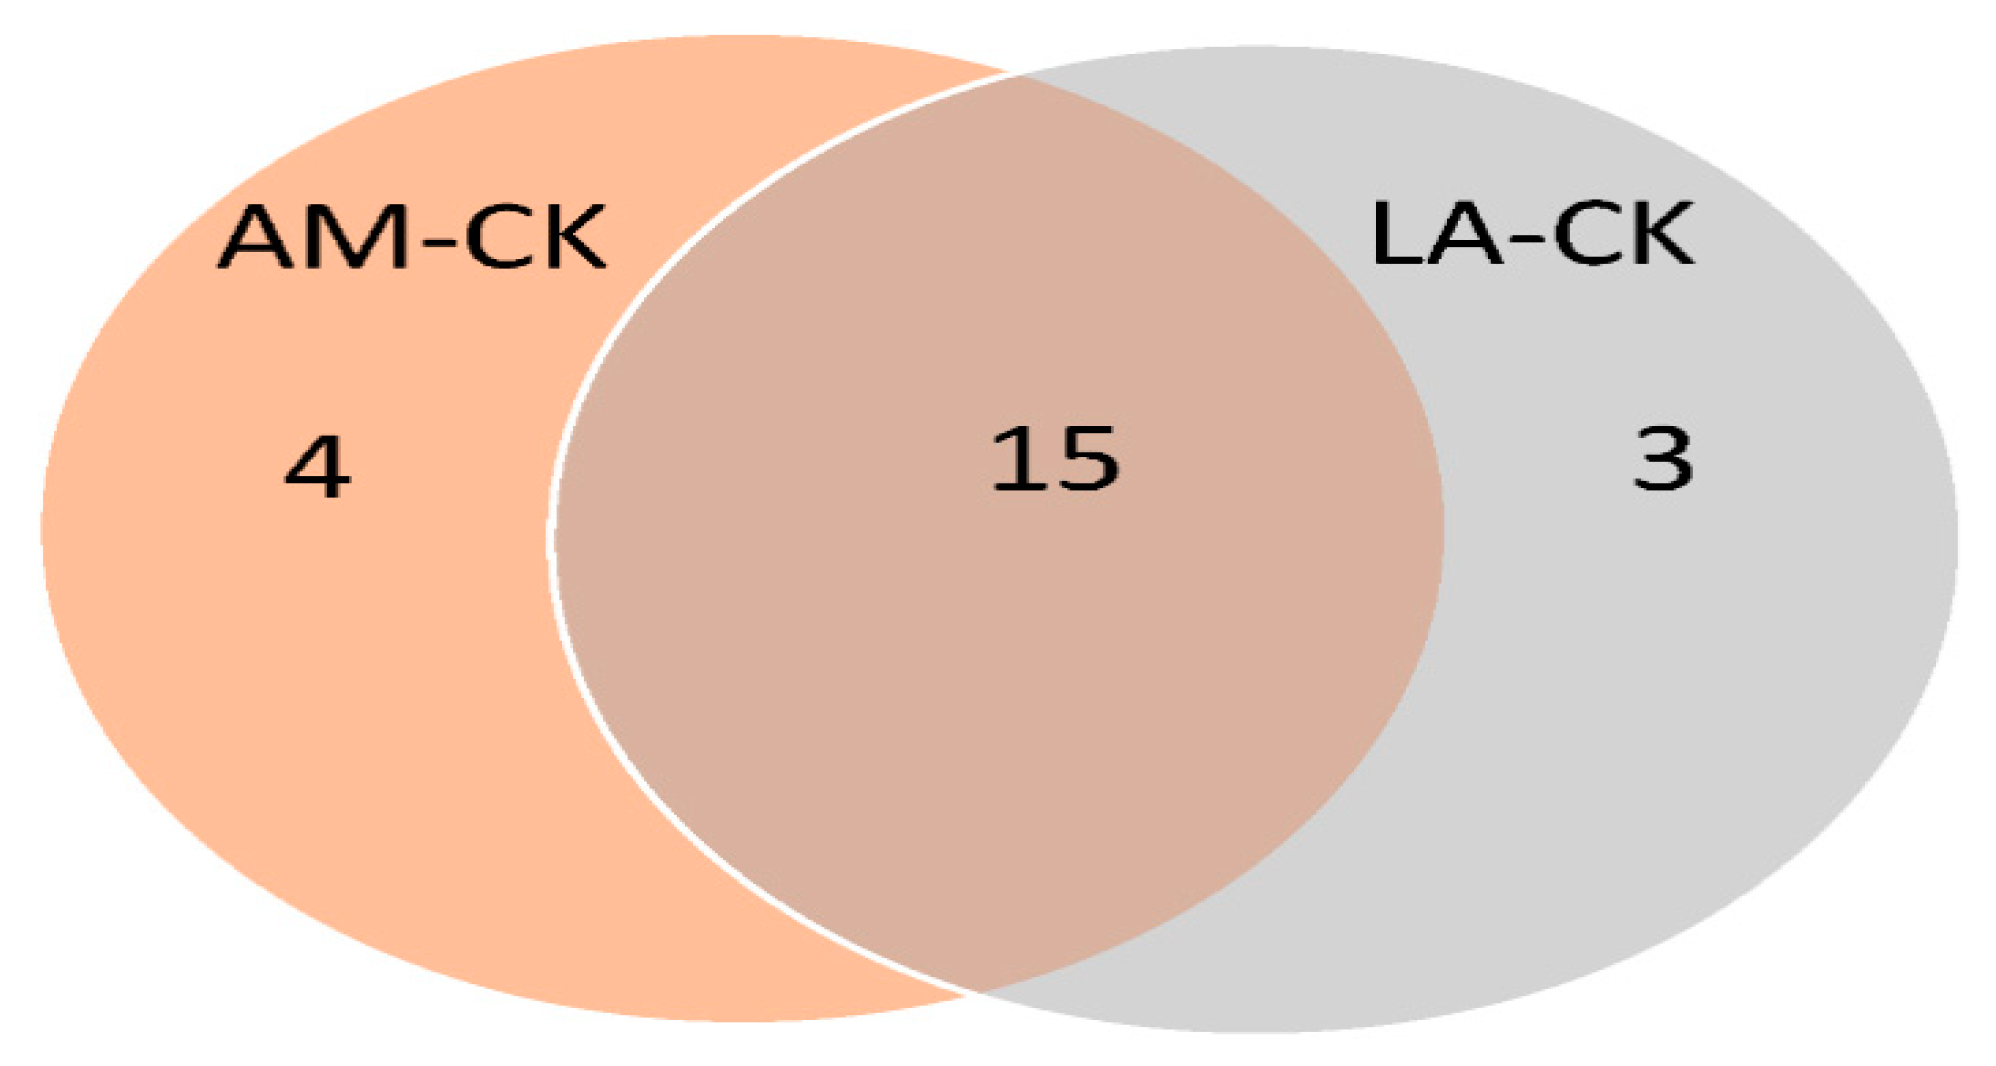
3.5. Venn Diagram Analysis

We evaluated whether the mechanisms underlying the antibacterial effects differ between LA and AM. Therefore, DEPs enrichment for biological processes (BPs), which may be related to the observed antibacterial effects, were evaluated by a GO analysis and a Venn diagram. In total, 15 identical BPs were identified in the two comparisons (Figure 4). This result indicates that, although the difference in the LA concentration between the AM and LA groups is only 0.2%, the BPs affected by the treatment are similar. However, three and four unique BPs, as shown in Figure 4, were identified, indicating that the 0.2% difference in the LA results in changes in the BPs.

3.6. Unique Enriched Biological Processes and Network Clustering of LA–CK

The three unique BPs in LA–CK were macromolecule localization, cellular localization, and protein unfolding, associated with 58, 32, and 5 DEPs, respectively. A protein–protein interaction analysis can be used to identify key functional clusters predicted to induce changes in the whole network [38,39,40], and the results indicate protein export (Figure S1A,B), outer membrane, and gram-negative porins (Figure S1A) were involved in the BPs macromolecule and cellular localization.
Protein export is the active transport of proteins from the cytoplasm to the exterior of the cell or to the periplasmic compartment in gram-negative bacteria. In this process, the Sec-dependent pathway, FtsY, and YidC (Table 1) are responsible for transporting newly synthesized proteins into or across the cell membrane [41,42].
Interestingly, another network cluster (i.e., outer membrane and gram-negative porin proteins; Table 1) shows a different location compared to the protein export proteins (typically located on the inner membrane). We hypothesize that 1%LA exerted greater cell membrane damage as compared with 1%AM. Information on the release of the cell constituents reveals the integrity of the cell membrane [43]. Protein, ATP, and nucleotide leakage from intracellular to extracellular spaces can reflect changes in the membrane integrity [31,43,44]. AKP activity in the extracellular environment can reflect the damage extent of the cell membrane. In this work, the leakage of protein, nucleotide, ATP, and AKP was significantly greater for 1% LA than 1% AM (Figure 5), consistent with our hypothesis.

3.7. Unique Enriched Biological Processes and Network Clustering of AM–CK

The four unique BPs in AM–CK were taxis, response to stress, catabolic process, and the regulation of molecular function, associated with 18, 233, 203, and 35 DEPs, respectively. According to a protein interaction analysis, the phosphotransferase (PTS) system (Figure S2A) and glycerophospholipid metabolism (Figure S2A), flagellar assembly and bacterial chemotaxis (Figure S2B), and homologous recombination and DNA repair (Figure S3) were involved in the BPs catabolic process, taxis, and response to stress, respectively.
PTS (Table 2) is a distinct mechanism used by bacteria for sugar uptake, where the energy source is phosphoenolpyruvate, which are responsible for the E. coli O157:H7 sugar metabolism [45]. Similarly, another study [46] has shown that disodium succinoyl glycyrrhetinate, a derivative of glycyrrhetinic acid, suppresses the sugar metabolism in the cytoplasm at the protein level. The PTS system is multicomponent system that involves enzymes in the plasma membrane and the cytoplasm [47]. Moreover, the PTS system can be activated by acids, antibacterial agents, and salt [48].
Glycerophospholipid metabolism synthesizes the membrane components, and glycerophospholipid drives the formation of the lipid bilayer [49]. In this work, the proteins associated with glycerophospholipid metabolism were located in the cytoplasm and belonged to the major intrinsic protein family (Table 2), which includes transmembrane protein channels, e.g., aquaporins, aquaglyceroporins, and S-aquaporins [50]. According to a previous study, after microorganisms sense a drug, phospholipid synthesis is accelerated for drug transport [51,52], suggesting that the AM applied to the E. coli O157:H7 may induce glycerophospholipid metabolism in the cytoplasm.
Homologous recombination and DNA repair (Table 2) are involved in the response to stress and particularly the SOS response. The LexA repressor negatively regulates the SOS genes. Once the pool of LexA decreases, the repression of the SOS genes decreases [53]. In this work, the LexA repressor was upregulated 2.02-fold, indicating that DNA repair was stimulated and that AM may exert more damage against E. coli O157:H7 DNA as compared with LA.
Regarding the proteins involved in flagellar assembly and bacterial chemotaxis (Table 2), FliG and FliL are flagellar motor switch proteins and interact with FliM to control the direction of the E. coli movement [54]. CheY and CheW are responsible for transmitting the signal obtained from the chemoreceptor to the flagellar rotator in response to an external stimulus [55]. The upregulation of these proteins (Table 2) indicated that AM may exert greater chemical stress than LA. In a previous study [56], oil isolated from fingered citron promoted chemotaxis and flagella assembly in Listeria monocytogenes at the transcriptomic level.

4. Conclusions

The effects of LA and AM on E. coli O157:H7 on fresh-cut produce as well as the mode of action at a proteome level were evaluated. A produce decontamination experiment showed that LA and AM have similar decontamination efficacies against the E. coli O157:H7 on fresh-cut spinach and arugula, consistent with the results of the time-kill curves. In addition, the AM and LA did not negatively affect the sensory characteristics of the fresh-cut produce after storage. Accordingly, AM is a cheaper alternative to LA for the decontamination of fresh-cut produce. At the proteome level, LA and AM affected distinct biological processes. In particular, macromolecule localization, cellular localization, and protein unfolding were uniquely affected by LA, and taxis, response to stress, catabolic process, and the regulation of molecular function were uniquely changed after the treatment with AM. Further network clustering and cellular component analyses showed that membrane damage that may be induced by LA is greater than that induced by AM. Additionally, AM may have a stronger inhibitory effect on the biological processes in the cytoplasm, including DNA repair, bacterial chemotaxis, sucrose metabolism, and glycerophospholipid metabolism. Cell membrane permeability experiments confirmed that LA has a stronger damaging effect on cell membranes than AM. In addition, E. coli O157:H7 is a hazard for fresh meat, and lactic acid is used in various countries to decontaminate fresh meat. Whether the decontamination effect of AM is consistent with that of LA should also be evaluated in future studies. In addition, the relationship between decontamination and ecological changes should be further evaluated, including in-depth 16S rRNA and metatranscriptomic studies.

Supplementary Materials

The following are available online at https://www.mdpi.com/article/10.3390/foods10102406/s1, Figure S1: Protein–protein interaction network for differentially expressed proteins involved in macromolecule localization (A) and cellular localization (B). Yellow points in A indicate the network cluster related to cell outer membrane and gram-negative porin; red points in A and B indicate the network cluster related to protein export, Figure S2: Protein–protein interaction network for differentially expressed proteins involved in catabolic process (A) and taxis (B). Blue points in A indicate the network cluster related to starch and sucrose metabolism, and phosphotransferase system; red points in A indicate the network cluster related to glycerophospholipid metabolism and major intrinsic protein; red points in B indicate the network cluster related to flagellar assembly and bacterial chemotaxis, Figure S3: Protein–protein interaction network for differentially expressed proteins involved in the response to stress. Red points indicate the network cluster related to homologous recombination and DNA repair, Table S1: Peptide information for identified proteins, Table S2: Information on the identified proteins.

Author Contributions

Conceptualization, J.W., Y.L. and Y.Z.; methodology, J.W. and L.Y.; software, J.W.; validation, J.W. and Y.Y.; formal analysis, Y.L. and L.Y.; investigation, J.W.; resources, J.W.; data curation, Y.L. and J.W.; writing—original draft preparation, J.W.; writing—review and editing, J.W., Y.L., L.Y. and Y.Y.; visualization, J.W. and Y.Z.; supervision, J.W.; project administration, J.W. and Y.Y.; funding acquisition, J.W. All authors have read and agreed to the published version of the manuscript.

Funding

This work was financially supported by the Scientific Research Foundation of Hunan Provincial Education Department (No. 20B527).

Institutional Review Board Statement

Not applicable.

Informed Consent Statement

Not applicable.

Data Availability Statement

The data presented in this study are available on request from the corresponding author (J.W.), upon reasonable request.

Conflicts of Interest

The authors declare no conflict of interest.

References

  1. Wang, J.; Yu, Y.; Dong, Y. Disinfection of Ready-to-Eat Lettuce Using Polyhexamethylene Guanidine Hydrochloride. Microorganisms 2020, 8, 272. [Google Scholar] [CrossRef] [PubMed] [Green Version]
  2. Wang, J.; Tao, D.; Wang, S.; Li, C.; Li, Y.; Zheng, F.; Wu, Z. Disinfection of lettuce using organic acids: An ecological analysis using 16S rRNA sequencing. RSC Adv. 2019, 9, 17514–17520. [Google Scholar] [CrossRef] [Green Version]
  3. Wang, J.; Yu, Y.; Dong, Y. Combination of polyhexamethylene guanidine hydrochloride and potassium peroxymonosulfate to disinfect ready-to-eat lettuce. RSC Adv. 2020, 10, 40316–40320. [Google Scholar] [CrossRef]
  4. Callejón, R.M.; Rodríguez-Naranjo, M.I.; Ubeda, C.; Ortega, R.H.; Garcia-Parrilla, M.C.; Troncoso, A.M. Reported Foodborne Outbreaks Due to Fresh Produce in the United States and European Union: Trends and Causes. Foodborne Pathog. Dis. 2015, 12, 32–38. [Google Scholar] [CrossRef]
  5. Reports of Selected Escherichia coli Outbreak Investigations. Available online: https://www.cdc.gov/ecoli/outbreaks.html (accessed on 12 June 2021).
  6. De Corato, U. Improving the shelf-life and quality of fresh and minimally-processed fruits and vegetables for a modern food industry: A comprehensive critical review from the traditional technologies into the most promising advancements. Crit. Rev. Food Sci. Nutr. 2019, 60, 940–975. [Google Scholar] [CrossRef]
  7. Ma, L.; Zhang, M.; Bhandari, B.; Gao, Z. Recent developments in novel shelf life extension technologies of fresh-cut fruits and vegetables. Trends Food Sci. Technol. 2017, 64, 23–38. [Google Scholar] [CrossRef] [Green Version]
  8. Ölmez, H.; Kretzschmar, U. Potential alternative disinfection methods for organic fresh-cut industry for minimizing water consumption and environmental impact. LWT Food Sci. Technol. 2009, 42, 686–693. [Google Scholar] [CrossRef]
  9. Gil, M.I.; Selma, M.V.; López-Gálvez, F.; Allende, A. Fresh-cut product sanitation and wash water disinfection: Problems and solutions. Int. J. Food Microbiol. 2009, 134, 37–45. [Google Scholar] [CrossRef]
  10. Luo, Y.; Zhou, B.; Van Haute, S.; Nou, X.; Zhang, B.; Teng, Z.; Turner, E.R.; Wang, Q.; Millner, P.D. Association between bacterial survival and free chlorine concentration during commercial fresh-cut produce wash operation. Food Microbiol. 2018, 70, 120–128. [Google Scholar] [CrossRef]
  11. Garrido, Y.; Marín, A.; Tudela, J.A.; Allende, A.; Gil, M.I. Chlorate uptake during washing is influenced by product type and cut piece size, as well as washing time and wash water content. Postharvest Biol. Technol. 2019, 151, 45–52. [Google Scholar] [CrossRef]
  12. Van Haute, S.; Tryland, I.; Escudero, C.; Vanneste, M.; Sampers, I. Chlorine dioxide as water disinfectant during fresh-cut iceberg lettuce washing: Disinfectant demand, disinfection efficiency, and chlorite formation. LWT 2017, 75, 301–304. [Google Scholar] [CrossRef]
  13. Van Haute, S.; Tryland, I.; Veys, A.; Sampers, I. Wash water disinfection of a full-scale leafy vegetables washing process with hydrogen peroxide and the use of a commercial metal ion mixture to improve disinfection efficiency. Food Control. 2015, 50, 173–183. [Google Scholar] [CrossRef] [Green Version]
  14. Wang, J.; Zhang, Y.; Yu, Y.; Wu, Z.; Wang, H. Combination of ozone and ultrasonic-assisted aerosolization sanitizer as a sanitizing process to disinfect fresh-cut lettuce. Ultrason. Sonochem. 2021, 76, 105622. [Google Scholar] [CrossRef] [PubMed]
  15. Zhang, J.; Yang, H. Effects of potential organic compatible sanitisers on organic and conventional fresh-cut lettuce (Lactuca sativa Var. Crispa L). Food Control 2017, 72, 20–26. [Google Scholar] [CrossRef]
  16. Velázquez, L.D.C.; Barbini, N.B.; Escudero, M.E.; Estrada, C.S.M.L.; de Guzmán, A.M.S. Evaluation of chlorine, benzalkonium chloride and lactic acid as sanitizers for reducing Escherichia coli O157:H7 and Yersinia enterocolitica on fresh vegetables. Food Control 2009, 20, 262–268. [Google Scholar] [CrossRef]
  17. Ölmez, H.; Temur, S. Effects of different sanitizing treatments on biofilms and attachment of Escherichia coli and Listeria monocytogenes on green leaf lettuce. LWT 2010, 43, 964–970. [Google Scholar] [CrossRef]
  18. Neal, J.A.; Marquez-Gonzalez, M.; Cabrera-Diaz, E.; Lucia, L.M.; O’Bryan, C.A.; Crandall, P.G.; Ricke, S.C.; Castillo, A. Comparison of multiple chemical sanitizers for reducing Salmonella and Escherichia coli O157:H7 on spinach (Spinacia oleracea) leaves. Food Res. Int. 2012, 45, 1123–1128. [Google Scholar] [CrossRef]
  19. Wang, J.; Wang, S.; Sun, Y.; Li, C.; Li, Y.; Zhang, Q.; Wu, Z. Reduction of Escherichia coli O157:H7 and naturally present microbes on fresh-cut lettuce using lactic acid and aqueous ozone. RSC Adv. 2019, 9, 22636–22643. [Google Scholar] [CrossRef] [Green Version]
  20. Ricke, S. Perspectives on the use of organic acids and short chain fatty acids as antimicrobials. Poult. Sci. 2003, 82, 632–639. [Google Scholar] [CrossRef]
  21. Hui, W.; Colin, O.; Yang, X. Development of a real-time PCR procedure for quantification of viable Escherichia coli in popu-lations of E. coli exposed to lactic acid, and the acid tolerance of verotoxigenic E. coli (VTEC) from cattle hides. Food Control 2014, 43, 104–109. [Google Scholar]
  22. Nakamura, K.; Tanaka, T.; Kuwahara, A.; Takeo, K. Microassay for proteins on nitrocellulose filter using protein dye-staining procedure. Anal. Biochem. 1985, 148, 311–319. [Google Scholar] [CrossRef]
  23. Wang, Y.; Qin, Y.; Zhang, Y.; Wu, R.; Li, P. Antibacterial mechanism of plantaricin LPL-1, a novel class IIa bacteriocin against Listeria monocytogenes. Food Control 2019, 97, 87–93. [Google Scholar] [CrossRef]
  24. Wiśniewski, J.R.; Zougman, A.; Nagaraj, N.; Mann, M. Universal sample preparation method for proteome analysis. Nat. Methods 2009, 6, 359–362. [Google Scholar] [CrossRef] [PubMed]
  25. Wang, J.; Cheng, Y.; Wu, R.; Jiang, D.; Bai, B.; Tan, D.; Yan, T.; Sun, X.; Zhang, Q.; Wu, Z. Antibacterial Activity of Juglone against Staphylococcus aureus: From Apparent to Proteomic. Int. J. Mol. Sci. 2016, 17, 965. [Google Scholar] [CrossRef] [PubMed] [Green Version]
  26. Conesa, A.; Gotz, S.; Garciagomez, J.M.; Terol, J.; Talon, M.; Robles, M.J.B. Blast2GO: A universal tool for annotation, visual-ization and analysis in functional genomics research. Bioinformatics 2005, 21, 3674–3676. [Google Scholar] [CrossRef] [Green Version]
  27. Von Mering, C.; Jensen, L.J.; Snel, B.; Hooper, S.D.; Krupp, M.; Foglierini, M.; Jouffre, N.; Huynen, M.A.; Bork, P. STRING: Known and predicted protein-protein associations, integrated and transferred across organisms. Nucleic Acids Res. 2005, 33, D433–D437. [Google Scholar] [CrossRef]
  28. Ritter, A.C.; Santi, L.; Vannini, L.; Beys-Da-Silva, W.; Gozzi, G.; Yates, J.; Ragni, L.; Brandelli, A. Comparative proteomic analysis of foodborne Salmonella Enteritidis SE86 subjected to cold plasma treatment. Food Microbiol. 2018, 76, 310–318. [Google Scholar] [CrossRef]
  29. Ahmed, S.; Zaman, S.; Ahmed, R.; Uddin, N.; Acedo, A.; Bari, L. Effectiveness of non-chlorine sanitizers in improving the safety and quality of fresh betel leaf. LWT 2017, 78, 77–81. [Google Scholar] [CrossRef]
  30. Finten, G.; Agüero, M.V.; Jagus, R.J. Citric acid as alternative to sodium hypochlorite for washing and disinfection of experimentally-infected spinach leaves. LWT Food Sci. Technol. 2017, 82, 318–325. [Google Scholar] [CrossRef]
  31. Chen, L.; Zhang, H.; Liu, Q.; Pang, X.; Zhao, X.; Yang, H. Sanitising efficacy of lactic acid combined with low-concentration sodium hypochlorite on Listeria innocua in organic broccoli sprouts. Int. J. Food Microbiol. 2019, 295, 41–48. [Google Scholar] [CrossRef]
  32. Fan, X.; Sokorai, K.J.; Niemira, B.A.; Mills, R.S.; Zhen, M.Y. Quality of Gamma Ray-irradiated Iceberg Lettuce and Treatments to Minimize Irradiation-induced Disorders. HortScience 2012, 47, 1108–1112. [Google Scholar] [CrossRef] [Green Version]
  33. Salgado, S.P.; Pearlstein, A.J.; Luo, Y.; Feng, H. Quality of Iceberg (Lactuca sativa L.) and Romaine (L. sativa L. var. longifolial) lettuce treated by combinations of sanitizer, surfactant, and ultrasound. LWT 2014, 56, 261–268. [Google Scholar] [CrossRef]
  34. Wang, J.; Sun, Y.; Tao, D.; Li, C.; Zheng, F.; Wu, Z. Reduction of Escherichia coli O157:H7, Listeria monocytogenes, and Naturally Present Microbe Counts on Lettuce using an Acid Mixture of Acetic and Lactic Acid. Microorganisms 2019, 7, 373. [Google Scholar] [CrossRef] [PubMed] [Green Version]
  35. Vijayakumar, C.; Wolf-Hall, C.E. Evaluation of Household Sanitizers for Reducing Levels of Escherichia coli on Iceberg Lettuce. J. Food Prot. 2002, 65, 1646–1650. [Google Scholar] [CrossRef] [PubMed]
  36. Poimenidou, S.V.; Bikouli, V.C.; Gardeli, C.; Mitsi, C.; Tarantilis, P.A.; Nychas, G.J.; Skandamis, P.N. Effect of single or com-bined chemical and natural antimicrobial interventions on Escherichia coli O157:H7, total microbiota and color of packaged spinach and lettuce. Int. J. Food Microbiol. 2016, 220, 6–18. [Google Scholar] [CrossRef]
  37. Wang, J.; Liu, D.; Sun, X.; Bai, B.; Jiang, D.; Wu, Z. Label-free quantitative proteomic analysis of the inhibitory activities of juglone against translation and energy metabolism in Escherichia coli. Phytochem. Lett. 2016, 18, 55–58. [Google Scholar] [CrossRef]
  38. Yang, X.Y.; Zhang, L.; Liu, J.; Li, N.; Yu, G.; Cao, K.; Han, J.; Zeng, G.; Pan, Y.; Sun, X.; et al. Proteomic analysis on the anti-bacterial activity of a Ru(II) complex against Streptococcus pneumoniae. J. Proteomics 2015, 115, 107–116. [Google Scholar] [CrossRef]
  39. Yang, X.-Y.; Xu, J.-Y.; Meng, M.; Li, N.; Liu, C.-Y.; He, Q.-Y. Dirhodium (II) complex interferes with iron-transport system to exert antibacterial action against Streptococcus pneumoniae. J. Proteom. 2018, 194, 160–167. [Google Scholar] [CrossRef]
  40. Solis, N.; Parker, B.L.; Kwong, S.M.; Robinson, G.; Firth, N.; Cordwell, S.J. Staphylococcus aureus Surface Proteins Involved in Adaptation to Oxacillin Identified Using a Novel Cell Shaving Approach. J. Proteome Res. 2014, 13, 2954–2972. [Google Scholar] [CrossRef]
  41. Natale, P.; Brüser, T.; Driessen, A.J.M. Sec- and Tat-mediated protein secretion across the bacterial cytoplasmic membrane—Distinct translocases and mechanisms. Biochim. Biophys. Acta 2008, 1778, 1735–1756. [Google Scholar] [CrossRef] [Green Version]
  42. Luirink, J.; Hagen-Jongman, C.T.; van der Weijden, C.; Oudega, B.; High, S.; Dobberstein, B.; Kusters, R. An alternative protein targeting pathway in Escherichia coli: Studies on the role of FtsY. EMBO J. 1994, 13, 2289–2296. [Google Scholar] [CrossRef] [Green Version]
  43. Diao, M.; Qi, D.; Xu, M.; Lu, Z.; Lv, F.; Bie, X.; Zhang, C.; Zhao, H. Antibacterial activity and mechanism of monolauroyl-galactosylglycerol against Bacillus cereus. Food Control 2018, 85, 339–344. [Google Scholar] [CrossRef]
  44. Kang, S.; Kong, F.; Shi, X.; Han, H.; Li, M.; Guan, B.; Yang, M.; Cao, X.; Tao, D.; Zheng, Y.; et al. Antibacterial activity and mechanism of lactobionic acid against Pseudomonas fluorescens and methicillin-resistant Staphylococcus aureus and its application on whole milk. Food Control 2020, 108, 106876. [Google Scholar] [CrossRef]
  45. Jeckelmann, J.-M.; Harder, D.; Mari, S.A.; Meury, M.; Ucurum, Z.; Muller, D.J.; Erni, B.; Fotiadis, D. Structure and function of the glucose PTS transporter from Escherichia coli. J. Struct. Biol. 2011, 176, 395–403. [Google Scholar] [CrossRef]
  46. Yamashita, T.; Kawada-Matsuo, M.; Katsumata, T.; Watanabe, A.; Oogai, Y.; Nishitani, Y.; Miyawaki, S.; Komatsuzawa, H. Antibacterial activity of disodium succinoyl glycyrrhetinate, a derivative of glycyrrhetinic acid againstStreptococcus mutans. Microbiol. Immunol. 2019, 63, 251–260. [Google Scholar] [CrossRef]
  47. Tchieu, J.H.; Norris, V.; Edwards, J.S.; Saier, M.H. The complete phosphotransferase system in Escherichia coli. J. Mol. Microbiol. Biotechnol. 2001, 3, 329–346. [Google Scholar]
  48. Liu, Y.; Ceruso, M.; Jiang, Y.; Datta, A.R.; Carter, L.; Strain, E.; Pepe, T.; Anastasi, A.; Fratamico, P. Construction ofListeria monocytogenesMutants with In-Frame Deletions in the Phosphotransferase Transport System (PTS) and Analysis of Their Growth under Stress Conditions. J. Food Sci. 2013, 78, M1392–M1398. [Google Scholar] [CrossRef]
  49. Chakrabarti, A.; Membrez, M.; Morin-Rivron, D.; Siddharth, J.; Chou, C.J.; Henry, H.; Bruce, S.; Metairon, S.; Raymond, F.; Betrisey, B.; et al. Transcriptomics-driven lipidomics (TDL) identifies the microbiome-regulated targets of ileal lipid metabolism. Npj Syst. Biol. Appl. 2017, 3, 33. [Google Scholar] [CrossRef] [PubMed]
  50. Benga, G. On the definition, nomenclature and classification of water channel proteins (aquaporins and relatives). Mol. Asp. Med. 2012, 33, 514–517. [Google Scholar] [CrossRef] [PubMed]
  51. Xie, J.; Zhang, A.-H.; Sun, H.; Yan, G.-L.; Wang, X.-J. Recent advances and effective strategies in the discovery and applications of natural products. RSC Adv. 2018, 8, 812–824. [Google Scholar] [CrossRef] [Green Version]
  52. Zhou, P.; Chen, Y.; Lu, Q.; Qin, H.; Ou, H.; He, B.; Ye, J. Cellular metabolism network of Bacillus thuringiensis related to erythromycin stress and degradation. Ecotoxicol. Environ. Saf. 2018, 160, 328–341. [Google Scholar] [CrossRef]
  53. Sassanfar, M.; Roberts, J.W. Nature of the SOS-inducing signal in Escherichia coli: The involvement of DNA replication. J. Mol. Biol. 1990, 212, 79–96. [Google Scholar] [CrossRef]
  54. Kim, E.A.; Panushka, J.; Meyer, T.; Carlisle, R.; Baker, S.; Ide, N.; Lynch, M.; Crane, B.R.; Blair, D.F. Architecture of the Flagellar Switch Complex of Escherichia coli: Conformational Plasticity of FliG and Implications for Adaptive Remodeling. J. Mol. Biol. 2017, 429, 1305–1320. [Google Scholar] [CrossRef] [PubMed]
  55. Ford, K.M.; Antani, J.; Nagarajan, A.; Johnson, M.M.; Lele, P.P. Switching and Torque Generation in Swarming E. coli. Front. Microbiol. 2018, 9, 2197. [Google Scholar] [CrossRef] [PubMed] [Green Version]
  56. Guo, J.; Hu, X.; Gao, Z.; Li, G.; Fu, F.; Shang, X.; Liang, Z.; Shan, Y. Global transcriptomic response of Listeria monocytogenes exposed to Fingered Citron (Citrus medica L. var. sarcodactylis Swingle) essential oil. Food Res. Int. 2021, 143, 110274. [Google Scholar] [CrossRef] [PubMed]
Figure 1. Time-kill curves for different combinations of sanitizers against Escherichia coli O157:H7. AA, acetic acid; LA, lactic acid.
Foods 10 02406 g001
Figure 2. Decontamination effects of different combinations against Escherichia coli O157:H7 on fresh-cut spinach (A) and arugula (B). Panels a and b show results for low and high inoculation levels, respectively. Black, gray, white, and brown bars indicate the results for the control, 1% LA, 0.8% LA plus 0.2% AA, and 0.6% LA plus 0.4% AA, respectively. Note: within the same day, mean values with different lowercase letters are significantly different from each other (p < 0.05); within the same treatment, mean values with different capital letters are significantly different from each other (p < 0.05).
Foods 10 02406 g002
Figure 3. Effects of different combinations of sanitizers on the flavor, crispness, and color of fresh-cut baby spinach (A) and arugula (B). Different letters above the columns indicate significant differences (p < 0.05). AA, acetic acid; LA, lactic acid.
Foods 10 02406 g003
Figure 4. Distribution of biological processes (GO level 3) associated with differentially expressed proteins after treatment with AM and LA. LA: lactic acid; AM: acid mixture, 0.8% LA + 0.2% AA; CK: control.
Foods 10 02406 g004
Figure 5. Effects of an acid mixture and lactic acid on protein content (A), nucleotide content (B), ATP content (C), and AKP activity (D) in Escherichia coli O157:H7. Different letters above the columns indicate significant differences (p < 0.05). AA, acetic acid; LA, lactic acid.
Foods 10 02406 g005
Table 1. Related differentially expressed proteins in network clusters of LA–CK.
UniProt Accession NumberGene IDProtein NameFold Change
Protein export
P0AG88secBProtein-export protein SecB2.35
P0AGA1secGProtein-export membrane protein SecG2.06
P0AGA4secYProtein translocase subunit SecY0.53
P0AG91secDProtein translocase subunit SecD0.65
P0AG95secFProtein translocase subunit SecF1.24
P65625yidCMembrane protein insertase YidC0.43
P0AGD9ffhSignal recognition particle protein0.38
Outer membrane and gram-negative porins
P61318lolAOuter-membrane lipoprotein carrier protein0.82
P0ADC5lolCLipoprotein-releasing system transmembrane protein LolC0.37
P0ABV8tolRTol-Pal system protein TolR2.07
P0ABV0tolQTol-Pal system protein TolQ0.46
Q8X8E2lolELipoprotein-releasing system transmembrane protein0.45
P0AC04bamDOuter membrane protein assembly factor BamD2.45
P0AEU9skpChaperone protein Skp2.25
P0A9V3lptBLipopolysaccharide export system ATP-binding protein LptB1.42
LA: lactic acid; CK: control.
Table 2. Related differentially expressed proteins in network clusters of AM–CK.
UniProt Accession NumberGene IDProtein NameFold Change
Starch and sucrose metabolism, and phosphotransferase system
Q8XDG9mtlDMannitol-1-phosphate 5-dehydrogenase1.27
Q8X677manAMannose-6-phosphate isomerase0.27
Q8XE22pfkBPhosphofructokinase0.59
A0A0H3JCR2pgmPhosphoglucomutase0.35
P0AB72fbaAFructose-bisphosphate aldolase class 20.57
P62709gpmA2,3-bisphosphoglycerate-dependent phosphoglycerate mutase2.34
P0A6V9glkGlucokinase0.60
Q8XCE1treCTrehalose-6-P hydrolase0.38
Q8X710malQ4-alpha-glucanotransferase0.37
Q8X6Y1glgPAlpha-1,4 glucan phosphorylase0.41
Q8X6X8glgXGlycogen debranching enzyme0.34
Glycerophospholipid metabolism and major intrinsic proteins
P0A997glpCAnaerobic glycerol-3-phosphate dehydrogenase subunit C0.59
P0A6F4glpKGlycerol kinase0.55
P0A9C1glpAAnaerobic glycerol-3-phosphate dehydrogenase subunit A0.69
A0A0H3JI74glpDGlycerol-3-phosphate dehydrogenase0.60
P0A6S9gpsAGlycerol-3-phosphate dehydrogenase [NAD(P)+]0.38
Flagellar assembly and bacterial chemotaxis
P0A966cheWChemotaxis protein CheW2.83
P0AE68cheYChemotaxis protein CheY2.80
Q8XCF9cheBProtein-glutamate methylesterase/protein-glutamine glutaminase0.60
P0ABZ3fliGFlagellar motor switch protein FliG1.67
P0ABY0fliLFlagellar protein FliL2.00
Homologous recombination and DNA repair
Q8X8H1polADNA polymerase I0.78
P0A7G8recAProtein RecA1.41
P0A7H2recFDNA replication and repair protein RecF0.67
Q8XDN4mutLDNA mismatch repair protein MutL0.40
Q8X8P5uvrDDNA helicase0.58
P0A811ruvAHolliday junction ATP-dependent DNA helicase RuvA0.69
Q8X5H9ftsKDNA translocase FtsK0.21
P0A7C4lexALexA repressor2.07
AM: acid mixture; CK: control.
Publisher’s Note: MDPI stays neutral with regard to jurisdictional claims in published maps and institutional affiliations.

