Female Facial Attractiveness Assessed from Three-Dimensional Contour Lines by University Students


Abstract
1. Introduction
2. Materials and Methods
2.1. Procurement of Two-Dimensional Photos and Three-Dimensional Images
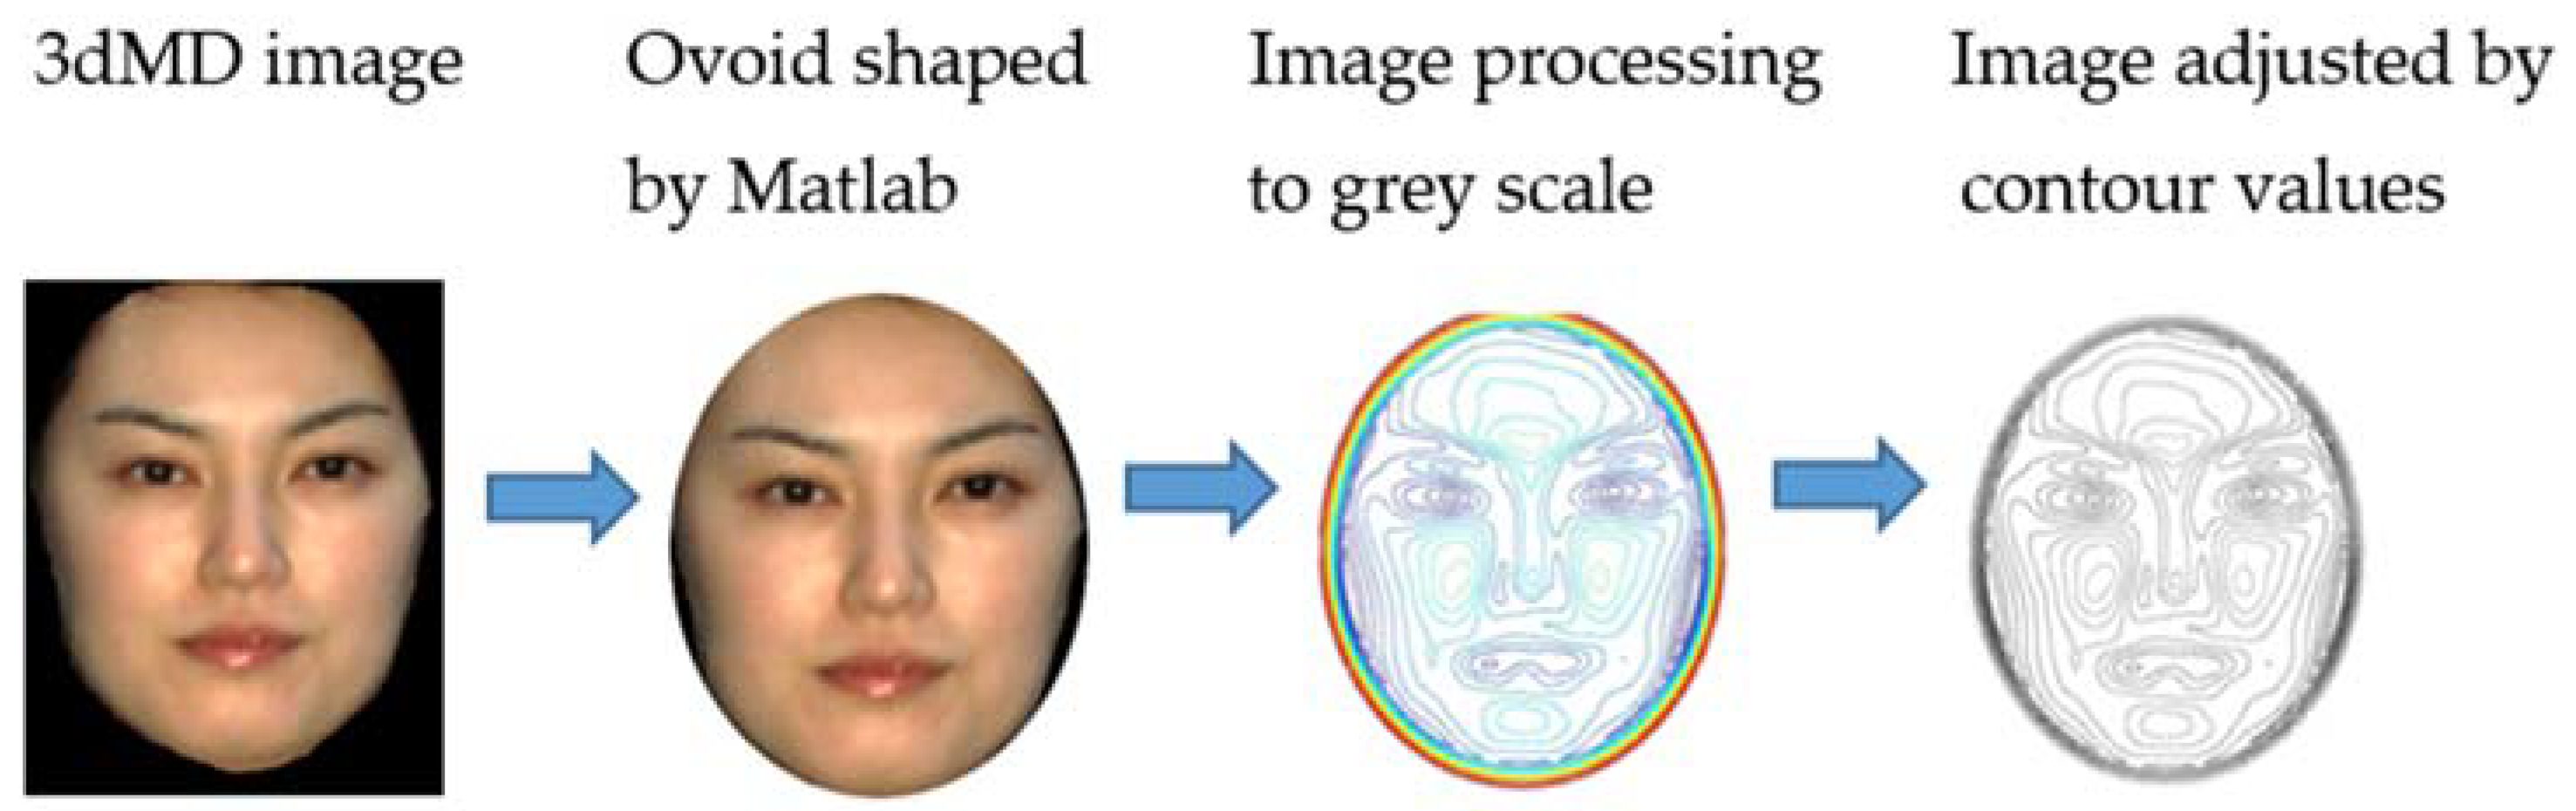
2.2. Extraction of 3D Contour Lines
2.3. Duplication and Selection of the Two-Dimensional Photos and Three-Dimensional Images
2.4. Evaluators
2.5. Facial Attractiveness Evaluation
3. Statistical Analysis
3.1. Outliers
3.2. Consistency and Reliability
3.3. Agreement of Facial Attractiveness Perceptions
3.4. Influence of Gender on the Evaluation of Facial Attractiveness and 3D Contour Lines
3.5. Facial Attractiveness and 3D Contour Lines
4. Results
4.1. Evaluators and Facial Attractiveness Scores
4.2. Consistency and Reliability
4.3. Agreement in the Perception of Facial Attractiveness
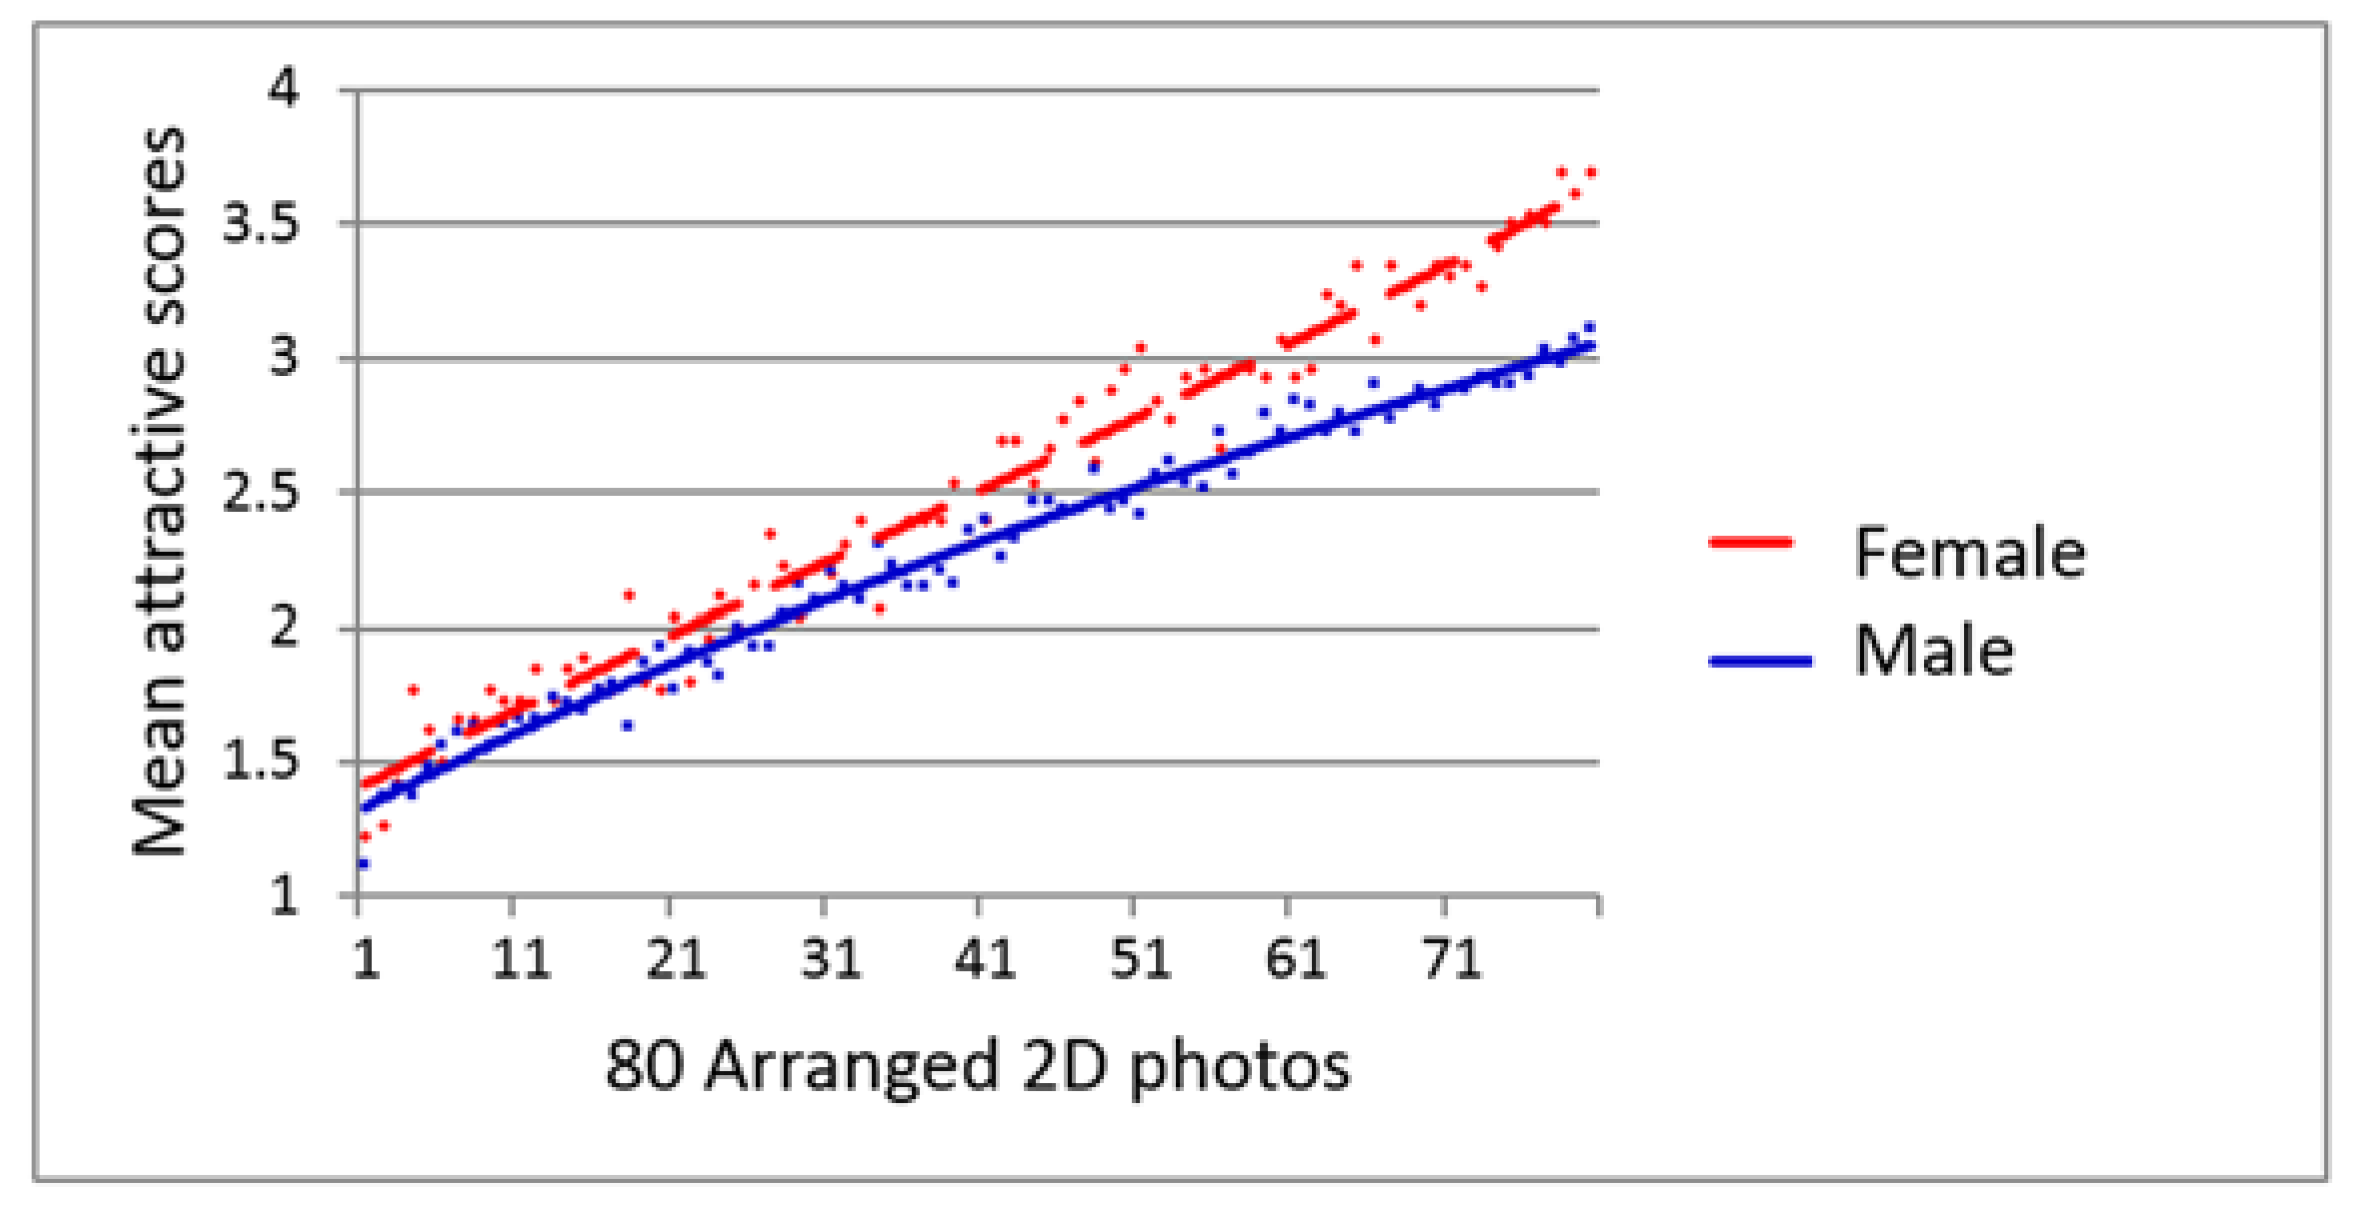
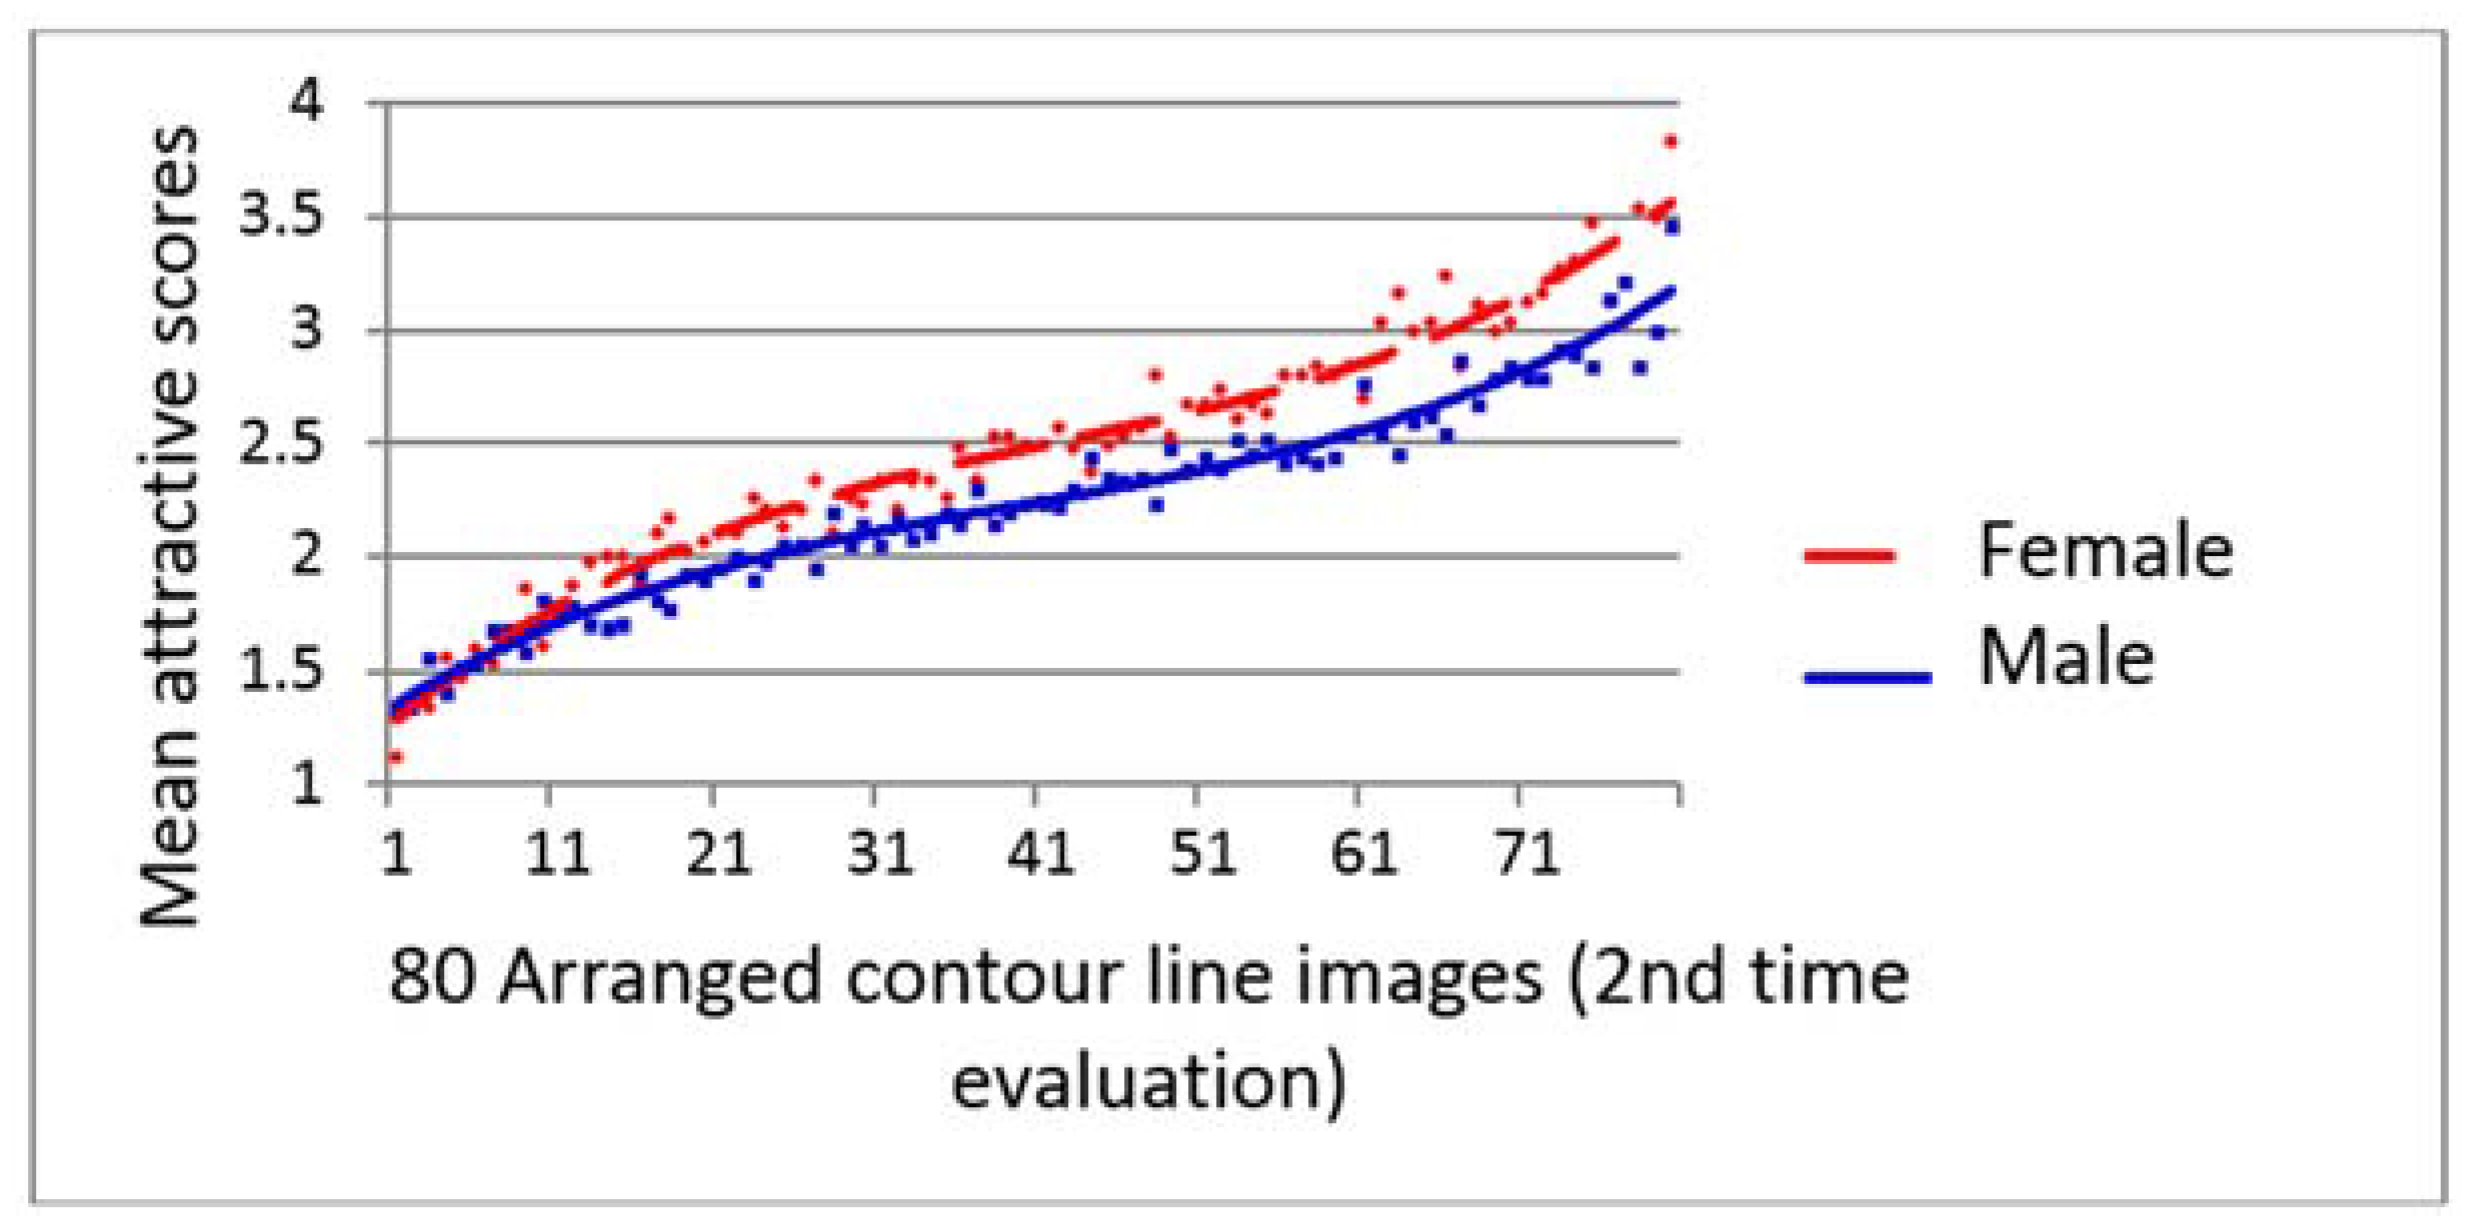
4.4. Influence of Gender on the Evaluation of Facial Attractiveness and 3D Contour Lines
5. Discussion
5.1. Viewing Protocol
5.2. Consistency and Reliabilities
5.3. Agreement in the Perception of Facial Attractiveness
5.4. Influence of Gender on the Evaluations of Facial Attractiveness and 3D Contour Line Images
5.5. Further Study
6. Conclusions
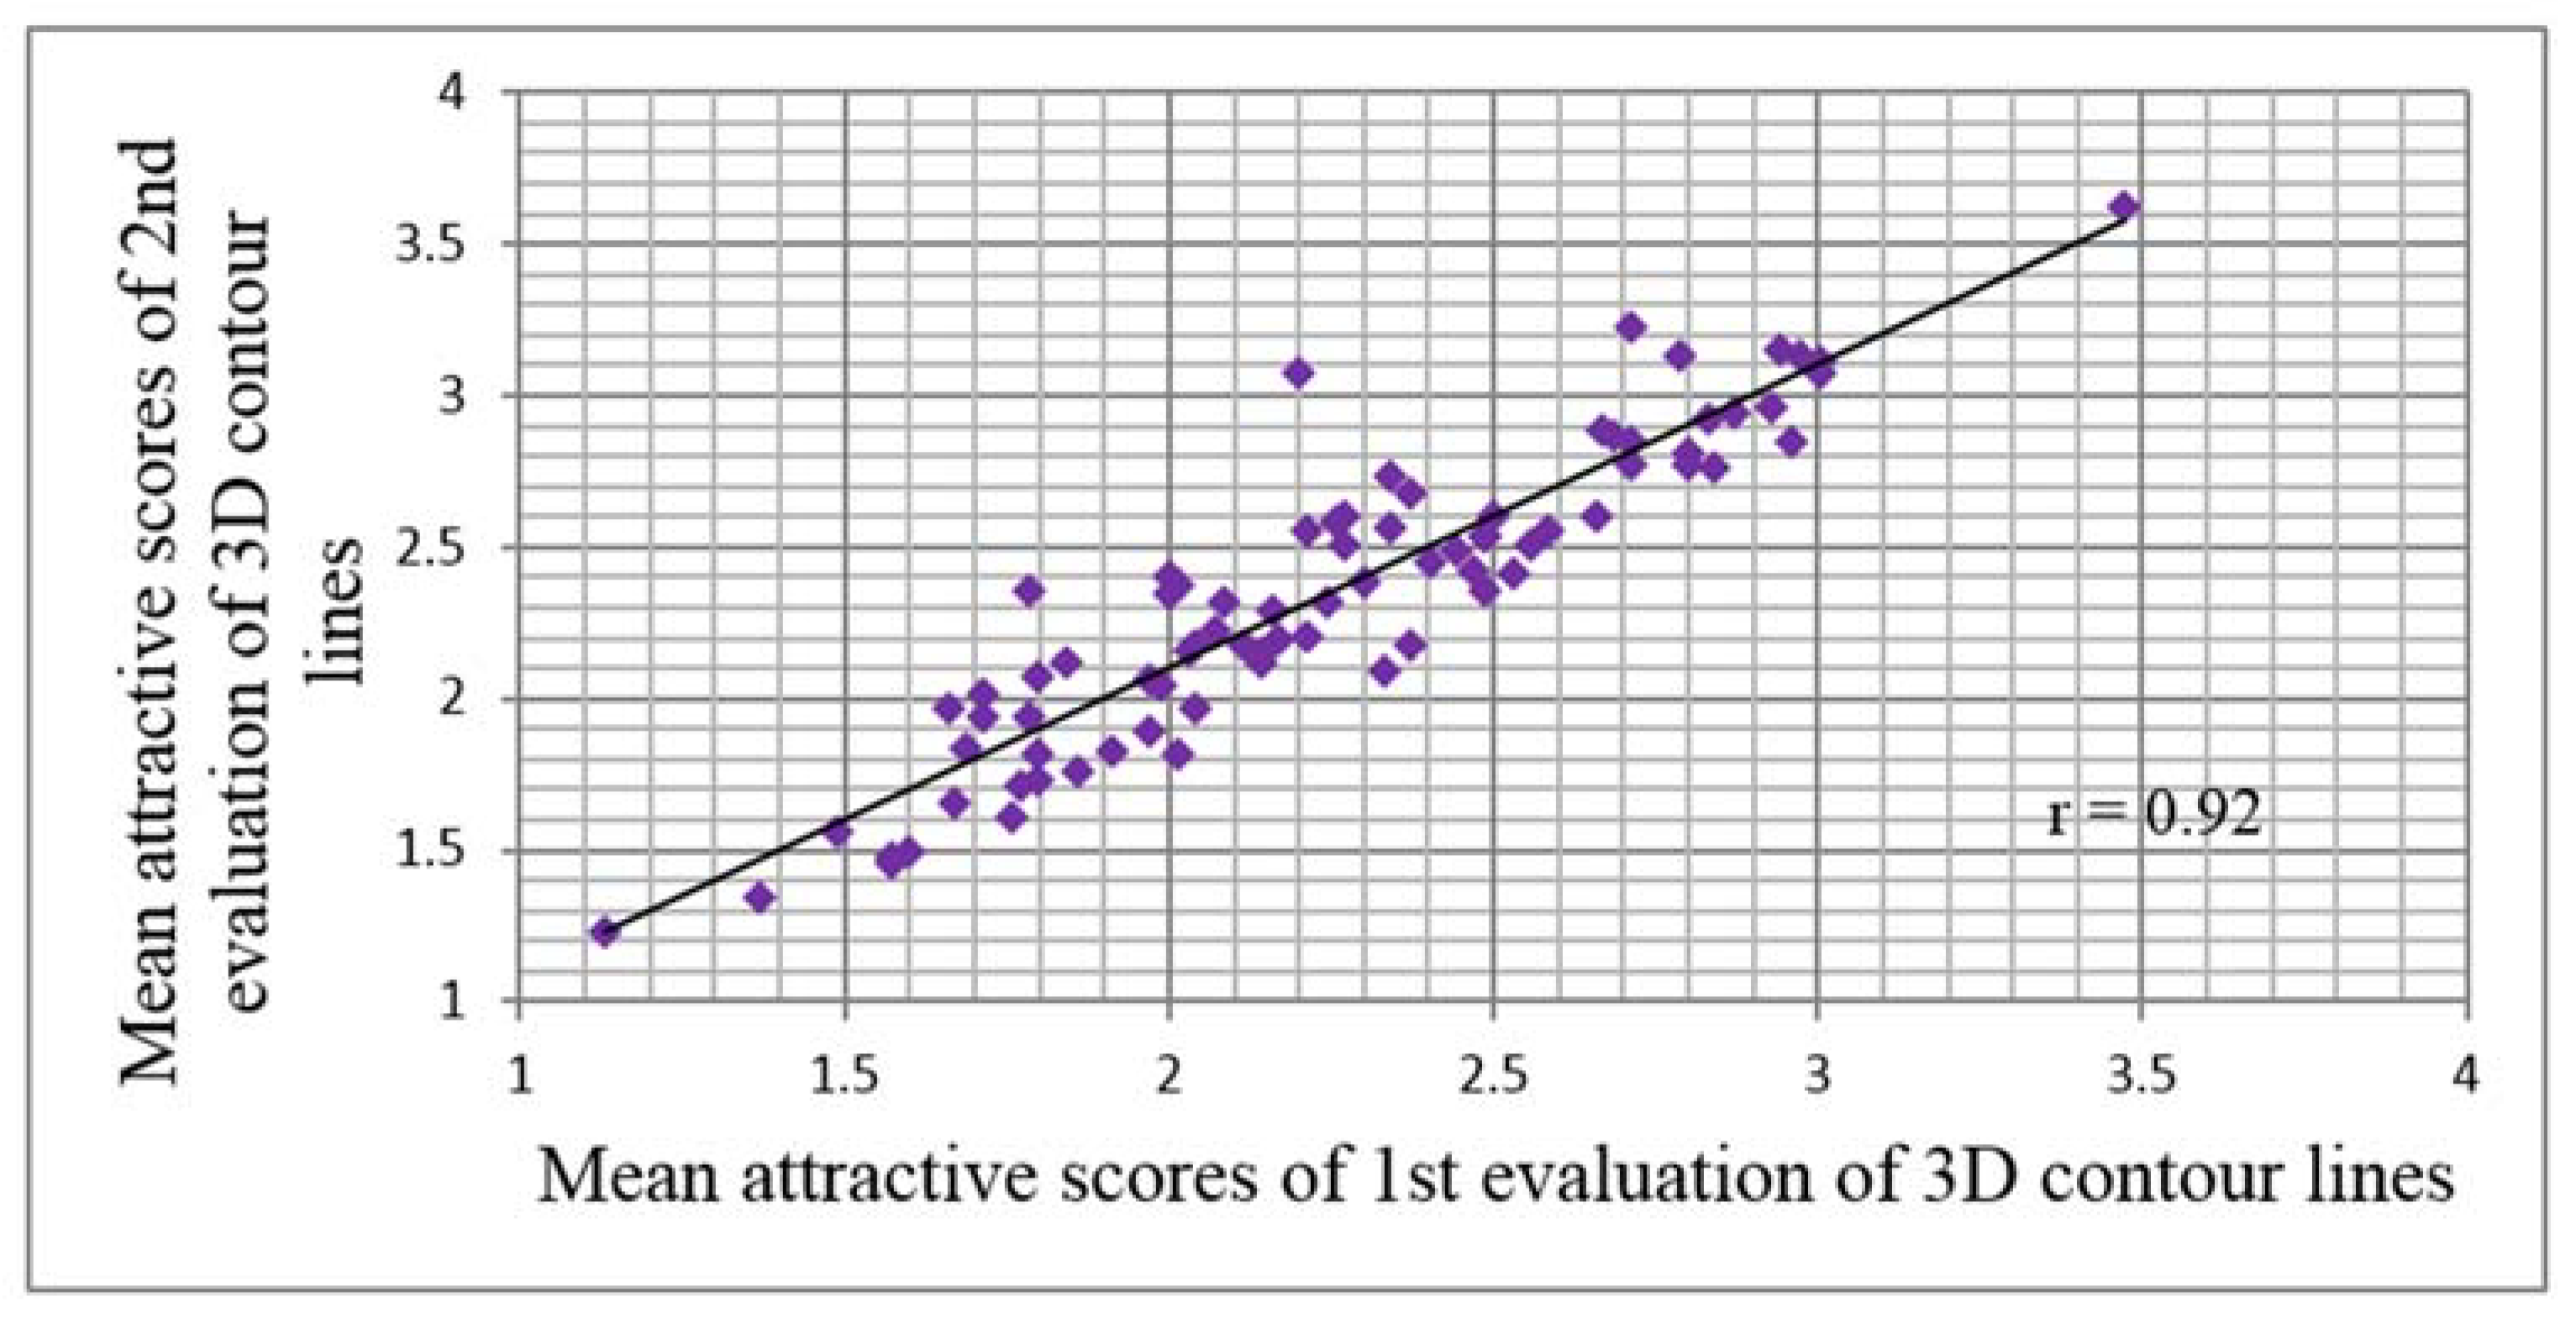
- High consistency (r = 0.92) was found for the first and second evaluation of 3D facial contour lines for female facial attractiveness.
- The perception of the female 3D contour lines was reproducible.
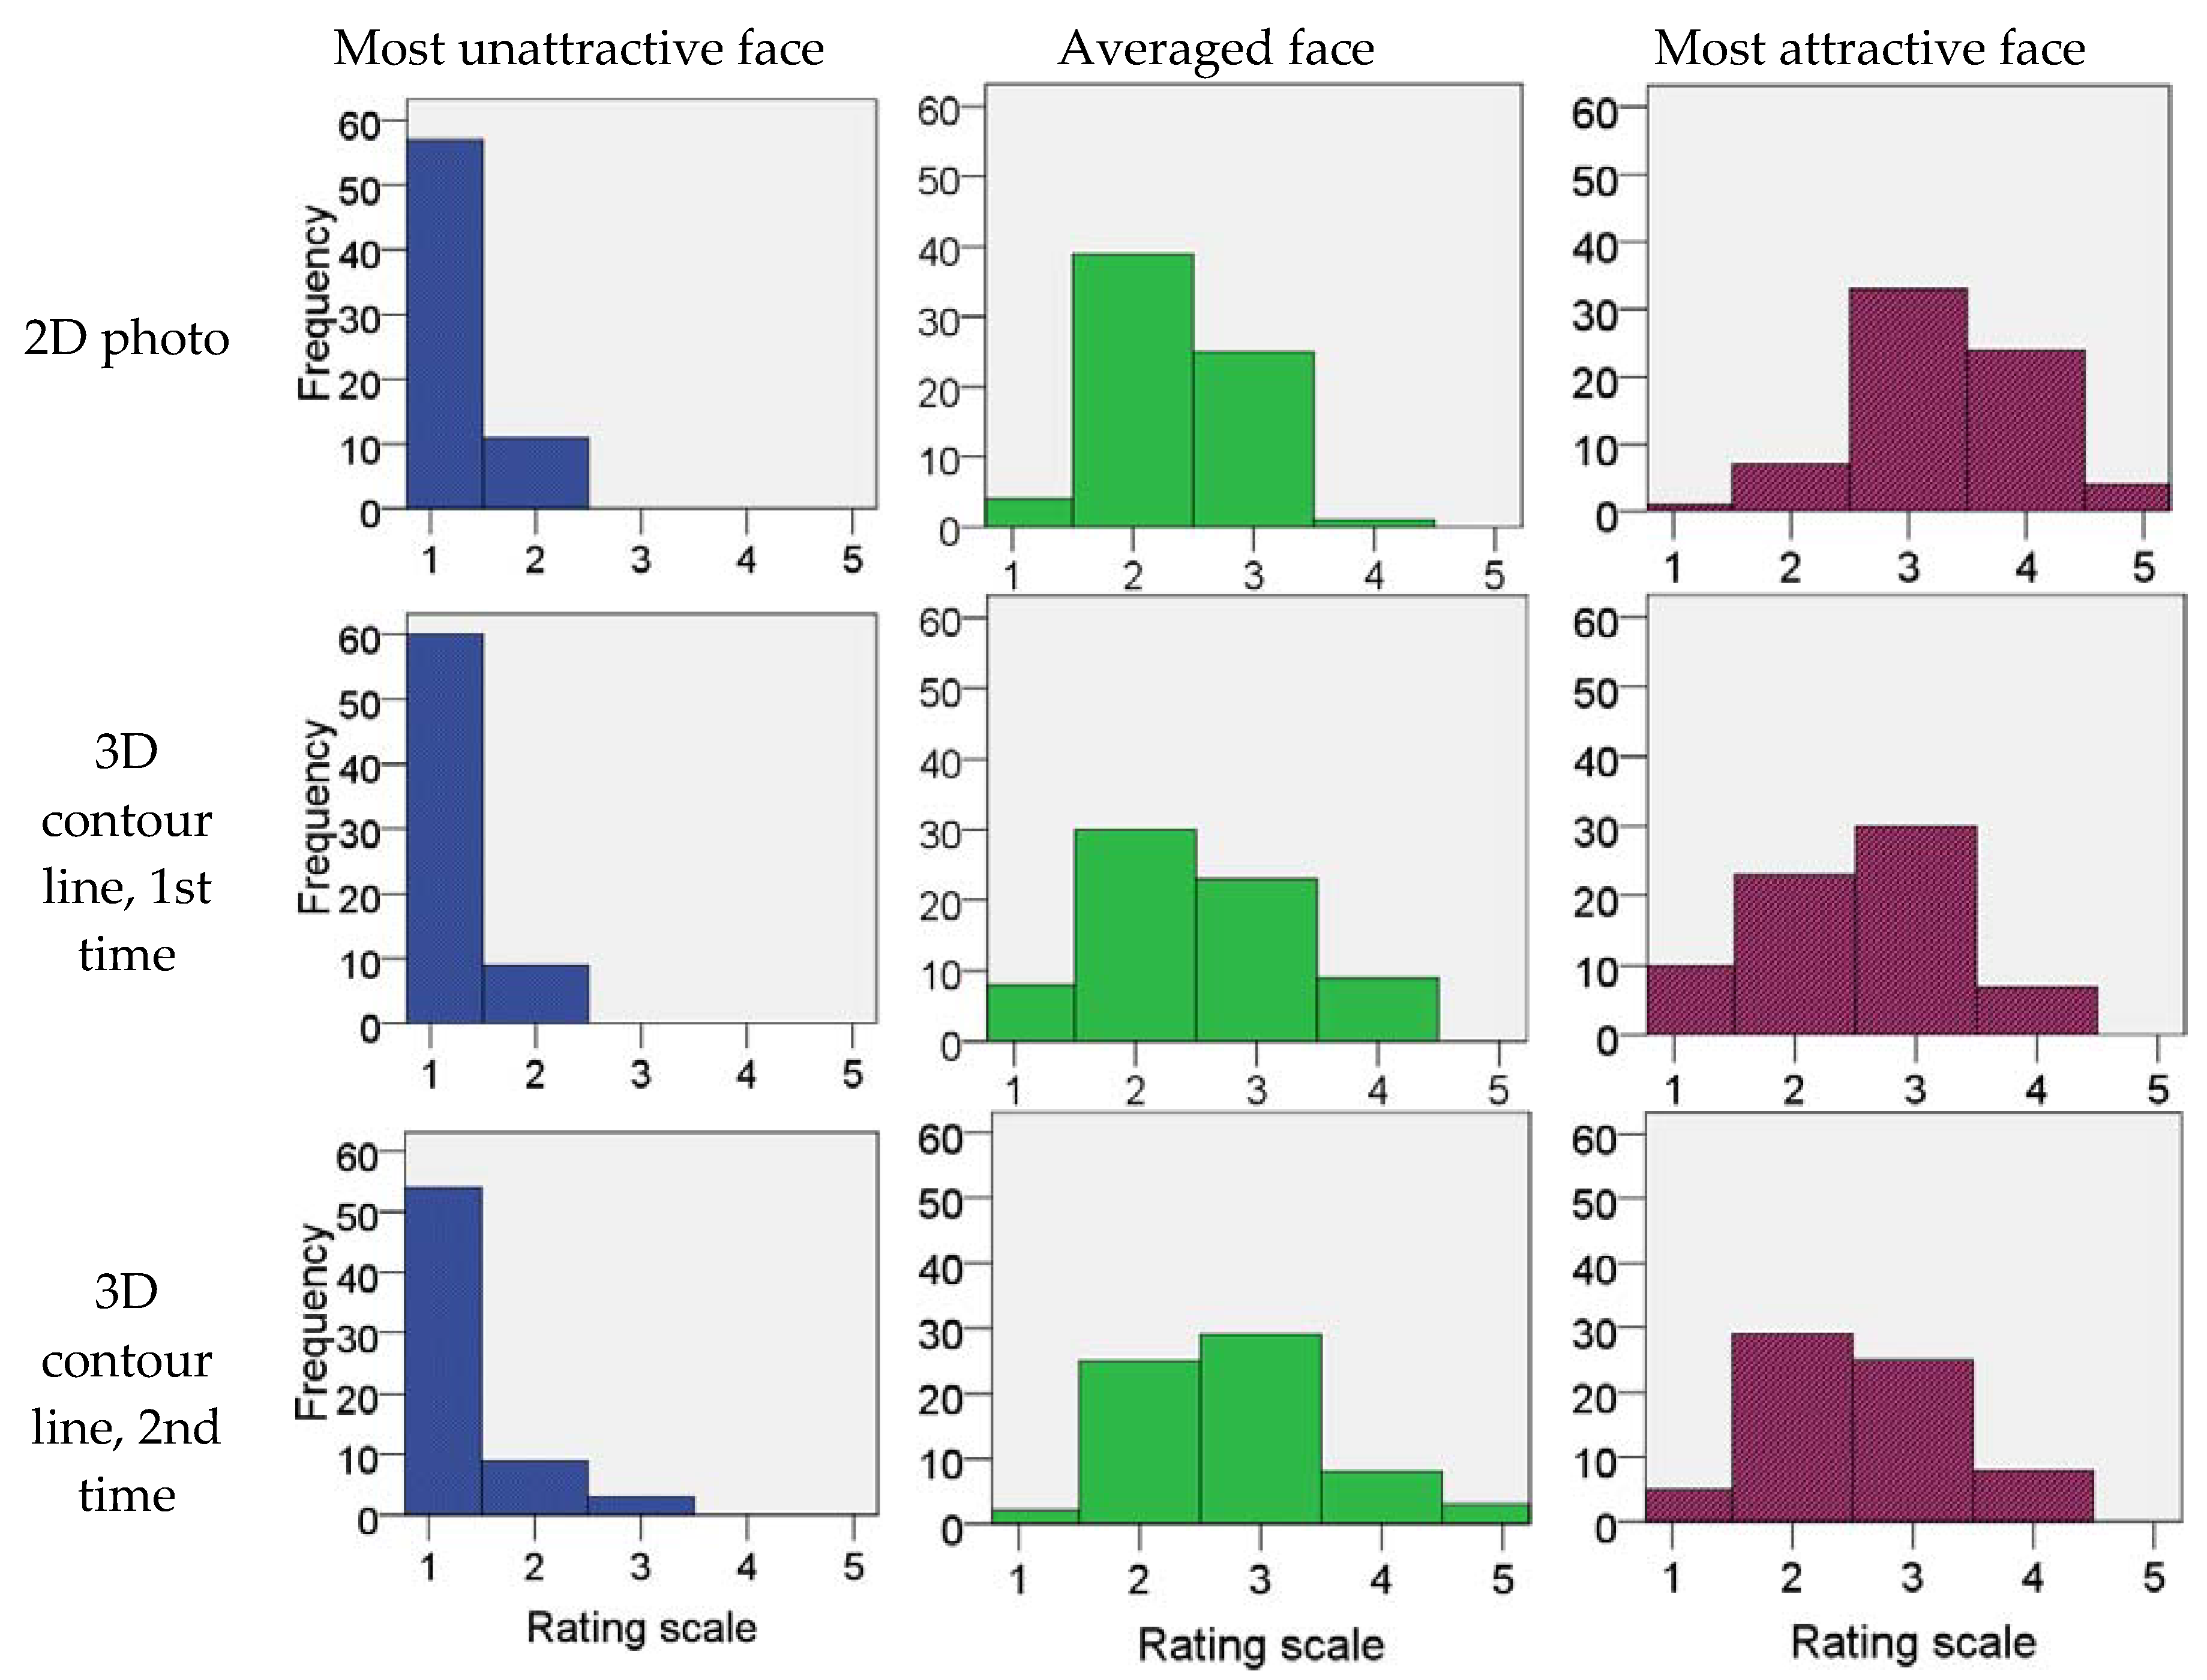
- The evaluation by panel assessment of female facial attractiveness using either 2D photos or 3D contour line images showed a central tendency with a unimodal distribution.
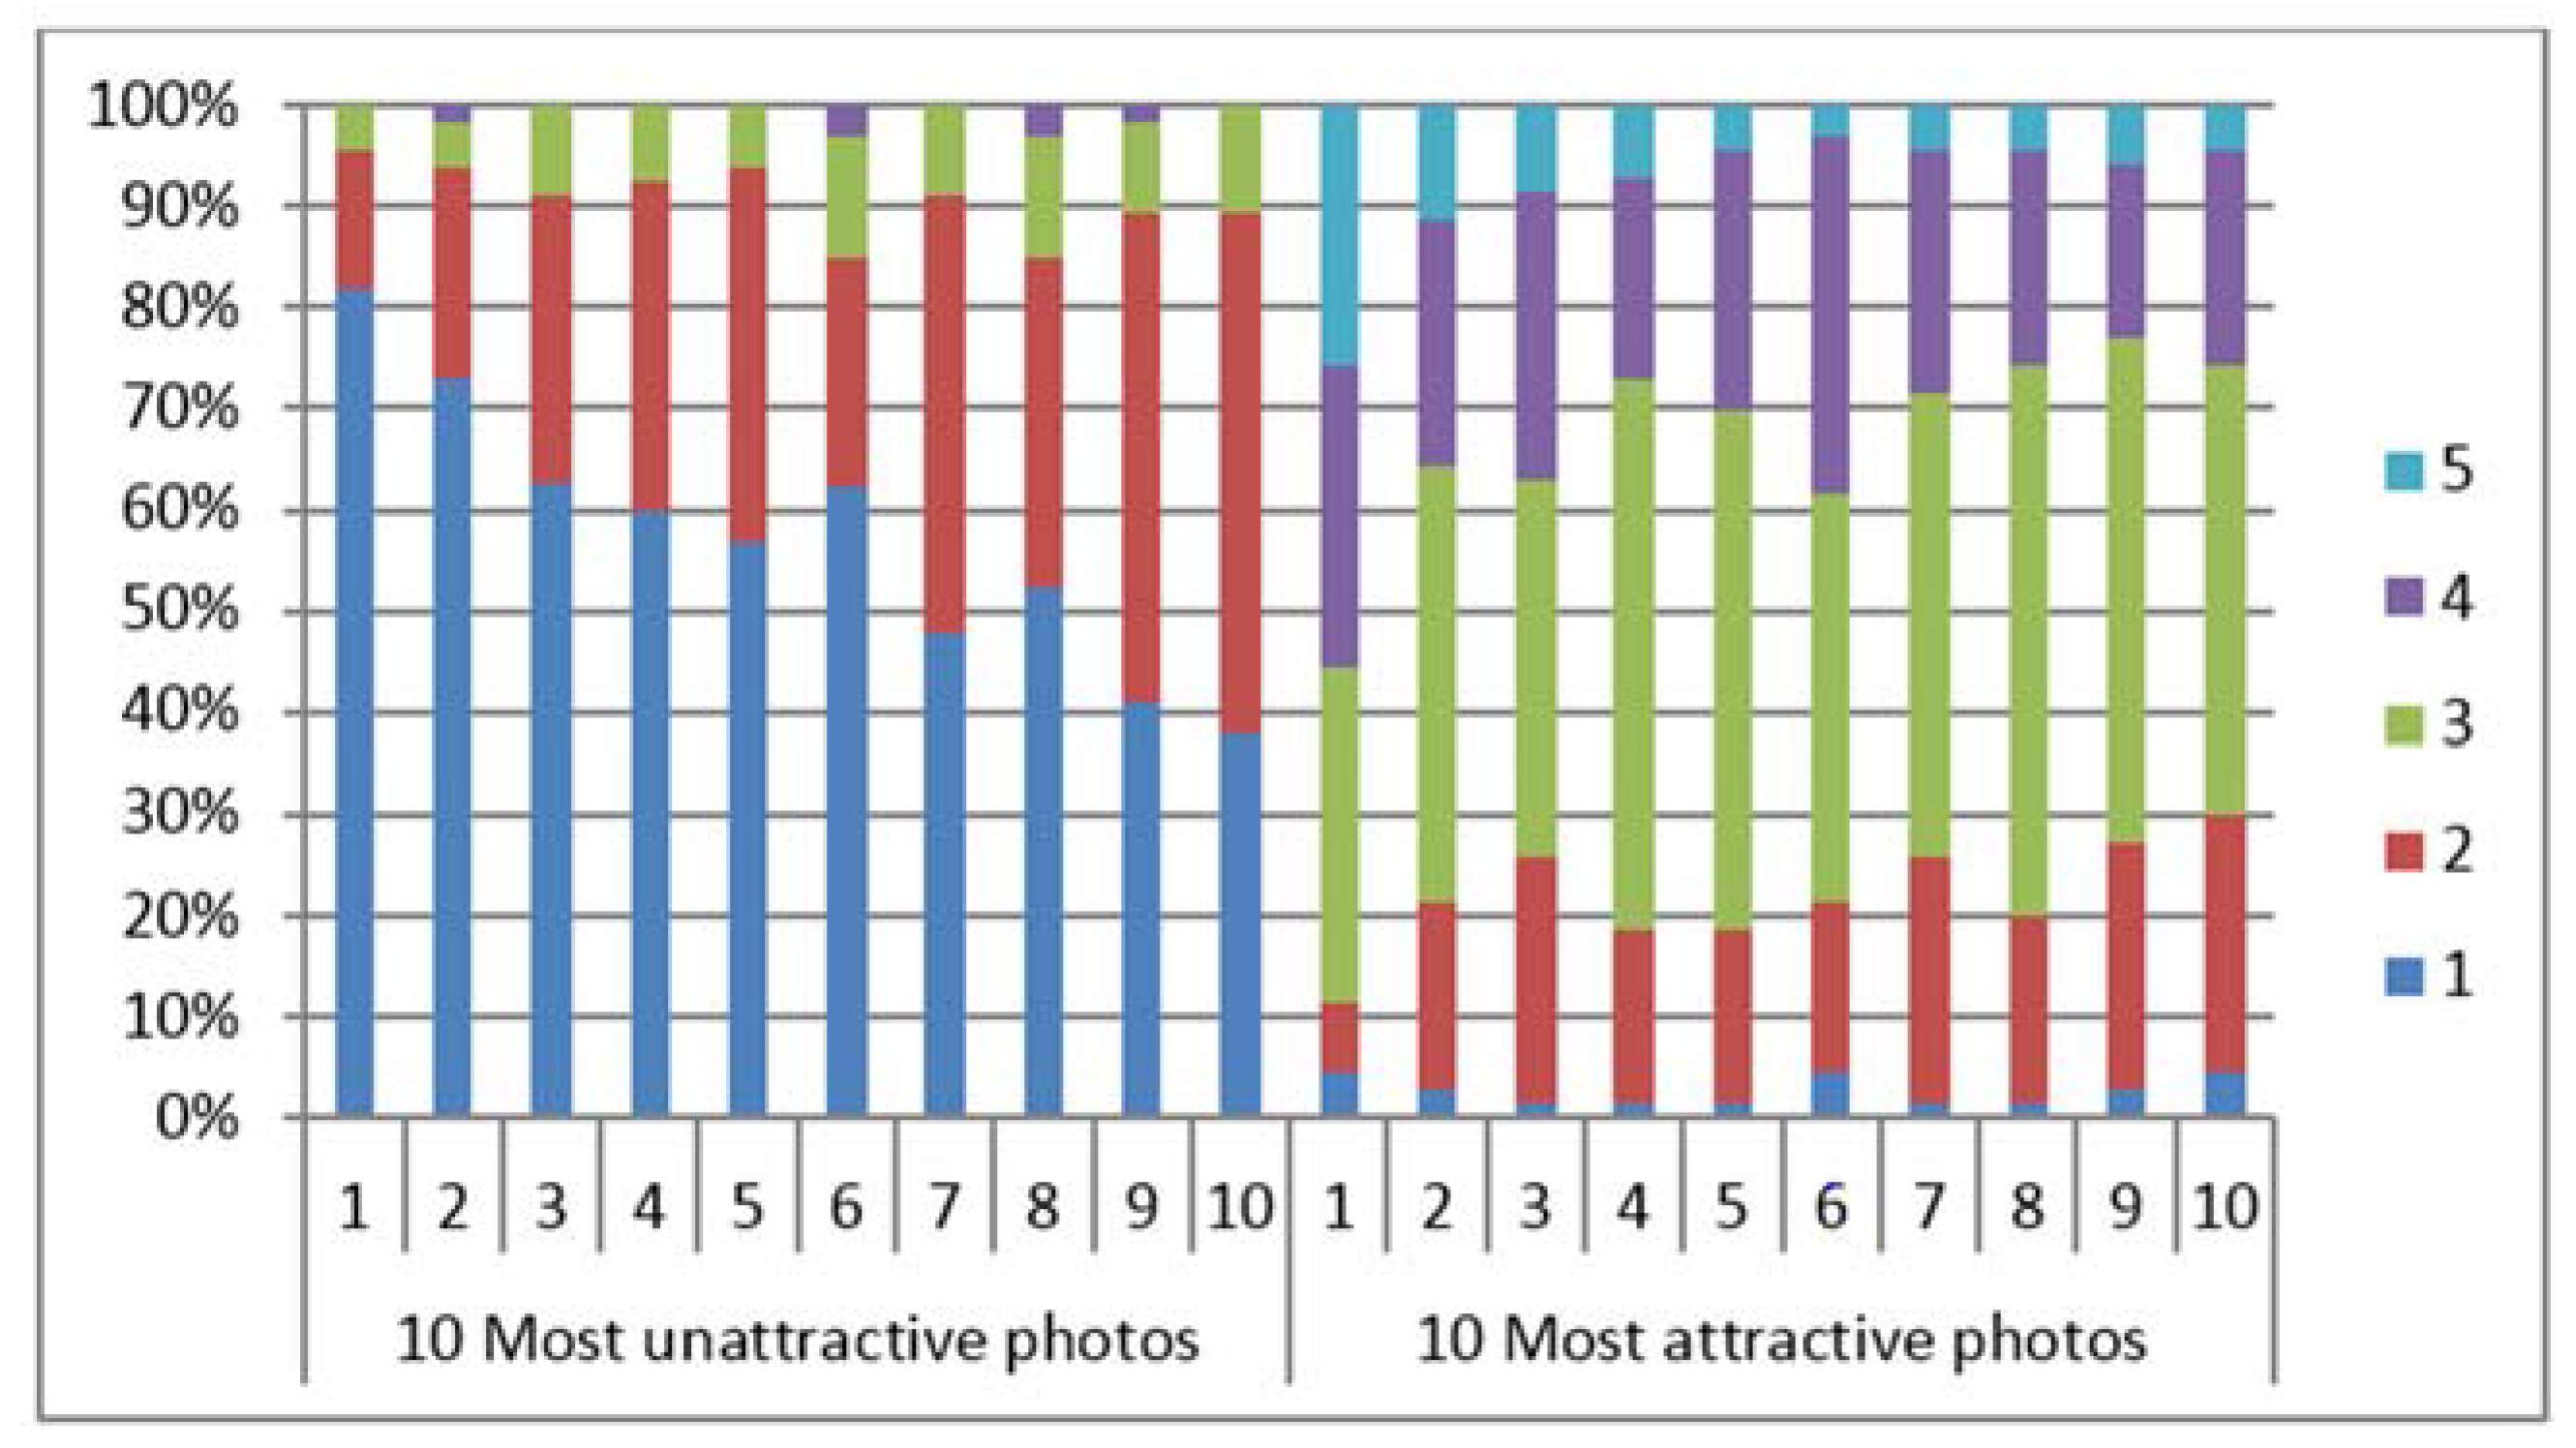
- The consistency in the judgments of either unattractive 2D photos or unattractive 3D contour line images was higher than that of the judgments of either attractive 2D photos or attractive 3D contour line images.
- The male evaluators were more critical than the female evaluators in the evaluation of female facial attractiveness.
- 3D contour lines were one of the key factors of facial attractiveness.
7. Declarations
Ethics Approval and Consent to Participate
Author Contributions
Acknowledgments
Conflicts of Interest
Abbreviations
| 2D | two-dimensional |
| 3D | three-dimensional |
| ICC | intra-class correlation coefficient |
References
- Principe, C.P.; Langlois, J.H. Faces differing in attractiveness elicit corresponding affective responses. Cognit. Emot. 2011, 25, 140–148. [Google Scholar] [CrossRef] [PubMed]
- Berry, D.S.; McAuthur, L.Z. Some componenets and consequences of a babyface. J. Personal. Soc. Psychol. 1985, 48, 312–323. [Google Scholar] [CrossRef]
- Farkas, L.G.; Hreczko, T.A.; Kolar, J.C.; Munro, I.R. Vertical and horizontal proportions of the face in young adult North American Caucasians: Revision of neoclassical canons. Plast. Reconstr. Surg. 1985, 75, 328–338. [Google Scholar] [CrossRef] [PubMed]
- Langlois, J.H.; Kalakanis, L.; Rubenstein, A.J.; Larson, A.; Hallam, M.; Smoot, M. Maxims or myths of beauty? A meta-analytic and theoretical review. Psychol. Bull. 2000, 126, 390–423. [Google Scholar] [CrossRef] [PubMed]
- Griffin, A.M.; Langlois, J.H. Stereotype directionality and attractiveness stereotyping: Is beauty good or is ugly bad? Soc. Cognit. 2006, 24, 187–206. [Google Scholar] [CrossRef] [PubMed]
- Pabari, S.; Moles, D.R.; Cunningham, S.J. Assessment of motivation and psychological characteristics of adult orthodontic patients. Am. J. Orthod. Dentofac. Orthop. 2011, 140, e263–e272. [Google Scholar] [CrossRef] [PubMed]
- Huang, C.S.; Chen, Y.R. Orthodontic principles and guidelines for the surgery-first approach to orthognathic surgery. Int. J. Oral Maxillofac. Surg. 2015, 44, 1457–1462. [Google Scholar] [CrossRef] [PubMed]
- Hunt, O.T.; Johnston, C.D.; Hepper, P.G.; Burden, D.J. The psychosocial impact of orthognathic surgery: A systematic review. Am. J. Orthod. Dentofac. Orthop. 2001, 120, 490–497. [Google Scholar] [CrossRef] [PubMed]
- Ricketts, R.M. The biologic significance of the divine proportion and Fibonacci series. Am. J. Orthod. 1982, 81, 351–370. [Google Scholar] [CrossRef]
- Jahanbin, A.; Basafa, M.; Alizadeh, Y. Evaluation of the Divine Proportion in the facial profile of young females. Indian J. Dent. Res. 2008, 19, 292–296. [Google Scholar] [CrossRef] [PubMed]
- Kawakami, S.; Tsukada, S.; Hayashi, H.; Takada, Y.; Koubayashi, S. Golden proportion for maxillofacial surgery in Orientals. Ann. Plast. Surg. 1989, 23, 417–425. [Google Scholar] [CrossRef] [PubMed]
- Pancherz, H.; Knapp, V.; Erbe, C.; Heiss, A.M. Divine proportions in attractive and nonattractive faces. World J. Orthod. 2010, 11, 27–36. [Google Scholar] [PubMed]
- Moss, J.P.; Linney, A.D.; Lowey, M.N. The use of 3d techniques in facial esthetics. Semin. Orthod. 1995, 1, 94–104. [Google Scholar] [CrossRef]
- Pallett, P.M.; Link, S.; Lee, K. New “golden” ratios for facial beauty. Vis. Res. 2010, 50, 149–154. [Google Scholar] [CrossRef] [PubMed]
- Kiekens, R.M.; Kuijpers-Jagtman, A.M.; van’t Hof, M.A.; van’t Hof, B.E.; Maltha, J.C. Putative golden proportions as predictors of facial esthetics in adolescents. Am. J. Orthod. Dentofac. Orthop. 2008, 134, 480–483. [Google Scholar] [CrossRef] [PubMed]
- Le, T.T.; Farkas, L.G.; Ngim, R.C.; Levin, L.S.; Forrest, C.R. Proportionality in Asian and North American Caucasian faces using neoclassical facial canons as criteria. Aesthet. Plast. Surg. 2002, 26, 64–69. [Google Scholar] [CrossRef] [PubMed]
- Choe, K.S.; Sclafani, A.P.; Litner, J.A.; Yu, G.P.; Romo, T., III. The Korean American woman’s face: Anthropometric measurements and quantitative analysis of facial aesthetics. Arch. Facial Plast. Surg. 2004, 6, 244–252. [Google Scholar] [CrossRef] [PubMed]
- Zacharopoulos, G.V.; Manios, A.; De Bree, E.; Kau, C.H.; Petousis, M.; Zacharopoulou, I.; Kouremenos, N. Neoclassical facial canons in young adults. J. Craniofac. Surg. 2012, 23, 1693–1698. [Google Scholar] [CrossRef] [PubMed]
- Bashour, M. History and current concepts in the analysis of facial attractiveness. Plast. Reconstr. Surg. 2006, 118, 741–756. [Google Scholar] [CrossRef] [PubMed]
- Langlois, J.H.; Roggman, L.A. Attractive faces are only average. Psychol. Sci. 1990, 1, 115–121. [Google Scholar] [CrossRef]
- Perrett, D.I.; Burt, D.M.; Penton-Voak, I.S.; Lee, K.J.; Rowland, D.A.; Edwards, R. Symmetry and human facial attractiveness. Evol. Hum. Behav. 1999, 20, 295–307. [Google Scholar] [CrossRef]
- Grammer, K.; Thornhill, R. Human (Homo sapiens) facial attractiveness and sexual selection: The role of symmetry and averageness. J. Comp. Psychol. 1994, 108, 233–242. [Google Scholar] [CrossRef] [PubMed]
- Penton-Voak, I.S.; Jones, B.C.; Little, A.C.; Baker, S.; Tiddeman, B.; Burt, D.M.; Perrett, D.I. Symmetry, sexual dimorphism in facial proportions and male facial attractiveness. Proc. Biol. Sci. 2001, 268, 1617–1623. [Google Scholar] [CrossRef] [PubMed]
- Scheib, J.E.; Gangestad, S.W.; Thornhill, R. Facial attractiveness, symmetry and cues of good genes. Proc. Biol. Sci. 1999, 266, 1913–1917. [Google Scholar] [CrossRef] [PubMed]
- Chiang, W.-C.; Lin, H.-H.; Huang, C.-S.; Lo, L.-J.; Wan, S.-Y. The cluster assessment of facial attractiveness using fuzzy neural network classifier based on 3D Moiré features. Pattern Recognit. 2014, 47, 1249–1260. [Google Scholar] [CrossRef]
- Locher, P.; Unger, R.; Sociedade, P.; Wahl, J. At first glance: Accessibility of the physical attractiveness stereotype. Sex Roles 1993, 28, 729–743. [Google Scholar] [CrossRef]
- Olson, I.R.; Marshuetz, C. Facial attractiveness is appraised in a glance. Emotion 2005, 5, 498–502. [Google Scholar] [CrossRef] [PubMed]
- Chung, E.H.; Borzabadi-Farahani, A.; Yen, S.L. Clinicians and laypeople assessment of facial attractiveness in patients with cleft lip and palate treated with LeFort I surgery or late maxillary protraction. Int. J. Pediatr. Otorhinolaryngol. 2013, 77, 1446–1450. [Google Scholar] [CrossRef] [PubMed]
- Philips, C.; Tulloch, C.; Dann, C. Rating of facial attractiveness. Community Dent. Oral Epidemiol. 1992, 20, 214–220. [Google Scholar] [CrossRef]
- Kiekens, R.M.; Maltha, J.C.; van’t Hof, M.A.; Kuijpers-Jagtman, A.M. A measuring system for facial aesthetics in Caucasian adolescents: Reproducibility and validity. Eur. J. Orthod. 2005, 27, 579–584. [Google Scholar] [CrossRef] [PubMed]
- Peerlings, R.H.; Kuijpers-Jagtman, A.M.; Hoeksma, J.B. A photographic scale to measure facial aesthetics. Eur. J. Orthod. 1995, 17, 101–109. [Google Scholar] [CrossRef] [PubMed]
- Spyropoulos, M.N.; Halazonetis, D.J. Significance of the soft tissue profile on facial esthetics. Am. J. Orthod. Dentofac. Orthop. 2001, 119, 464–471. [Google Scholar] [CrossRef] [PubMed]
- Maple, J.R.; Vig, K.W.; Beck, F.M.; Larsen, P.E.; Shanker, S. A comparison of providers’ and consumers’ perceptions of facial-profile attractiveness. Am. J. Orthod. Dentofac. Orthop. 2005, 128, 690–696. [Google Scholar] [CrossRef] [PubMed]
- Kiekens, R.M.; van’t Hof, M.A.; Straatman, H.; Kuijpers-Jagtman, A.M.; Maltha, J.C. Influence of panel composition on aesthetic evaluation of adolescent faces. Eur. J. Orthod. 2007, 29, 95–99. [Google Scholar] [CrossRef] [PubMed]
- Lundstrom, A.; Woodside, D.G.; Popovich, F. Panel assessments of facial profile related to mandibular growth direction. Eur. J. Orthod. 1987, 9, 271–278. [Google Scholar] [CrossRef] [PubMed]
- Gunes, H.; Piccardi, M. Assessing facial beauty through proportion analysis by image processing and supervised learning. Int. J. Hum. Comput. Stud. 2006, 64, 1184–1199. [Google Scholar] [CrossRef]
- Schmid, K.; Marx, D.; Samal, A. Computation of a face attractiveness index based on neoclassical canons, symmetry, and golden ratios. Pattern Recognit. 2008, 41, 2710–2717. [Google Scholar] [CrossRef]
- Nestor, M.S.; Stillman, M.A.; Frisina, A.C. Subjective and objective facial attractiveness: Ratings and gender differences in objective appraisals of female faces. J. Clin. Aesthet. Dermatol. 2010, 3, 31–36. [Google Scholar] [PubMed]
- Abu Arqoub, S.H.; Al-Khateeb, S.N. Perception of facial profile attractiveness of different antero-posterior and vertical proportions. Eur. J. Orthod. 2011, 33, 103–111. [Google Scholar] [CrossRef] [PubMed]
- Perrett, D.I.; May, K.A.; Yoshikawa, S. Facial shape and judgements of female attractiveness. Nature 1994, 368, 239–242. [Google Scholar] [CrossRef] [PubMed]


| Evaluators | 2D Photos | 3D Contour Line Images | |
|---|---|---|---|
| 1st Evaluation | 2nd Evaluation | ||
| N | 69 | 70 | 67 |
| M:F | 43:26 | 44:26 | 38:29 |
| Mean score rated by all evaluators | 2.36 ± 0.55 | 2.24 ± 0.46 | 2.34 ± 0.50 |
| Mean score rated by male evaluators | 2.27 ± 0.50 | 2.19 ± 0.43 | 2.26 ± 0.45 |
| Mean score rated by female evaluators | 2.51 ± 0.65 | 2.32 ± 0.53 | 2.45 ± 0.57 |
| Cronbach’s alpha | 0.964 | 0.950 | 0.958 |
| ICC | 0.245 | 0.190 | 0.226 |
| Evaluations | Mean Percent of Evaluators | |
|---|---|---|
| 1 Score | 2 Scores | |
| 2D Photos | 51.83% ± 7.04% | 83.84% ± 7.19% |
| 3D contour line 1st evaluation | 49.59% ± 8.60% | 80.67% ± 6.97% |
| 3D contour line 2nd evaluation | 49.09% ± 7.61% | 79.12% ± 6.55% |
© 2018 by the authors. Licensee MDPI, Basel, Switzerland. This article is an open access article distributed under the terms and conditions of the Creative Commons Attribution (CC BY) license (http://creativecommons.org/licenses/by/4.0/).
Share and Cite
Jirathamopas, J.; Liao, Y.F.; Ko, E.W.-C.; Chen, Y.-R.; Huang, C.S. Female Facial Attractiveness Assessed from Three-Dimensional Contour Lines by University Students. Dent. J. 2018, 6, 16. https://doi.org/10.3390/dj6020016
Jirathamopas J, Liao YF, Ko EW-C, Chen Y-R, Huang CS. Female Facial Attractiveness Assessed from Three-Dimensional Contour Lines by University Students. Dentistry Journal. 2018; 6(2):16. https://doi.org/10.3390/dj6020016
Chicago/Turabian StyleJirathamopas, Jinwara, Yu Fang Liao, Ellen Wen-Ching Ko, Yu-Ray Chen, and Chiung Shing Huang. 2018. "Female Facial Attractiveness Assessed from Three-Dimensional Contour Lines by University Students" Dentistry Journal 6, no. 2: 16. https://doi.org/10.3390/dj6020016
APA StyleJirathamopas, J., Liao, Y. F., Ko, E. W.-C., Chen, Y.-R., & Huang, C. S. (2018). Female Facial Attractiveness Assessed from Three-Dimensional Contour Lines by University Students. Dentistry Journal, 6(2), 16. https://doi.org/10.3390/dj6020016