Abstract
Infrared (IR) and visible image fusion has become an important technology for maritime environment awareness. In this study, we employed refined features fusion and Sobel loss for maritime IR and visible image fusion. First, we used the encoder in Densefuse net to transform the image to be fused from the pixel domain to the feature domain. Then, the features’ information was accurately measured, and the refined features were fused and sent to the decoder to reconstruct the fused images. Mixed loss, commonly employed in image fusion, eliminates the effect of different losses but also introduces hyperparameters. We innovatively used Sobel loss to measure the input and fused images to reduce the hyperparameters in the loss function. Finally, experiments were performed, and our algorithm achieved good fusion results in the qualitative and quantitative evaluations.
1. Introduction
Recently, many cameras have been installed on ships to enhance safety and intelligence. Multimodal image fusion has a wide application in ships. Because there is no lookout crew on board an unmanned ship, the automatic sensing of the navigation environment is crucial. Multimode image fusion can make up for the limited capability of radar and automatic identification systems (AIS) in small target detection and recognition at sea. Even for ordinary ships, the officers can comprehensively grasp the marine traffic situation and identify dangerous targets by observing fused images. In addition, for search and rescue at sea, the fusion of IR and visible images can increase the possibility of finding people overboard and reduce search times and human fatalities.
Different applications have different requirements because of the specificity of application scenarios. In land scenarios, the existing research approaches have achieved a good fusion effect [1,2,3]. In maritime multimodal image fusion, the seaman and detection algorithms are more sensitive to edges; thus, edges are more crucial than colors. Therefore, in this study, we propose a model called maritime infrared and visible image fusion based on refined features fusion and novel edge loss. The characteristics and contributions of our work are summarized as follows:
- We propose a framework for the maritime infrared and visible image fusion task that is very important for ship navigation and human rescue at sea;
- We measure the gradients of each pair of feature maps and fuse the refined features;
- We develop a loss function based on Sobel edge detection to reduce hyperparameters in the loss function. As far as we know, this is the first time that Sobel edge is used as a loss function for multimodal image fusion;
- We test the proposed method on public datasets. The qualitative and quantitative results validate the effectiveness of our method.
2. Related Work
2.1. Maritime Computer Vision
Collisions between merchant ships are less common because merchant ships have large hulls and switch on AIS and horn lights; thus, they can be detected by other ships from a considerable distance. However, small wooden fishing boats, pirate ships, life rafts, and lifeboats, are usually unequipped with AIS and have a small radar cross-section, thus making detection difficult. At all times, the ship officers must keep an eye on the sea. When an officer on watch is tired, the lack of lookout can result in accidents at sea. Thus, additional sensors should be added to enhance the navigation environment’s sensing to ensure the safety of unmanned ships. Many unmanned ships use IR and visible cameras, and image fusion has become an important technology [4,5]. For marine situational awareness, Rolls-Royce uses IR and visible image fusion [6]. The China Classification Society have proposed that smart ships should use sensor information fusion technology to obtain and perceive navigation information [7]. To prevent maritime accidents caused by human fatigue, computer vision is increasingly being employed on ordinary ships to assist crews in lookout and hazard target detection. Multimodal image fusion may increase the probability of rescue, particularly for the search and rescue of people overboard.
2.2. Infrared and Visible Image Fusion
IR and visible fusion approaches can be divided into multiscale decomposition [8,9], sparse representation (SR) [10], and deep learning (DL) [1,11,12,13]. Multiscale decomposition usually transforms the source image into sub-images at different scales, and then, combines these sub-images to generate the final fused image. Toet used a low-pass pyramid to decompose the source image into sub-blocks at different resolutions, and then, performed image fusion based on the contrast of the sub-blocks [8]. SR divides the image into different sub-blocks, uses dictionary learning to obtain an overcomplete dictionary, then solves the coefficient matrix of each image, and finally fuses the coefficients through the appropriate fusion rules to obtain the final fusion image. The traditional SR model and many extensions have been applied on image fusion. For example, Liu fused the IR and visible images under the framework of the joint sparse representation [14]. To overcome the limited ability of detail preservation and the high sensitivity to misregistration, Liu used convolutional sparse representation to decompose each source image into a base layer and a detail layer [10].
In the past few years, deep learning has shown great potential in several computer vision tasks, such as image fusion [1,12,15], visual quality evaluation [16], earth observation [17], and image clustering [18]. The deep neural network can obtain rich feature information due to its powerful feature extraction capability, which is extremely helpful for image fusion. In terms of the adopted architecture, these DL-based fusion approaches include the autoencoder [19], convolutional neural network (CNN), and generative adversarial network (GAN) methods [20,21,22]. With an increase in depth, the degradation is exposed in the traditional CNN, and the features extracted from the middle layers are not fully utilized. In order to overcome these problems, Densefuse net [19], proposed by Li, combines the dense block with the encoding network. The Densefuse network achieves good results in objective and subjective assessments and has become a representative work of image fusion using autoencoders. The IR and visible features are separately extracted in the autoencoder approach, and the features are fused and fed to the decoder for image reconstruction. However, fusing features is a major issue in multimodal image fusion. For feature extraction, Ma et al. employed the VGG16 network to obtain the weights of the IR and visible images for feature fusion [13]. In this study, Densefuse net [19] is employed as the backbone network for IR and visible fusion.
2.3. Loss Function
The loss function, which can determine the final effect, is an important part of DL. Various loss functions have different impacts on the reconstructed images [23]. Currently, various loss functions, such as pixel loss, content loss, perceptual loss [24], and adversarial loss, have been extensively used in the fusion field. Because different losses have their advantages and disadvantages, researchers often use mixed loss functions, such as
where , , are the hyperparameters which are employed to balance the effects of various losses. Selecting good hyperparameters often necessitates numerous experiments. Selecting a good hyperparameter can take a long time if the model is large. In this study, the parameter-free Sobel loss is employed to reduce hyperparameters in the loss function.
3. Method
3.1. Domain Transform
In certain scenarios, it is better to process the image in the transform domain and then use the inverse transform to return it to the spatial domain [25]. In this study, the images to be fused are transformed from the spatial domain to the feature domain for fusion, and then to the spatial domain. Figure 1 shows the domain transform framework for the IR and visible images fusion. First, the encoder in Densefuse net [19] is employed to extract the features of the IR and visible images; then, the feature maps’ weights are optimized, and the two sets of feature maps are fused. Finally, the decoder in the Densefuse net converts the fused feature maps to the spatial domain to obtain the fused image.
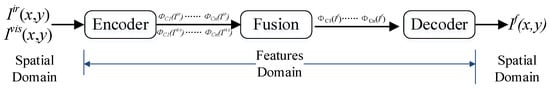
Figure 1.
The framework of domain transform for IR and visible images fusion.
The transformation can also be expressed in Equation (2):
where I denotes the input image, E is the encoder, and represents the transformed image.
3.2. Refined Features Fusion
To accurately measure the features’ information, this study employed the encoder to extract the IR and visible feature maps, as shown in Figure 2. Certain feature maps contain additional image information, and a large weight should be maintained during feature fusion. However, for feature maps with a small amount of information, the fusion weight should be suitably reduced. To measure the information in the extracted feature maps, their gradients were employed for evaluation. The information measurement was then defined as follows:
where represents the th feature map from the encoder; and represent the height and width of the feature map; represents the Laplacian operator; and represents the Frobenius norm.

Figure 2.
Pipeline of the proposed method in the testing process.
After obtaining the feature map’s information amount, Softmax was employed to normalize the feature maps’ weights, thus ensuring that the fused feature maps’ pixel values were in a reasonable range.
As shown in Equation (5), the normalized weight was multiplied by the corresponding feature map to obtain the refined features. As shown in Equation (6), the fused feature set was sent to the decoder and converted to the spatial domain.
3.3. Sobel Loss
This study employs edges to measure the loss between the input and output images to solve the problem of hyperparameters of the loss function. Edges are crucial information for target detection, tracking, recognition, and classification. The integrity of the fused image’s edges is an important evaluation indicator. The Sobel operator is a discrete differentiation operator employed for edge detection. It combines Gaussian smoothing and differential derivation to compute the image grayscale function’s approximate gradient. The Sobel loss is defined as:
where and represent the input image and the reconstructed image, respectively, and and represent the horizontal and vertical operators in Sobel, respectively. Figure 3 shows the training process. Densefuse net was employed as the backbone. T91, BSD100 [26], and BSD200 [27] were employed to train the encoder and decoder, and the amount of training data was increased by slicing the images.

Figure 3.
The training process of the proposed method. Dashed lines represent the data used in the Sobel loss.
4. Results and Discussion
4.1. Training Details
During the training, the source images in the datasets were cropped to patches of size 60 × 60, and the step was set to 30. In order to make the training data distribution uniform, the training datasets were shuffled after cropping. An Adam optimizer with a learning rate of 1 × 10⁻³ was used to update the parameters, and the batch size was set to 200. Experiments were performed on NVIDIA V100 GPUs with 16 GB memory. To accelerate the training, compute unified device architecture (CUDA) and the CUDA deep neural network library (cuDNN) versions 9.0 and 7.0, respectively, are used herein.
The training loss curves are shown in Figure 4, and we can see that the Sobel loss improved consistently. To save the best parameters, we used early stopping, which terminated the training when the monitored metric stopped improving. In this study, we used validation loss as the monitored metric. The smallest loss of validation was achieved at the 65th epoch and remained approximately constant thereafter. Therefore, the training was stopped after the 75th epoch, and the learned weights at the 65th epoch were saved.

Figure 4.
Training loss and validation loss in the training process.
4.2. Refined Feature Fusion
The differences between the convolution layers gradually increased during the training process. Some convolution layers were more positive for IR images, and certain convolutions were more positive for visible images. We fed an infrared image and a visible image into the encoder and selected the results of the first eight layers of the encoder, as shown in Figure 5. We can see that the output of different layers for the same image were very different. For images of different modalities, the results of the same layer were also quite different.

Figure 5.
Outputs of the first eight convolution layers of the encoder on an IR image and the corresponding visible image. (a) IR; (b) visible. Input images are from TNO [28].
To accurately measure the richness of the features, we computed the gradient values for each pair of IR and visible feature maps in Figure 5, as shown in Table 1. We can see that the gradients of each pair of feature maps varied greatly. For images of the same modality, the response of different layers changed drastically. Taking the infrared features as an example, the gradient of the first layer was 269.2, while the gradient of the fourth layer was only 4.8. The gradient difference of different modal images in the same layer was also very large. The gradient of the infrared feature map in the first layer was about twice that of the visible feature map. However, the gradient difference between the second IR and visible feature pair was very small.

Table 1.
The feature gradient and weight of the first eight layers.
Therefore, it is difficult to use a constant for the value of c in Equation (4). In this study, we employed Softmax to normalize the gradients to obtain the weights of the feature pairs. In order to reflect the gradient differences between layers, we used the mean of the gradients of the IR and visible images. The c values employed in this study for normalization are shown in Equation (8). The feature maps in different layers have their own weights, as shown in Table 1.
4.3. Performance Evaluation
Although there are multiple different image fusion approaches, the primary purpose is always to enhance the fusion images’ quality, and this is the basic criterion for measuring the fusion effect [29]. We compared our approach with six typical fusion approaches, including Low pass [8], GTF [30], FusionGAN [20], U2Fusion [13] and Densefuse(addition) and Densefuse(l1_norm) [19]. The source codes were provided by their authors, and we used those codes to fuse the test images. There is no consensus on which metrics are most appropriate for describing fusion performance. Note that seven quality metrics were employed to make a quantitative comparison of the fusion results. These metrics were entropy (EN), Qabf [31], the sum of the correlations of differences (SCD), the mutual information for the wavelet (FMIw), the mutual information for the discrete cosine (FMIdct), structural similarity (SSIMa), and mean structural similarity (MS_SSIM). For a fair comparison, we assessed the test images under a public code provided by Li [19]. Our approach was qualitatively compared with six state-of-the-art approaches on four typical marine image pairs, as illustrated in Figure 6. The fused images obtained by Low pass contained strong artificial noise, which causes great interference to target detection and recognition. The edges of the targets were blurred in the fused images by GTF and FusionGAN. The features in the images fused by our approach were clearer than those of Densefuse(addition).

Figure 6.
Qualitative comparison of our method with 6 state-of-the-art methods on 4 typical marine image pairs. The first three pairs of test images are from the Visible-Infrared Database [32], and the last pair is from TNO. For a clear comparison, we use a red box to select a small area in each image and zoom in it in the bottom right corner.
Limited by the number of marine images, we employed quantitative comparisons on twenty images from the TNO dataset to accurately measure the quality of the fused images. Because each metric measures the fused image differently, it is challenging for a model to achieve the best results for all the evaluation metrics. Our algorithm achieved four best and one second-best result for six metrics, as illustrated in Table 2. Specifically, our method achieved the best results for Qabf, FMIw, FMIdct, and SSIMa. For the metric of MS_SSIM, our method can also yield comparable results. It is interesting that Densefuse(addition) and Densefuse(l1_norm) performed better than other recent state-of-the-art methods. Our algorithm is an improvement of Densefuse, and the results prove the effectiveness of refined features fusion and Sobel loss.
Table 2.
The average values of quality metrics for twenty fused images in the TNO dataset (red: the best; blue: the second best).
In order to demonstrate the fusion of our algorithm on more public images, we selected typical image pairs from TNO to make a qualitative comparison. In Figure 7, the first row are image pairs in dark conditions, the middle two rows are image pairs in bright light, and the last row are image pairs in twilight or dawn. The images fused by our algorithm maintained high contrast and sharpness in those illumination conditions. Thus, it is proven that the refined feature fusion can handle the fusion of IR and visible images under different lighting conditions.

Figure 7.
Qualitative comparison of our method with 5 state-of-the-art methods on 4 typical VIS and IR image pairs in the TNO dataset. For a clear comparison, we use a red box to select a small area in each image and zoom in it in the bottom right corner.
5. Conclusions
In this study, we propose a novel maritime IR and visible image fusion approach based on refined features fusion and Sobel loss. First, the input images were fed to the decoder to obtain the feature maps. The feature maps in each layer obtained their own weights after normalization, and refined features were fused and sent to the decoder to reconstruct the fused images. We eliminated hyperparameters in the mixed loss by proposing Sobel loss. Finally, qualitative and quantitative evaluations were performed on maritime images, and our approach’s validity was confirmed. Moreover, the results prove that the refined feature fusion can handle the fusion of IR and visible images under different lighting conditions. Furthermore, our work in the future will focus on maritime IR and visible image fusion based on downstream tasks, such as image fusion’s support of object detection.
Author Contributions
Methodology, Z.G.; software, Z.G.; investigation, Z.G. and B.M.; writing—original draft preparation, Z.G.; writing—review and editing, Z.G. and H.C.; funding acquisition, Z.G. and F.Z. All authors have read and agreed to the published version of the manuscript.
Funding
This research was funded by the Fundamental Research Funds of the Central Universities, grant number 3132022145; Liao Ning Revitalization Talents Program, grant number XLYC1902071; Natural Science Foundation of Liaoning, grant number 2019-ZD-0162; and Liaoning Provincial Shipping Joint Fund, grant number 2020-HYLH-28.
Institutional Review Board Statement
Not applicable.
Informed Consent Statement
Not applicable.
Data Availability Statement
Not applicable.
Conflicts of Interest
The authors declare no conflict of interest.
References
- Zhang, H.; Xu, H.; Tian, X.; Jiang, J.; Ma, J. Image fusion meets deep learning: A survey and perspective. Inf. Fusion 2021, 76, 323–336. [Google Scholar] [CrossRef]
- Ma, J.; Ma, Y.; Li, C. Infrared and visible image fusion methods and applications: A survey. Inf. Fusion 2019, 45, 153–178. [Google Scholar] [CrossRef]
- Jin, X.; Jiang, Q.; Yao, S.; Zhou, D.; Nie, R.; Hai, J.; He, K. A survey of infrared and visual image fusion methods. Infrared Phys. Technol. 2017, 85, 478–501. [Google Scholar] [CrossRef]
- Rødseth, Ø.J.; Tjora, Å. A System Architecture for an Unmanned Ship. In Proceedings of the 13th International Conference on Computer and IT Applications in the Maritime Industries (COMPIT), Redworth, UK, 12–14 May 2014. [Google Scholar]
- Fan, C.; Wróbel, K.; Montewka, J.; Gil, M.; Wan, C.; Zhang, D. A framework to identify factors influencing navigational risk for Maritime Autonomous Surface Ships. Ocean Eng. 2020, 202, 107–188. [Google Scholar] [CrossRef]
- Rolls-Royce. Remote and Autonomous Ships the Next Steps, London, UK. 2016. Available online: https://www.rolls-royce.com/~/media/Files/R/Rolls-Royce/documents/%20customers/marine/ship-intel/rr-ship-intel-aawa-8pg.pdf (accessed on 12 July 2022).
- China Classification Soc. Smart Ship Specification 2020, Beijing, China. December 2019. Available online: https://www.ccs.org.cn/ccswz/articleDetail?id=201900001000009739 (accessed on 12 July 2022).
- Toet, A. Image fusion by a ratio of low-pass pyramid. Pattern Recognit. Lett. 1989, 9, 245–253. [Google Scholar] [CrossRef]
- Li, G.F.; Lin, Y.J.; Qu, X.D. An infrared and visible image fusion method based on multi-scale transformation and norm optimization. Inf. Fusion 2021, 71, 109–129. [Google Scholar] [CrossRef]
- Liu, Y.; Chen, X.; Ward, R.K.; Wang, Z.J. Image Fusion With Convolutional Sparse Representation. IEEE Signal Process. Lett. 2016, 23, 1882–1886. [Google Scholar] [CrossRef]
- Ma, J.; Tang, L.; Xu, M.; Zhang, H.; Xiao, G. STDFusionNet: An Infrared and Visible Image Fusion Network Based on Salient Target Detection. IEEE Trans. Instrum. Meas. 2021, 70, 1–13. [Google Scholar] [CrossRef]
- Zhao, F.; Zhao, W.; Yao, L.; Liu, Y. Self-supervised feature adaption for infrared and visible image fusion. Inf. Fusion 2021, 76, 189–203. [Google Scholar] [CrossRef]
- Xu, H.; Ma, J.; Jiang, J.; Guo, X.; Ling, H. U2Fusion: A Unified Unsupervised Image Fusion Network. IEEE Trans. Pattern Anal. Mach. Intell. 2022, 44, 502–518. [Google Scholar] [CrossRef]
- Liu, C.H.; Qi, Y.; Ding, W.R. Infrared and visible image fusion method based on saliency detection in sparse domain. Infrared Phys. Technol. 2017, 83, 94–102. [Google Scholar] [CrossRef]
- Tang, L.; Yuan, J.; Ma, J. Image fusion in the loop of high-level vision tasks: A semantic-aware real-time infrared and visible image fusion network. Inf. Fusion 2022, 82, 28–42. [Google Scholar] [CrossRef]
- Varga, D. No-Reference Image Quality Assessment with Convolutional Neural Networks and Decision Fusion. Appl. Sci. 2021, 12, 101. [Google Scholar] [CrossRef]
- Marmanis, D.; Datcu, M.; Esch, T.; Stilla, U. Deep learning earth observation classification using ImageNet pretrained networks. IEEE Geosci. Remote Sens. Lett. 2015, 13, 105–109. [Google Scholar] [CrossRef]
- Guérin, J.; Boots, B. Improving image clustering with multiple pretrained cnn feature extractors. arXiv 2018, arXiv:1807.07760. [Google Scholar]
- Li, H.; Wu, X. DenseFuse: A Fusion Approach to Infrared and Visible Images. IEEE Trans. Image Process. 2019, 28, 2614–2623. [Google Scholar] [CrossRef]
- Ma, J.; Yu, W.; Liang, P.; Li, C.; Jiang, J. FusionGAN: A generative adversarial network for infrared and visible image fusion. Inf. Fusion 2019, 48, 11–26. [Google Scholar] [CrossRef]
- Ma, J.; Xu, H.; Jiang, J.; Mei, X.; Zhang, X.P. DDcGAN: A Dual-Discriminator Conditional Generative Adversarial Network for Multi-Resolution Image Fusion. IEEE Trans. Image Process. 2020, 29, 4980–4995. [Google Scholar] [CrossRef]
- Zhang, H.; Le, Z.; Shao, Z.; Xu, H.; Ma, J. MFF-GAN: An unsupervised generative adversarial network with adaptive and gradient joint constraints for multi-focus image fusion. Inf. Fusion 2021, 66, 40–53. [Google Scholar] [CrossRef]
- Zhao, H.; Gallo, O.; Frosio, I.; Kautz, J. Loss Functions for Image Restoration with Neural Networks. IEEE Trans. Comput. Imaging 2017, 3, 47–57. [Google Scholar] [CrossRef]
- Johnson, J.; Alahi, A.; Li, F.-F. Perceptual Losses for Real-Time Style Transfer and Super-Resolution. In Proceedings of the European Conference on Computer Vision, Amsterdam, The Netherlands, 8–16 October 2016; pp. 694–711. [Google Scholar]
- Gonzales, R.; Woods, R. Digital Image Processing, 4th ed.; Pearson: New York, NY, USA, 2018. [Google Scholar]
- Martin, D.; Fowlkes, C.; Tal, D.; Malik, J. A Database of Human Segmented Natural Images and Its Application to Evaluating Segmentation Algorithms and Measuring Ecological Statistics. In Proceedings of the 8th IEEE International Conference on Computer Vision (ICCV), Vancouver, BC, Canada, 7–14 July 2001; pp. 416–423. [Google Scholar]
- Arbeláez, P.; Maire, M.; Fowlkes, C.; Malik, J. Contour Detection and Hierarchical Image Segmentation. IEEE Trans. Pattern Anal. Mach. Intell. 2011, 33, 898–916. [Google Scholar] [CrossRef]
- Toet, A. TNO Image Fusion Dataset. 2014. Available online: https://figshare.com/articles/dataset/TNO_Image_Fusion_Dataset/1008029 (accessed on 12 July 2022).
- Zhang, Y. Handbook of Image Engineering; Springer: Singapore, 2021. [Google Scholar]
- Ma, J.Y.; Chen, C.; Li, C.; Huang, J. Infrared and visible image fusion via gradient transfer and total variation minimization. Inf. Fusion 2016, 31, 100–109. [Google Scholar] [CrossRef]
- Xydeas, C.S.; Petrovic, V. Objective image fusion performance measure. Electron. Lett. 2000, 36, 308–309. [Google Scholar] [CrossRef]
- SMT/COPPE/Poli/UFRJ and IME-Instituto Militar de Engenharia, Visible-Infrared Data. 2016. Available online: http://www02.smt.ufrj.br/∼fusion/ (accessed on 12 July 2022).
Publisher’s Note: MDPI stays neutral with regard to jurisdictional claims in published maps and institutional affiliations. |
© 2022 by the authors. Licensee MDPI, Basel, Switzerland. This article is an open access article distributed under the terms and conditions of the Creative Commons Attribution (CC BY) license (https://creativecommons.org/licenses/by/4.0/).