Article

Valorization of the Bioactive Potential of Juniperus communis L. Berry Extracts Using a Box–Behnken Design and Characterization of Kernel Oil Compounds

by
Theofania Tsitsirigka
1,
Dimitrios Kalompatsios
2,
Vassilis Athanasiadis
2,
Eleni Bozinou
2,
Athanassios I. Sfougaris
1 and
Stavros I. Lalas
2,*
1
Crop Production and Rural Environment, Laboratory of Ecosystems and Biodiversity Management, Department of Agriculture, University of Thessaly, Fytokou Str., 38446 Volos, Greece
2
Department of Food Science and Nutrition, University of Thessaly, 43100 Karditsa, Greece
*
Author to whom correspondence should be addressed.
Separations 2025, 12(8), 209; https://doi.org/10.3390/separations12080209
Submission received: 15 July 2025 / Revised: 7 August 2025 / Accepted: 9 August 2025 / Published: 11 August 2025

Abstract

This study presents a comprehensive valorization of Juniperus communis L., a plant known for its culinary and therapeutic applications. Juniper berries are rich in antioxidant compounds such as polyphenols and ascorbic acid, while their kernels contain volatile terpenes with notable pharmaceutical properties. We optimized extraction parameters through stirring extraction (1:20 g/mL solid-to-solvent ratio, 55% v/v aqueous ethanol, 80 °C, 30 min) and response surface methodology via a Box–Behnken design. The optimal conditions—55% v/v aqueous ethanol at 80 °C for 30 min—yielded a high polyphenol content of 55.11 ± 1.54 mg GAE/g of defatted dry weight. Antioxidant capacity was confirmed through ferric-reducing and radical-scavenging assays, and 11 individual polyphenols (totaling 5.41 ± 0.27 mg/g) were quantified using a validated HPLC-DAD method. Additionally, this study identified several bioactive compounds in juniper berry raw kernel oil, which exhibited a high oleic acid content (58.75 ± 2.76%)—a nutritionally valuable fatty acid contributing to the oil’s strong radical-scavenging activity (399.83 ± 34.18 µmol Trolox equivalents/kg oil). GC–MS analysis revealed 58 volatile compounds, underscoring the terpene-rich profile of the oil and its influence on antioxidant potential and aroma. These findings underscore the dual valorization of juniper berry fruit and kernel for both medicinal and food industries. The aromatic kernel oil and polyphenol-rich extracts offer natural alternatives to synthetic antioxidants, with added benefits of flavor enhancement and promotion of health.

Graphical Abstract

1. Introduction

The genus Juniperus comprises around 60 species, making it one of the most diverse conifer genera. Common juniper (Juniperus communis L.) thrives at low to medium elevations, often co-occurring with shrubs and Quercus spp. This evergreen is the only Juniperus species native to both the Northern and Southern Hemispheres, with records even from Arctic North America and Asia [1]. J. communis is a member of the Cupressaceae family and produces strobili every two years, releasing its globose seeds at maturity [2].
Traditional folk medicine has made use of J. communis for a variety of conditions, including acute and chronic cystitis, renal suppression, albuminuria, bladder catarrh, and leucorrhea [3]. In fact, this plant material possesses a wide range of beneficial effects, including diuretic, digestive, antifungal, anti-inflammatory, antibacterial, hepatoprotective, analgesic, antioxidant, antihyperlipidemic, and anticataleptic ones, and neuroprotective ones against Parkinson’s disease [3,4]. Their berries have several medicinal uses, including relieving headaches, nephrotic dropsy in infants, rheumatic rheumatism, and painful swellings [4]. Another well-documented use of berries by Native Americans describes them as appropriate for diabetes therapy and as an anorexigenic drug and female contraceptive. The aromatic essential oils of these plants have a mild fruity scent that has a calming effect on the mind [3].
The numerous uses of oil produced from plant kernels in the food, medicinal, and cosmetic sectors have brought it considerable attention [5]. Precisely, the health benefits of kernel oils are known to boost the immune system through lowering blood cholesterol levels and enhancing the flexibility of the blood vessel wall [6]. The antioxidant and antimicrobial characteristics of kernel oils are well-known and highly valuable, particularly in the pharmaceutical industry [7]. However, to uncover and measure all the qualities of kernel oils and make the most of them, thorough testing and study is necessary. By repurposing edible fruit peels and cores in this way, we could build a system that uses resources more efficiently and generates income.
Essential oils and phenolic compounds are abundant in all juniper species, which contributes to their widespread use in traditional medicine across many nations and their many practical uses in industry and biology [8,9]. Based on what is known from traditional medicine, juniper has antioxidant, hepatoprotective, anti-inflammatory, antifungal, analgesic, and diuretic properties [10]. The primary components of these fruits are lignins, resins, sugars, wax, alkaloids, terpenic acids, and polyphenols (mainly flavonoids). The oils they produce are abundant with terpenic hydrocarbons, including diterpenes, sesquiterpenes, and especially monoterpenes (namely myrcene, α-pinene, β-pinene, and sabinene). The combination of these compounds could provide beneficial health effects [11,12].
To date, several reports have been published regarding the antioxidant capacity of juniper berries [1,10,13], along with its essential oil [12,14]. Most studies examine the essential oil obtained through the hydro distillation process, whereas we chose to explore the oxidative stability and antioxidant activity of raw kernel oil, along with volatile compounds that contribute to the aromatic profile of juniper berries. The astringency of J. communis seeds makes them overly bitter to consume; thus a holistic valorization of both berries and their kernels was considered as a feasible option [2,15]. To this end, we opted to fill the gap by valorizing juniper berries through extraction process optimization through response surface methodology (RSM) and evaluating their oil. The extraction technique that we chose to optimize is the magnetic stirring process, given its simplicity and large-scale applicability [16]. A quantity of solid was mixed with extraction solvent, where key parameters such as solvent polarity, temperature, and duration were examined. We believe that juniper berry fruit and its essential oil contain high amounts of biologically active compounds, and individual chemicals have the potential to be valuable in the creation of novel pharmacological products for the treatment of many acute and chronic human disorders.

2. Materials and Methods

2.1. Fruit Collection and Handling

Common juniper (Juniperus communis L.) is a conifer species typically found at low to medium altitudes, often growing in mixed formations alongside shrub species or oak trees. For the present study, mature fruits of J. communis were harvested manually in March 2025 from wild populations located at an approximate altitude of 300 m, near Spathades village, Kalabaka, in central Greece (coordinates: 39.717296, 21.742089).
A representative sample was collected from several trees within the same natural stand. Post-harvest, the fruit was thoroughly washed with tap freshwater, gently wiped using paper towels, and subsequently lyophilized (Figure 1A). The lyophilized material underwent size reduction through grinding into a fine powder using an electric mill (Figure 1B), and a 40-mesh sieve was used to ensure homogeneity prior to further analysis.

2.2. Experimental Design

2.2.1. Berry Oil Extraction

The kernel constituted a large part of the fruit, while the flesh was attached to it, so separating them was a challenging process. Therefore, grinding of the whole fruit was carried out, with the process of defatting being conducted with hexane, while the resulting defatted powder was further extracted with polar solvent. To defat and remove resinous components, the ground material underwent overnight maceration in n-hexane (1:10 w/v). The hexane was removed in vacuo, and the oil was further analyzed. The rationale behind the defatting process is based primarily on the examination of the kernel oil and the analysis of the components found in the resins that contribute to this aroma. Furthermore, no oil should be found in the material, since it could produce misleading positive findings in the antioxidant evaluation tests. Defatted berry was ground to a fine powder (<400 μm) and was stored at –30 °C until further analysis. Berry kernel oil was immediately analyzed to prevent possible oxidation phenomena.

2.2.2. Berry Polyphenols Extraction

To extract polyphenols from defatted ground powder, a magnetic stirring extraction (STE) process was performed with a constant solid-to-solvent ratio (1:20 g/mL). Key parameters were determined, such as the extraction solvent (using hydroethanolic mixtures), the extraction temperature (ranging from 20 to 80 °C), and duration (ranging from 30 to 90 min). RSM, employing a Box–Behnken design, was employed to seek optimized extraction parameters for all examined assays. The rationale behind the selected parameters lay in the adjustment of key extraction conditions. Solvent polarity is of high importance, especially when employing food-grade solvents (i.e., water and ethanol). Water was used to extract polar bioactive compounds, whereas ethanol was added to extract less polar compounds [17]. In addition, temperature is known to have a vast impact on the solubility of compounds of interest, since higher temperatures increase solute solubility and strengthen diffusion coefficients. However, it is crucial to maintain a temperature threshold, as some compounds are thermally unstable and could degrade after a specific point [18]. Regarding the temperature duration, we opted to minimize energy consumption, as preliminary experiments with a higher duration did not show statistically significant differences (p > 0.05) with the selected time. We examined phytochemical compounds, including total polyphenolic content (TPC), individual polyphenols, and ascorbic acid content (AAC). We also evaluated the antioxidant capacity of berries extracts using the ferric-reducing antioxidant power (FRAP) and DPPH-scavenging activity. The above-mentioned methods were applied after the stirring extraction (STE) process (i.e., maceration process using a magnetic stirring hotplate), targeting the solid residue of J. communis L. after berry oil extraction. The study examined three independent variables: ethanol proportion in water (C, % v/v) as X1, heating (T, °C) as X2, and extraction duration (t, min) as X3. These parameters were assessed using three coded levels, namely −1 (low), 0 (medium), and +1 (high), as detailed in Table 1. To ensure robustness and reproducibility, 15 experimental samples including three central points were generated, with each experiment replicated three times, averaging the recorded response values.
The ability of the model to predict the obtained results was evaluated using the Least Squares Method, causing a polynomial equation (2nd order) to form that portrayed the connections with the three independent variables as follows:
Y k   =   β 0 + i = 1 2 β i X i + i = 1 2 β i i X i 2 + i = 1 2 j = i + 1 3 β i j X i X j
The predicted response variable (Yk) and the independent variables (Xi and Xj) are inserted in the equation. Τhe intercept (β0) and regression coefficients (βi, βii, and βij) represent the quadratic and interaction terms of the model, respectively.

2.3. Reagents and Solvents

Polyphenolic chemical standards of HPLC grade (≥99.0% w/w) were purchased from MetaSci (Toronto, ON, Canada). Chloroform, anhydrous sodium carbonate, sodium chloride (≥99.0% w/w), and ammonium thiocyanate (≥99.0% w/w) were purchased from Penta (Prague, Czech Republic). Iron (III) chloride hexahydrate (≥99.0% w/w) was from Merck (Darmstadt, Germany). Gallic acid (≥99.0% w/w), ammonium iron (II) sulfate hexahydrate (≥99.0% w/w), ethanol (≥99.8% v/v), and Folin–Ciocalteu reagent were purchased from Panreac Co. (Barcelona, Spain). L-ascorbic acid (≥99.0% w/w), aluminum chloride (≥99% w/w), trichloroacetic acid (≥99.0% w/w), hydrochloric acid (37% w/w), methanol (≥99.8% v/v), 2,4,6-tris(2-pyridyl)-s-triazine (TPTZ) (≥98% w/w), 2,2-diphenyl-1-picrylhydrazyl (DPPH) (≥90.0% w/w), FAME Mix C8–C24 reference standards, and 2-propanol were all purchased from Sigma-Aldrich (Darmstadt, Germany). Deionized water for any experiments needed was produced from a deionizing column. Dichloromethane and ethyl acetate were purchased from Carlo Erba (Vaul de Reuil, France). Trolox (6-hydroxy-2,5,7,8-tetramethylchroman-2-carboxylic acid) (≥96.5% w/w) was obtained from Glentham Life Sciences (Corsham, UK). Hydrogen peroxide (35%) was purchased from Chemco (Malsch, Germany).

2.4. Instrumentation and Software

The freeze-drying procedure was conducted through a BK-FD10P lyophilizer from Biobase (Jinan, China). The dried material was pulverized with an electric milling apparatus to diminish the particle size and enhance the surface area for the extraction process, and it was then subjected to a sieving process with an Analysette 3 PRO apparatus from Fritsch GmbH (Oberstein, Germany). A magnetic stirrer from Heidolph Instruments GmbH & Co. KG (Schwabach, Germany) was utilized for the extraction procedures. A centrifuge model NEYA 16R from Remi Elektrotechnik Ltd. (Palghar, India) was employed to segregate and isolate the supernatant from the solids following the stirring extraction procedure. Spectrophotometric investigations were performed using a Shimadzu model UV-1900i UV–Vis spectrophotometer (Kyoto, Japan) to identify bioactive chemicals and assess antioxidant activity.
Individual polyphenols were quantified using a CBM-20A high-performance liquid chromatography system equipped with an SPD-M20A diode array detector from Shimadzu Europa GmbH (Duisburg, Germany). The latter was isolated using a Phenomenex Luna C18(2) column (100 Å, 5 μm, 4.6 mm × 250 mm) (Torrance, CA, USA), with the temperature held at 40 °C.
The volatile compounds were absorbed by a headspace solid-phase microextraction (HS-SPME) fiber from Supelco (Bellefonte, PA, USA), which was coated with 50 μm of divinylbenzene (DVB layer) and 30 μm of carboxene/polydimethylsiloxane (CAR/PDMS layer). To identify and quantify the absorbed compounds, a 7890A gas chromatograph from Agilent Technologies (Santa Clara, CA, USA) was used in conjunction with a 5975C mass selective detector, which was equipped with a non-polar J&W DB-1 capillary column (30 m × 320 μm × 0.25 μm) from Agilent (Folsom, CA, USA). All chromatogram peaks and spectra were evaluated using Agilent Technologies MSD Chemstation software (version E.02.00.493). Compound identification was performed through comparison with the EI mass spectra libraries W8N08 (John Wiley & Sons, Inc., USA) and NIST11 (NIST, Gaithersburg, MD, USA).
Statistical processing was conducted using JMP® Pro 16 software (SAS, Cary, NC, USA), incorporating distribution analysis and response surface methodology (RSM).

2.5. Analyses of J. communis Fruit Extracts

2.5.1. Phytochemical Compounds’ Determination

Detailed descriptions of the approaches used are discussed in our previous work [19]. The widely known Folin–Ciocalteu method was used to determine TPC. The rationale behind this assay lies in the redox reaction between antioxidants from properly diluted extract (100 μL) and the phosphomolybdic/phosphotungstic mixture of Folin–Ciocalteu reagent (100 μL) under slightly basic pH conditions (800 μL of 5% w/v sodium carbonate solution). This reaction took place in a thermostated water bath at 40 °C for 20 min. The absorbance of the produced bluish mixture was recorded at 740 nm, which was selective for polyphenolic compounds. A calibration curve with a methanolic solution of gallic acid (10–100 mg/L) was constructed. The results were calculated as mg gallic acid equivalents (GAE) per g of dry weight.
The polyphenolic profile of juniper berry extract was further examined through High-Performance Liquid Chromatography (HPLC), as the identified compounds were compared to high purity standards by means of retention time and UV spectrum. Each extract was properly diluted to conform with the calibration range of identified polyphenols (the amount of polyphenols was known from the previously mentioned Folin–Ciocalteu method). A precise volume of 20 μL was injected into the apparatus. The mobile phase had a constant flow (1 mL/min) and included solutions of 0.5% formic acid in aqueous solution (A) and 0.5% formic acid in acetonitrile (B). A gradual increase from 5% to 12% B was initiated at 12 min, which was then followed by 55% B at 35 min, 100% B at 1 min for 3 min, and then 5% B at 40 min. The results were calculated as mg/g of each polyphenol per g of dried weight. Details about the quantification of individual polyphenols (i.e., linear equation, coefficient of determination, retention time, λmax, limit of detection, and limit of quantification) are all shown in Table A1. To reinforce the compounds’ identity, chromatograms comparing the standards and sample extract are provided in the Supplementary Materials (Figure S1), highlighting peak alignment and spectral consistency based on λmax.
Finally, ascorbic acid content (AAC) was expressed as mg of AA/100 g dw and was determined through a calibration curve using 10% w/v aqueous trichloroacetic acid (50–500 mg/L of ascorbic acid, R2 = 0.9980). The acidic conditions (900 μL of trichloroacetic acid) help to preserve L-ascorbic acid in the properly diluted sample (100 μL), which reacts with 10-fold-diluted Folin–Ciocalteu reagent (500 μL). The absorbance of the produced greenish mixture was recorded at 760 nm.

2.5.2. In Vitro Antioxidant Capacity

We used two distinct assays to evaluate the antioxidant capabilities of juniper fruit extracts, as previously discussed [19]. Ferric-reducing power (PR) was evaluated by the formation of Fe+2–TPTZ complex (i.e., FRAP method), with the absorbance being recorded at 620 nm. To this end, volumes of juniper extract (50 μL) were mixed with iron (III) chloride solution (50 μL) and TPTZ solution (900 μL), with the latter constituent being added after a 30 min incubation at 37 °C. A calibration curve of a potent antioxidant equivalent such as ascorbic acid from 50 to 500 μM AAE in 0.05 M HCl (R2 = 0.9997) was conducted. The results were calculated as μmol AAE/g dw.
The radical-scavenging activity of juniper extracts using a synthetic chromophore probe (DPPH) was also determined. The neutralization and decolorization of this radical is a result of redox reaction involving DPPH and antioxidant compounds. Methanolic DPPH solution (975 μL, 100 μM) was mixed with juniper extract (25 μL) and kept under absence of light for 30 min. A blank sample, which consisted of methanol instead of juniper extract, was also prepared. The absorbances of each sample (along with the blank sample) were recorded at 515 nm. Equation (2) describes the inhibition of DPPH through initial and final absorbances, whereas Equation (3) describes the antiradical activity of berry extracts involving the concentration of ascorbic acid (CAA), volume (V), and mass (w). Solutions ranging from 100 to 1000 μM of ascorbic acid were also prepared to construct a calibration curve (R2 = 0.9926), and the results were expressed as μmol AAE/g dw.
Inhibition   % = A 515 i   A 515 f A 515 i   ×   100
A AR   μ mol   AAE / g   dw = C AA   ×   V w

2.6. Evaluation of J. communis Berry Oil

2.6.1. Peroxide Value (PV) Assay

The established IDF standard method 74A:1991 [20] was used to calculate peroxide value, as discussed elsewhere [21], with slight modifications. The rationale behind the calculations lies in the formation of a reddish complex (Fe+3–thiocyanate) after reaction with hydroperoxides. Briefly, the oil (20 μL) was mixed with a 3:2 v/v mixture of dichloromethane/ethanol (1960 μL), and the same volume (10 μL) of ammonium thiocyanate and ammonium iron (II) sulfate solution, with the absorbance at 500 nm recorded after a 5 min delay. A calibration curve employed hydrogen peroxide solutions of 50–500 μmol/L in dichloromethane/ethanol, R2 = 0.9950, where the results were calculated as mmol H2O2 per kg of oil.

2.6.2. DPPH-Scavenging Capacity

The DPPH-scavenging capacity method was also evaluated in the oil phase, using an established protocol of Kalantzakis et al. [22] with slight modifications. A quantity of DPPH solution (950 μL, 100 μM in ethyl acetate) was mixed with oil (50 μL). Ethyl acetate was used to provide 10-fold-diluted oil samples. Compounds with severe antioxidant activity found in berry kernel oil could react with the stable DPPH radical and reduce it to decolorized DPPH2. The equations used to evaluate the antioxidant capacity of oils were similar to those in Section 2.5.2. However, a calibration curve (R2 = 0.999) with 50–500 μM of Trolox solution in ethyl acetate was conducted, given the lipophilicity of Trolox compound. Therefore, the results were μM Trolox equivalent antioxidant capacity (TEAC) per kg of oil.

2.6.3. Fatty Acid Quantification

Fatty acids were converted to their corresponding methyl esters (FAMEs) using the technique from Commission Regulation (EC) No 796/2002 (Annex XB) [23], and the quantification was conducted through a GC-FID method that had previously been published by Lalas et al. [24]. The identification was accomplished by comparing the various chromatographic peaks with the FAME Mix C8–C24 reference standards. The composition of the samples expressed in % of total fatty acids was determined from GC peak regions using the normalization method (without correction factors).

2.6.4. Volatile Compound Identification

The volatile compound analysis was conducted through a reformed version of a previously established GC–MS method [25]. HS-SPME was performed by placing 3 g of berry oil into a 25 mL glass vial sealed with a PTFE/silicone septum. The samples were equilibrated (10 min) and extracted (40 min) at 40 °C in a stirred water bath (500 rpm). The SPME fiber, suspended in the vial headspace, was then transferred to the GC injector for analysis. The normalization approach was utilized to determine the sample composition by analyzing the GC peak regions (without correction factors). The amounts of volatile compounds were assessed using the average data from several GC-MS runs and expressed as peak area percentage.

2.7. Statistics

Each batch of extracts was processed in duplicate, and all quantitative assessments were carried out in triplicate. Data normality was evaluated using the Kolmogorov–Smirnov test. Results are expressed as mean values ± standard deviation (SD) based on three independent measurements. To ascertain statistically significant differences among group means, a one-way analysis of variance (ANOVA) was performed, along with Tukey’s HSD post hoc test using a significance-level threshold of p < 0.05.

3. Results and Discussion

3.1. Extraction Parameter Evaluation

To achieve the best possible yield of bioactive chemicals, it is vital to optimize the extraction process of J. communis residues utilizing magnetic stirring extraction. The presence of numerous bioactive chemicals may impede the extraction process by causing alterations in both polarity and solubility. As a result, the extraction yield and antioxidant capacity of the obtained extracts are significantly affected by the extraction conditions. Novel technologies have recently emerged, significantly reducing the use of harmful solvents, while simultaneously requiring minimal energy to operate and safeguarding human health [26]. For this method, we used a solvent that is safe for the environment. Given its non-toxicity to humans, low cost, and remarkable capacity to remove polar molecules, water is an accessible and environmentally friendly solvent. To further enhance the extraction process, organic solvents are also commonly used. An extraction solvent suitable for consumption in the food industry could be made by mixing ethanol with water. We investigated a number of parameters, including solvent composition, extraction temperature, and time, considering every one of these in our account.
Table 2 presents the outcomes of the 15 design points derived from the assessments of bioactive substances and antioxidant activity. The specific extraction conditions significantly influenced the extraction of J. communis residues, as variances in the analyses were observed. Total polyphenols (21.13–57.32 mg GAE/g dw) and total ascorbic acid (1.16–2.65) exhibited a twofold correlation, whereas a threefold relationship was observed in the antioxidant assays calculated as μmol AAE/g dw (116.79–351.29 for FRAP and 134.84–436.2 for DPPH). Samples 9 and 10 showed the lowest contribution to the extraction of bioactive chemicals, as well as to the overall antioxidant capacity. A common point of these samples was the extraction solvent, where solely water was used. This result highlighted the importance of the solvent polarity parameter. On the other hand, samples with a 50% v/v ethanol in water proved to be the richest in bioactive compounds, such as samples 4, 5, 6, 8, 12, 13, and 15. Similar findings were observed in the study from Belov et al. [1] who investigated J. communis berries extracts in different maturation stages and with various solvents and extraction techniques. The authors yielded 56.15 mg GAE/g dw of berries in the first year of maturation using the maceration technique and ethanol as the extraction solvent.
The high correlation of the values between samples is given in Table 3, with the statistical information for the conducted assays’ stepwise ANOVA regression analyses. The equation has been stripped of variables that do not hold any statistical significance (p > 0.05). In addition, the obtained model fits the data; nevertheless, it should be noted that the assays showed a significant R2 value (>0.97).

3.2. Model Analysis

Analyzing data from RSM produced polynomial equations that described the model of each assay in terms of the optimization process. Non-statistically significant variables (p > 0.05) were removed from the equations. Therefore, the obtained Equations (4)–(7) below refer to the four examined assays:
TPC   =   12.37   +   0.89 X 1   +   0.57 X 2     0.04 X 3     0.008 X 1 2     0.003 X 2 2   +   0.0004 X 3 2   +   0.000003 X 1 X 2   +   0.0006 X 1 X 3     0.0015 X 2 X 3
FRAP   =   136.14   +   6.24 X 1   +   0.90 X 2     1.25 X 3     0.059 X 1 2     0.004 X 2 2   +   0.008 X 3 2   +   0.005 X 1 X 2   +   0.001 X 1 X 3   +   0.004 X 2 X 3
DPPH   =   160.61   +   6.86 X 1   +   3.44 X 2     1.12 X 3     0.067 X 1 2     0.033 X 2 2     0.007 X 3 2   +   0.0003 X 1 X 2   +   0.010 X 1 X 3   +   0.018 X 2 X 3
AAC   =   1.41   +   0.033 X 1   +   0.006 X 2     0.003 X 3     0.0003 X 1 2   +   0.000002 X 2 2     0.00004 X 3 2     0.00003 X 1 X 2   +   0.00009 X 1 X 3   +   0.00003 X 2 X 3
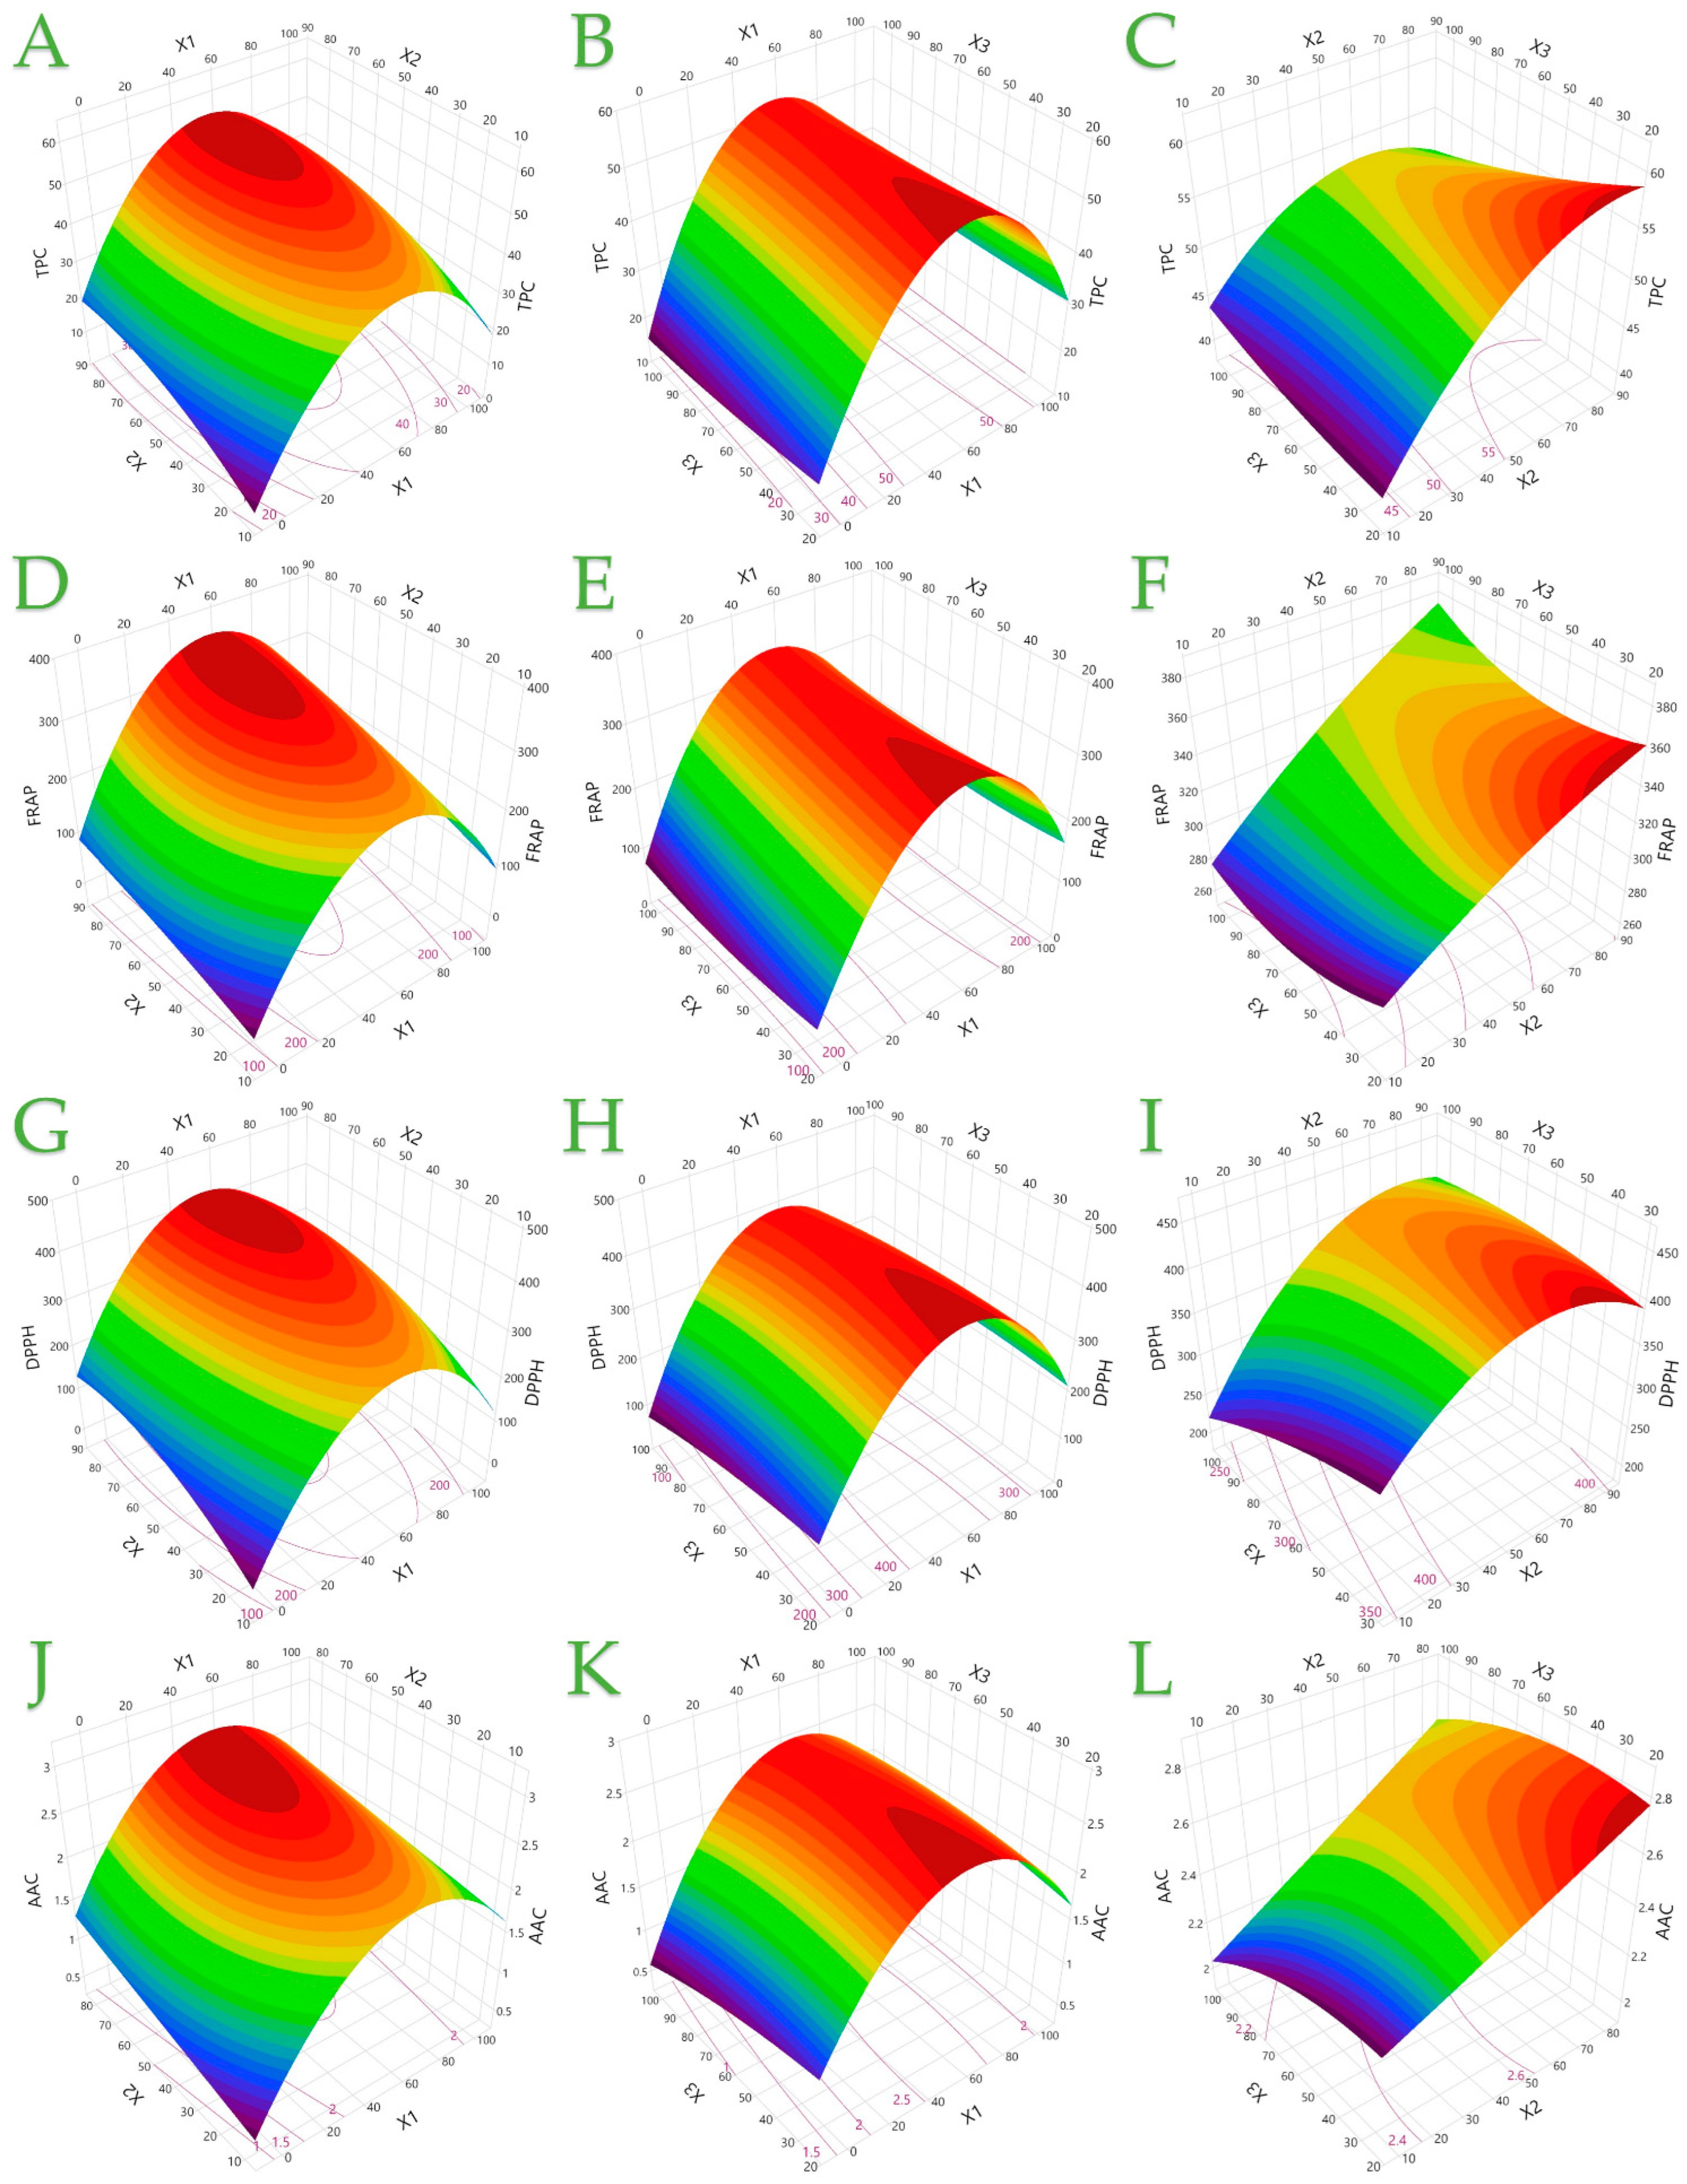
The optimization process of each assay by means of examined parameters is illustrated in Figure 2 as 3D plots. The color depiction of the plot describes the impact of each parameter from blue (low levels) to red (high levels). For instance, it can be deduced that it was preferable for X1 and X2 parameters to be ~60 and ~80, respectively, to yield the maximum possible TPC value (>50 mg GAE/g dw). On the contrary, low values of both parameters (~0 and ~10) could yield significantly lower amounts of TPC (~10 mg GAE/g dw). It would be easy to evaluate the effect of individual parameters in all examined assays using the same rationale. We chose to optimize the magnetic stirring procedure, given the simplicity of this extraction technique, which could be used on a large industrial scale. Other green extraction techniques such as ultrasound-assisted extraction and microwave extraction, or other novel techniques such as pressurized liquid extraction and pulse electric field, could be examined in a future study.
Maximum values of each assay were predicted using the desirability function. High desirability values were observed for >0.90, as per Table 4. Each assay required different extraction conditions to obtain maximum values. However, it was observed that a medium-polarity solvent was required in each case, meaning that it was most suitable for both polar and non-polar bioactive compounds. In addition, the dissolution of these bioactive compounds at an elevated temperature could benefit mass transfer and maximize yields. The extraction duration parameter seemed to have high dispersity for each assay.
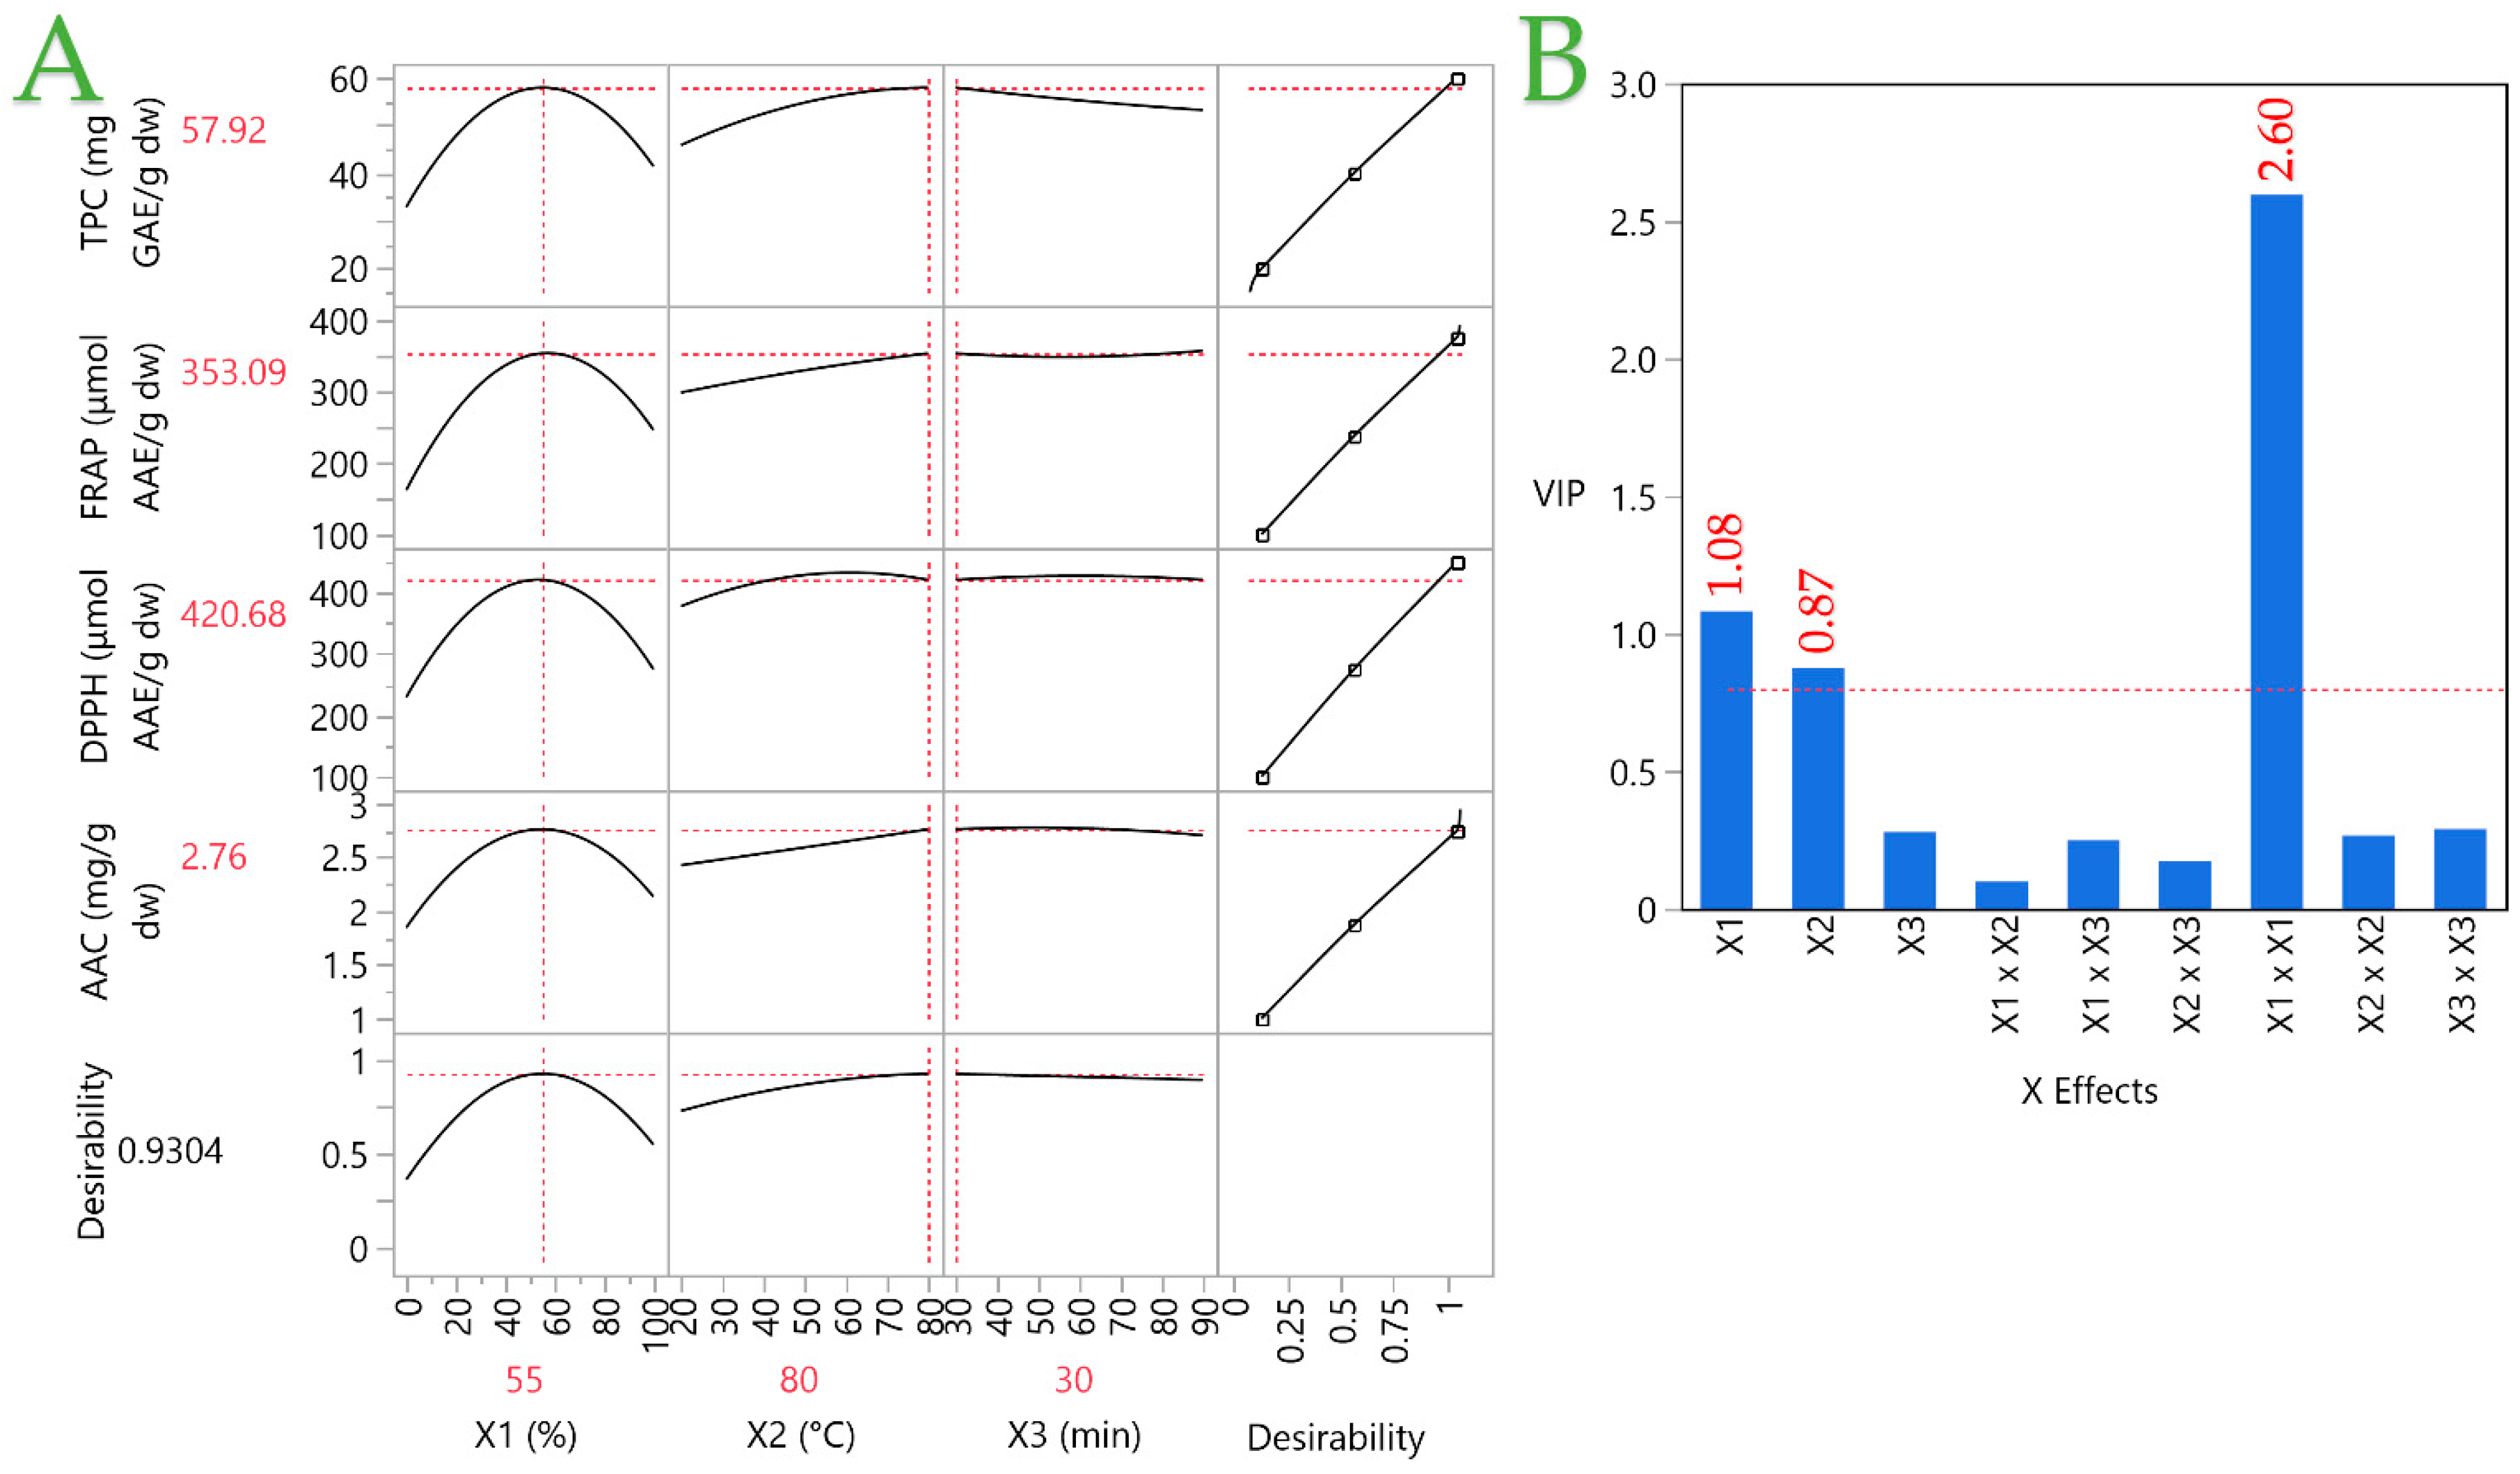
Although our Box–Behnken design spanned 0–100% ethanol, 20–80 °C, and 30–90 min, the desirability profiler predicted an optimum at 55% EtOH, 80 °C and 30 min—technically a slight extrapolation beyond the coded ±1 levels. To verify this, we ran three independent extractions under those exact conditions. The experimentally measured values (Table 6, Section 3.5)—TPC = 55.11 ± 1.54 mg GAE/g dw (predicted 57.92); FRAP = 351.98 ± 20.41 µmol AAE/g dw (predicted 353.09); DPPH = 421.37 ± 31.60 µmol AAE/g dw (predicted 420.68); AAC = 2.57 ± 0.07 mg AA/g dw (predicted 2.76)—all fall within one standard deviation of the model’s predictions. This close agreement confirms that our second-order polynomial remains robust even when mildly extrapolated from the original experimental grid.

3.3. Effect of Individual Extraction Parameters on Each Assay Through Pareto Plot Analysis

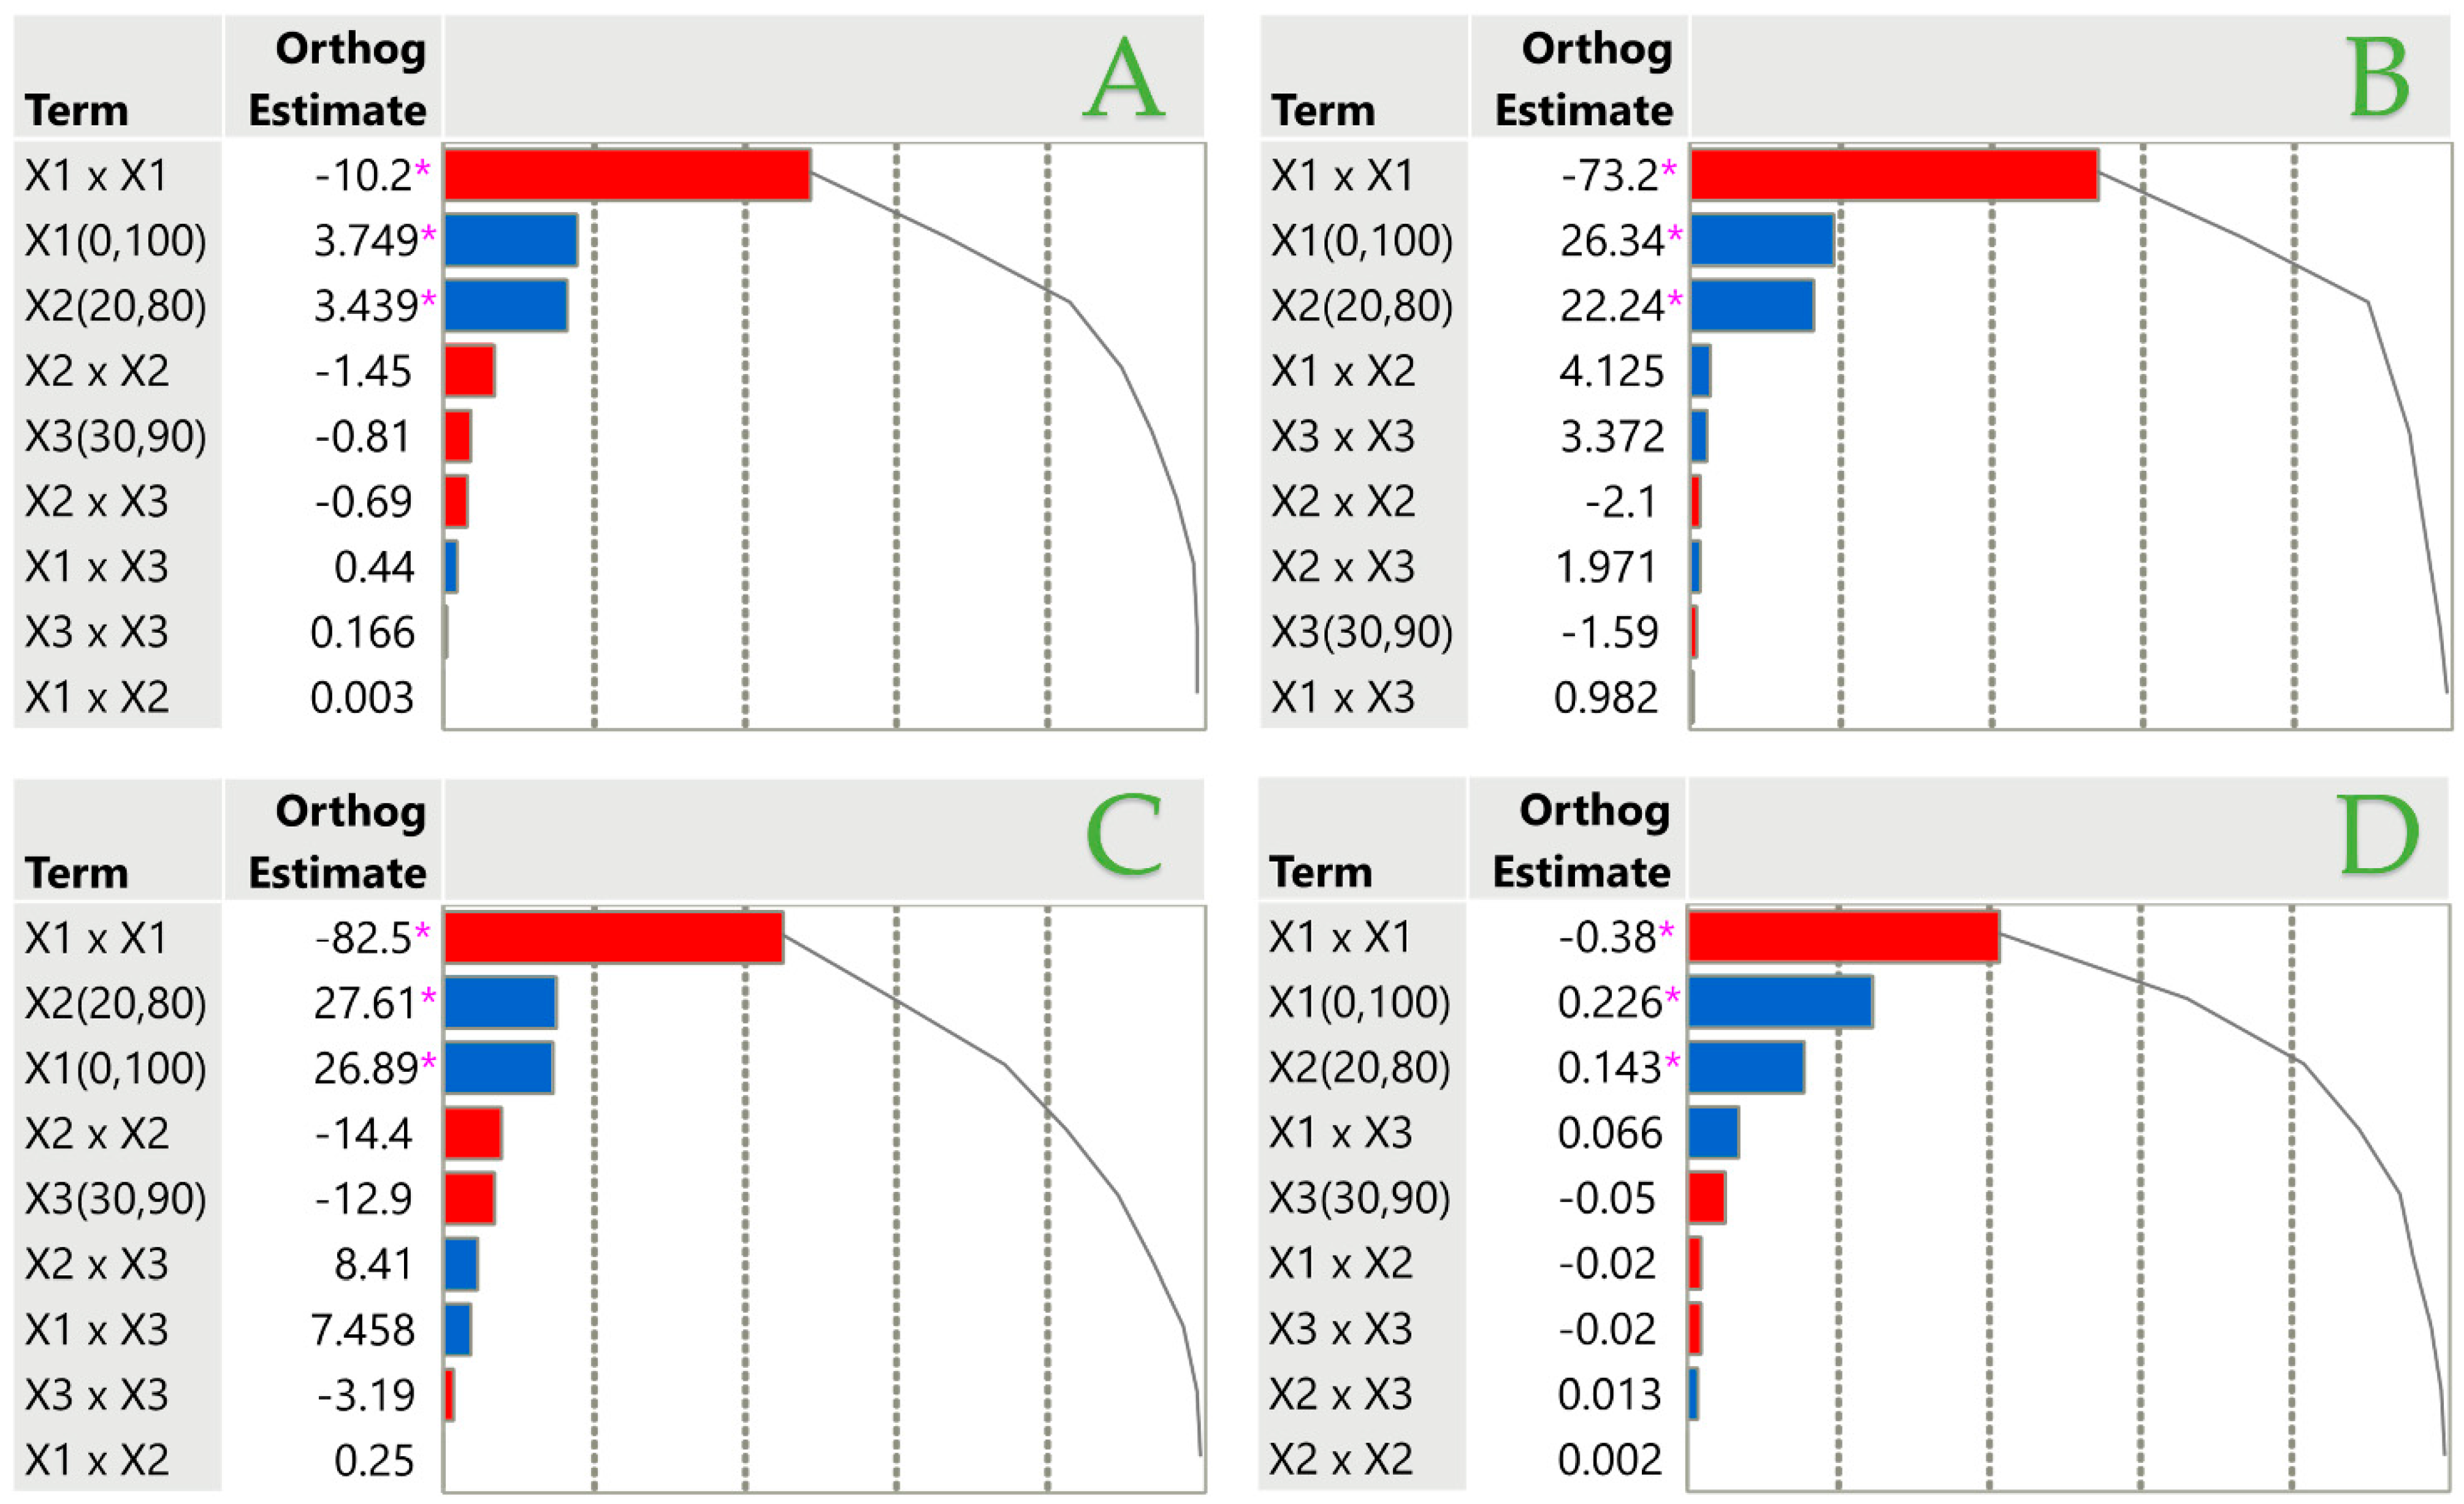
For the sufficient evaluation of the extraction parameters for each assay, a normalized Pareto plot analysis was conducted, using a significance level of p < 0.05, as shown in Figure 3. A blue color specifies positive impact, whereas negative impact is depicted with a red color. It was observed that an ascending X1 value showed a vast adverse effect in all cases (Figure 3). In addition, orthogonality transformation was employed to include orthogonal coded estimates. The t-ratio is a vital parameter for evaluating the magnitude of each extraction parameter, and it was calculated by dividing each parameter by its standard error. The t-ratios are demonstrated by the cumulative line on the plot, offering further understanding of the descriptive power of each estimate. Following this, statistical significance declaration (p < 0.05) was conducted using pink asterisks. For example, parameter X3 had a minor and non-statistically significant impact (p > 0.05) in all assays; thus, asterisks are missing for this parameter.
The results of the Pareto plot indicated that the X1 parameter significantly affected the extraction process but only when this value was raised (i.e., high ethanol content). In addition, according to the X2 parameter, heating up the extraction process significantly affected the success of isolating the desired bioactive chemicals.

3.4. Correlation Analyses

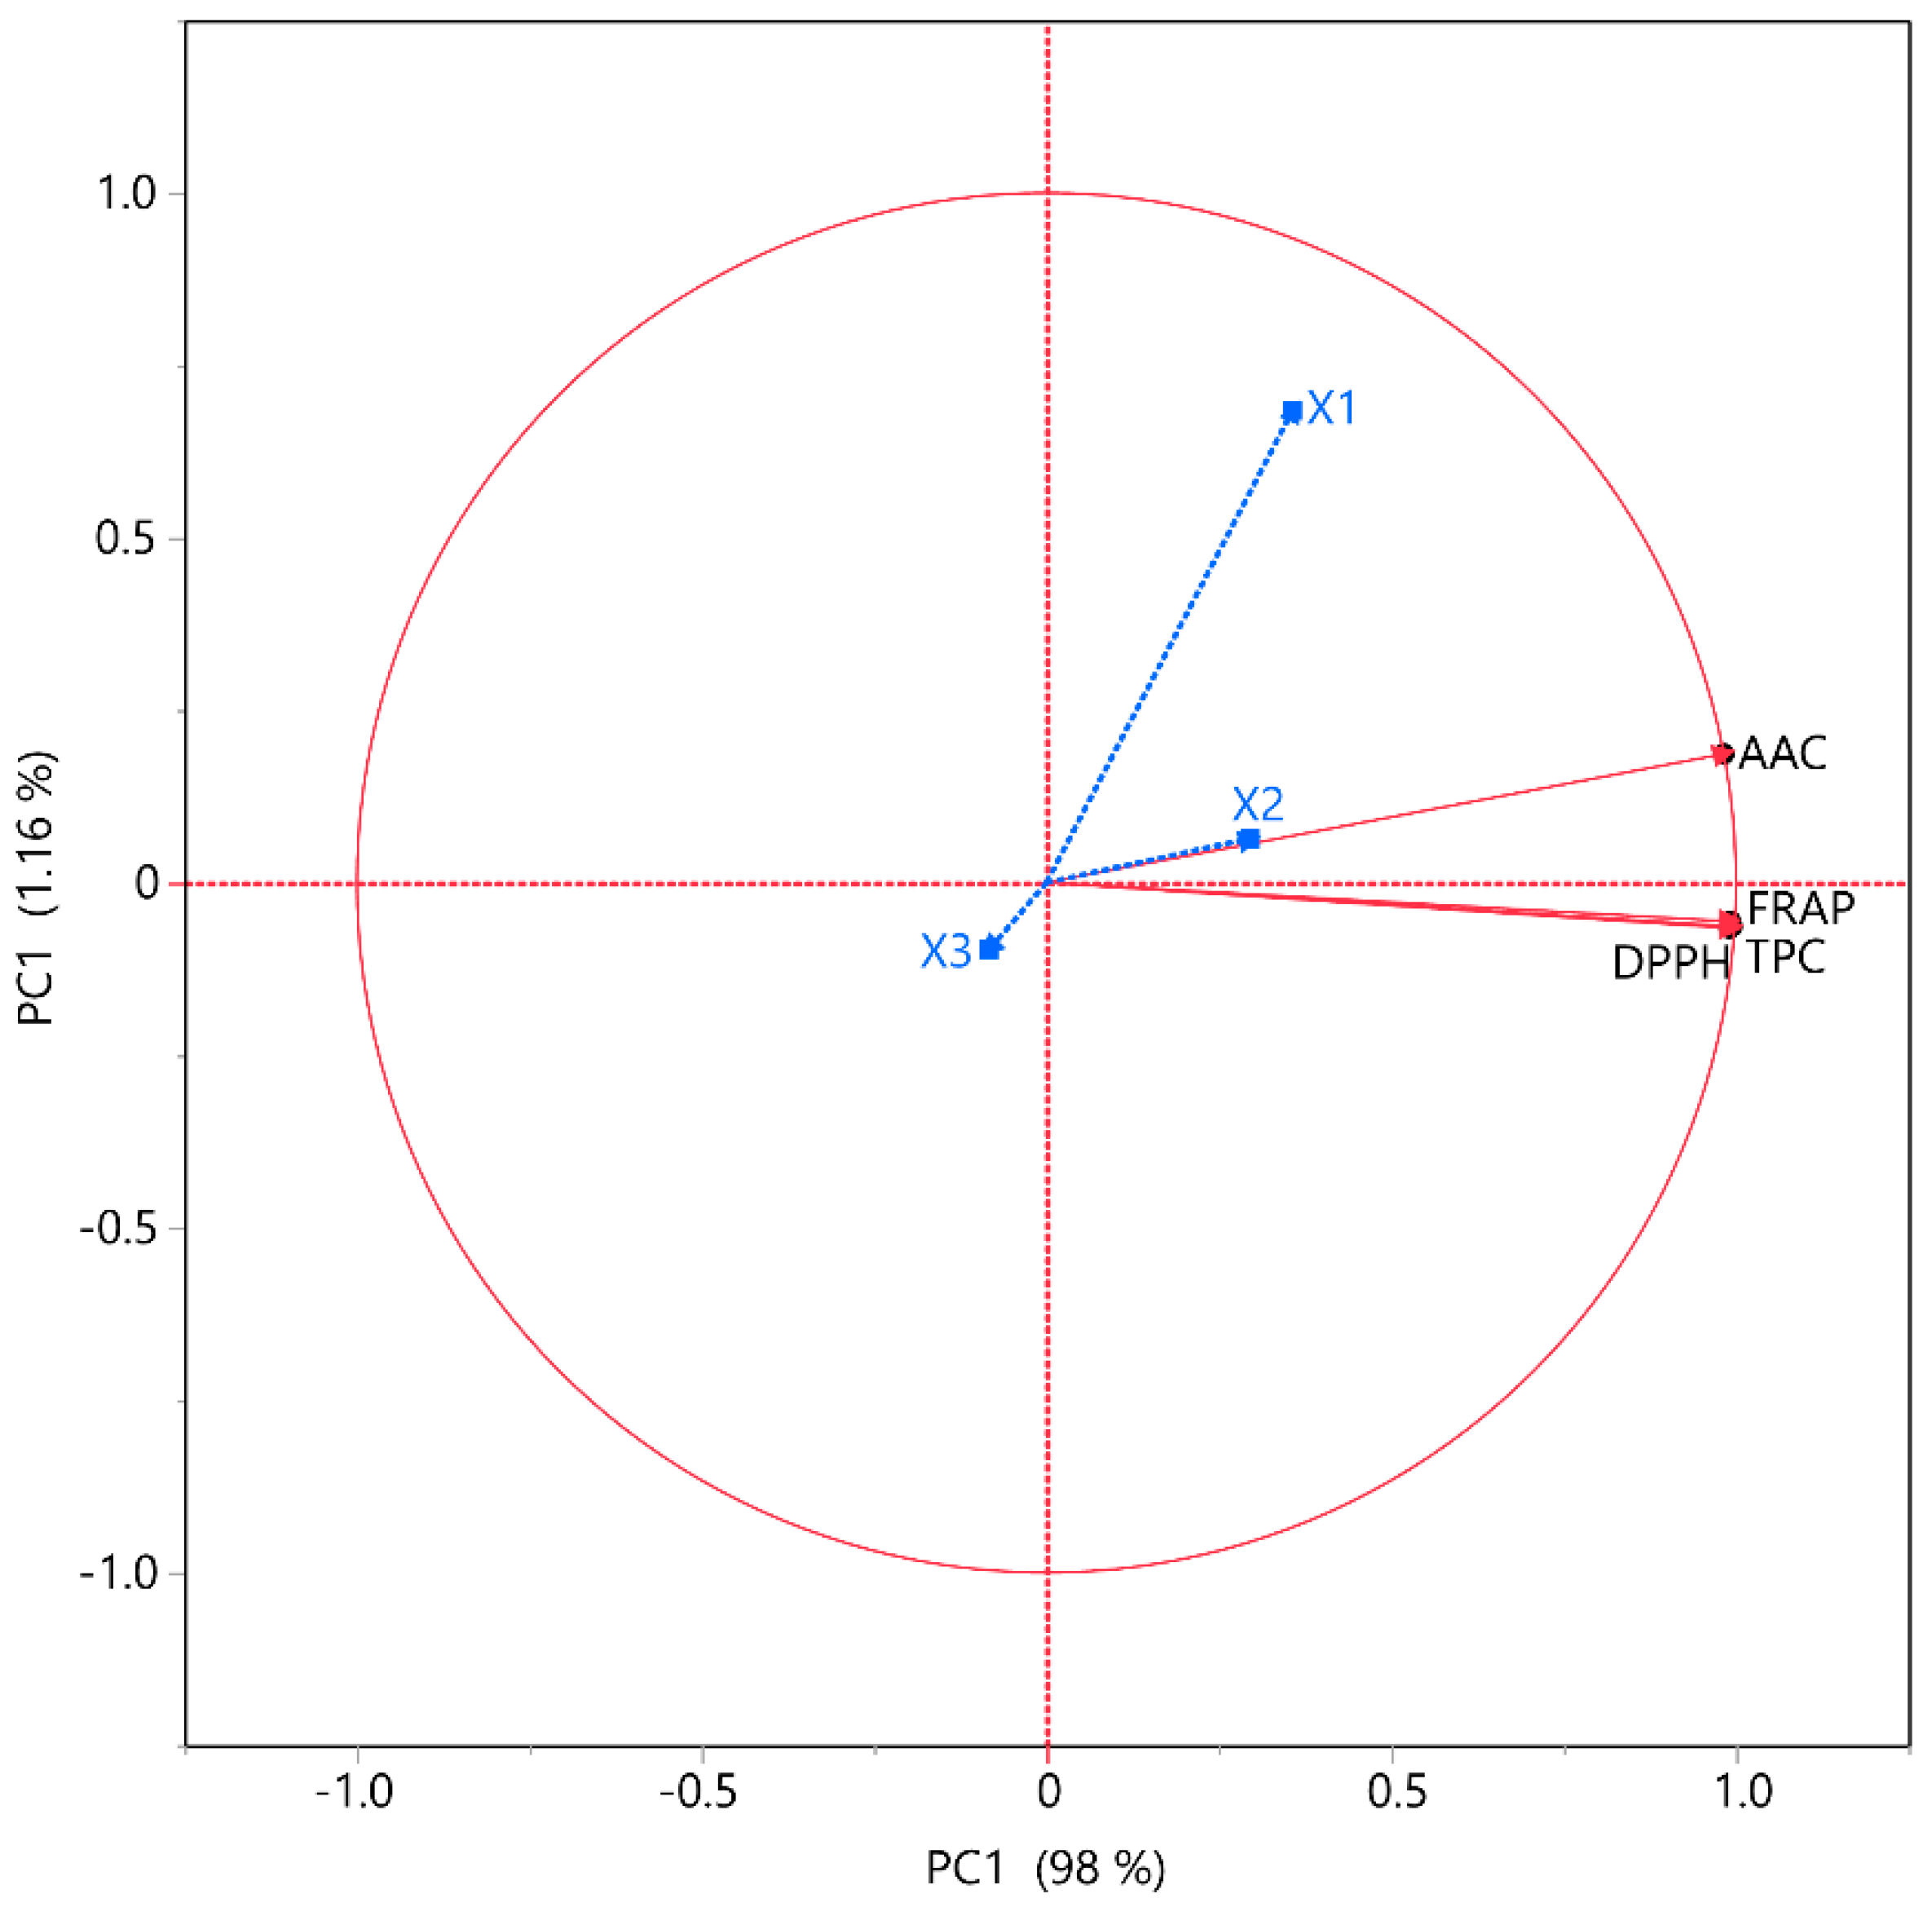
Correlation analyses were performed to evaluate the previous data survey. Figure 4 includes a PCA plot, where the principal component (PC)1 explains 98.0% of the variability, presenting the positive correlation of extraction parameters X1 and X2 with all the examined variables (i.e., TPC, TFC, FRAP, DPPH, and AAC). This finding suggested that the optimization of the extraction process could be enhanced by the adjustment of the selected parameters and is in alignment with the obtained results so far. Furthermore, the close clustering of these variables could be a sign of similar responses. A confirmation of the effectiveness of the selected parameters is provided by the close clustering of these parameters, which suggests that the compounds react similarly to changes in the extraction conditions. A more relevant classification and the optimal extraction conditions can be determined with the help of this method’s thorough data analysis.
Considering the variables in Table 5, it is noteworthy that they have a positive and strong correlation (>0.96), since the maximum correlation level is 1. This finding lends credence to the idea that berry fruits’ polyphenols produce a robust antioxidant action. Ascorbic acid demonstrates a significant radical-scavenging capacity, mitigating all of their harmful health consequences, including cancer risk, and an equally high connection between AAC and the antioxidant activity of the DPPH technique [27] was also observed. Interestingly, the two antioxidant approaches showed a good correlation coefficient (above 0.97), suggesting that antioxidants likely possess the same strong potential to reduce iron (III) and scavenge free radicals.

3.5. Partial Least Squares (PLS) Analysis

The effect of the extraction condition parameters (X1, X2, and X3) was further estimated using the PLS model. An example of a correlation loading plot is displayed in Figure 5. Temperature, solvent composition, and extraction period are the three most important variables that significantly impact bioactive chemicals’ extraction [28]. To start with, different polyphenols have a different solubility and polarity, which might make extraction more difficult [29]. According to the Variance Importance Plot (VIP) in Figure 5Β, the X1 parameter had the greatest significant impact (p < 0.05) among all the examined parameters. Confirming earlier findings from the 3D models of the response surface, the ideal solvent should have a medium polarity, and to be more precise, the concentration was found to be 55% v/v at 80 °C, as shown in the same Figure 5A). Extraction duration was revealed to have barely any impact on the extraction optimization, so we opted to select the minimum possible duration (i.e., 30 min).
Both obtained results and PLS-modeled predictions showed significant agreement, as verified in Table 6 by a high correlation coefficient of 0.996 and a substantial coefficient of determination (R2) of 0.993. A significance level of p < 0.0001 indicates that the deviations between the actual and predicted values are statistically insignificant.
Table 6. The Partial Least Squares (PLS) prediction profiler identified the maximum desirability for all variables regarding juniper berry extracts under each optimal condition for the STE technique. The research contrasted the STE conditions (X1: 55% v/v, X2: 80 °C, X3: 30 min).
ParametersPartial Least Squares (PLS) RegressionSTE Experimental Values
TPC (mg GAE/g dw)57.9255.11 ± 1.54
FRAP (μmol AAE/g dw)353.09351.98 ± 20.41
DPPH (μmol AAE/g dw)420.68421.37 ± 31.6
AAC (mg AA/g dw)2.762.57 ± 0.07
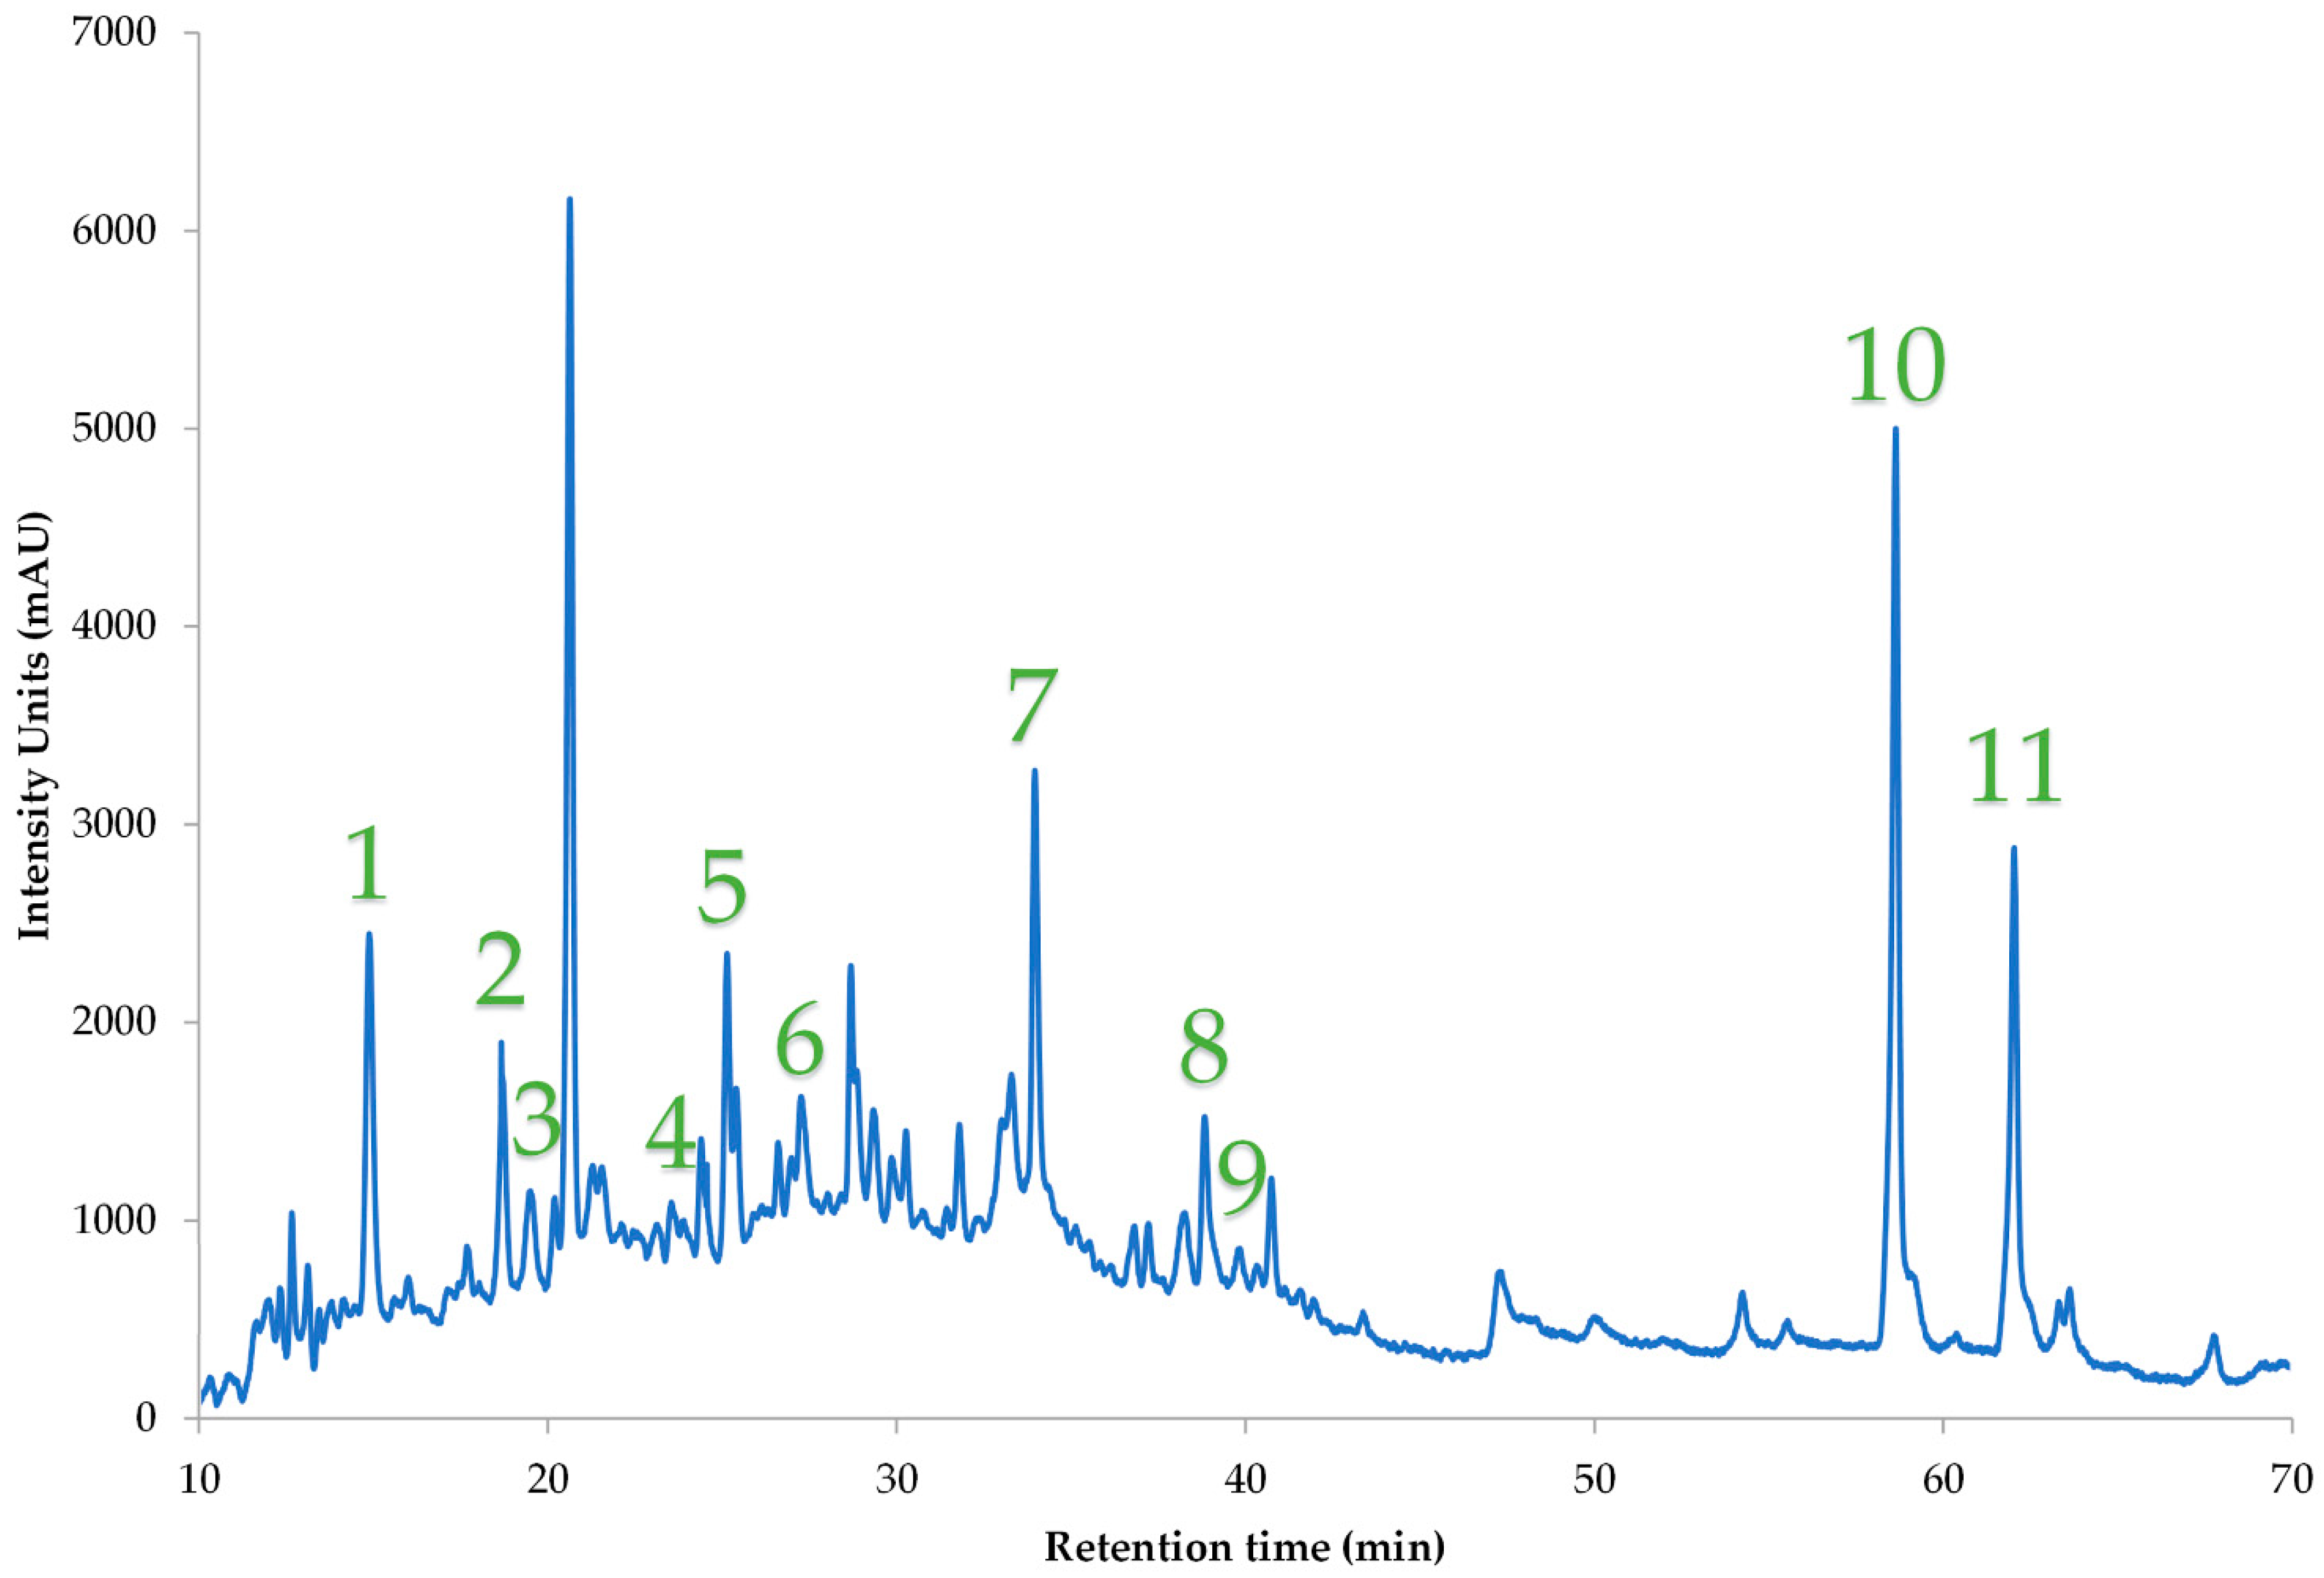
We quantified 11 individual polyphenols in juniper berry fruits, and they are listed in Table 7 by means of ascending retention time. Figure 6 represents a chromatogram including all identified compounds. Pelargonin chloride (2.33 mg/g dw) and catechin (1.14 mg/g dw) were the most abundant quantified polyphenols with a total of 5.41 mg/g dw. It could be considered a limitation in our work that other polyphenols could not be identified; however, future studies involving mass spectrometry or other identification techniques could resolve this issue. We quantified several common polyphenols, as in the study of Mërtiri et al. [13] who investigated berries and leaves from J. communis and J. oxycedrus. In the case of J. communis berries, the authors used ethanolic solution and ultrasound-assisted extraction to determine 3.04 mg GAE/g dw of TPC and a total of 0.138 mg/g extract, with catechin (0.09 mg/g) being the most abundant. Apigenin, syringic acid, kaempferol, and rutin were some common identified polyphenols in the study by Dziedzinski et al. [30]. The researchers investigated berries from several coniferous plants, including J. communis, and quantified polyphenolic compounds at 10.9 mg/g. The vast difference in the total quantified polyphenols in both studies could be a matter of different species.

3.6. Berry Oil Analyses

After drying the fruits of Juniperus communis L., juniper berry powder was extracted to obtain the oil. The process resulted in the separation of the oil from the plant material, leaving behind a solid residue (devoid of oil), which was then dried in vacuo to remove any remaining solvent. The oil obtained underwent analyses to determine its volatile compounds, fatty acid profile, peroxide value, and DPPH antioxidant activity.

3.6.1. Volatile Compounds

The Juniperus communis L. oil extract contains a substantial number of volatile compounds, with 58 different compounds contributing to its rich and complex chemical profile, as shown in Table 8. The profile is predominantly composed of sesquiterpenoids (71.5%), with sesquiterpenes alone making up 64.3%, indicating a strong presence of sesquiterpene hydrocarbons. Oxygenated sesquiterpenoids contribute only 1.0%, suggesting minimal oxidation in this class. Monoterpenoids (26.3%) serve as the second most significant group, with monoterpenes (25.9%) demonstrating a prevalence of monoterpene hydrocarbons, while oxygenated monoterpenoids remain minor at 0.3%. The remaining compounds—terpenoid esters (1.2%), terpenoid alcohols (0.5%), terpenoid aldehydes (0.2%), alkylbenzenes (0.2%), and ketones (0.1%)—represent minor constituents, confirming that the extract is largely composed of hydrocarbon-based terpenoids rather than oxygenated derivatives or aromatic compounds. This composition suggests a highly volatile and hydrophobic mixture, characteristic of plant-derived extracts rather than essential oils. The sesquiterpenoid-rich nature of this sample strongly influences its aroma, chemical properties, and potential applications in fragrance, pharmacology, and food sciences. However, the strong scent of this oil might be a deterrent factor if used in the food sector, since it might overlap the corresponding aromatic compounds of each food.
Isocaryophyllene was the most abundant volatile compound (24.5%). Germacrene D (17.43%), humulene (15.93%), myrcene (11.91%), and α-pinene (9.32%) were also found in high proportions. Our results are similar to the study of Dimitrov et al. [31], who identified 58 volatile compounds in both juniper berry kernel and needle essential oils. Germacrene-D, limonene, myrcene, α-pinene, sabinene, and terpinen-4-ol are some of the common volatile compounds that were identified through mass spectrometry detector. Several monoterpenes and sesquiterpenes were identified as major substances in juniper berries from Slovakia in the study by Salamon et al. [14]. Fejér et al. [15] claimed that topographic–environmental parameters, such as air, temperature, and precipitation levels, as well as soil composition, had a substantial effect on the quality and quantity of juniper berry essential oil. All the mentioned authors employed a hydrodistillation process to isolate the essential oil of juniper berries. In another study from Orav et al. [32], the employed technique to isolate volatile compounds from Estonian juniper berries was through supercritical carbon dioxide extraction (SFE) in comparison with simultaneous distillation and extraction (SDE). The results showed that several compounds were found in higher proportion in the SDE technique (such as α-pinene at 47.9% compared to 3.1%), whereas the SFE technique yielded higher amounts of germacrene D (19.0% compared to 3.7%) and β-caryophyllene (8.1 versus 1.3%). However, the total % proportion of identified compounds and % oil yield was found to be 95.4 and 2.1%, respectively, for the SDE method. The corresponding amounts in SFE were found to be 78.0 and 0.9%.

3.6.2. Fatty Acids’ Determination

Fatty acids are biologically active chemicals with plenty of beneficial impacts on health. Thus, the nutritional quality and stability of an edible oil are greatly affected by factors such as fatty acid concentration [33]. For example, research has shown that heart disease can be averted by consuming polyunsaturated and monounsaturated fatty acids [34]. The fatty acid composition of juniper berry kernel oil was studied, and the results are shown in Table 9. The fatty acid composition of Juniperus communis L. oil extract reveals a profile rich in unsaturated fatty acids (UFAs, 91.65%), with oleic acid (C18:1 ω-9) as the dominant component (58.75%), reinforcing its similarity to other plant-based lipid extracts with potential nutritional and medicinal benefits. The presence of linoleic acid (C18:2 ω-6, 23.42%) and α-linolenic acid (C18:3 ω-3, 8.92%) highlights a significant proportion of polyunsaturated fatty acids (PUFAs, 32.34%), contributing to the oil’s oxidative stability and bioactivity, while palmitic acid (C16:0, 6.22%) and stearic acid (C18:0, 2.13%) form the saturated fatty acid (SFA) fraction. Importantly, lowering low-density lipoprotein and improving brain function are both outcomes of a diet rich in MUFA and PUFA [35]. The high composition of total MUFA at 59.31% and PUFA at 32.34% indicates that this vegetable oil is nourishing.
In addition, the ω-3:6 ratio should be recognized as a crucial factor, with the optimal ratio for human health falling between 1:1 and 1:5. Our research indicates that this value is 0.38. The COX values were also determined, because an improvement in oil’s oxidative stability and, by extension, its shelf life are both correlated with a lower COX value [36]. Since juniper berry kernel oil has a low COX value (4.93) which is typical for plant-derived oils, the results suggest that it may have a long shelf life. However, proper storage conditions to maintain oil quality is needed.
We also used IA and IT, two of the most widely used and respected indices for lipids and oils, to assess the possible effect of fatty acids on cardiovascular disease. IT shows a propensity for cardiovascular disease and atherosclerotic plaque, whereas the ΙA is an early indicator of accelerated atherosclerosis and contributes to our knowledge of the inflammatory processes associated with it [37]. For optimal nutritional value, these values should be kept to a minimum in the oil. To illustrate the point, a high SFA content oil (palm oil) had an IA of 0.94 and IT of 1.80, whereas a high UFA content oil (rapeseed oil) had an IA of 0.05 and IT of 0.10 [38]. The health indices, including low atherogenicity (IA, 0.07) and thrombogenicity (IT, 0.12), indicate minimal cardiovascular risk, while high hypocholesterolemic/hypercholesterolemic (HH, 14.65) and health-promoting index (HPI, 14.74) values support its potential cholesterol-lowering and heart-protective properties. Finally, statistically non-significant differences (p > 0.05) were observed between the health-promoting index and the hypocholesterolemic/hypercholesterolemic ratio values, since they have similar mathematical formulas. There is currently no set HPI threshold; nonetheless, a higher HPI shows significant health benefits for humans. Cheese, butter, milk, and yogurt are all examples of dairy products, and their HPI values were previously recorded as ranging from 0.16 to 0.68 [39]. Overall, this profile suggests that Juniperus communis L. oil extract has significant bioactive potential, making it promising for nutritional, medicinal, and cosmetic applications.

3.6.3. Oxidative Stability and Antioxidant Capacity of Berries’ Kernel Oil

The peroxide value of 12.31 ± 0.34 mmol H2O2/kg oil reflects the extent of lipid oxidation in juniper berry oil. While oxidative degradation is a natural process, a higher peroxide value suggests potential freshness concerns and a reduced shelf life. This value is within the typical range for natural oils, but comparison with established standards is essential to evaluate the oil’s oxidative stability. Proper storage—such as limiting exposure to light, heat, and oxygen—can slow further oxidation and preserve its quality.
The DPPH antioxidant activity of 399.83 ± 34.18 µmol TEAC/kg oil highlights the oil’s capacity to scavenge free radicals, a crucial factor in preventing oxidative stress-related damage. This relatively strong antioxidant capacity suggests the presence of bioactive compounds, particularly terpenes and terpenoids, which contribute to the oil’s medicinal potential. Among these, α-pinene, β-pinene, sabinene, and limonene are widely acknowledged for their antimicrobial, anti-inflammatory, and antioxidant effects. Additionally, the high oleic acid (C18:1 ω-9) content (58.75%) further reinforces its similarity to other plant-based lipid extracts—such as olive oil—which are recognized for their cardiovascular and anti-inflammatory benefits. Overall, these results showcase a balance between oxidative stability and antioxidant protection, emphasizing the therapeutic and nutritional value of juniper berry oil.

4. Conclusions

We have demonstrated a comprehensive valorization of Greek-harvested juniper berries and kernels. Optimized extracts showed a high polyphenol and ascorbic acid content correlated with strong antioxidant activities, while kernel oil exhibited a terpene-rich volatile profile and a favorable fatty acid composition (notably 58.75% oleic acid). These natural products hold promise as sustainable antioxidants and flavoring agents in food and pharmaceutical applications. Future work will involve in vitro and in vivo toxicity assays and formulation studies to support their safe use in functional foods and nutraceuticals.

Supplementary Materials

The following supporting information can be downloaded at: https://www.mdpi.com/article/10.3390/separations12080209/s1, Figure S1: UV spectral profiles of polyphenolic standards identified via HPLC-DAD. Plots illustrate the absorbance spectra of authentic standards and the corresponding extract sample. (A) 3-Hydroxytyrosol, (B) pelargonin chloride, (C) catechin, (D) homovanillic acid, (E) epicatechin, (F) syringic acid, (G) rutin, (H) kaempferol-3-glucoside, (I) apigenin-7-O-glucoside, (J) apigenin, (K) kaempferol.

Author Contributions

Conceptualization, V.A., A.I.S. and S.I.L.; methodology, V.A.; software, V.A.; validation, V.A.; formal analysis, V.A., D.K., and T.T.; investigation, T.T., D.K. and E.B. and V.A.; resources, A.I.S. and S.I.L.; data curation, V.A.; writing—original draft preparation, D.K. and V.A.; writing—review and editing, V.A., D.K., E.B., T.T., A.I.S. and S.I.L.; visualization, V.A.; supervision, A.I.S. and S.I.L.; project administration, A.I.S. and S.I.L.; funding acquisition, S.I.L. All authors have read and agreed to the published version of the manuscript.

Funding

This research received no external funding.

Data Availability Statement

The original contributions presented in this study are included in the article. Further inquiries can be directed to the corresponding author.

Conflicts of Interest

The authors declare no conflicts of interest.

Appendix A

Table A1. Equation of calibration curves for each compound identified through HPLC-DAD.
Polyphenolic Compounds (Standards)Equation (Linear)R2Retention Time (min)λmax
(nm)
LOD
(mg/L)
LOQ
(mg/L)
3-Hydroxytyrosoly = 183,448.37x − 251,422.040.99714.5522782.878.69
Pelargonin chloridey = 1610.01x − 2626.920.99718.9002752.848.61
Catechiny = 11,920.79x − 128.190.99720.9332782.547.71
Homovanillic acidy = 18,843.08x + 6856.980.99924.4582791.183.59
Epicatechiny = 142,099.00x + 4705.940.99925.8212780.190.58
Syringic acidy = 24,093.04x + 6513.280.99925.9003603.179.59
Rutiny = 46,365.62x − 31,562.740.99733.7772542.658.03
Kaempferol-3-glucosidey = 50,916.85x − 423,9880.99638.7242653.009.08
Apigenin-7-O-glucosidey = 64,742.65x + 15,897.940.99839.8543362.226.72
Apigeniny = 95,483.53x − 5214.260.99855.8602271.033.13
Kaempferoly = 93,385.02x − 18,613.030.99956.8832651.344.05

References

  1. Belov, T.; Terenzhev, D.; Bushmeleva, K.N.; Davydova, L.; Burkin, K.; Fitsev, I.; Gatiyatullina, A.; Egorova, A.; Nikitin, E. Comparative Analysis of Chemical Profile and Biological Activity of Juniperus communis L. Berry Extracts. Plants 2023, 12, 3401. [Google Scholar] [CrossRef]
  2. Gonçalves, A.C.; Flores-Félix, J.D.; Coutinho, P.; Alves, G.; Silva, L.R. Zimbro (Juniperus communis L.) as a Promising Source of Bioactive Compounds and Biomedical Activities: A Review on Recent Trends. Int. J. Mol. Sci. 2022, 23, 3197. [Google Scholar] [CrossRef]
  3. Raina, R.; Verma, P.K.; Peshin, R.; Kour, H. Potential of Juniperus Communis L. as a Nutraceutical in Human and Veterinary Medicine. Heliyon 2019, 5, e02376. [Google Scholar] [CrossRef]
  4. Bais, S.; Gill, N.S.; Kumar, N. Neuroprotective Effect of Juniperus Communis on Chlorpromazine Induced Parkinson Disease in Animal Model. Chin. J. Biol. 2015, 2015, 542542. [Google Scholar] [CrossRef]
  5. Bolouri, P.; Salami, R.; Kouhi, S.; Kordi, M.; Asgari Lajayer, B.; Hadian, J.; Astatkie, T. Applications of Essential Oils and Plant Extracts in Different Industries. Molecules 2022, 27, 8999. [Google Scholar] [CrossRef]
  6. Dursun Capar, T.; Dedebas, T.; Yalcin, H.; Ekici, L. Extraction Method Affects Seed Oil Yield, Composition, and Antioxidant Properties of European Cranberrybush (Viburnum opulus). Ind. Crops Prod. 2021, 168, 113632. [Google Scholar] [CrossRef]
  7. Tura, M.; Ansorena, D.; Astiasarán, I.; Mandrioli, M.; Toschi, T.G. Evaluation of Hemp Seed Oils Stability under Accelerated Storage Test. Antioxidants 2022, 11, 490. [Google Scholar] [CrossRef]
  8. Zheljazkov, V.D.; Cantrell, C.L.; Semerdjieva, I.; Radoukova, T.; Stoyanova, A.; Maneva, V.; Kačániová, M.; Astatkie, T.; Borisova, D.; Dincheva, I.; et al. Essential Oil Composition and Bioactivity of Two Juniper Species from Bulgaria and Slovakia. Molecules 2021, 26, 3659. [Google Scholar] [CrossRef]
  9. Jeliazkov (Zheljazkov), V.; Kacaniova, M.; Dincheva, I.; Radoukova, T.; Semerdjieva, I.; Astatkie, T.; Schlegel, V. Essential Oil Composition, Antioxidant and Antimicrobial Activity of the Galbuli of Six Juniper Species. Ind. Crops Prod. 2018, 124, 449–458. [Google Scholar] [CrossRef]
  10. Rawat, P.; Dasila, K.; Singh, M.; Kuniyal, J.C. Influence of Environmental Factors on Phytochemical Compositions and Antioxidant Activity of Juniperus communis L. Discov. Environ. 2025, 3, 11. [Google Scholar] [CrossRef]
  11. Meringolo, L.; Bonesi, M.; Sicari, V.; Rovito, S.; Passalacqua, N.G.; Loizzo, M.R.; Tundis, R. Essential Oils and Extracts of Juniperus Macrocarpa Sm. and Juniperus oxycedrus L.: Comparative Phytochemical Composition and Anti-Proliferative and Antioxidant Activities. Plants 2022, 11, 1025. [Google Scholar] [CrossRef] [PubMed]
  12. Tomović, V.; Šojić, B.; Savanović, J.; Kocić-Tanackov, S.; Pavlić, B.; Jokanović, M.; Đorđević, V.; Parunović, N.; Martinović, A.; Vujadinović, D. New Formulation towards Healthier Meat Products: Juniperus communis L. Essential Oil as Alternative for Sodium Nitrite in Dry Fermented Sausages. Foods 2020, 9, 1066. [Google Scholar] [CrossRef]
  13. Mërtiri, I.; Păcularu-Burada, B.; Stănciuc, N. Phytochemical Characterization and Antibacterial Activity of Albanian Juniperus Communis and Juniperus oxycedrus Berries and Needle Leaves Extracts. Antioxidants 2024, 13, 345. [Google Scholar] [CrossRef]
  14. Salamon, I.; Otepka, P.; Kryvtsova, M.; Kolesnyk, O.; Hrytsyna, M. Selected Biotopes of Juniperus Communis L. in Slovakia and Their Chemotype Determination. Horticulturae 2023, 9, 686. [Google Scholar] [CrossRef]
  15. Fejér, J.; Gruľová, D.; Eliašová, A.; Kron, I.; De Feo, V. Influence of Environmental Factors on Content and Composition of Essential Oil from Common Juniper Ripe Berry Cones (Juniperus communis L.). Plant Biosyst.-Int. J. Deal. Asp. Plant Biol. 2018, 152, 1227–1235. [Google Scholar] [CrossRef]
  16. Lee, J.-E.; Jayakody, J.T.M.; Kim, J.-I.; Jeong, J.-W.; Choi, K.-M.; Kim, T.-S.; Seo, C.; Azimi, I.; Hyun, J.; Ryu, B. The Influence of Solvent Choice on the Extraction of Bioactive Compounds from Asteraceae: A Comparative Review. Foods 2024, 13, 3151. [Google Scholar] [CrossRef] [PubMed]
  17. Lapornik, B.; Prošek, M.; Golc Wondra, A. Comparison of Extracts Prepared from Plant By-Products Using Different Solvents and Extraction Time. J. Food Eng. 2005, 71, 214–222. [Google Scholar] [CrossRef]
  18. Antony, A.; Farid, M. Effect of Temperatures on Polyphenols during Extraction. Appl. Sci. 2022, 12, 2107. [Google Scholar] [CrossRef]
  19. Kalompatsios, D.; Athanasiadis, V.; Mantiniotou, M.; Lalas, S.I. Optimization of Ultrasonication Probe-Assisted Extraction Parameters for Bioactive Compounds from Opuntia macrorhiza Using Taguchi Design and Assessment of Antioxidant Properties. Appl. Sci. 2024, 14, 10460. [Google Scholar] [CrossRef]
  20. International Dairy Federation. International IDF Standards 74A:1991: Anhydrous Milkfat—Determination of Peroxide Value; IDF: Brussels, Belgium, 1991. [Google Scholar]
  21. Kalompatsios, D.; Athanasiadis, V.; Chatzimitakos, T.; Palaiogiannis, D.; Lalas, S.I.; Makris, D.P. Sustainable Exploitation of Waste Orange Peels: Enrichment of Commercial Seed Oils and the Effect on Their Oxidative Stability. Waste 2023, 1, 761–774. [Google Scholar] [CrossRef]
  22. Kalantzakis, G.; Blekas, G.; Pegklidou, K.; Boskou, D. Stability and Radical-scavenging Activity of Heated Olive Oil and Other Vegetable Oils. Eur. J. Lipid Sci. Technol. 2006, 108, 329–335. [Google Scholar] [CrossRef]
  23. European Commission. Commission Regulation (EC) No 796/2002 of 6 May 2002 Amending Regulation (EEC) No 2568/91 on the Characteristics of Olive Oil and Olive-Pomace Oil and on the Relevant Methods of Analysis and the Additional Notes in the Annex to Council Regulation (EEC) No 2658/87 on the Tariff and Statistical Nomenclature and on the Common Customs Tariff. Off. J. Eur. Communities 2002, L128, 14–18. [Google Scholar]
  24. Lalas, S.; Gortzi, O.; Athanasiadis, V.; Dourtoglou, E.; Dourtoglou, V. Full Characterisation of Crambe Abyssinica Hochst. Seed Oil. J. Am. Oil Chem. Soc. 2012, 89, 2253–2258. [Google Scholar] [CrossRef]
  25. Toulaki, A.K.; Athanasiadis, V.; Chatzimitakos, T.; Kalompatsios, D.; Bozinou, E.; Roufas, K.; Mantanis, G.I.; Dourtoglou, V.G.; Lalas, S.I. Investigation of Xinomavro Red Wine Aging with Various Wood Chips Using Pulsed Electric Field. Beverages 2024, 10, 13. [Google Scholar] [CrossRef]
  26. Gil-Martín, E.; Forbes-Hernández, T.; Romero, A.; Cianciosi, D.; Giampieri, F.; Battino, M. Influence of the Extraction Method on the Recovery of Bioactive Phenolic Compounds from Food Industry By-Products. Food Chem. 2022, 378, 131918. [Google Scholar] [CrossRef]
  27. Lo Scalzo, R. Organic Acids Influence on DPPH Scavenging by Ascorbic Acid. Food Chem. 2008, 107, 40–43. [Google Scholar] [CrossRef]
  28. More, P.R.; Jambrak, A.R.; Arya, S.S. Green, Environment-Friendly and Sustainable Techniques for Extraction of Food Bioactive Compounds and Waste Valorization. Trends Food Sci. Technol. 2022, 128, 296–315. [Google Scholar] [CrossRef]
  29. Thoo, Y.; Ng, S.Y.; Khoo, M.; Mustapha, W.; Ho, C. A Binary Solvent Extraction System for Phenolic Antioxidants and Its Application to the Estimation of Antioxidant Capacity in Andrographis paniculata Extracts. Int. Food Res. J. 2013, 20, 1103–1111. [Google Scholar]
  30. Dziedzinski, M.; Kobus-Cisowska, J.; Szymanowska, D.; Stuper-Szablewska, K.; Baranowska, M. Identification of Polyphenols from Coniferous Shoots as Natural Antioxidants and Antimicrobial Compounds. Molecules 2020, 25, 3527. [Google Scholar] [CrossRef]
  31. Dimitrov, F.; Panghyová, L.; Vargová, V.; Baxa, S.; Polovka, M.; Kopuncová, M.; Tobolková, B.; Hrouzková, S.; Sádecká, J. Gas-Chromatographic Analyses of Volatile Organic Compounds in Essential Oils Extracted from Slovak Juniper Berries and Needles (Juniperus communis L.). J. Food Compos. Anal. 2024, 133, 106419. [Google Scholar] [CrossRef]
  32. Orav, A.; Koel, M.; Kailas, T.; Müürisepp, M. Comparative Analysis of the Composition of Essential Oils and Supercritical Carbon Dioxide Extracts from the Berries and Needles of Estonian Juniper (Juniperus communis L.). Procedia Chem. 2010, 2, 161–167. [Google Scholar] [CrossRef]
  33. Baum, S.J.; Kris-Etherton, P.M.; Willett, W.C.; Lichtenstein, A.H.; Rudel, L.L.; Maki, K.C.; Whelan, J.; Ramsden, C.E.; Block, R.C. Fatty Acids in Cardiovascular Health and Disease: A Comprehensive Update. J. Clin. Lipidol. 2012, 6, 216–234. [Google Scholar] [CrossRef]
  34. Satija, A.; Hu, F.B. Plant-Based Diets and Cardiovascular Health. Trends Cardiovasc. Med. 2018, 28, 437–441. [Google Scholar] [CrossRef]
  35. Custers; Emma, E.M.; Kiliaan; Amanda, J. Dietary Lipids from Body to Brain. Prog. Lipid Res. 2022, 85, 101144. [Google Scholar] [CrossRef]
  36. Zardo, D.M.; Alvarez, L.V.H.; Los, F.G.B.; Ito, V.C.; Travalini, A.P.; Cardoso, T.; Wojeicchoski, J.P.; Alberti, A.; Zielinski, A.A.F.; Esmerino, L.; et al. In Vitro Assessment of the Antibacterial and Antioxidant Properties of Essential Oils. Curr. Bioact. Compd. 2019, 15, 592–599. [Google Scholar] [CrossRef]
  37. Khalili Tilami, S.; Kouřimská, L. Assessment of the Nutritional Quality of Plant Lipids Using Atherogenicity and Thrombogenicity Indices. Nutrients 2022, 14, 3795. [Google Scholar] [CrossRef]
  38. Athanasiadis, V.; Kalompatsios, D.; Mantiniotou, M.; Lalas, S.I. Investigation into the Reduction of Palm Oil in Foods by Blended Vegetable Oils through Response Surface Methodology and Oxidative Stability Tests. Antioxidants 2024, 13, 929. [Google Scholar] [CrossRef]
  39. Chen, J.; Liu, H. Nutritional Indices for Assessing Fatty Acids: A Mini-Review. Int. J. Mol. Sci. 2020, 21, 5695. [Google Scholar] [CrossRef]
Figure 1. Juniper berry fruits (A) and defatted powder (B).
Separations 12 00209 g001
Figure 2. Three-dimensional plots of parameters that impact assays of juniper berry extracts. For TPC, plot (A) represents the covariation of X1 (ethanol concentration, C, % v/v) and X2 (extraction temperature, T, °C); plot (B) shows the covariation of X1 and X3 (extraction time, t, min); plot (C) illustrates the covariation of X2 and X3. For FRAP, plot (D) shows the covariation of X1 and X2; plot (E) presents the covariation of X1 and X3; plot (F) illustrates the covariation of X2 and X3. For DPPH, plot (G) represents the covariation of X1 and X2; plot (H) depicts the covariation of X1 and X3; plot (I) illustrates the covariation of X2 and X3. For AAC, plot (J) represents the covariation of X1 and X2; plot (K) illustrates the covariation of X1 and X3; plot (L) illustrates the covariation of X2 and X3.
Separations 12 00209 g002
Figure 3. Pareto plots showcase the significance of each parameter estimate in the stirring extraction technique for juniper berry extracts regarding TPC (A), FRAP (B), DPPH (C), and AAC assays (D). The plots indicate statistical significance with a pink asterisk (p < 0.05), while negative values are represented by red bars and positive values by blue bars.
Separations 12 00209 g003
Figure 4. PCA plot involving the measured variables in the extraction of juniper berry fruits. X1X3 variables are illustrated with a blue color.
Separations 12 00209 g004
Figure 5. Plot (A) demonstrates the optimization process of the STE technique applied to the solid residue of J. communis L., utilizing a Partial Least Squares (PLS) prediction profiler alongside a desirability function with extrapolation control. Plot (B) presents the Variable Importance Plot (VIP) graph, which highlights the VIP values for each predictor variable in the STE technique. The red dashed line marks the 0.8 significance threshold, indicating the relative importance of each variable in the model.
Separations 12 00209 g005
Figure 6. Representative HPLC chromatogram at 280 nm of the optimized solid residue extract from J. communis L., illustrating the identified polyphenolic compounds. 1: 3-hydroxytyrosol; 2: pelargonin chloride; 3: catechin; 4: homovanillic acid; 5: epicatechin; 6: syringic acid; 7: rutin; 8: kaempferol-3-glucoside; 9: apigenin-7-O-glucoside; 10: apigenin; 11: kaempferol.
Separations 12 00209 g006
Table 1. Independent variable levels used in experimental design.
Independent VariablesCoded UnitsCoded Levels
−101
Ethanol concentration (C, % v/v)X1050100
Temperature (T, °C)X2205080
Extraction time (t, min)X3306090
Table 2. The experimental results of juniper berry extracts, detailing the relationships between the three independent variables examined and the corresponding responses of the dependent variables.
Design PointIndependent VariablesActual Responses *
X1 (C, %)X2 (T, °C)X3 (t, min)TPC
(mg GAE/g dw)
FRAP
(μmol AAE/g dw)
DPPH
(μmol AAE/g dw)
AAC
(mg AA/g dw)
11 (100)0 (50)1 (90)39.65223.95269.172.14
2−1 (0)1 (80)0 (60)31.51168.56233.221.84
3−1 (0)0 (50)−1 (30)27.77137.12244.501.62
40 (50)1 (80)1 (90)52.22351.29413.892.64
50 (50)0 (50)0 (60)51.32314.25436.202.51
60 (50)−1 (20)−1 (30)46.21299.39380.512.45
71 (100)1 (80)0 (60)38.16235.48304.762.28
80 (50)0 (50)0 (60)51.39312.31390.552.61
9−1 (0)−1 (20)0 (60)21.13116.79134.841.23
10−1 (0)0 (50)1 (90)24.05126.81163.571.16
111 (100)0 (50)−1 (30)39.96226.65292.332.09
120 (50)1 (80)−1 (30)57.32345.85399.832.65
130 (50)0 (50)0 (60)56.58328.68423.752.55
141 (100)−1 (20)0 (60)27.76151.76204.441.82
150 (50)−1 (20)1 (90)46.44289.56329.432.34
* Values are the mean of triplicate determinations; TPC, total polyphenol content; FRAP, ferric-reducing antioxidant power; DPPH antiradical activity; AAC, ascorbic acid content.
Table 3. The variance analysis (ANOVA) for the quadratic polynomial model used in the response surface methodology regarding juniper berry extracts.
FactorTPCFRAPDPPHAAC
Least Squares regression
Intercept53.1 *318.4 *416.8 *2.557 *
X1—solvent concentration5.134 *36.07 *36.82 *0.31 *
X2—temperature4.709 *30.46 *37.81 *0.196 *
X3—extraction time−1.11−2.18−17.6−0.07
X1X20.0057.9880.485−0.04
X1X30.8521.90214.440.128
X2X3−1.333.81716.280.025
X12−20.6 *−147 *−168 *−0.77 *
X22−2.88−3.69−29.50.002
X320.3346.797−6.42−0.04
ANOVA
F-value (model)23.847.3226.0223.9
F-value (lack of fit)1.0364.1711.0229.628
p-Value (model)0.0014 *0.0003 *0.0011 *0.0014 *
p-Value (lack of fit)0.5253 ns0.1994 ns0.5292 ns0.0955 ns
R20.9770.9880.9790.977
Adjusted R20.9360.9680.9410.936
RMSE3.0515.2423.750.125
MR40.76241.9308.12.129
PRESS493.716,37429,8241.182
CV29.2634.7431.5423.03
DF (total)14141414
* Values significantly impacted responses at a probability level of 95% (p < 0.05). TPC, total polyphenol content; FRAP, ferric-reducing antioxidant power; DPPH antiradical activity; AAC, ascorbic acid content; ns, non-significant; F-value, test for comparing model variance with residual (error) variance; p-value, probability of seeing the observed F-value if the null hypothesis is true; RMSE, root mean square error; MR, mean of response; PRESS, predicted residual error sum of squares; CV, coefficient of variation; DF, degrees of freedom.
Table 4. Optimum extraction conditions of juniper berries, with the corresponding maximum predicted responses for the dependent variables and desirability level.
ParametersX1 (C, %)X2 (T, °C)X3 (t, min)DesirabilityLeast Squares Regression
TPC (mg GAE/g dw)5580300.931657.92 ± 6.81
FRAP (μmol AAE/g dw)5780900.9191357.19 ± 34.09
DPPH (μmol AAE/g dw)5463380.9349433.03 ± 33.42
AAC (mg AA/g dw)5880600.99032.78 ± 0.2
Table 5. Multivariate correlation analysis of measured variables of juniper berry fruits.
ResponsesTPCFRAPDPPHAAC
TPC0.98770.98340.9650
FRAP 0.97530.9635
DPPH 0.9609
AAC
Table 7. Optimal extraction conditions for polyphenolic compounds obtained through the STE technique, applied to the solid residue of J. communis L. extracts.
A/APolyphenolic CompoundsConcentration (mg/g dw)
1.3-Hydroxytyrosol0.31 ± 0.01
2.Pelargonin chloride2.33 ± 0.13
3.Catechin1.14 ± 0.07
4.Homovanillic acid0.16 ± 0.01
5.Epicatechin0.18 ± 0.01
6.Syringic acid0.27 ± 0.02
7.Rutin0.32 ± 0.01
8.Kaempferol-3-glucoside0.21 ± 0.01
9.Apigenin-7-O-glucoside<LOQ
10.Apigenin0.32 ± 0.02
11.Kaempferol0.16 ± 0
Total identified5.41 ± 0.27
Table 8. Volatile compound classification in Juniperus communis L. oil extract, expressed as peak area percentage.
A/ART (min)CompoundChemical GroupCAS NumberArea (%)
1.9.329TricycleneMonoterpenes508-32-70.05 ± 0
2.10.249(1R)-α-PineneMonoterpenes7785-70-89.32 ± 0.34
3.12.228(-)-β-PineneMonoterpenes18172-67-31.27 ± 0.09
4.14.047MyrceneMonoterpenes123-35-311.91 ± 0.48
5.14.6(-)-α-PineneMonoterpenes7785-26-40.02 ± 0
6.15.103m-CymeneAlkylbenzenes535-77-30.07 ± 0
7.15.838D-LimoneneMonoterpenes5989-27-52.9 ± 0.17
8.16.524(E)-β-OcimeneMonoterpenes3779-61-10.02 ± 0
9.17.201α-OcimeneMonoterpenes502-99-80.01 ± 0
10.17.6γ-TerpineneMonoterpenes99-85-40.03 ± 0
11.17.91cis-Sabinene hydrateOxygenated Monoterpenoids15537-55-00.12 ± 0.01
12.19.141p-CymeneneAlkylbenzenes1195-32-00.04 ± 0
13.19.547TerpinoleneMonoterpenes586-62-90.33 ± 0.02
14.20.434(±)-LinaloolTerpenoid Alcohols78-70-60.2 ± 0.01
15.21.106α-CampholenalTerpenoid Aldehydes4501-58-00.1 ± 0
16.21.4761-Octen-3-yl acetateTerpenoid Esters2442-10-60.15 ± 0.01
17.22.253SabinolTerpenoid Alcohols471-16-90.08 ± 0
18.23.207PinocarvoneKetones30460-92-50.03 ± 0
19.25.045Terpinen-4-olTerpenoid Alcohols562-74-30.13 ± 0.01
20.25.288(±)-MyrtenalTerpenoid Aldehydes564-94-30.05 ± 0
21.25.895(-)-α-TerpineolTerpenoid Alcohols10482-56-10.06 ± 0
22.26.27(±)-VerbenoneKetones80-57-90.08 ± 0
23.27.845CarveolTerpenoid Alcohols99-48-90.03 ± 0
24.28.249Fenchyl acetateTerpenoid Esters13851-11-10.05 ± 0
25.28.661(-)-CarvoneMonoterpenoid Ketones6485-40-10.03 ± 0
26.29.325CitronellolTerpenoid Alcohols106-22-90.02 ± 0
27.30.553Terpinen-4-ol acetateTerpenoid Esters4821-04-90.05 ± 0
28.31.273α-FencheneOxygenated Monoterpenoids471-84-10.03 ± 0
29.32.456(±)-Bornyl acetateTerpenoid Esters76-49-30.67 ± 0.05
30.33.118p-CymeneAlkylbenzenes99-87-60.11 ± 0
31.33.488(±)-α-PineneMonoterpenes80-56-80.02 ± 0
32.33.7521,2-DiethylbenzeneAlkylbenzenes135-01-30.02 ± 0
33.33.989NeodihydrocarveolTerpenoid Alcohols18675-34-80.01 ± 0
34.34.883Myrtenyl acetateTerpenoid Esters1079-01-20.05 ± 0
35.35.277Perillyl acetateTerpenoid Esters15111-96-30.02 ± 0
36.35.772α-TerpineneMonoterpenes99-86-50.05 ± 0
37.36.048(±)-CampheneOxygenated Monoterpenoids79-92-50.06 ± 0
38.36.6742-CareneOxygenated Monoterpenoids554-61-00.13 ± 0
39.37.331α-CubebeneSesquiterpenoids17699-14-80.48 ± 0.02
40.38.783CopaeneSesquiterpenes3856-25-50.26 ± 0.02
41.39.268Neryl acetateTerpenoid Esters141-12-80.22 ± 0.01
42.39.836γ-CadineneSesquiterpenes39029-41-91.45 ± 0.06
43.42.093(-)-IsocaryophylleneSesquiterpenes118-65-024.5 ± 1.47
44.42.889γ-MuuroleneSesquiterpenoids30021-74-00.18 ± 0.01
45.43.981HumuleneSesquiterpenes6753-98-615.93 ± 0.46
46.45.73Germacrene DSesquiterpenes23986-74-517.43 ± 0.94
47.46.095α-LongipineneSesquiterpenoids5989-08-20.76 ± 0.03
48.46.684α-MuuroleneSesquiterpenoids31983-22-93.16 ± 0.15
49.47.13α-AmorpheneSesquiterpenoids23515-88-01.22 ± 0.09
50.47.841δ-CadineneSesquiterpenes483-76-11.46 ± 0.07
51.48.12CubeneneSesquiterpenes29837-12-50.17 ± 0.01
52.48.436(-)-α-CadineneSesquiterpenes24406-05-10.27 ± 0.01
53.50.597CloveneSesquiterpenes469-92-12.7 ± 0.14
54.51.267(-)-α-HimachaleneSesquiterpenoids3853-83-60.3 ± 0.02
55.51.918(-)-Humulene epoxide IIOxygenated Sesquiterpenoids19888-34-70.83 ± 0.02
56.55.263AlloaromadendreneSesquiterpenes25246-27-90.13 ± 0.01
57.57.578β-OplopenoneOxygenated Sesquiterpenoids28305-60-40.06 ± 0
58.63.651SclareneOxygenated Sesquiterpenoids511-02-40.16 ± 0.01
Table 9. Fatty acid composition of Juniperus communis L. oil extract, expressed as a percentage (%) of total fatty acids.
Fatty AcidsPercentage (%)
C16:0 (Palmitic acid)6.22 ± 0.4
C16:1 (Palmitoleic acid)0.56 ± 0.03
C18:0 (Stearic acid)2.13 ± 0.08
C18:1 (Oleic acid)58.75 ± 2.76
C18:2 (Linoleic acid)23.42 ± 1.5
C18:3 (α-Linolenic acid)8.92 ± 0.46
∑ SFA 18.35 ± 0.48
∑ MUFA 259.31 ± 2.79
∑ PUFA 332.34 ± 1.96
∑ ω-3 FA8.92 ± 0.46
∑ ω-6 FA23.42 ± 1.5
∑ ω-9 FA58.75 ± 2.76
∑ UFA 491.65 ± 4.76
ω-3:ω-6 ratio0.38 ± 0
(SFA + MUFA):PUFA ratio2.09 ± 0.03
COX 54.93 ± 0.28
IA 60.07 ± 0
IT 70.12 ± 0
HH 814.65 ± 0.18
HPI 914.74 ± 0.18
1 SFAs, saturated fatty acids (%): SUM of C16:0 and C18:0. 2 MUFAs, monounsaturated fatty acids (%): SUM of C16:1 and C18:1 ω-9. 3 PUFAs, polyunsaturated fatty acids (%): SUM of C18:2 ω-6 and C18:3 ω-3. 4 UFAs, unsaturated fatty acids (%): SUM of MUFAs and PUFAs. 5 COX, calculated oxidizability value. 6 IA, index of atherogenicity. 7 IT, index of thrombogenicity. 8 HH, hypocholesterolemic/hypercholesterolemic ratio. 9 HPI, health-promoting index.
Disclaimer/Publisher’s Note: The statements, opinions and data contained in all publications are solely those of the individual author(s) and contributor(s) and not of MDPI and/or the editor(s). MDPI and/or the editor(s) disclaim responsibility for any injury to people or property resulting from any ideas, methods, instructions or products referred to in the content.