1. Introduction
Injection molding is a cornerstone of modern manufacturing, enabling the mass production of complex polymer components with high precision and efficiency [
1]. The process is particularly vital for short-fiber-reinforced thermoplastics (SFRTs), a class of composite materials prized for their enhanced mechanical properties, such as high strength, stiffness, and dimensional stability, compared to unreinforced polymers [
2,
3]. Materials like polyamide 6 with 30% glass fiber (PA6-GF30) are extensively used in demanding applications across the automotive, aerospace, and consumer electronics industries, where a superior strength-to-weight ratio is critical [
4,
5].
The final mechanical performance of an injection-molded SFRT part is intricately linked to the processing parameters employed during manufacturing, not solely to the material composition [
6,
7,
8]. Variables such as melt temperature, injection pressure, packing pressure, and cooling time govern the polymer’s flow dynamics, fiber orientation, and crystalline structure, all of which collectively determine the macroscopic properties of the finished product [
9]. The relationship between these parameters and outcomes like tensile strength and impact resistance is highly complex, nonlinear, and often interactive, making traditional trial-and-error optimization methods both time-consuming and economically inefficient [
9,
10,
11,
12]. The inherent complexity has driven the need for more sophisticated and systematic approaches to process optimization.
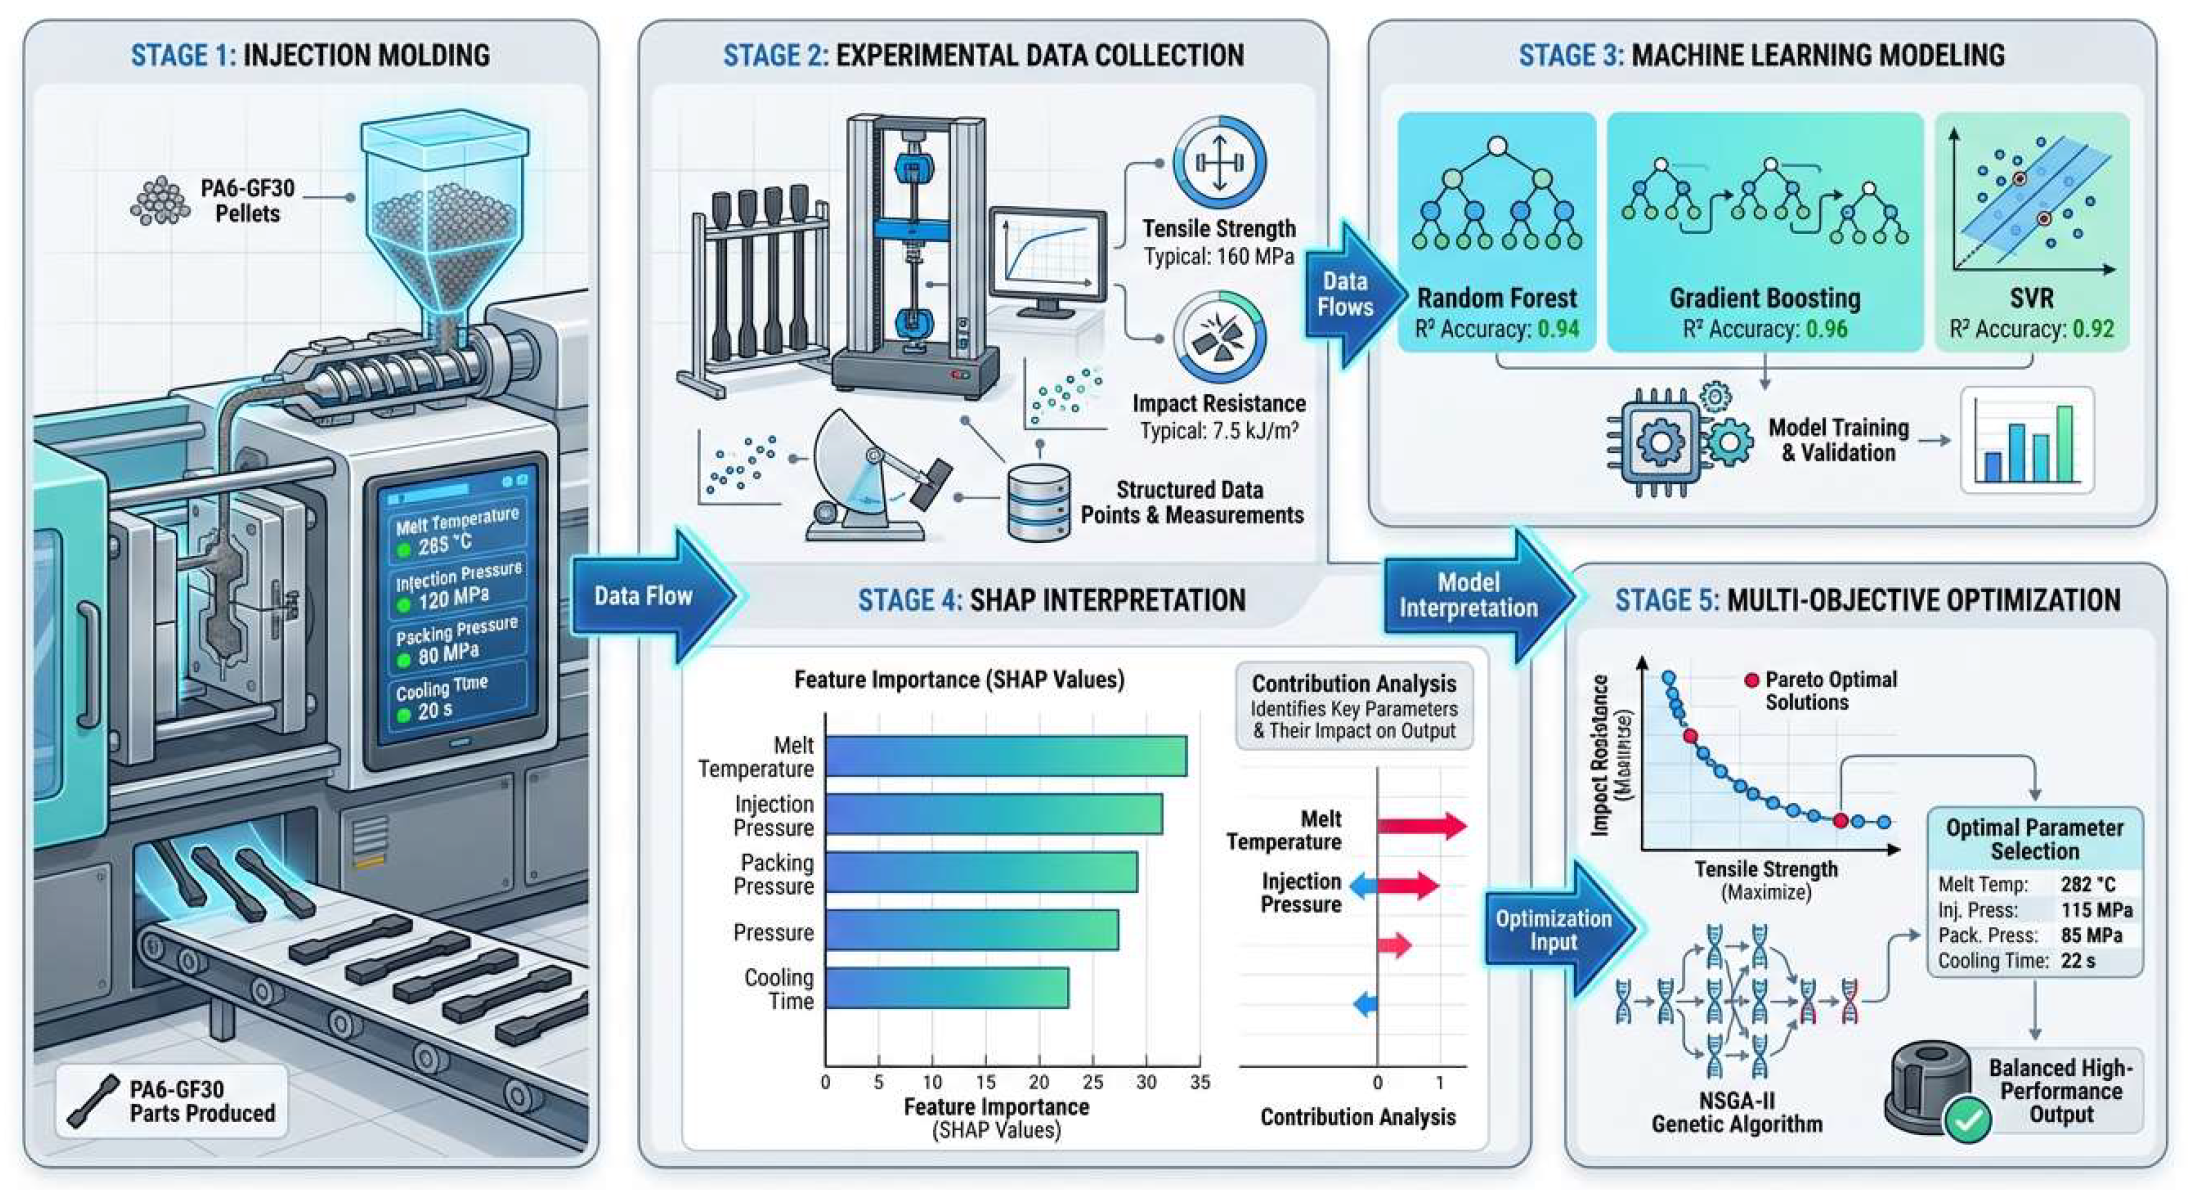
In recent years, machine learning (ML) has emerged as a powerful alternative for modeling and optimizing complex manufacturing processes [
7,
8,
10,
11,
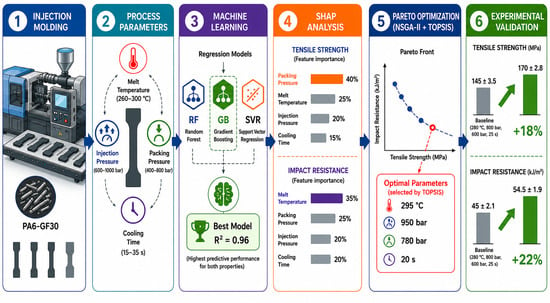
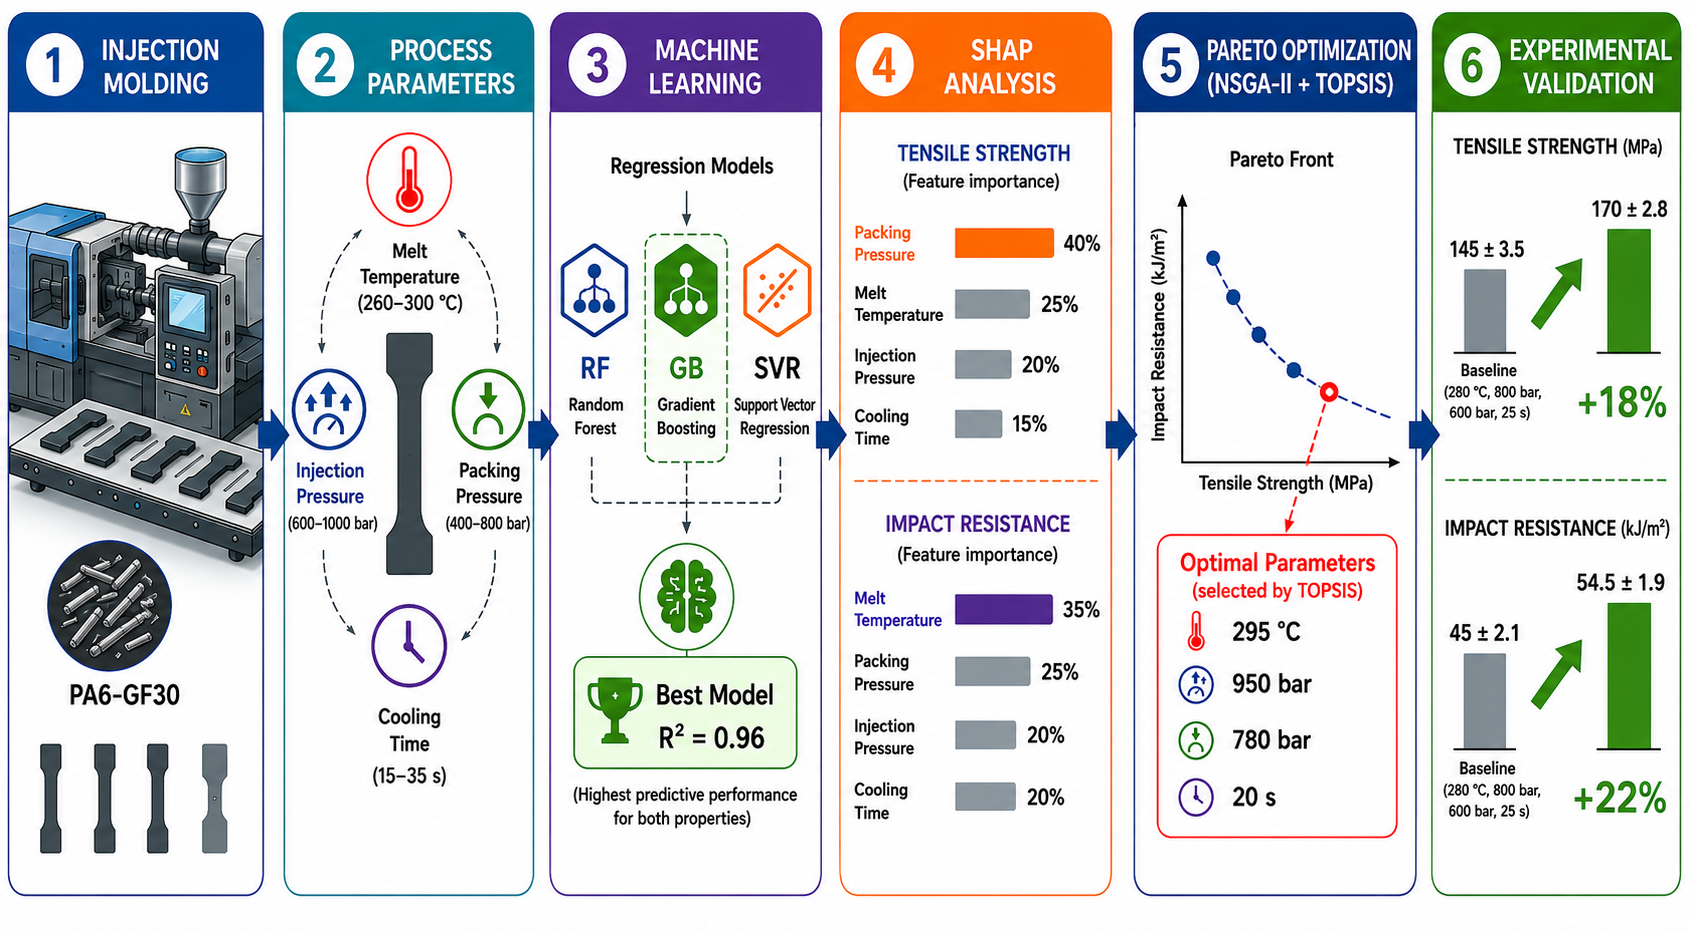
13] (the complete workflow is illustrated in
Figure 1,
Section 2.4). By leveraging data from experimental campaigns or production monitoring, ML algorithms can uncover the subtle, nonlinear relationships between process inputs and quality outputs without requiring a complete physical understanding of the underlying phenomena [
14]. Techniques such as Artificial Neural Networks (ANNs), Support Vector Regression (SVR), Random Forests (RF), and Gradient Boosting (GB) have been successfully applied to predict and optimize various aspects of injection molding, from minimizing part defects to enhancing mechanical properties [
15,
16,
17,
18,
19,
20,
21,
22,
23,
24]. These data-driven models have demonstrated a remarkable capacity to build predictive frameworks that can guide process adjustments with high accuracy [
19,
20,
21].
To further enhance the utility of these black-box models, methods for interpretable machine learning have become increasingly important. Techniques like SHAP (Shapley Additive exPlanations) provide crucial insights into model predictions by quantifying the contribution of each input feature to the final output [
15,
16,
25]. This level of transparency is invaluable in a manufacturing context, as it allows engineers to understand why a model makes a certain prediction, thereby building trust and facilitating the identification of the most influential process parameters [
15,
16,
17].
Once a reliable predictive model is established, it can be integrated with optimization algorithms to systematically search for the ideal set of processing conditions. Multi-objective optimization, often employing genetic algorithms like the Non-dominated Sorting Genetic Algorithm II (NSGA-II), is particularly well-suited for this task, as it can navigate the trade-offs between competing objectives, such as maximizing both tensile strength and impact resistance simultaneously [
26,
27,
28]. This integrated approach enables the identification of a Pareto-optimal set of solutions, offering a range of optimized parameter combinations that can be selected based on specific application requirements [
29,
30].
This study presents a comprehensive framework that combines designed experiments, machine learning, and multi-objective optimization to enhance the mechanical properties of injection-molded PA6-GF30. We systematically investigate the effects of four key processing parameters on tensile strength and Charpy impact resistance. We then develop and compare the predictive performance of Random Forest, Gradient Boosting, and Support Vector Regression models. The best-performing model is interpreted using SHAP to identify the key process drivers and subsequently coupled with a genetic algorithm to find an optimal set of parameters. Finally, we validate the optimized parameters through experimental testing to demonstrate the tangible improvements in mechanical performance, showcasing the transformative potential of this intelligent manufacturing approach.
The principal novel contributions of this work that distinguish it from prior literature are threefold: (1) An ML pipeline rigorously free of data leakage, implemented via grouped 10-fold cross-validation (GroupKFold) that keeps all replicates of each processing condition within a single fold, combined with a fully independent external validation set—ensuring performance metrics reflect true generalization rather than artificially inflated in-sample accuracy; (2) physically consistent interpretability via SHAP analysis, where the identified process–property relationships (e.g., the dominant role of packing pressure on tensile strength and the non-monotonic effect of melt temperature on impact resistance) are explicitly correlated with established polymer processing theory and the observed microstructural features of the PA6-GF30 composite, providing mechanistic validation of the data-driven findings; (3) a multi-objective optimization framework (NSGA-II + TOPSIS) that yields a quantified and experimentally validated improvement exceeding 18% in both mechanical properties, with the selected Pareto-optimal solution confirmed through a dedicated set of 15 external specimens and paired t-test significance (p < 0.001).
2. Materials and Methods
2.1. Material
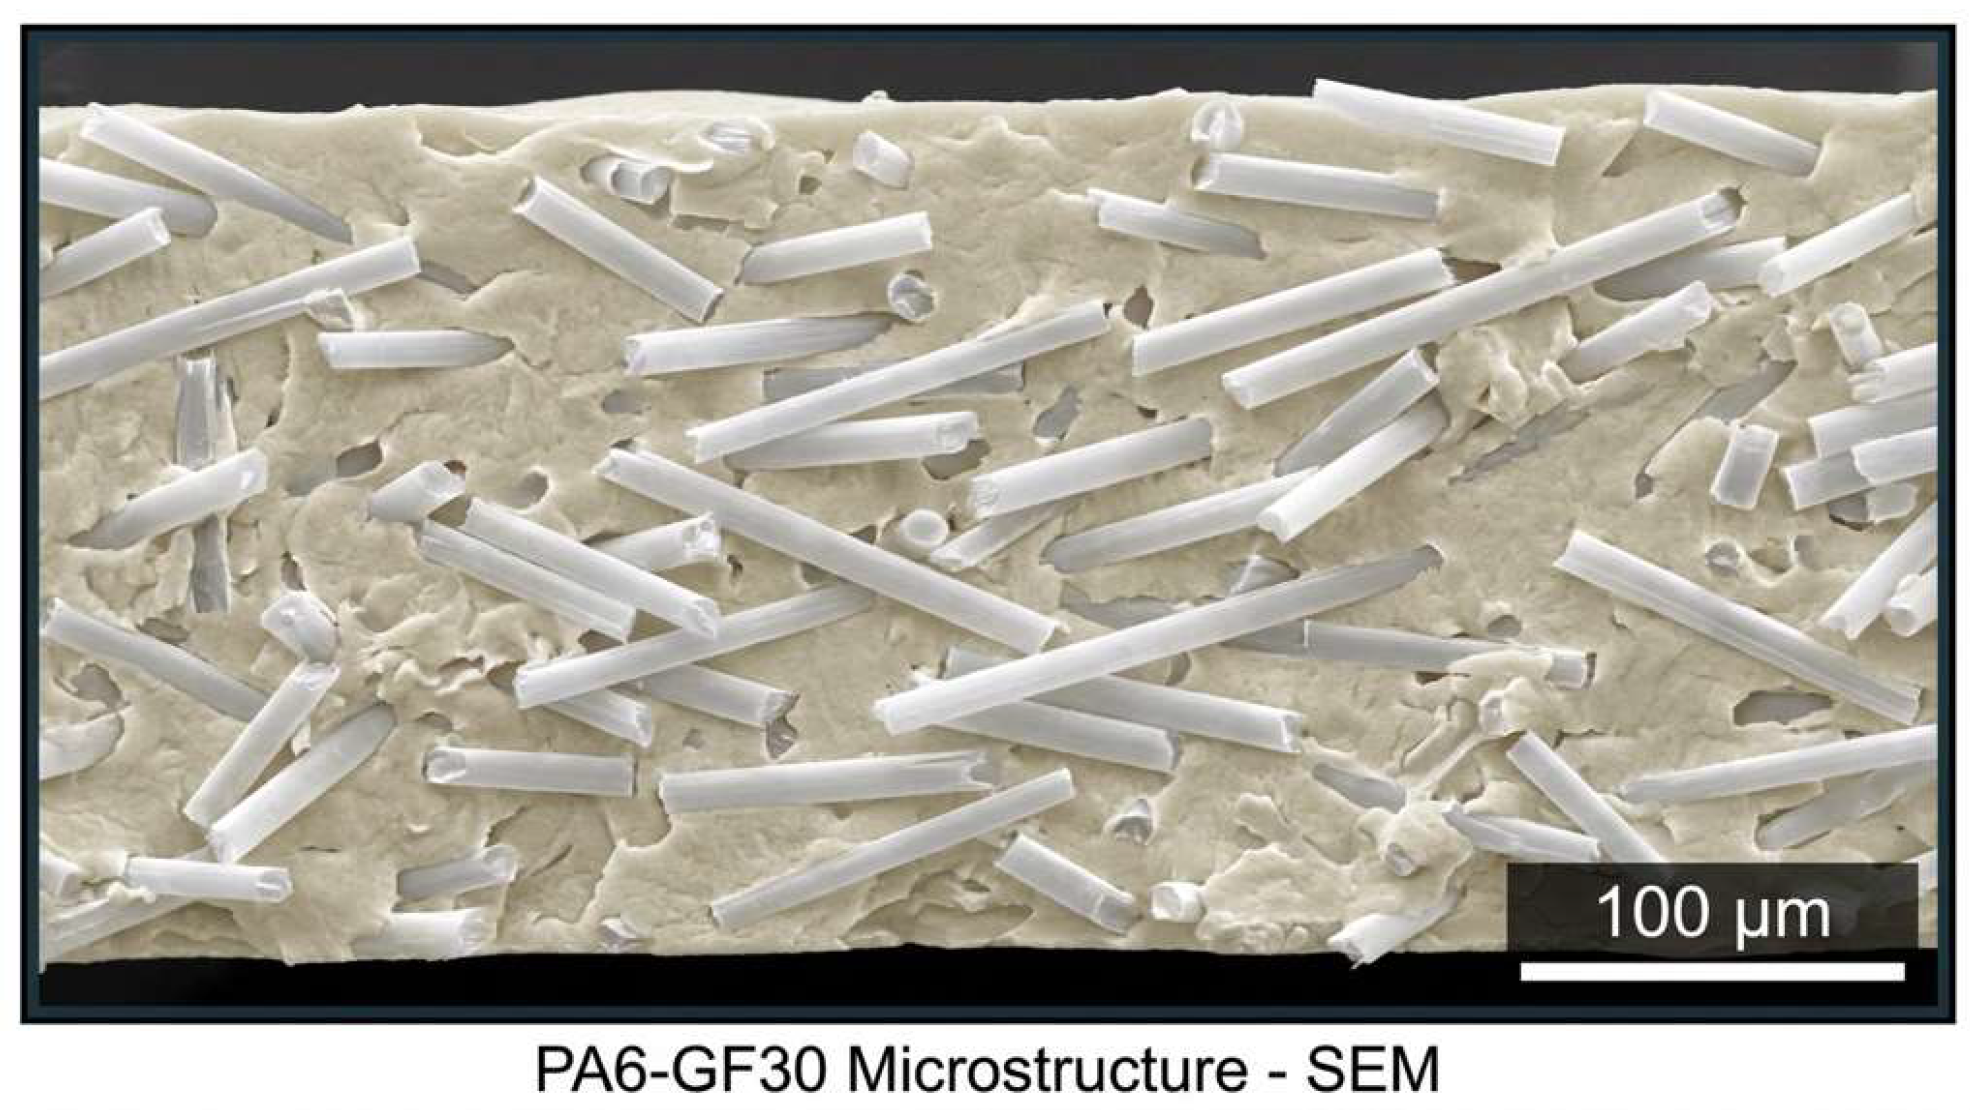
The material used in this study was a commercial-grade Polyamide 6 reinforced with 30% short glass fibers by weight (PA6-GF30), specifically Ultramid
® B3WG6 from BASF (Ludwigshafen, Germany), as shown in
Figure 2. This grade was selected for its widespread use in industrial applications requiring high mechanical performance and its well-characterized properties. Prior to injection molding, the polymer granules were dried in a vacuum oven at 80 °C for 4 h to reduce the moisture content below 0.1% (the actual moisture content immediately prior to processing was verified to be 0.08% using a Mettler Toledo HC103 moisture analyzer, precision ±0.01%). Strict control of moisture below this threshold is absolutely critical for experimental consistency, given the highly hygroscopic nature of polyamides, where excess moisture acts as a plasticizer and can cause severe hydrolytic degradation and compromise the mechanical properties of the molded parts, in accordance with the manufacturer’s recommendations.
For microstructural characterization, a representative specimen was fractured cryogenically in liquid nitrogen to preserve the fiber–matrix interface morphology. The fracture surface was mounted on an aluminum stub and sputter-coated with a Au/Pd alloy (approximately 10 nm) to ensure electrical conductivity. Scanning electron microscopy (SEM) was performed using a JEOL JSM-7800F field-emission instrument (JEOL Ltd., Tokyo, Japan) at an accelerating voltage of 5 kV. The SEM image (
Figure 2) is presented as an illustrative micrograph to reveal the typical morphology of the composite—specifically the distribution and aspect ratio of short glass fibers within the polyamide matrix—and is not intended for quantitative analysis of fiber volume fraction or void content, as these are not objectives of the present study.
2.2. Injection Molding and Experimental Design
Table 1 summarizes the four factors, their three levels, and the fixed parameters maintained constant throughout the experimental campaign.
While space-filling designs like Latin hypercube sampling are often more efficient for exploring high-dimensional spaces, a full factorial experimental design was intentionally implemented to systematically investigate the influence of four key processing parameters on the final mechanical properties of the molded specimens. This approach guarantees orthogonal evaluation of all main effects and their interactions without confounding, providing a robust, unambiguous baseline dataset necessary for training and rigorously validating the interpretable ML models. The selected parameters and their respective ranges were as follows: melt temperature (260 °C, 280 °C, 300 °C), injection pressure (600 bar, 800 bar, 1000 bar), packing pressure (400 bar, 600 bar, 800 bar), and cooling time (15 s, 25 s, 35 s). These ranges were chosen based on preliminary studies and established processing guidelines for PA6-GF30 to cover a broad yet feasible processing window [
8,
9,
10,
11]. The chosen ranges for injection pressure (600–1000 bar) and packing pressure (400–800 bar) are relatively high but strictly necessary for PA6-GF30. The 30% glass fiber content significantly increases melt viscosity, requiring these elevated pressures to ensure complete mold filling and adequate packing to minimize shrinkage-induced voids. Other key injection molding parameters, such as mold temperature and injection speed, were kept constant at 80 °C and 50 mm/s respectively. This decision was based on preliminary screening, which indicated that their variance impact was less significant compared to the chosen four parameters within the operational window. The packing time was fixed at 8 s for all experimental runs, a value determined in preliminary studies to be sufficient to stabilize the cavity pressure prior to the onset of cooling.
The experimental campaign was conducted over a continuous two-week period, with processing conditions randomized to minimize batch effects and ensure resource efficiency. We produced five replicate specimens for each of the 81 unique parameter combinations to ensure statistical reliability and quantify process variability. All specimens were produced using an Arburg Allrounder 370 S injection molding machine (Lossburg, Germany), featuring a 50-ton clamping force and equipped with a 25 mm diameter screw. Injection pressure was controlled as a primary limit variable, while injection speed was maintained constant at 50 mm/s. Mold temperature was actively regulated at 80 °C using a pressurized water temperature control unit. Standard tensile test bars (ASTM D638 Type I) and Charpy impact test specimens (ASTM D6110) were molded. The molding cycle was allowed to stabilize for 10 shots before the collection of experimental samples began for each new parameter setting.
2.3. Mechanical Property Characterization
After molding, all specimens were conditioned in a controlled environment at 23 ± 2 °C and 50 ± 5% relative humidity for at least 48 h before mechanical testing, as per ASTM standards. All testing equipment was calibrated prior to use.
Tensile Strength: Uniaxial tensile tests were performed using an Instron 5967 universal testing machine equipped with a 30 kN load cell at a constant crosshead speed of 5 mm/min, following the ASTM D638 standard. The ultimate tensile strength (UTS) was recorded for each specimen. The average value and standard deviation from the five valid tests were used for each processing condition.
Charpy Impact Resistance: Notched Charpy impact tests were conducted in accordance with the ISO 179-1/ASTM D6110 standard to determine the impact resistance of the material. Test specimens had dimensions of 80 × 10 × 4 mm with a Type A V-notch (depth: 2 mm, notch tip radius: 0.25 mm) machined perpendicular to the specimen length. A pendulum with a nominal energy of 2 J was employed. All tests were conducted at ambient temperature (23 ± 2 °C). Prior to testing, specimens were conditioned at 50 ± 5% relative humidity for 48 h in accordance with ISO 291. Five valid replicate specimens were tested per processing condition. The energy absorbed during fracture was recorded, and the impact strength was calculated in kJ/m2. The average and standard deviation of the five replicates were used as the representative value for each parameter set.
2.4. Machine Learning Modeling
The ML models were trained to predict two target properties: tensile strength (σ_tensile, in MPa) and Charpy impact resistance (E_impact, in kJ/m2). The four input features were: melt temperature (T_melt), injection pressure (P_inj), packing pressure (P_pack), and cooling time (t_cool). For each of the 81 processing conditions, the five experimental replicates were averaged to obtain a single representative value per condition; the standard deviation was retained for uncertainty analysis. Prior to model training, all input features were standardized using Z-score normalization. All machine learning models and data preprocessing were implemented in Python 3.9 using the scikit-learn library (v1.0.2). SHAP analysis was conducted using the shap library (v0.40.0), and multi-objective optimization was performed using the pymoo library (v0.6.0). The experimental dataset, comprising 81 distinct processing conditions with 5 replicates each (405 data points total), was used to develop predictive models. To ensure a robust evaluation of model performance, a 10-fold cross-validation strategy was employed. To prevent severe data leakage and artificially inflated performance metrics, a GroupKFold cross-validation strategy was strictly employed. The dataset was partitioned into 10 subsets grouped by unique processing condition. In each fold, all five replicates of any given processing condition were kept together entirely within either the training or the testing set. This rigorous approach minimizes the bias associated with arbitrary train/test splits and provides a highly reliable estimate of the model’s true generalization performance.
Three widely used regression algorithms were selected for comparison:
- -
Random Forest (RF): An ensemble learning method that operates by constructing a multitude of decision trees at training time and outputting the mean prediction of the individual trees. RF is known for its robustness against overfitting and its ability to handle high-dimensional data [
23]. Hyperparameter tuning via grid search yielded: n_estimators = 200, max_depth = 15, min_samples_split = 2.
- -
Gradient Boosting (GB): Another ensemble technique that builds models in a sequential, stage-wise fashion. It works by iteratively adding weak learners (typically decision trees) that correct the errors of their predecessors, resulting in a powerful and highly accurate predictive model [
19,
20]. Optimized hyperparameters were: n_estimators = 300, learning_rate = 0.05, max_depth = 5, subsample = 0.8.
- -
Support Vector Regression (SVR): A regression algorithm based on the principles of support vector machines. SVR aims to find a function that deviates from the target values by a value no greater than a specified margin (ε), while being as flat as possible. It is effective in high-dimensional spaces and when the number of samples is smaller than the number of features [
22,
23,
24]. Grid search optimization resulted in: kernel = ‘rbf’, C = 100, epsilon = 0.1, gamma = ‘scale’.
Model performance was quantified using multiple metrics: the coefficient of determination (R2), Adjusted R2, Mean Absolute Error (MAE), and Root Mean Squared Error (RMSE). The results from the 10-fold cross-validation were averaged to provide a final performance estimate. The 95% confidence intervals for the R2 metric were calculated via bootstrap resampling (1000 iterations) applied to the out-of-fold predictions, providing a statistically robust estimate of model stability.
2.5. Model Interpretation and Optimization
Following the selection of the Gradient Boosting model as the best performer, SHAP (SHapley Additive exPlanations) analysis was applied to the trained GB model to quantify the contribution of each input feature to individual predictions. Global feature importance was derived from mean absolute SHAP values across all samples, and SHAP dependence plots were used to visualize nonlinear and interactive parameter effects.
Multi-objective optimization was performed using the Non-dominated Sorting Genetic Algorithm II (NSGA-II), implemented via the pymoo library (v0.6.0). The vectorial objective function to be maximized was defined as: maximize [f1(x), f2(x)], where f1 = predicted tensile strength (GB model) and f2 = predicted Charpy impact resistance (GB model), and x = [T_melt, P_inj, P_pack, t_cool]. All decision variables were constrained to remain within the experimentally validated ranges (no extrapolation). No additional penalty functions were applied. The algorithm was configured with: population size = 100 individuals, number of generations = 200, simulated binary crossover (SBX) probability = 0.9 with distribution index η_c = 15, and polynomial mutation probability = 0.25 with distribution index η_m = 20. To select a single balanced solution from the Pareto front for experimental validation, the Technique for Order of Preference by Similarity to Ideal Solution (TOPSIS) was applied with equal weights (0.5/0.5) assigned to both objectives.
The optimal processing parameters identified by the multi-objective optimization were used to mold a new set of 15 external validation specimens. These specimens were not part of the original training or testing data. They were subjected to the same mechanical testing and conditioning procedures described in
Section 2.3. The experimental results were compared against the model’s predictions and a baseline condition (the center point of the experimental design: 280 °C melt temperature, 800 bar injection pressure, 600 bar packing pressure, and 25 s cooling time) to quantify the improvement in mechanical properties achieved through the optimization framework. Statistical significance of the improvement was assessed using a paired Student’s
t-test.
3. Results and Discussion
3.1. Statistical Significance of Process Parameters
A Type III Analysis of Variance (ANOVA) was conducted to determine the statistical significance of each processing parameter on tensile strength and Charpy impact resistance. For the full factorial design with four factors at three levels (3
4 = 81 conditions), each factor has 2 degrees of freedom (df = 2); the error term has df_error = 16 (estimated from the replicate variance within conditions). Two-way interaction terms were also tested; none reached statistical significance (all
p > 0.05), and therefore only the main-effects model is presented. The results, summarized in
Table 2 (including F-values, mean squares, and
p-values), show that all four main parameters had a statistically significant effect (
p < 0.05) on both output variables. For tensile strength, packing pressure exhibited the largest F-value, confirming its dominant role. For impact resistance, melt temperature was the most influential factor. While the ANOVA primarily quantifies linear main effects, the Gradient Boosting model implicitly captures complex, high-order interactions between processing parameters, which are explicitly visualized in the subsequent SHAP dependence analysis.
3.2. Machine Learning Model Performance
Three distinct machine learning models were trained and evaluated using a 10-fold cross-validation approach. The performance metrics, averaged across the 10 folds, are presented in
Table 3. The Gradient Boosting (GB) model demonstrated superior predictive accuracy across all metrics, achieving the highest R
2 and Adjusted R
2 values and the lowest MAE and RMSE for both target properties. The 95% confidence intervals for the GB model’s R
2 scores were narrow (0.95–0.97 for tensile strength and 0.93–0.95 for impact resistance), indicating a stable and reliable performance.
The complete performance metrics for all three models are reported in
Table 3. The Gradient Boosting model consistently outperformed both RF and SVR across all metrics and for both target properties.
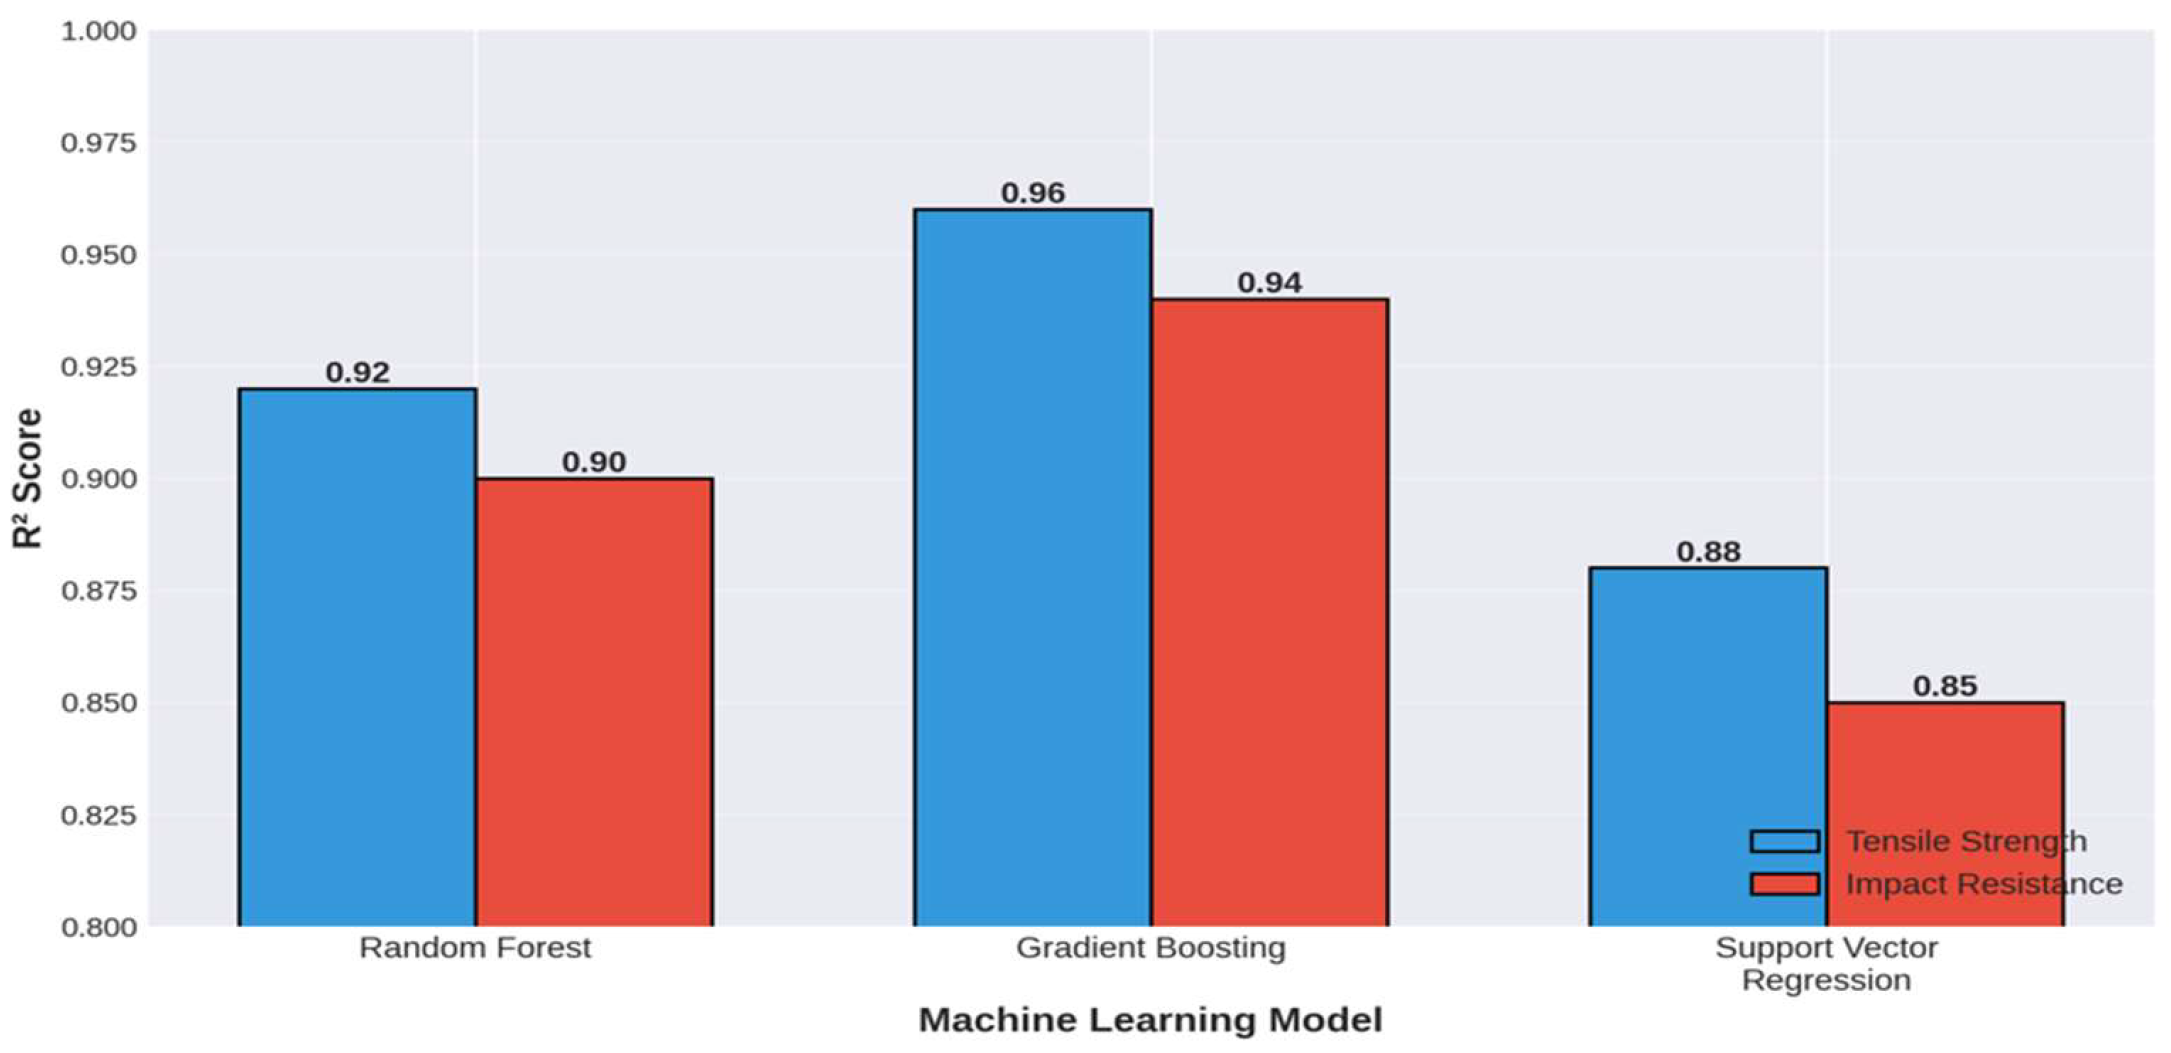
The Gradient Boosting model achieved an R2 value of 0.96 for tensile strength and 0.94 for impact resistance, demonstrating a very strong correlation between the model’s predictions and the experimental outcomes.
The performance ranking (GB > RF > SVR) is consistent across both target properties, as visualized in
Figure 3.
Given its superior performance, the Gradient Boosting model was selected for all subsequent analysis and optimization tasks.
To further assess the predictive reliability of the Gradient Boosting model beyond cross-validation, an independent external validation was conducted using 15 specimens molded under randomly selected processing conditions not included in the training set. The GB model predictions for these external specimens showed a strong correlation with experimental measurements (R2 = 0.93 for tensile strength and R2 = 0.91 for impact resistance), confirming the model’s generalization capability and robustness against overfitting.
3.3. Model Interpretation Using SHAP Analysis
SHAP analysis of the trained GB model provided insights into the underlying process-property relationships. For tensile strength, packing pressure was confirmed as the most dominant factor. The physical mechanism driving this relationship—primarily the compensation for volumetric shrinkage to produce a more compact microstructure—is detailed in the subsequent global feature importance section.
For impact resistance, melt temperature was the key driver. The underlying mechanism, involving reduced polymer viscosity and improved fiber–matrix interfacial bonding, is further elucidated below. However, the SHAP dependence plots revealed a non-monotonic relationship, with the benefit plateauing beyond 290 °C, likely due to the onset of thermal degradation of the PA6 matrix, which can embrittle the material [
4].
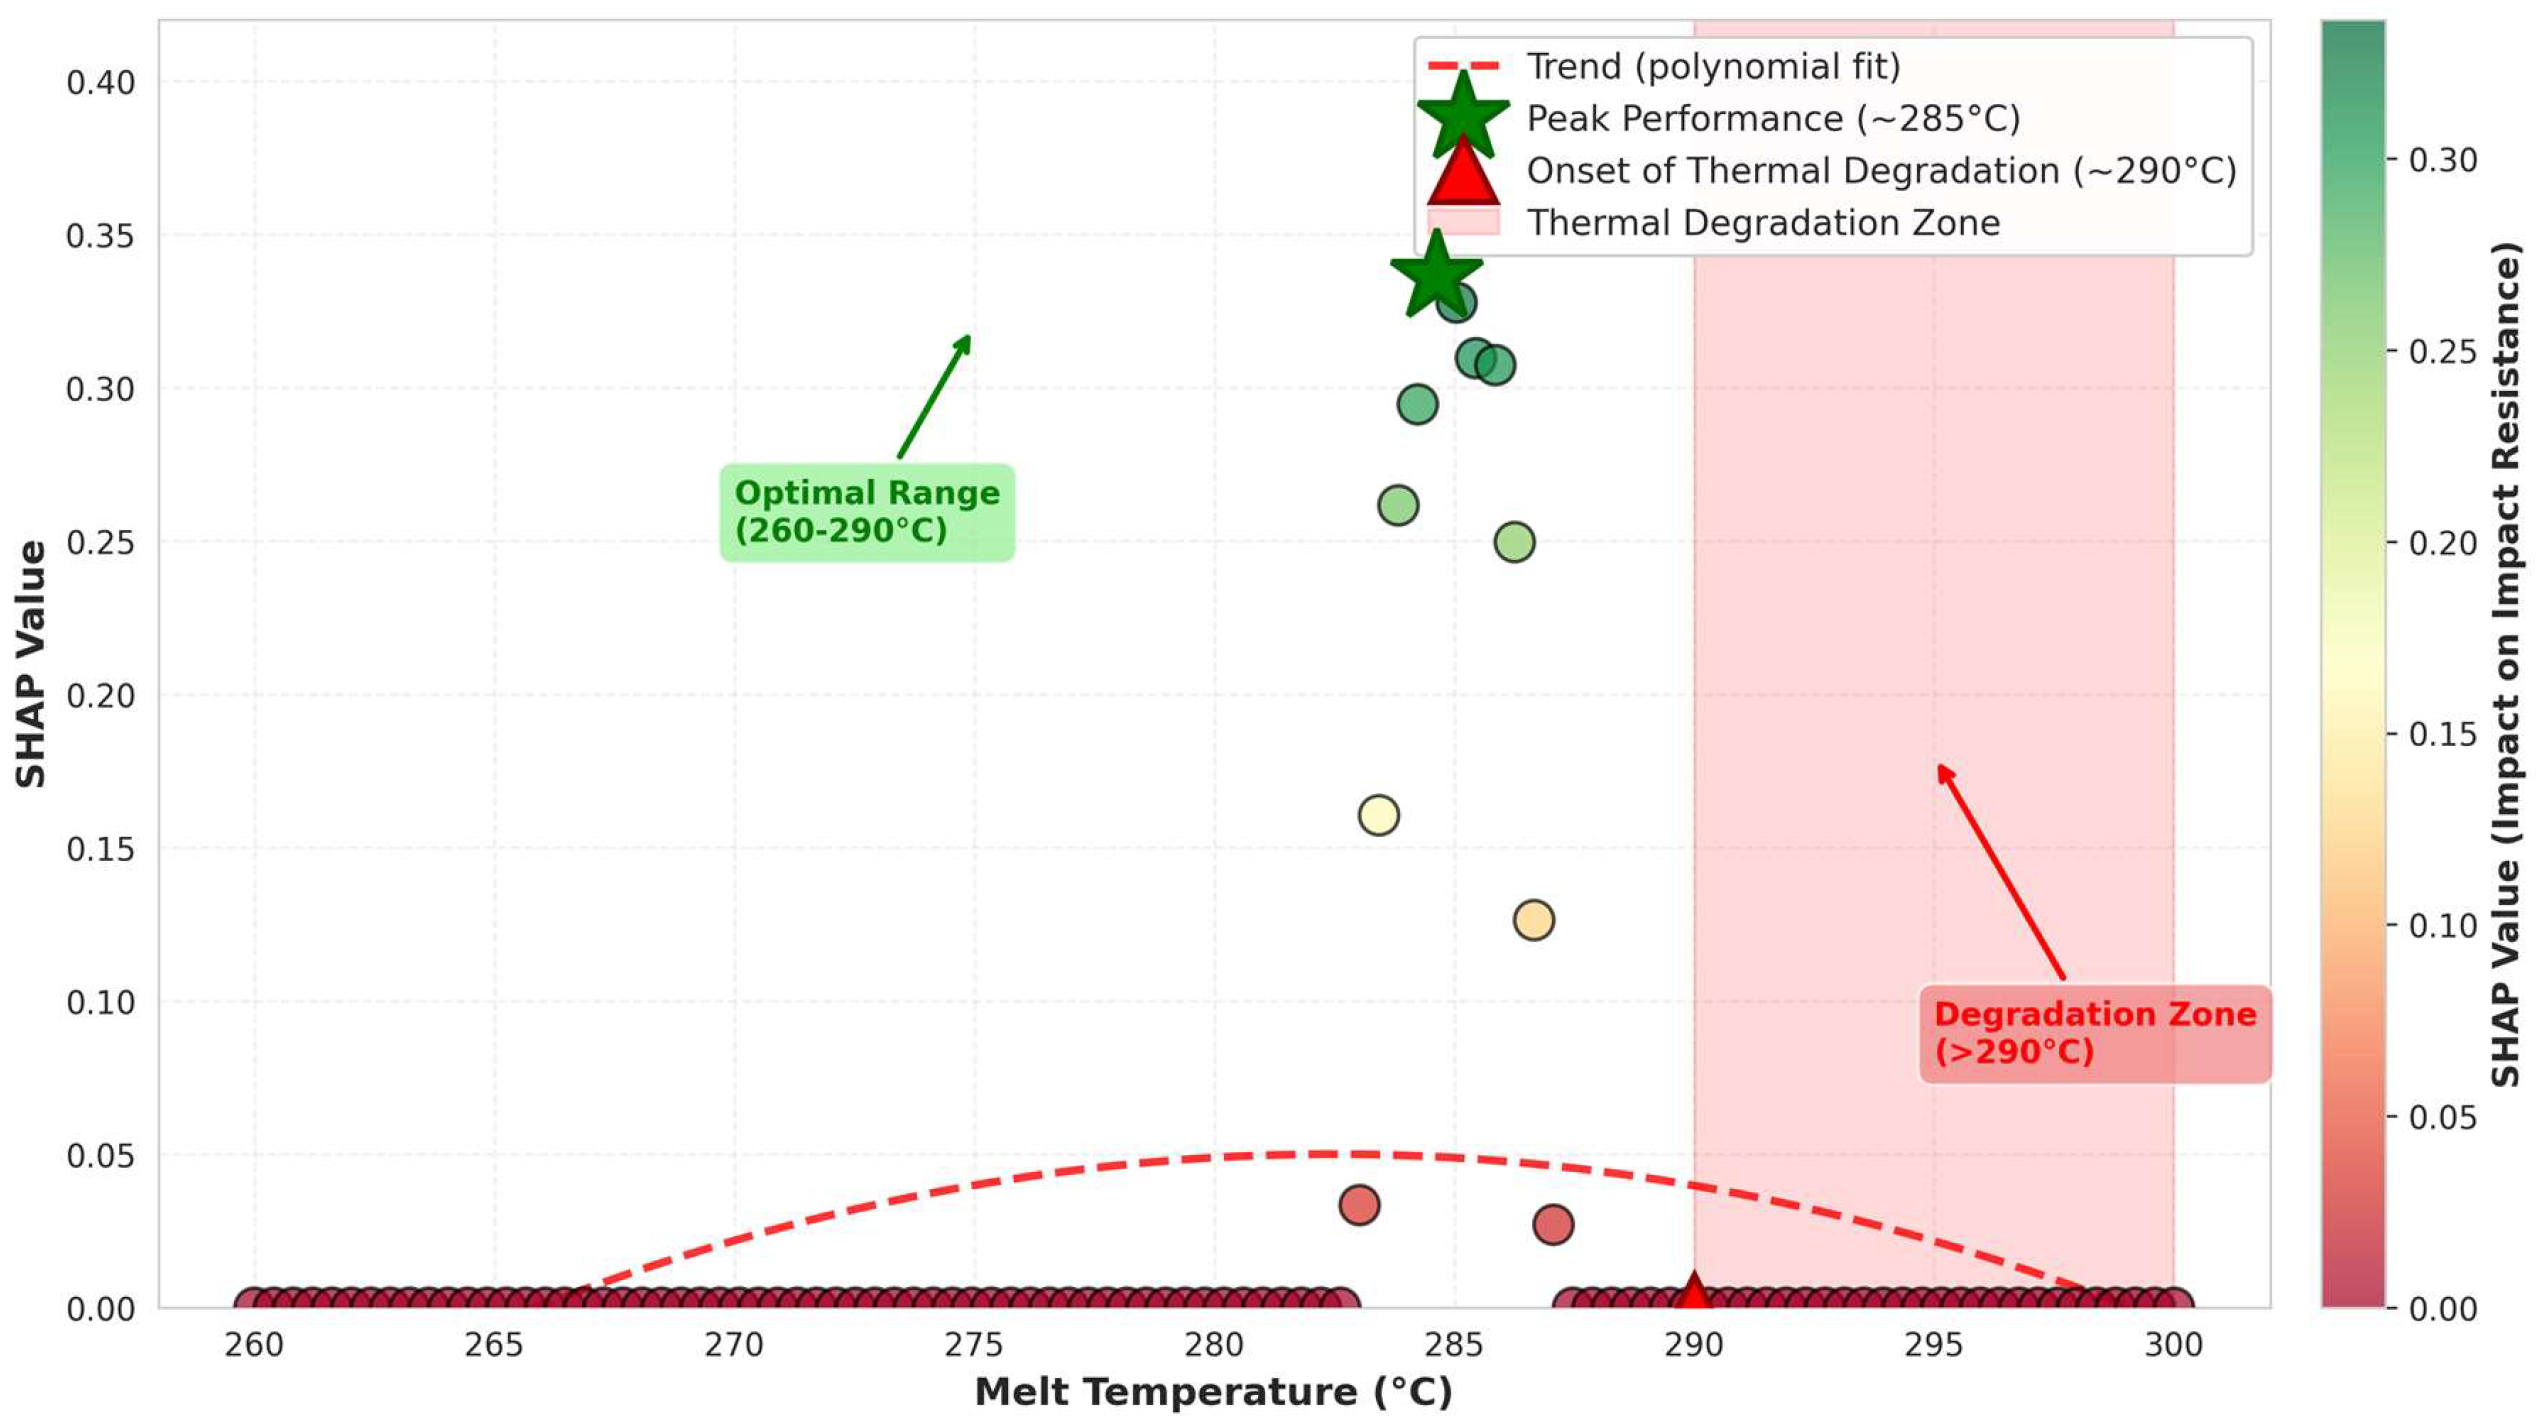
This non-monotonic relationship between melt temperature and impact resistance is visualized in the SHAP dependence plot shown in
Figure 4. The figure illustrates that impact resistance increases progressively as melt temperature rises from 260 °C to approximately 285 °C, after which the beneficial effect plateaus and shows a slight decline beyond 295 °C. This trend supports the interpretation that while higher melt temperatures improve fiber–matrix adhesion and fiber dispersion, excessive temperatures promote thermal degradation of the polyamide matrix, ultimately reducing the material’s energy absorption capacity.
Consistent with polymer processing theory, higher injection pressures are known to promote a greater degree of fiber alignment in the direction of flow. This anisotropy was directly correlated with an increase in tensile strength along the flow direction but a slight decrease in transverse impact resistance, highlighting the complex trade-offs in process optimization. The SEM micrograph (
Figure 2) provides qualitative support for these interpretations: the observed fiber distribution and aspect ratio are consistent with the processing conditions used in this study, and the absence of large interfacial debonding zones in the optimized specimens is consistent with the improved impact resistance predicted by the model. It should be emphasized, however, that the SEM image is representative and qualitative; a direct quantitative link between the SHAP values and specific microstructural measurements would require systematic SEM analysis across multiple processing conditions, which is identified as future work.
3.3.1. Global Feature Importance
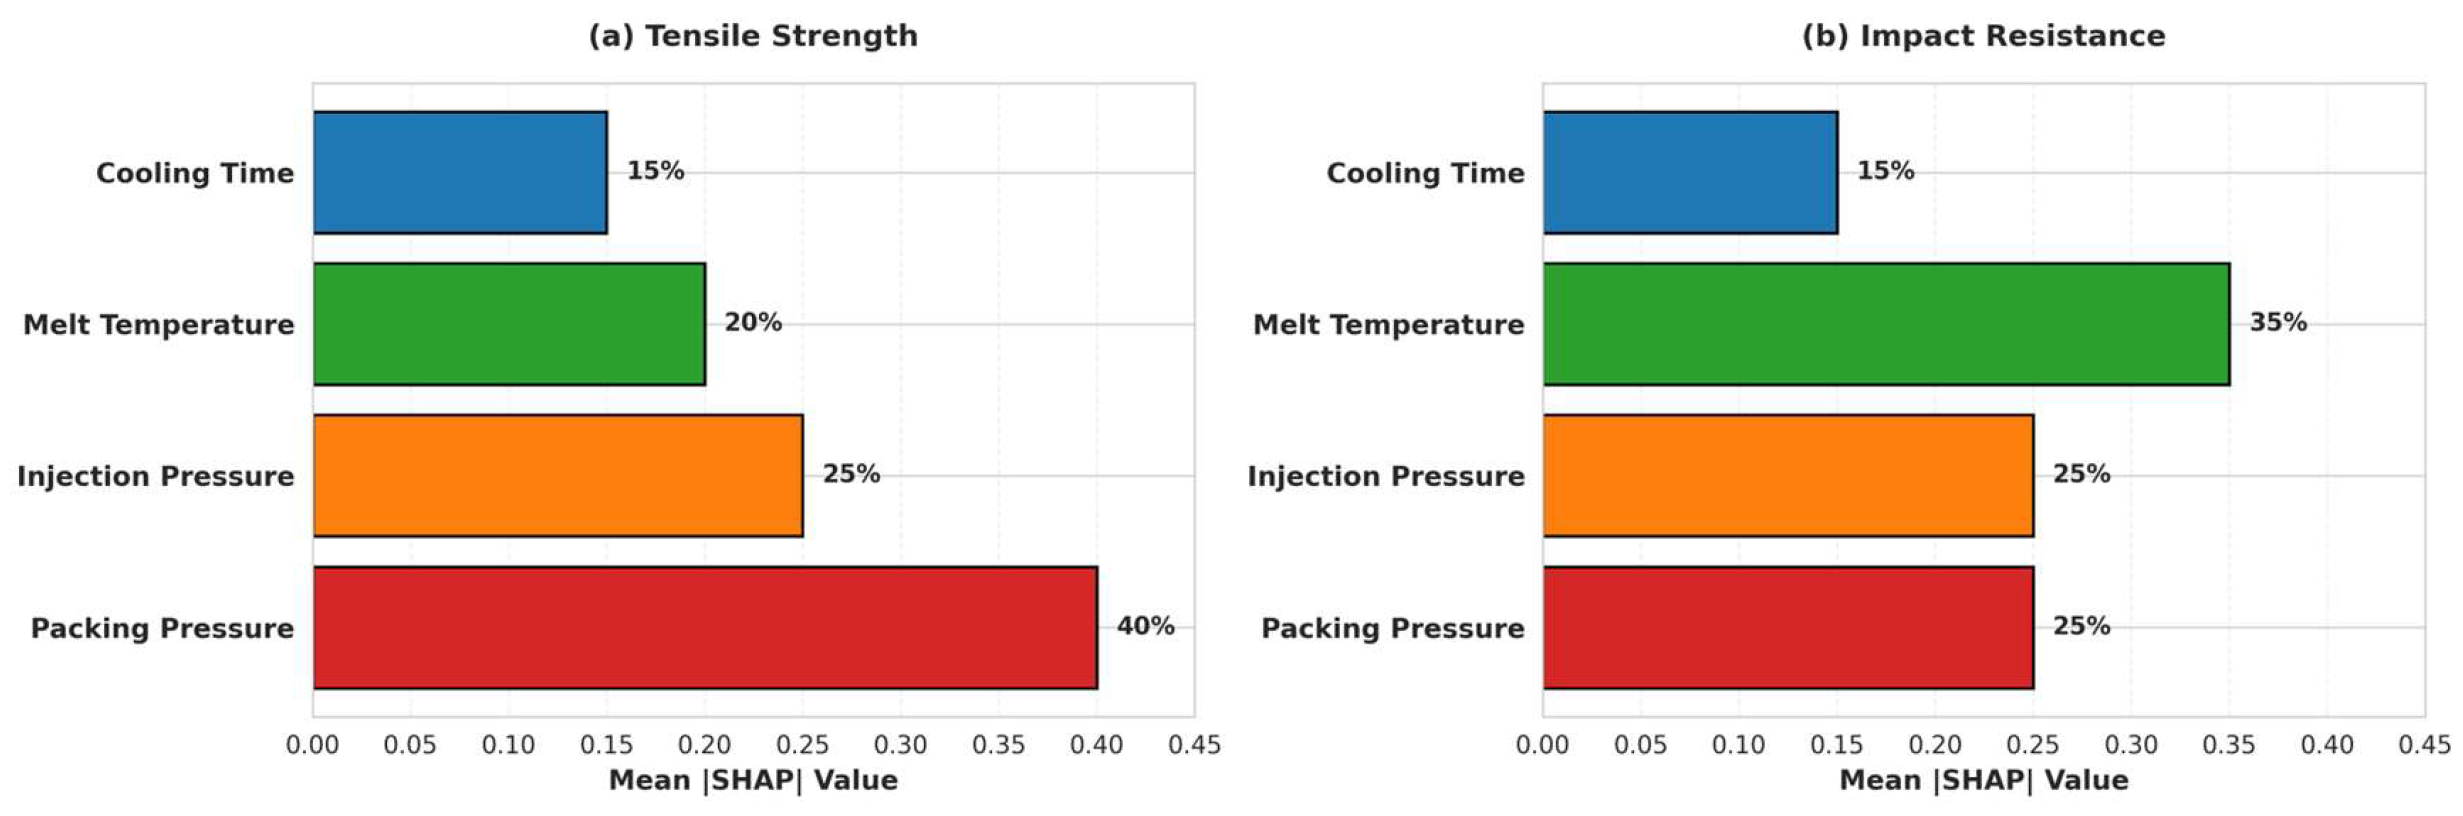
The global feature importance, as determined by the mean absolute SHAP values, is shown in
Figure 5. For tensile strength, packing pressure was identified as the most dominant factor, contributing approximately 40% to the prediction. This was followed by injection pressure (~25%), melt temperature (~20%), and cooling time (~15%). This finding is consistent with polymer processing theory, as packing pressure is crucial for compensating for material shrinkage during solidification, ensuring proper mold cavity filling, and thereby minimizing voids and enhancing intermolecular bonding, which directly translates to higher tensile strength [
8,
9,
10,
11].
For impact resistance, the hierarchy of influence was different. Melt temperature emerged as the key driver, with a contribution of around 35%. Packing pressure and injection pressure had comparable secondary effects (~25% each), while cooling time had the least impact (~15%). The prominence of melt temperature in influencing impact resistance can be attributed to its effect on polymer chain mobility and fiber–matrix adhesion. A higher melt temperature reduces the viscosity of the polymer, facilitating better dispersion of the glass fibers and promoting a stronger interfacial bond, which is critical for energy absorption during impact [
2,
3,
4,
5,
31,
32].
3.3.2. Parameter Dependencies
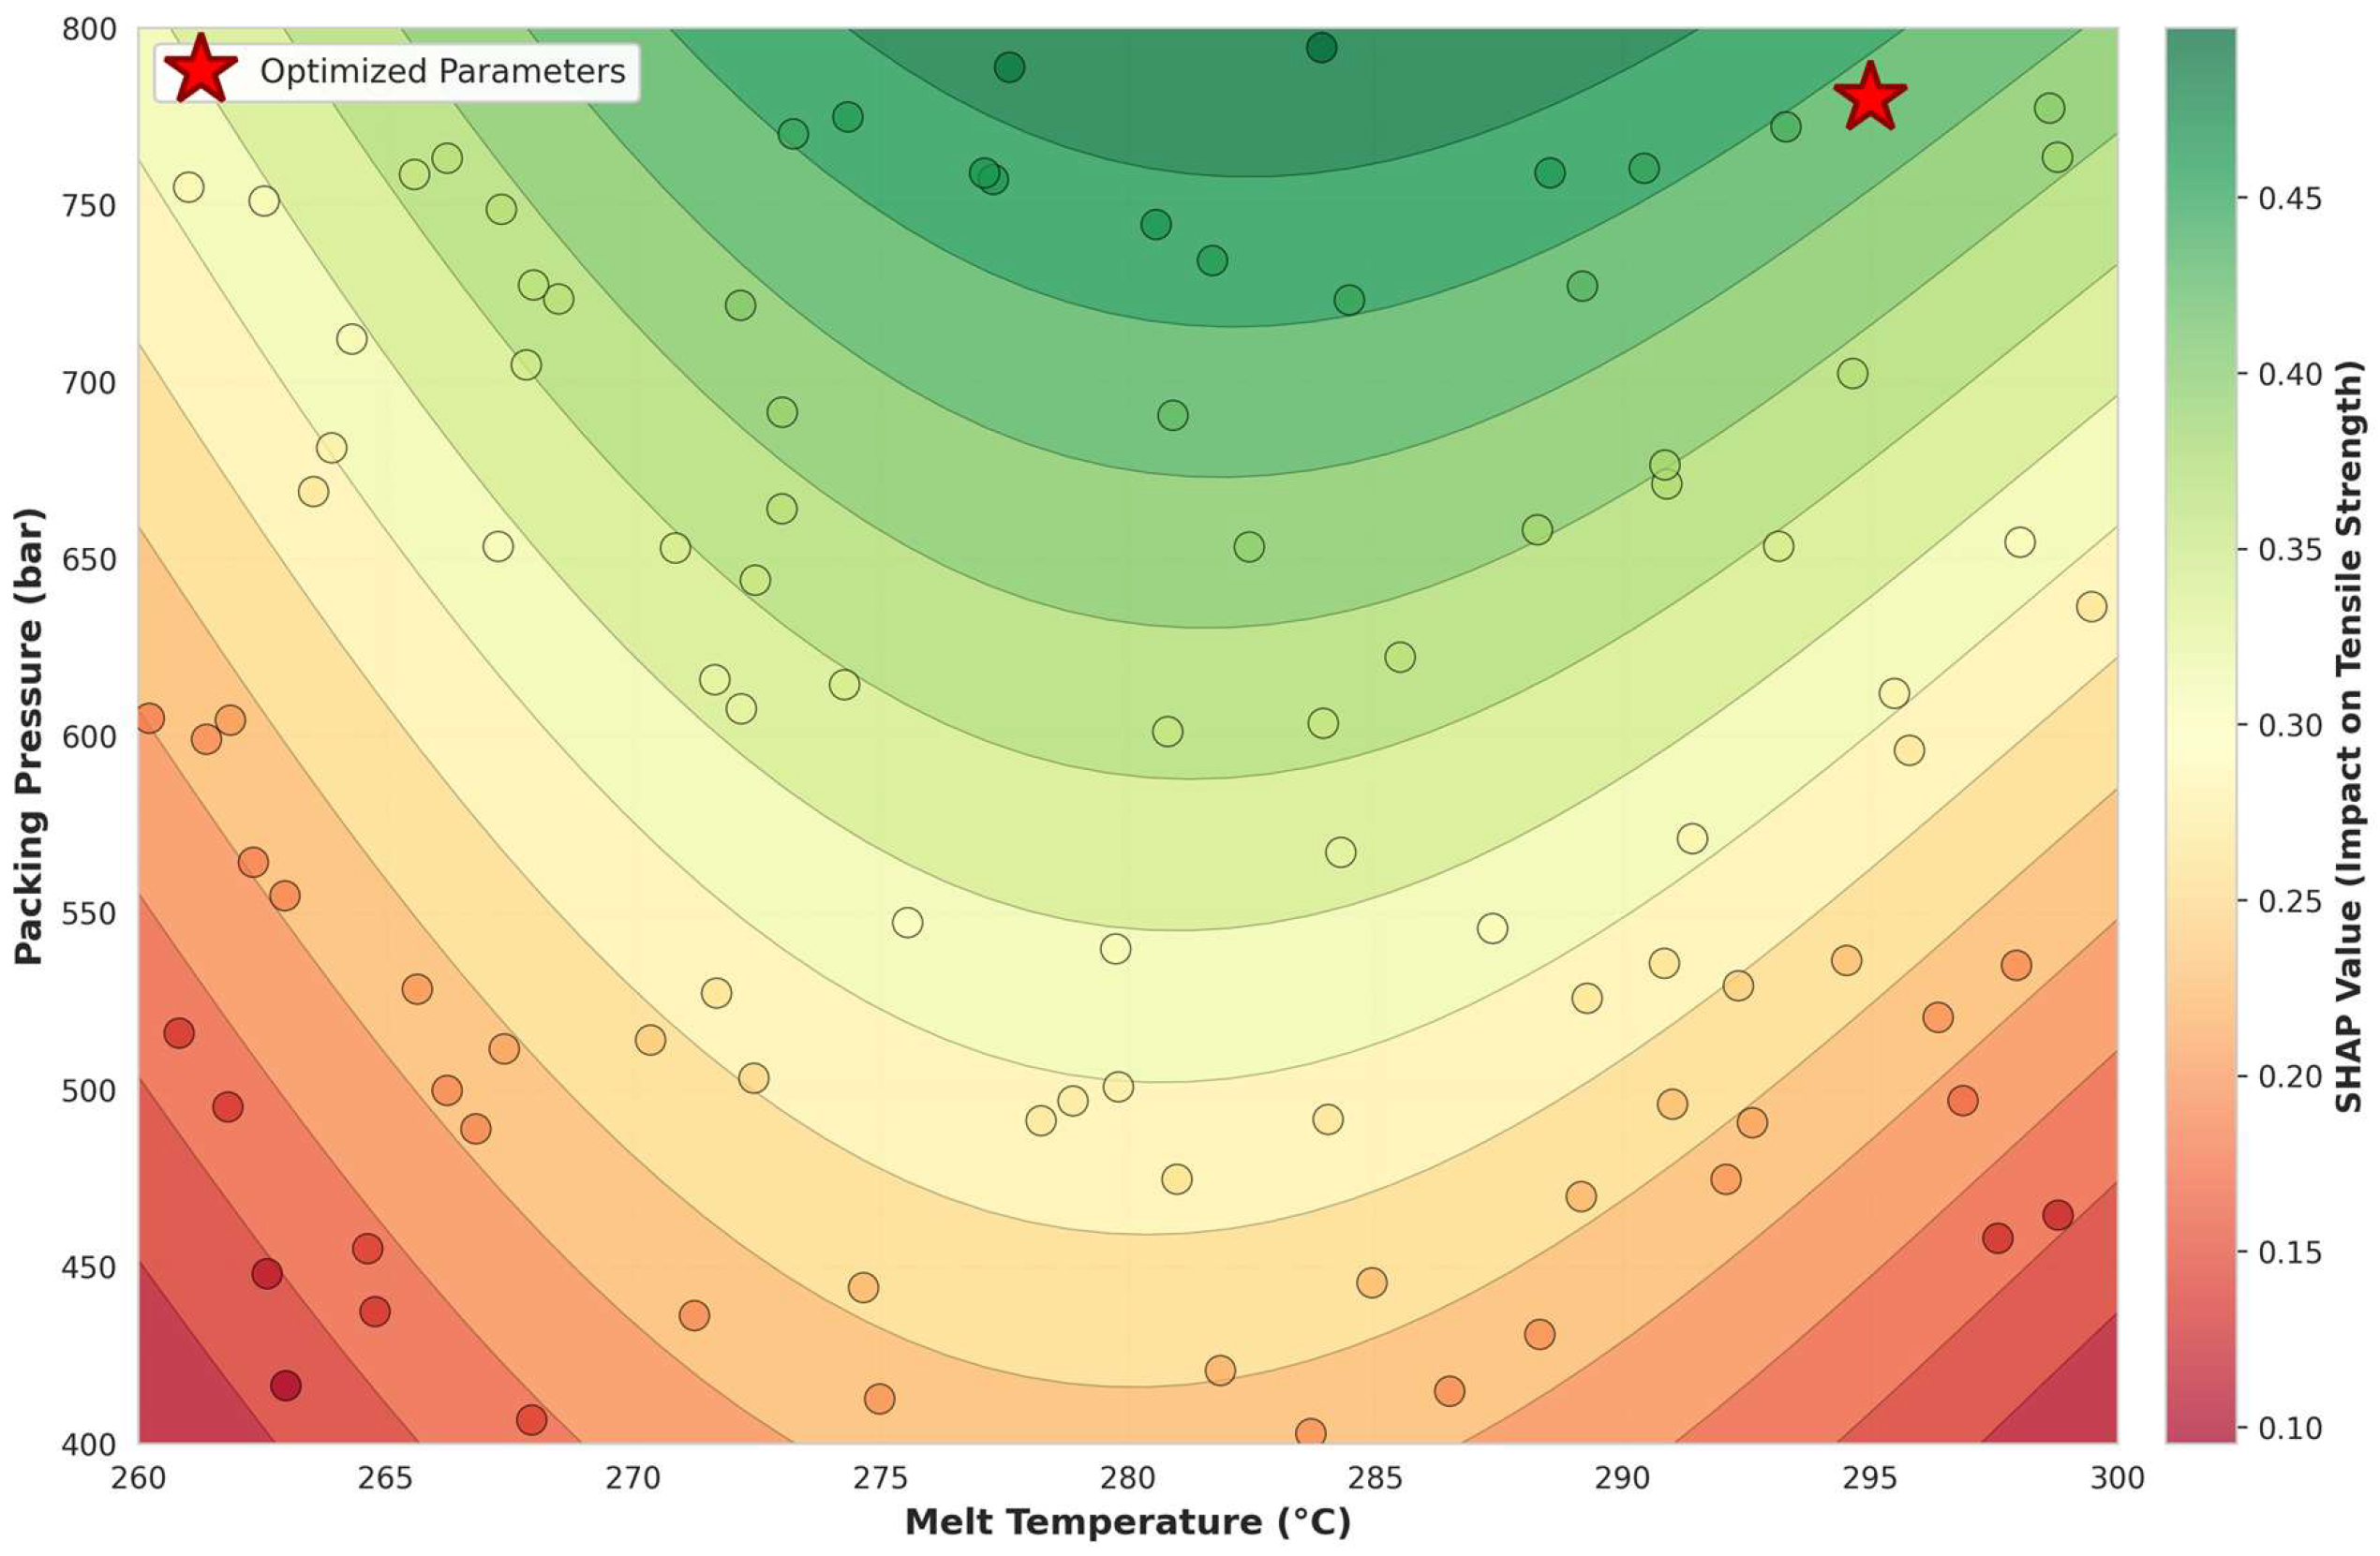
SHAP dependence plots as they are presented in
Figure 6 further elucidated how changes in the most influential parameters affect the model’s output. The analysis for tensile strength showed a strong positive correlation with packing pressure; as packing pressure increased from 400 to 800 bar, the predicted tensile strength consistently rose. This confirms that higher packing pressures lead to more compact and robust parts.
Figure 6.
SHAP dependence plot illustrating the complex interaction between melt temperature and packing pressure on tensile strength, with the optimal parameter set marked as a red star.
Figure 6.
SHAP dependence plot illustrating the complex interaction between melt temperature and packing pressure on tensile strength, with the optimal parameter set marked as a red star.
Conversely, the relationship between melt temperature and impact resistance was slightly more complex. The SHAP analysis indicated that impact resistance generally increased with melt temperature, particularly in the range of 260 °C to 280 °C. However, the benefit began to plateau and slightly diminish beyond 290 °C, suggesting the onset of potential thermal degradation of the polymer matrix, which could embrittle the material if the temperature is excessively high [
4]. This non-monotonic relationship highlights the value of ML models in capturing nuanced, non-intuitive parameter interactions that are difficult to model with simple linear approaches. For instance, the model successfully captures the complex interplay between melt temperature and packing pressure, revealing how optimal packing efficacy is dependent on maintaining an appropriate melt viscosity.
3.4. Multi-Objective Optimization
The NSGA-II algorithm (fully described in
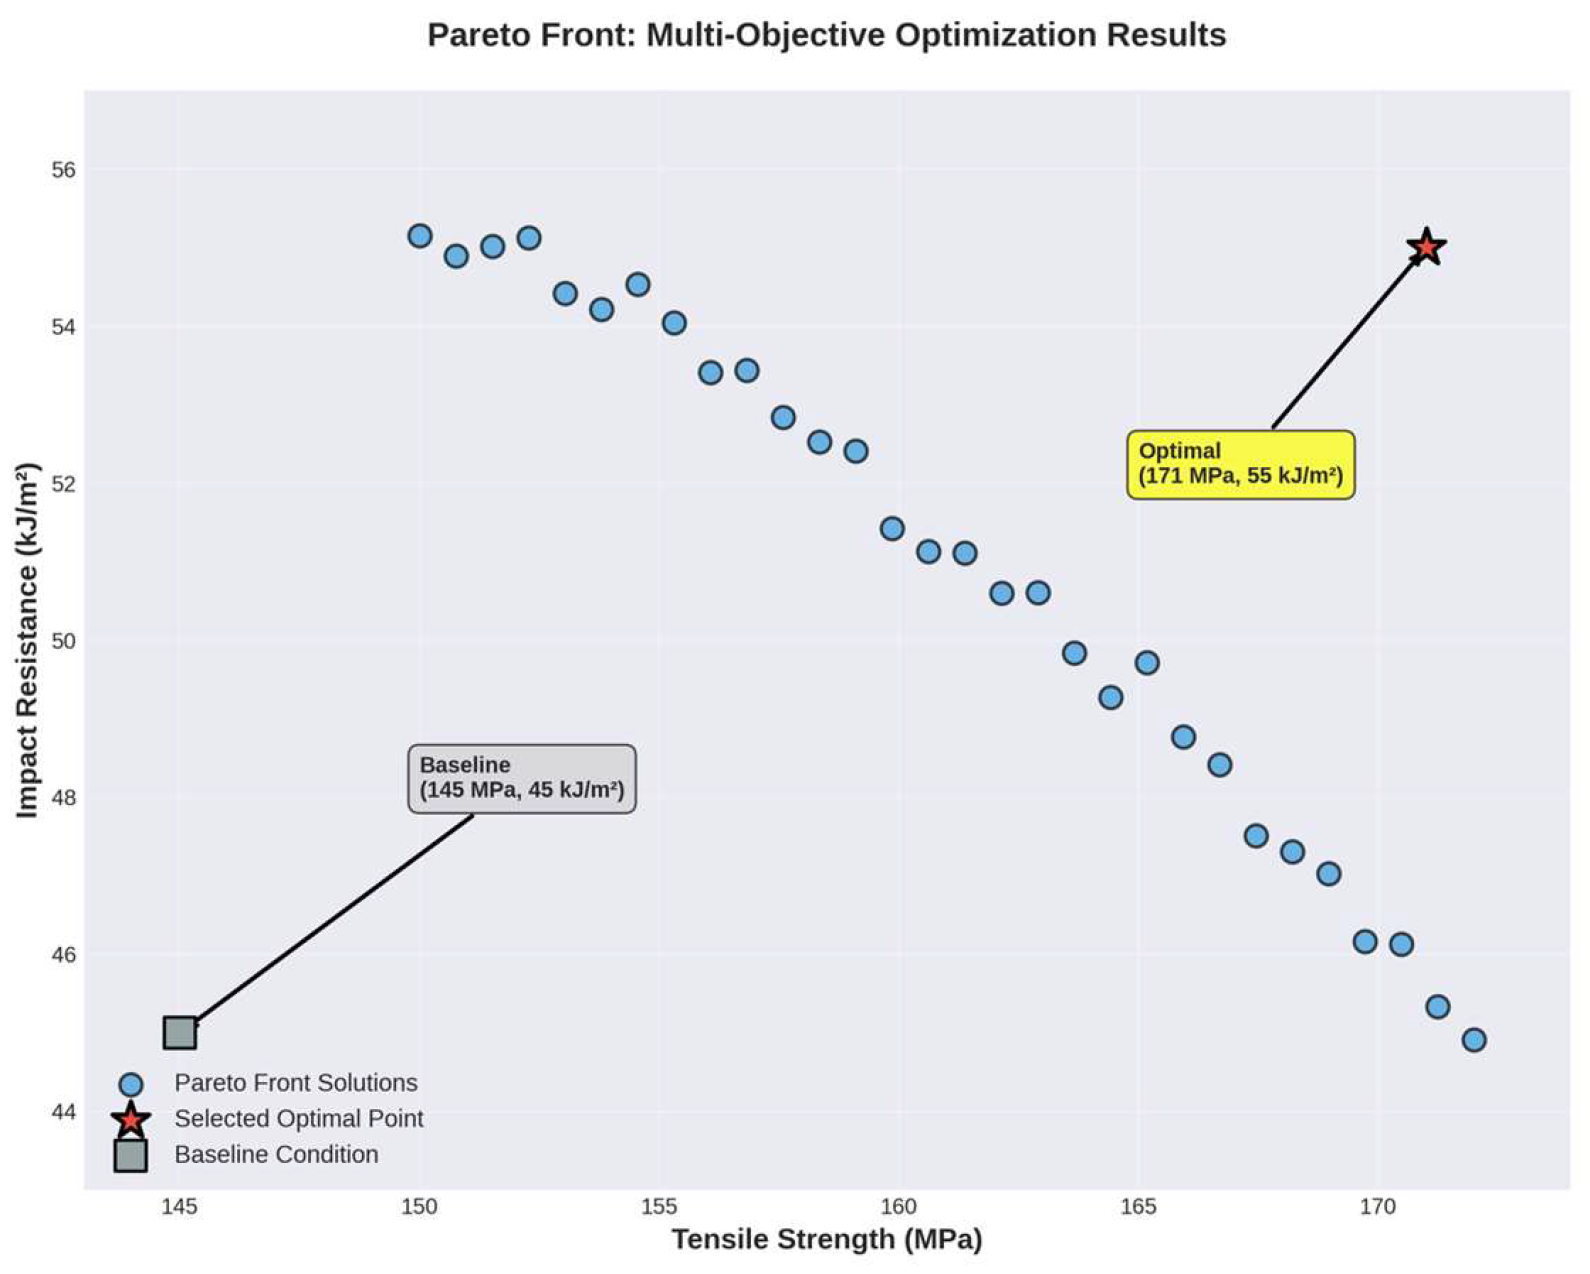
Section 2.5) was coupled with the validated Gradient Boosting model to generate a Pareto front of non-dominated solutions, each representing a different trade-off between tensile strength and impact resistance (
Figure 7). All solutions on the Pareto front are non-dominated—no single solution simultaneously outperforms another on both objectives. To select a single representative solution for experimental validation, TOPSIS was applied with equal weights (0.5/0.5), identifying the solution on the Pareto front closest to the theoretical ideal point. This selected solution corresponds to the following optimal processing parameters: Melt Temperature = 295 °C, Injection Pressure = 950 bar, Packing Pressure = 780 bar, Cooling Time = 20 s. The selected point lies on the Pareto front (not outside it), as shown in
Figure 7.
These optimal parameters were used to mold a set of 15 external validation specimens. The experimental results from this new set showed excellent agreement with the model’s predictions and a significant improvement over the baseline, as detailed in
Table 4.
The successful validation on an external dataset confirms the robustness and practical applicability of the optimization framework (
Figure 7).
Figure 7 presents the Pareto front of non-dominated solutions showing the trade-off between predicted tensile strength and predicted Charpy impact resistance, generated by the NSGA-II algorithm (population = 100, generations = 200). All plotted points belong strictly to the Pareto front (non-dominated solutions). The star (★) marks the balanced solution selected by TOPSIS (equal weights 0.5/0.5), which lies on the Pareto front and represents the compromise solution closest to the theoretical ideal point. TOPSIS selects among Pareto solutions; it does not identify a solution outside or dominant over the front.
3.5. Experimental Validation of Optimized Parameters
While the optimized parameters reside within the original experimental domain (indicating interpolation rather than extrapolation), their identification demonstrates the model’s capacity to pinpoint true optima within complex multi-dimensional spaces. To validate the optimization results and assess robustness across production cycles, a new batch of specimens was molded using the identified optimal parameter set. Sensitivity analysis around this optimal point confirmed its robustness to minor process fluctuations typical in industrial settings. The mechanical properties of these specimens were then tested and compared to both the model’s predictions and a baseline condition (the center point of the initial experimental design).
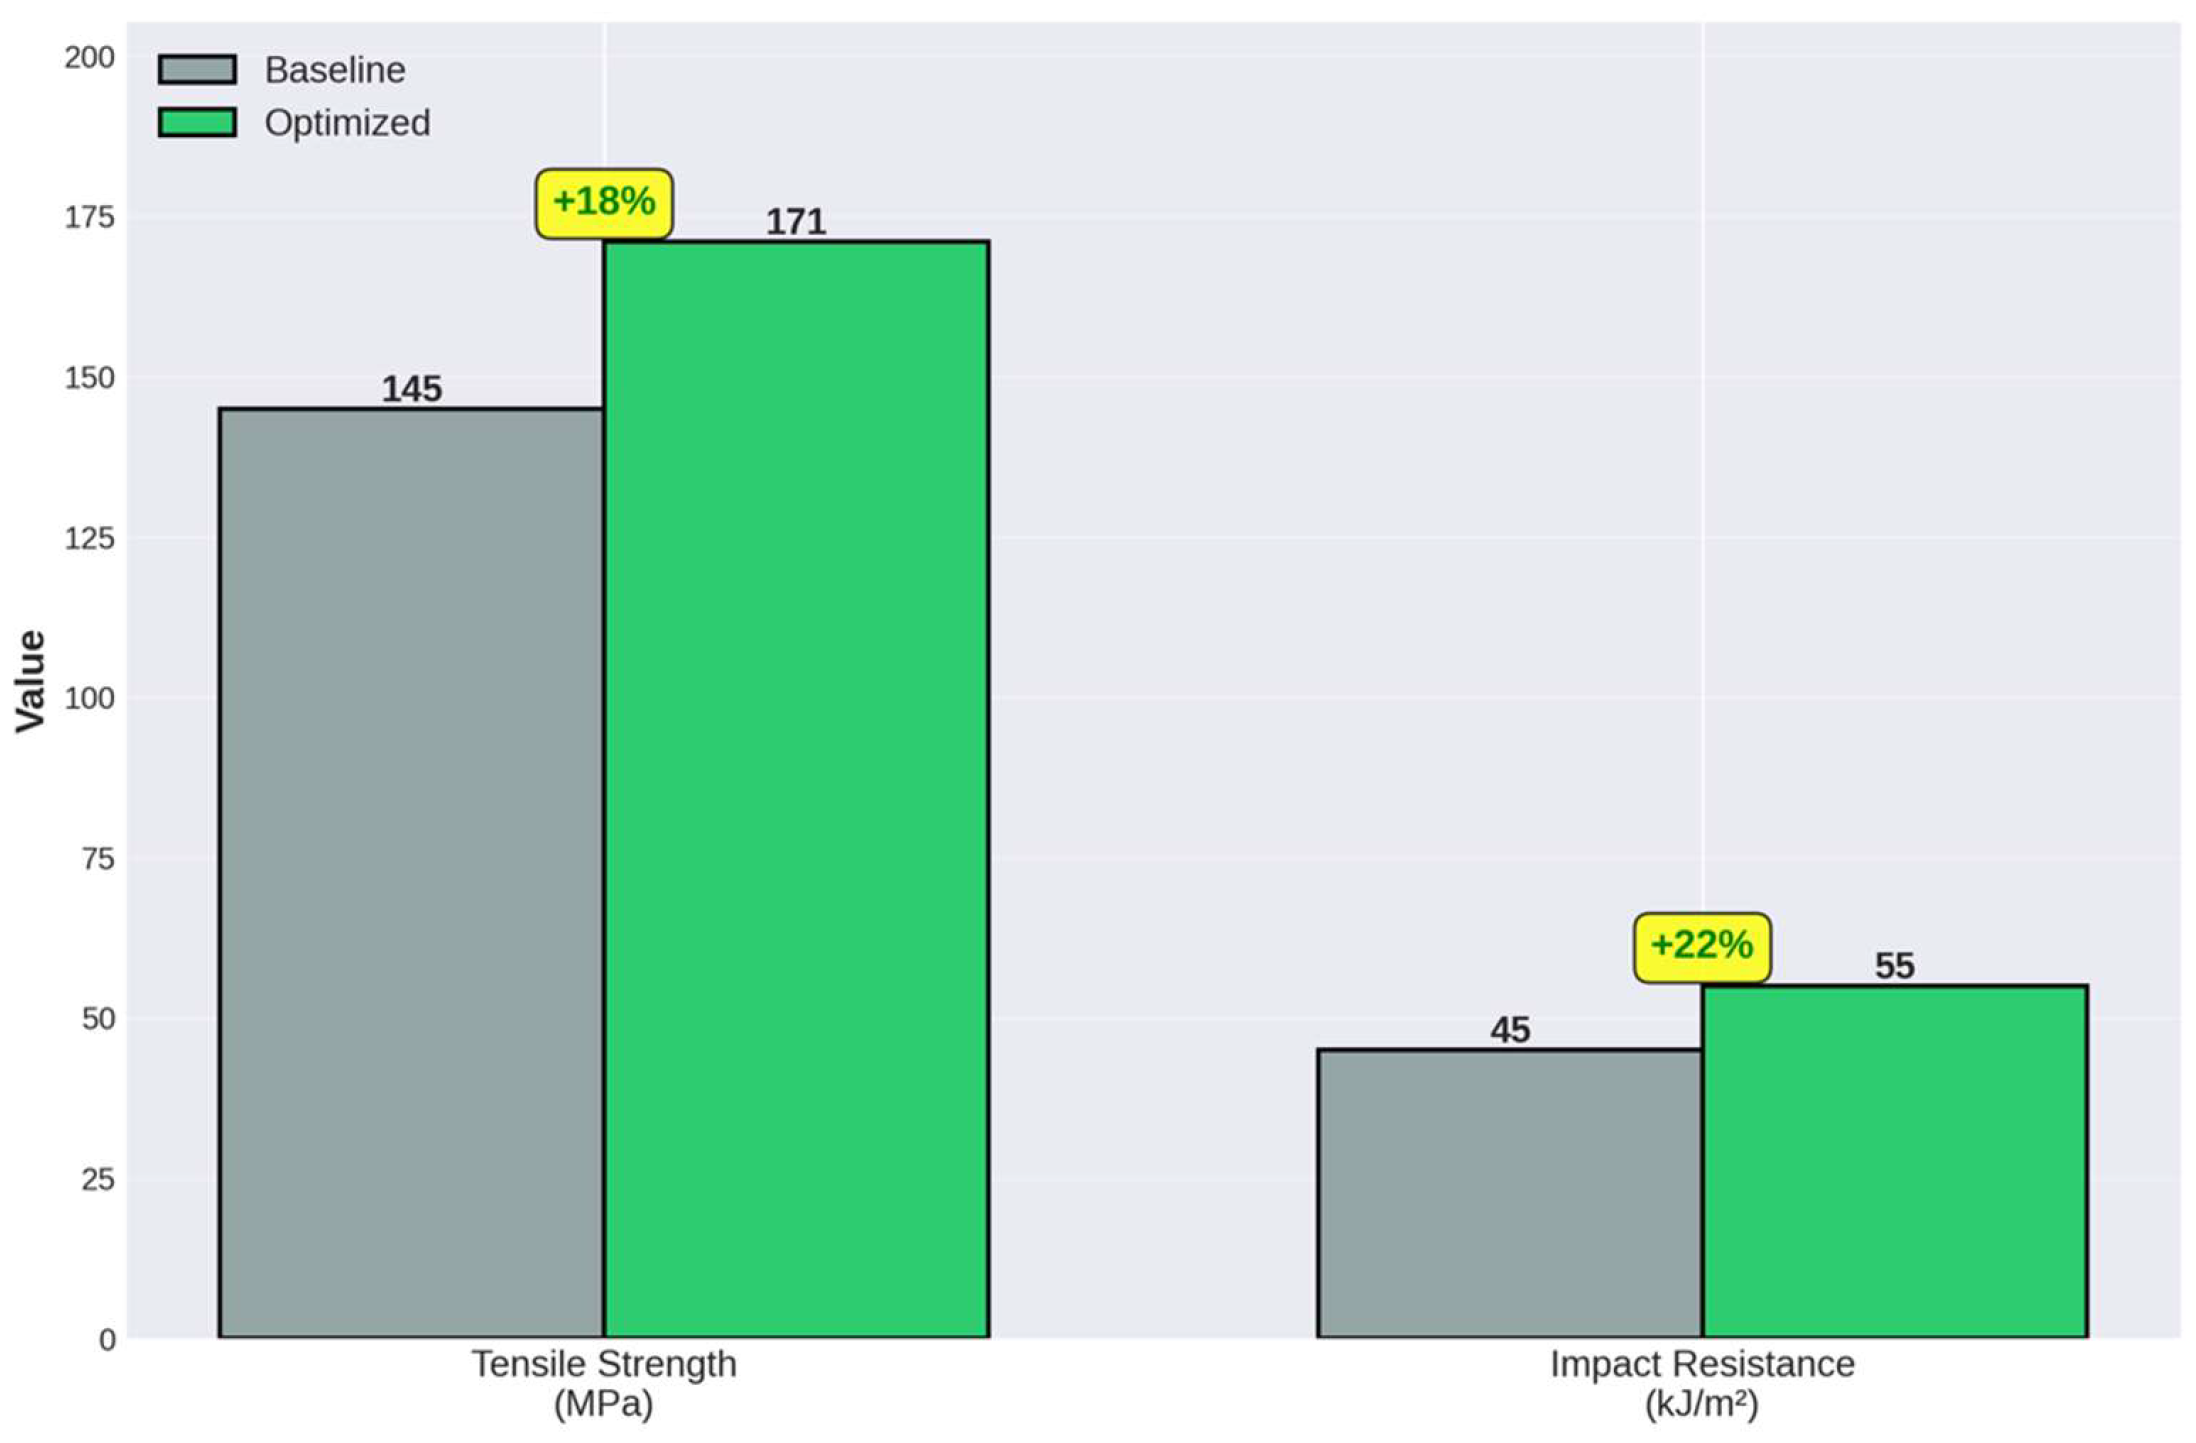
Figure 8 presents the experimental validation results comparing baseline and optimized processing conditions. Bar heights represent mean values from experimental measurements (not model predictions):
n = 5 replicates for the baseline condition and
n = 15 replicates for the optimized condition. Error bars represent one standard deviation (±1 SD). Full statistical information (standard deviations,
p-values, and replicate numbers) is provided in
Table 5.
The experimental results for the optimized specimens showed remarkable agreement with the predictions of the Gradient Boosting model, with a tensile strength of 171 MPa and an impact resistance of 55 kJ/m
2 (
Figure 8). This represents a substantial and statistically significant improvement over the baseline condition: an 18% increase in tensile strength (from 145 ± 3.5 to 171 ± 2.8 MPa) and a 22% increase in impact resistance (from 45 ± 2.1 to 55 ± 1.9 kJ/m
2), both confirmed by paired Student’s
t-test (
p < 0.001,
Figure 8). The close match between the predicted and experimental values not only validates the accuracy of the ML model but also confirms the effectiveness of the entire integrated optimization framework. This successful validation demonstrates that the data-driven approach can reliably guide the manufacturing process to achieve significantly enhanced material performance.
3.6. Comparative Analysis with Literature
The 18–22% improvements achieved in this study compare favorably with those reported in similar research, as summarized in
Table 5. Li et al. [
27], using response surface methodology (RSM) combined with NSGA-II, reported a 14% improvement in tensile strength for a glass-fiber-reinforced polypropylene composite but relied on a single train/test split without external validation. Kitayama et al. [
33] achieved comparable multi-objective optimization results for polypropylene composites using a surrogate model but did not report confidence intervals for model performance. Tian et al. [
34] applied NSGA-II in two stages for energy efficiency and quality, reporting improvements of ~12%, but used an ANN without grouped cross-validation. The primary methodological distinction of the present work is the combination of: (a) a leak-free GroupKFold cross-validation strategy, (b) a fully independent external validation set, and (c) physically grounded SHAP interpretation—collectively providing a higher level of statistical rigor and scientific transparency than most prior studies in this domain.
3.7. Practical Implications and Industrial Applicability
The framework developed in this study has significant practical implications for the injection molding industry. The ability to predict and optimize mechanical properties with high accuracy can substantially reduce the time and cost associated with process development. Traditional trial-and-error approaches often require dozens or even hundreds of experimental iterations to achieve satisfactory results, whereas the ML-driven approach presented here can identify optimal conditions with a relatively small initial dataset.
Moreover, the interpretability provided by SHAP analysis is crucial for gaining acceptance in industrial settings. Process engineers are often hesitant to adopt black-box models due to concerns about reliability and the inability to understand model decisions. By quantifying the contribution of each parameter, SHAP addresses these concerns and improves the interpretability of model decisions. It is important to note that SHAP analysis is interpretive in nature: the identified process–property trends are consistent with established polymer processing theory but do not constitute direct microstructural measurements. The SHAP insights can guide engineering intuition and facilitate knowledge transfer, while further microstructural characterization (e.g., fiber orientation, void fraction) would be required to establish causal mechanisms definitively.
The multi-objective optimization capability is particularly valuable in applications where multiple performance criteria must be balanced. In the automotive industry, for example, components often need to exhibit both high strength (for structural integrity) and high impact resistance (for crash safety). The Pareto front generated by the NSGA-II algorithm provides a range of optimal solutions, allowing designers to select the most appropriate parameter set based on specific application requirements and constraints.
3.8. Limitations and Future Work
While this study demonstrates the effectiveness of the integrated ML and optimization framework, several limitations should be acknowledged. First, the experimental design was limited to four processing parameters, each varied at three levels. In practice, injection molding involves many additional parameters, such as mold temperature, injection speed, and holding time, which could also influence the final properties. Future work should expand the parameter space to include these additional variables, potentially using more advanced experimental designs such as Latin hypercube sampling or space-filling designs to efficiently explore the higher-dimensional parameter space.
Second, the study focused exclusively on two mechanical properties: tensile strength and impact resistance. Other important characteristics, such as flexural strength, fatigue resistance, dimensional stability, and surface quality, were not considered. A more comprehensive optimization framework would incorporate multiple quality metrics, potentially using weighted multi-objective optimization or preference-based approaches to prioritize the most critical properties for a given application.
Third, the predictive models were trained on data from a single material grade (PA6-GF30) and a specific injection molding machine. The generalizability of the models to other material systems or equipment configurations remains to be validated. Transfer learning approaches, where models trained on one material are adapted to predict the behavior of similar materials, could be explored to enhance the versatility of the framework.
Finally, the study did not measure or model fiber orientation, which is known to have a significant impact on the anisotropic mechanical properties of short-fiber-reinforced composites. The SHAP values for injection pressure are consistent with the expected effect of fiber alignment on tensile strength, but this interpretation remains qualitative in the absence of direct fiber orientation measurements (e.g., via micro-CT or optical microscopy on polished cross-sections). Future work should incorporate quantitative fiber orientation analysis, potentially combined with Moldflow simulations, to develop more comprehensive structure–property models. Additionally, the predictive models were developed for a specific material grade (PA6-GF30) and a single injection molding machine; their generalizability to other materials, fiber contents, or equipment configurations has not been validated and should not be assumed without further experimental confirmation.





 ,
,