Error in Figure
In the original publication [1], there was a mistake in “Figures 7a, 8a and 9a” as published. “During write-up, the percentage values in the original data for Figure 7a (Dispersion factor: 12.09%, 10.35%, 8.36%, 10.10%, 10.17%; Qualified rate of pelletizing: 79%, 86%, 93%, 90%, 76%) were incorrectly presented in decimal form partially when converted to images (Dispersion factor: 0.1209, 0.1035, 0.0836, 0.1010, 0.1017; Qualified rate of pelletizing: 0.79, 0.86, 0.90, 0.76) instead of all data being shown as percentages (e.g., 93%). In Figure 8a, pPercentage values in the original data (Dispersion factor: 11.65%, 11.72%, 10.83%, 12.65%, 16.83%; Qualified rate of pelletizing: 86%, 91%, 96%, 92%, 89%) were incorrectly expressed as decimals when converted to pictures (Dispersion factor: 0.1165, 0.1172, 0.1083, 0.1265, 0.1683; Qualified rate of pelletizing: 0.86, 0.91, 0.96, 0.92, 0.89). In Figure 9a, pPercentage values in the original data (Dispersion factor: 13.15%, 12.67%, 11.68%, 12.39%, 12.65%; Qualified rate of pelletizing: 87%, 89%, 91%, 90%, 85%) were also incorrectly represented as decimals when converted to pictures (Dispersion factor: 0.1315, 0.1267, 0.1168, 0.1239, 0.1265; Qualified rate of pelletizing: 0.87, 0.89, 0.91, 0.90, 0.85)”. The corrected “Figure 7, Figure 8 and Figure 9” appear below. The authors state that the scientific conclusions are unaffected. This correction was approved by the Academic Editor. The original publication has also been updated.
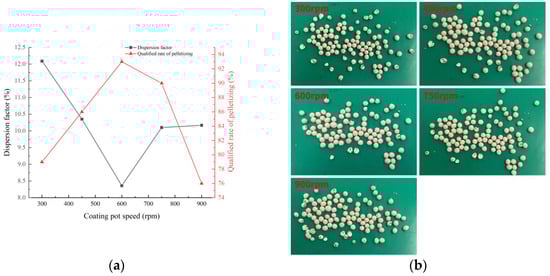
Figure 7.
Experimental verification of the effect of coating pot speed on mixing uniformity: (a) Simulation graph; (b) Physical test chart.
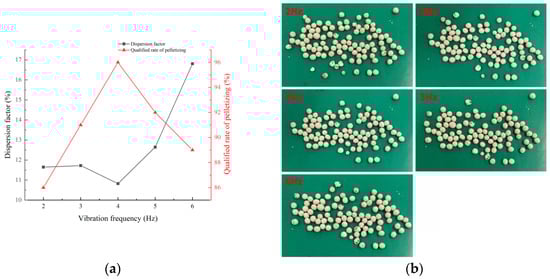
Figure 8.
Experimental verification of the effect of vibration frequency on mixing uniformity: (a) Simulation graph; (b) Physical test chart.
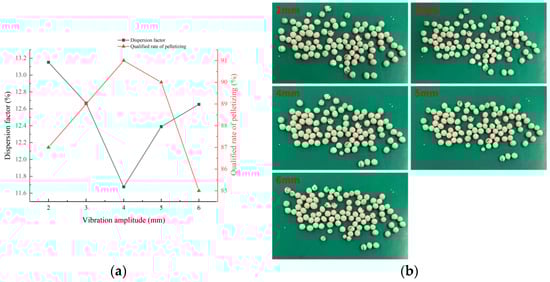
Figure 9.
Experimental verification of the effect of vibration amplitude on mixing uniformity: (a) Simulation graph; (b) Physical test chart.
Reference
- Guo, M.; Cai, X.; Ma, X.; Hou, Z.; Tong, X.; Liu, H. Numerical Simulation and Experiment on Pill Coating of Red Clover Seeds under the Action of Vibrating Force Field. Processes 2023, 11, 2551. [Google Scholar] [CrossRef]
Disclaimer/Publisher’s Note: The statements, opinions and data contained in all publications are solely those of the individual author(s) and contributor(s) and not of MDPI and/or the editor(s). MDPI and/or the editor(s) disclaim responsibility for any injury to people or property resulting from any ideas, methods, instructions or products referred to in the content. |
© 2024 by the authors. Licensee MDPI, Basel, Switzerland. This article is an open access article distributed under the terms and conditions of the Creative Commons Attribution (CC BY) license (https://creativecommons.org/licenses/by/4.0/).