Abstract
In this research, we attempted to fit a trading system based on polynomial moving regression bands (MRB) to Nasdaq100 stocks from 2017 till the end of March 2024. Since stocks movement does not follow a linear behavior, we used multiple degree polynomial regression models to identify the stocks’ trends and two standard deviations from the regression model to generate the trading signals. This way, the MRB was transformed into a momentum indicator designed to identify strong uptrends that can be used by a fully automated trading system. Our results indicate that the behavior of Nasdaq100 stocks can be tracked using all three examined polynomial models and can be traded profitably using fully automated systems based on those models. The best performing model was the model that used a four-degree polynomial MRB achieving the highest average net profit (USD 162.73). Regarding the risks involved, the third model has the lowest loss in dollar value (USD −95.52), and the highest minimum percent of profitable trades (41.51%) and profit factor (0.55) that indicates that this strategy is relatively less risky than the other two strategies.
1. Introduction
Predicting stock movements is a crucial area of research in finance and investment. Various studies have explored the use of regression models in forecasting stock prices. Regression models are employed to predict stock price movements, such as the closing price of a stock, based on historical data and other relevant variables. These models can assist investors in decision-making processes like buying, selling, or holding stocks. Different regression techniques have been utilized in stock price prediction. For instance, logistic regression has been used to establish the relationship between daily stock movement and trading volumes over a specific period (). Additionally, support vector regression (SVR) and K-nearest neighbor (KNN) regression are popular machine learning techniques applied in stock price prediction (). Moreover, studies have compared the performance of classification models and level estimation models in predicting stock market movements. Classification models like discriminant analysis and neural networks have shown better results in predicting the direction of stock market movements compared to level estimation models like exponential smoothing and multivariate transfer functions (). In the context of stock market prediction, regression models are often combined with other techniques such as deep learning, natural language processing, and ensemble learning to enhance predictive accuracy (). These combinations allow for a more comprehensive analysis of stock price movements and trends.
The moving regression band (MRB) trading system is a technical analysis tool that combines linear regression and moving averages to identify market trends and potential reversal points. It consists of a linear regression line, which represents the direction of the trend, and upper and lower bands plotted at a specified number of standard deviations from the regression line, serving as dynamic support and resistance levels. The system generates trading signals based on the price’s position relative to these bands, with a buy signal triggered when the price touches or crosses the lower band in an uptrend. While effective in trend-following and providing clear signals, the system is a lagging indicator and may produce false signals in choppy markets. It is often used in conjunction with other technical analysis tools to enhance its reliability and can be applied to various financial instruments, including stocks, forex, and commodities. The width of the bands also provides information about market volatility, with wider bands indicating higher volatility and narrower bands suggesting lower volatility. Most former research has utilized linear regressions to predict the behavior of financial assets (; ). () was one of the first to use polynomial regression to predict three-month U.S. Treasury bills yields. Following his pioneering research, we make the first attempt to construct polynomial MRB trading systems and tested their performances upon Nasdaq100 stocks. Two, three, and four degrees of polynomial MRB were used to identify the daily behavior of those stocks and to determine the goodness of fit of each model to real data. No past research has used this methodology, and such an attempt contributes to the understanding of technological stocks’ behavior.
2. Literature Review
Algorithmic trading systems have attracted significant attention in recent years, with a growing body of literature exploring various aspects of this field. Researchers have delved into the competitive advantage in algorithmic trading, emphasizing the behavioral innovation economics approach and providing insights into the motivations driving these market actors. Research has shown that algorithmic trading can indeed enhance liquidity in markets (; ). Moreover, algorithmic trading has been found to contribute more to price discovery than human trades in specific markets (). The integration of machine learning and artificial intelligence into algorithmic trading strategies has been increasing, providing opportunities for superior growth and competitive advantage (). These technologies facilitate the development of dynamic trading strategies that can adjust to changing market conditions (). Additionally, the utilization of sophisticated algorithms in trading systems can automate various aspects of the trade cycle, thereby enhancing efficiency and potentially improving trading performance ().
() provide insights into the competitive advantage in algorithmic trading, emphasizing the behavioral innovation economics approach. They highlight the strategic behavior of algorithmic trading firms, shedding light on the motivations driving these market actors. Furthermore, () delve into the regulatory, technological, and market aspects of high-frequency trading, outlining a research agenda to address the challenges in this domain. () reviewed automated trading systems, focusing on statistical and machine learning methods and hardware implementations. They categorize trading systems based on technical and textual analyses, as well as high-frequency trading methods. The development of algorithmic trading strategies is explored by (), who discusses benchmark algorithms commonly used in evaluating new trading strategies. () surveys recent advances in financial trading systems based on reinforcement learning, emphasizing design strategies such as Q-learning and actor–critic algorithms. () present a heuristic-based trading system for Forex data, incorporating technical indicator rules and machine learning methods like genetic algorithms. () introduce a genetic algorithm maximizing the Sharpe and Sterling ratio method for Robo Trading in the forex market, emphasizing the role of technical analysis in algorithmic trading strategies.
Past research has attempted to fit a non-linear model to stock movements. A polynomial regression offers a flexible approach to modeling non-linear relationships in stock price movements. By fitting a polynomial equation to historical stock data, analysts can capture intricate patterns that linear models may overlook. Researchers have integrated sentiment analysis into their polynomial regression models to enhance predictive power. () demonstrated the use of polynomial regression in modeling stock price movements, showing that it can capture the cyclical patterns often observed in financial markets. By fitting a polynomial curve to historical price data, analysts can identify underlying trends that are not apparent with linear models. However, a significant challenge with polynomial regression is the risk of overfitting, especially when using higher-degree polynomials. Overfitting occurs when a model is too closely tailored to the training data, which can reduce its predictive power on new data. () proposed a hybrid model that combines linear regression with polynomial terms to forecast stock returns, effectively capturing both linear and non-linear patterns in the data. Despite the improved performance of hybrid models, challenges remain. Both polynomial and hybrid models are susceptible to overfitting, which can be mitigated through techniques such as cross-validation, regularization, and model pruning ().
The literature also indicates that hybrid models can outperform traditional methods in terms of prediction accuracy. () highlighted that machine learning methods, including hybrid approaches, are more advantageous for predicting stock market index movements compared to conventional statistical methods. This sentiment is echoed by (), who proposed a hybrid intelligent method that combines linear regression with recurrent neural networks, demonstrating reduced prediction errors through non-linear processing. Hybrid regression analysis combines traditional statistical methods with machine learning techniques to leverage the strengths of both paradigms. For instance, () introduced a novel hybrid deep learning model that integrates the autoregressive integrated moving average (ARIMA) model with convolutional neural networks (CNNs) and sequence-to-sequence long short-term memory (LSTM) networks. This model effectively captures both linear and non-linear components of stock price movements, showcasing the efficacy of hybrid approaches in financial forecasting. () developed a hybrid model combining principal component analysis (PCA), empirical mode decomposition (EMD), and LSTM to predict stock prices, highlighting the versatility of hybrid frameworks in addressing the complexities of financial time series data.
3. Methodologies and Results
3.1. Data and Methodologies
In this research, we are exploring whether we can fit polynomial models to stock price data in a way that allows us to build a profitable trading system based on those models. Our goal is to determine if these mathematical models can accurately capture stock price movements to make successful trading decisions. By using polynomial models, particularly those of lower degrees to avoid overfitting, we aim to predict future price trends and develop strategies that lead to profitable trades in the stock market. Our data contains daily price information (open, close, highest, and lowest) of Nasdaq100 stocks from 2017 till the end of March 2024. Our sample period covers uptrends and downtrends in the stock market that enable our system to be tested under various economic conditions. We used two-, three-, and four-degree polynomial regression models to identify the stocks’ daily movement and two standard deviations from the regression model to generate the trading signals. We aimed to make our stock market predictions more reliable by preventing overfitting, which happens when a model learns the training data too well and performs poorly on new data. To achieve this, we used polynomial models with lower degrees because higher-degree polynomials can capture noise instead of the actual trend, leading to unnecessary complexity. During training, we implemented early stopping by monitoring the model’s performance on a separate validation dataset and halting the process if the performance started to decline, preventing the model from becoming too tailored to the training data. We conducted a random search to find the best balance between complexity and performance, testing polynomials of various degrees (like 5 and 6) and adjusting the number of standard deviations used to create trading bands. Before settling on the optimal setup, we applied various trading strategies to identify which one maximized profit. Additionally, we introduced trading bands by adding and subtracting two standard deviations from the fitting line, allowing the model to be more flexible and less strict in fitting the data exactly, which helps reduce overfitting. By using simpler models, stopping training at the right time, exploring different settings, and testing various strategies—we developed models that perform better on new, unseen data, making our stock market predictions more generalizable and reliable.
A buy signal is generated when the price crosses the upper band to the upside, and an exit trade signal is generated when prices cross the lower band to the downside. By amending the system this way, the MRB is transformed into a classic momentum indicator designed to identify strong uptrends. The models, including the upper and lower bands, are described in Models 1 to 3, and the fully designed system is illustrated in Figure 1.
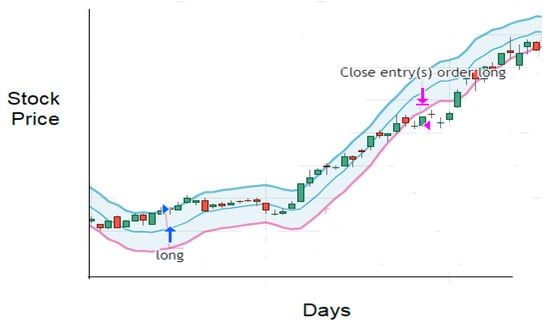
Figure 1.
The trading system design. Note: The green and red bars represent daily bars that symbolize the daily upper and lower price, respectively.
As shown in Figure 1, our trading system operates based on the stock’s closing price in relation to predefined bands. When the stock’s closing price crosses above the upper band, the system purchases the stock at the opening price on the next trading day, initiating a long position (meaning we own the stock with the expectation that its price will rise). Conversely, when the closing price touches the lower band, the system sells the stock at the opening price on the following day, closing the long position. We account for a 0.3% commission fee on every buy or sell transaction, and all the reported results include these transaction costs. Our system is also designed to analyze the trading results using real-time data and includes the following items: net profit in dollars (NP), which is the total NP of all closed trades; percent of profitable trades (PP), which is the percent of the profitable trades out of the total amount of trades; profit factor (PF), which is the division of the gross profits by gross losses; total closed trades (TCTs), which is the total number of closed trades within the examined period; and average days in a single trade (ADT), which represents the average number of days in a single trade.
3.2. Results
Table 1 summarizes the trading results of our trading system based on a two-degree polynomial regression (MRB).

Table 1.
Results of the trading system based on two degrees. Polynomial moving regression band.
The trading results of our system based on a two-degree polynomial regression (MRB) show that the average net profit (NP) generated was USD 79.67, with a percent of profitable trades (PP) of 52.89% and a profit factor (PF) of 1.76. The average days in trade (ADT) was 31.59, and the total closed trades (TCTs) was 27.59. These results indicate that the trading system generated a profit on average while being in the market for 871.5 (31.59 × 27.59) days out of the total 1827 (47.7%) trading days from the beginning of 2017 to the end of March 2024. Out of the 100 stocks examined, 19 turned out to have a negative NP (19%). ORLY stocks achieved the highest NP of USD 553.29 with a PP of 55.56% and a PF of 3.13. The highest loss was generated when trading BIIB, with an NP of USD −269.62, a PP of 36.67%, and a PF of 0.46. The trading results of our trading system based on a three-degree polynomial regression (MRB) are summarized in Table 2.
Table 2.
Results of the trading system based on three degrees. Polynomial moving regression band.
Table 2 demonstrates that the average net profit (NP) achieved by our trading system based on a three-degree polynomial regression (MRB) is USD 110.33, with a percent of profitable trades (PP) of 55.85% and a profit factor (PF) of 1.67. These results are better than those achieved with the two-degree polynomial MRB in terms of NP and PP. The average number of days on the market is 872.4 (37.75 × 23.11) out of the 1827 (47.7%) total trading days in the sampled period. The highest NP was achieved by the system trading BKNG (USD 1501.25), and the lowest was with BIIB (−USD 218.23). These results indicate the superiority of the three-degree polynomial MRB system compared to the two-degree system. Table 3 summarizes the trading results of our trading system based on a four-degree polynomial regression (MRB).
Table 3.
Results of the trading system based on four degrees. Polynomial moving regression band.
Table 3 shows that the average net profit (NP) achieved by our trading system based on a four-degree polynomial regression (MRB) is USD 162.75, with a percent of profitable trades (PP) of 55.45% and a profit factor (PF) of 1.60. These results indicate that the four-degree polynomial system has achieved the highest average NP of the tested systems. The average days the stocks are in a trading position is 883.8 (49.71 × 17.78), which is 48.37% of the entire tested period. Again, BKNG (USD 2166.95) has turned out to be the most profitable stock, while PDD is the most losing trade (USD −95.52). These results point out that the four-degree polynomial MRB system is superior to the former two models in terms of risk and return. Table 4 summarizes our trading systems’ results.
Table 4.
Summary results of the three trading models.
From Table 4, we learn that the best trading system to trade Nasdaq100 stocks is Model 3, which makes use of a four-degree polynomial MRB. This model is superior to the other two in terms of net profit (NP). Regarding the risks involved, the third model has the lowest loss in dollar value (USD −95.52) and the highest minimum PP (41.51) and PF (0.55), which indicates that this strategy is relatively less risky than the other two strategies. The only downside of the third model is that it exposes investors to the market on average 11–12 days in total more than the other two models.
4. Summary and Conclusions
In this research, we explored whether a trading system based on polynomial moving regression bands (MRBs) could be effectively applied to Nasdaq100 stocks to trade profitably. We designed three fully automated trading systems using polynomial MRBs of degrees two to four and tested their performance on daily stock data from early 2017 to the end of March 2024. To limit the overfitting problem, we employed several strategies: we used lower-degree polynomials to avoid unnecessary complexity, implemented early stopping during model training to prevent the models from becoming too specialized to the training data, and conducted random searches to find the optimal balance between model complexity and performance. Our results indicated that all three models achieved, on average, a positive net profit (NP), with a percent of profitable trades (PP) exceeding 50% and a profit factor (PF) greater than 1, demonstrating that the behavior of Nasdaq100 stocks can be effectively modeled using polynomial regression without overfitting. Among the models, Model 3, which employed a fourth-degree polynomial MRB system, performed the best, achieving the highest average NP of USD 162.73 and exhibiting a superior risk profile with the lowest average loss (USD 95.52), highest minimum PP (41.51%), and highest minimum PF (0.55). These findings suggest that carefully designed polynomial MRB-based trading systems, which mitigate overfitting through model selection and validation techniques, can successfully capture stock price trends and be used to trade profitably in fully automated systems.
Funding
This research was funded by Western Galilee College.
Data Availability Statement
The Data for this research was derived from public domains.
Conflicts of Interest
The author declares no conflict of interest.
References
- Aloud, Monira Essa, and Nora Alkhamees. 2021. Intelligent Algorithmic Trading Strategy Using Reinforcement Learning and Directional Change. IEEE Access 9: 114659–71. [Google Scholar] [CrossRef]
- Ayyıldız, Nazif. 2023. Prediction of Stock Market Index Movements with Machine Learning. Gaziantep: Ozgur Press. [Google Scholar]
- Benos, Evangelos, and Satchit Sagade. 2016. Price discovery and the cross-section of high-frequency trading. Journal of Financial Markets 30: 54–77. [Google Scholar] [CrossRef]
- Burgess, Nicholas. 2022. Machine Learning Algorithmic Trading Strategies for Superior Growth, Outperformance and Competitive Advantage. International Journal of Artificial Intelligence and Machine Learning 2: 38–60. [Google Scholar] [CrossRef]
- Chavarnakul, Thira, and David Enke. 2008. Intelligent technical analysis based equivolume charting for stock trading using neural networks. Expert Systems with Applications 34: 1004–17. [Google Scholar] [CrossRef]
- Cliff, Dave. 2018. An Open-Source Limit-Order-Book Exchange for Teaching and Research. Paper presented at 2018 IEEE Symposium Series on Computational Intelligence (SSCI), Bangalore, India, November 18–21; pp. 1853–60. [Google Scholar]
- Cooper, Ricky, Wendy Currie, Jonathan Seddon, and Ben Van Vliet. 2022. Competitive advantage in algorithmic trading: A behavioral innovation economics approach. Review of Behavioral Finance 15: 371–95. [Google Scholar] [CrossRef]
- Currie, Wendy L., and Jonathan J. M. Seddon. 2017. The Regulatory, Technology and Market ‘Dark Arts Trilogy’ of High Frequency Trading: A Research Agenda. Journal of Information Technology 32: 111–26. [Google Scholar] [CrossRef]
- De Luna, Xavier. 1998. Projected polynomial autoregression for prediction of stationary time series. Journal of Applied Statistics 25: 763–75. [Google Scholar] [CrossRef]
- Frino, Alex, Dionigi Gerace, and Masud Behnia. 2021. The impact of algorithmic trading on liquidity in futures markets: New insights into the resiliency of spreads and depth. The Journal of Future Markets 41: 1301–14. [Google Scholar] [CrossRef]
- Hendershott, Terrence, and Ryan Riordan. 2011. Algorithmic Trading and the Market for Liquidity. Journal of Financial and Quantitative Analysis 48: 1001–24. [Google Scholar] [CrossRef]
- Huang, Boming, Yuziang Huan, and Li Da Xu. 2019. Automated Trading Systems Statistical and Machine Learning Methods and Hardware Implementation: A Survey. Enterprise Information Systems 13: 132–44. Available online: https://digitalcommons.odu.edu/cgi/viewcontent.cgi?article=1027&context=itds_facpubs (accessed on 28 September 2024). [CrossRef]
- Huang, Wei, Yoshiteru Nakamori, and Shou-Yang Wang. 2005. Forecasting stock market movement direction with support vector machine. Computers & Operations Research 32: 2513–22. [Google Scholar]
- Islam, Sharmin, Md. Shakil Sikder, Md. Farhad Hossain, and Partha Chakraborty. 2021. Predicting the daily closing price of selected shares on the Dhaka stock exchange using machine learning techniques. SN Business & Economics 1: 58. [Google Scholar]
- Kambeu, Edson. 2019. Trading Volume as a Predictor of Market Movement An Application of Logistic Regression in the R environment. International Journal of Finance and Banking Studies 8: 57–69. [Google Scholar]
- Kara, Yakup, Melek Acar Boyacioglu, and Ömer Kaan Baykan. 2011. Predicting direction of stock price index movement using artificial neural networks and support vector machines: The sample of the Istanbul stock exchange. Expert Systems with Applications 38: 5311–19. [Google Scholar] [CrossRef]
- Kim, Ha Young, and Chang Hyun Won. 2018. Forecasting the Volatility of Stock Price Index: A Hybrid Model Integrating LSTM with Multiple GARCH-Type Models. Expert Systems with Applications 103: 25–37. [Google Scholar] [CrossRef]
- Maroto, Michelle. 2018. Sharing or limiting the wealth? Coresidence, parental support, and wealth outcomes in Canada. Journal of Family and Economic Issues 40: 102–16. [Google Scholar] [CrossRef]
- McMillan, David G. 2019. Cross-asset relations, correlations and economic implications. Global Finance Journal 41: 60–78. [Google Scholar] [CrossRef]
- Ozturk, Murat, Ismail Hakki Toroslu, and Guven Fidan. 2016. Heuristic based trading system on Forex data using technical indicator rules. Applied Soft Computing 43: 170–86. [Google Scholar] [CrossRef]
- Rather, Akhter Mohiuddin. 2014. A hybrid intelligent method of predicting stock returns. Advances in Artificial Neural Systems 2014: 246487. [Google Scholar] [CrossRef]
- Sen, Jaydip, and Sidra Mehtab. 2021. A robust predictive model for stock price prediction using deep learning and natural language processing. TechRxiv. [Google Scholar] [CrossRef]
- Srijiranon, Krittakom, Yoskorn Lertratanakham, and Tanatorn Tanantong. 2022. A hybrid framework using pca, emd and lstm methods for stock market price prediction with sentiment analysis. Applied Sciences 12: 10823. [Google Scholar] [CrossRef]
- Treleaven, Philip, Michal Galas, and Vidhi Lalchand. 2013. Algorithmic Trading Review. Communication of the ACM 56: 76–85. [Google Scholar] [CrossRef]
- Zhang, Zezheng, and Matloob Khushi. 2020. GA-MSSR: Genetic Algorithm Maximizing Sharpe and Sterling Ratio Method for Robo Trading. Ithaca: Cornell University. [Google Scholar]
- Zhao, Yang, and Zhonglu Chen. 2021. Forecasting stock price movement: New evidence from a novel hybrid deep learning model. Journal of Asian Business and Economic Studies 29: 91–104. [Google Scholar] [CrossRef]
- Zhu, Hengyue. 2022. Research advanced in financial trading systems based on reinforcement learning. Paper presented at 2nd International Conference on Artificial Intelligence Automation and High Performance (AIAHPC), Zhuhai, China, February 25–27. [Google Scholar]
Disclaimer/Publisher’s Note: The statements, opinions and data contained in all publications are solely those of the individual author(s) and contributor(s) and not of MDPI and/or the editor(s). MDPI and/or the editor(s) disclaim responsibility for any injury to people or property resulting from any ideas, methods, instructions or products referred to in the content. |
© 2024 by the author. Licensee MDPI, Basel, Switzerland. This article is an open access article distributed under the terms and conditions of the Creative Commons Attribution (CC BY) license (https://creativecommons.org/licenses/by/4.0/).