Abstract
Perivascular adipose tissue (PVAT) homeostasis plays an important role in maintaining vascular function, and PVAT dysfunction may induce several pathophysiological situations. In this study, we investigated the effect and mechanism of the local angiotensin II (Ang II) on PVAT. High-throughput comparative proteomic analysis, based on TMT labeling combined with LC-MS/MS, were performed on an in vivo Ang II infusion mice model to obtain a comprehensive view of the protein ensembles associated with thoracic PVAT (tPVAT) dysfunction induced by Ang II. In total, 5037 proteins were confidently identified, of which 4984 proteins were quantified. Compared with the saline group, 145 proteins were upregulated and 146 proteins were downregulated during Ang II-induced tPVAT pathogenesis. Bioinformatics analyses revealed that the most enriched GO terms were annotated as gene silencing, monosaccharide binding, and extracellular matrix. In addition, some novel proteins, potentially associated with Ang II infusion, were identified, such as acyl-CoA carboxylase α, very long-chain acyl-CoA synthetase (ACSVL), uncoupling protein 1 (UCP1), perilipin, RAS protein-specific guanine nucleotide-releasing factor 2 (RasGRF2), and hypoxia inducible factor 1α (HIF-1α). Ang II could directly participate in the regulation of lipid metabolism, transportation, and adipocyte differentiation by affecting UCP1 and perilipin. Importantly, the key KEGG pathways were involved in fatty acid biosynthesis, FABP3-PPARα/γ, RasGRF2-ERK-HIF-1α, RasGRF2-PKC-HIF-1α, and STAT3-HIF-1α axis. The present study provided the most comprehensive proteome profile of mice tPVAT and some novel insights into Ang II-mediated tPVAT dysfunction and will be helpful for understanding the possible relationship between local RAS activation and PVAT dysfunction.
1. Introduction
The renin–angiotensin–aldosterone system (RAAS) is involved in systemic blood pressure regulation and renal electrolyte homeostasis. It is well accepted that Ang II mediates vascular smooth muscle cell (VSMC) proliferation, migration, and vascular remodeling [1,2]. We also previously reported that Ang II regulates VSMC proliferation and vascular remodeling by RhoGDI signaling [3]. However, there is no detailed report on the effect of Ang II on PVAT (perivascular adipose tissue) structure and function.
PVAT is an adipose tissue with endocrine and paracrine functions surrounding the blood vessels, such as the small mesenteric and femoral arteries or the large abdominal aorta (AA), and plays wide-ranging physiological roles on vascular environment stability and influences vascular pathogenesis [4,5]. Under physiological conditions, PVAT has strong anti-atherosclerosis properties, induces non-shivering thermogenesis (NST), and metabolizes fatty acids by secreting various bioactive factors [6]. Under pathological conditions (such as obesity), PVAT loses its thermogenic ability and secretes pro-inflammatory adipocytokines that induce endothelial dysfunction and inflammatory cell infiltration and promotes the development of atherosclerosis [6]. The PVAT in the thoracic aorta is more similar to brown adipose tissue (BAT), while the PVAT in the abdominal aorta is similar to white adipose tissue (WAT). WAT primarily stores energy in the form of triglycerides, while excessive lipid accumulation in WAT leads to adipocyte hypertrophy and dysfunction. This leads to increased secretion of harmful fat factors and inflammatory cytokines into circulation, thus impairing the function of the vascular endothelium [7,8]. Unlike WAT, BAT can absorb lipids by uncoupling oxidation in the mitochondrial electron transport chain to generate heat, and this is characterized by the expression of the heat-producing gene uncoupling protein 1 (UCP1) [9]. In addition, WAT can be browned under the stimulation of low temperature and catecholamine [10,11]. The browning of WAT is characterized by a high expression of the brown adipocyte marker UCP1 [12], which is now called the third adipose tissue-beige adipose tissue (BEt). In general, changes in the phenotype of PVAT correlate with disease progression.
Many studies have shown that there is local RAAS activity in PVAT [13]. It has been reported that Ang II inhibits adipogenic differentiation of human preadipocytes in vitro via the AT1 receptor [14]. The AngII-AT2 or Ang (1–7)-Mas activation stimulates adipogenesis and antagonizes the antiadipogenic effect of AngII-AT1 activation [15,16]. However, the effect of Ang II on PVAT remains unclear. In this study, we used TMT, combined with LC-MS/MS and bioinformatics analysis, to analyze the phenotypic changes of PVAT during Ang II infusion.
2. Materials and Methods
2.1. Materials
Ang II was obtained from MedChemExpress (#HY-B0202; Princeton, NJ, USA). The primary antibodies against KDM1A (BM4356), ALCAM (A01788-1), MBNL1 (A02309-1), and TSN (A02777) were purchased from Boster Biological Technology (Wuhan, Hubei, China). Anti-TMEM41B (29270-1-AP), -PRTN3 (25278-1-AP), -GIGYF2 (24790-1-AP), -NHP2 (15128-1-AP), -RDH10 (14644-1-AP), and -TIMD4 (12008-1-AP) antibodies were purchased from Proteintech (Chicago, IL, USA). Anti-CtBP1 (ab129181), -PKN1 (ab231038), and -CCN1 (ab228592) antibodies were purchased from Abcam (Cambridge, MA, USA). Peroxidase-conjugated AffiniPure goat anti-rabbit IgG (H + L) was from Proteintech (SA00001–2; Chicago, IL, USA). An SABC immunohistochemistry staining kit was sourced from BosterBio (SA1028; Wuhan, Hubei, China). All other chemicals used in this study were analytical grade and were made in China.
2.2. Animals and Experimental Protocol
Animal procedures were performed in accordance with the Ethics Committee and the Animal Care and Use Committee of Nantong University (Ethic Committee approval number: 1213201.1) and conformed to the NIH Guide for the Care and Use of Laboratory Animals. Male C57BL/6 mice, aged 45 days weighing 20 ± 1 g (20 mice per group), were purchased from Beijing Vital River Laboratory Animal Technology Co., Ltd. (Beijing, China). Mice were anesthetized by intraperitoneal injection of 3.6% chloral hydrate (11 mL/kg). For Ang II infusion, mice were implanted with an Alzet Model 1002 osmotic minipump (Alzet Corp, Cupertino, CA, USA) for subcutaneous infusion of Ang II at a rate of 1000 ng/kg/min [3]. Control mice were implanted with pumps for infusion of normal saline. Pumps were placed into the subcutaneous space of anesthetized mice through a small incision in the back of the neck. The incision was closed, and the mice were allowed to recover without medication. After 14 days, mice were then euthanized. The aortic tree was quickly separated and washed with pre-chilled saline for subsequent analysis.
2.3. Adipose Tissue Transplantation
The PVAT around the thoracic aorta was carefully removed with microforceps under a surgical microscope. The removed thoracic PVAT (tPVAT) was then weighed and placed in Dulbecco’s Modifed Eagle Medium (DMEM, Gibco, Termo Fisher Scientifc, Inc., Waltham, MA, USA) containing 1% antibiotics (R&D Systems, Inc., Minneapolis, MN, USA). For proteomics analysis, the normal and Ang II infusion group had no less than 600 mg of the removed tPVAT in each group. The remaining tPVAT and blood vessels were used for the following experiments or stored in a liquid nitrogen tank.
2.4. H&E Staining
The removed tPVAT around the thoracic aorta was fixed in 4% paraformaldehyde and then embedded in paraffin for staining with hematoxylin and eosin. For quantitative analysis of adipocyte diameter, tissue sections were captured with Olympus digital camera (Tokyo, Japan) and quantified via Image-Pro Plus 6.0 software (Media Cybernetics, Rockville, MD, USA).
2.5. Immunohistochemical Analysis
Immunohistochemical staining against KDM1A, ALCAM, MBNL1, TSN, TMEM41B, PRTN3, GIGYF2, NHP2, RDH10, TIMD4, CtBP1, PKN1, and CCN1 were performed using a strept avidin-biotin complex (SABC) immunohistochemistry staining kit and following the manufacturer’s instructions. Paraffin-embedded tissue sections of the transplanted tPVAT (5 μm thick) were deparafnized and blocked with 0.5% horse serum. The sections were then incubated with the primary antibodies overnight at 4 °C, followed by incubation with biotinylated anti-rabbit IgG as the secondary antibody at room temperature for 2 h and SABC for 1 h. The samples were then visualized using a diaminobenzidine (DAB) staining kit, followed by counterstaining with hematoxylin, in order to stain the target proteins brown. All images were captured using an Olympus digital camera (Olympus, Tokyo, Japan) and analyzed using the Image-Pro Plus 6.0 software program (Media Cybernetics, Rockville, MD, USA).
2.6. Quantitative Proteomic Profiling by Tandem Mass Tag (TMT) Technology
The flowchart of proteomics and bioinformatics analysis is shown in Figure 1.
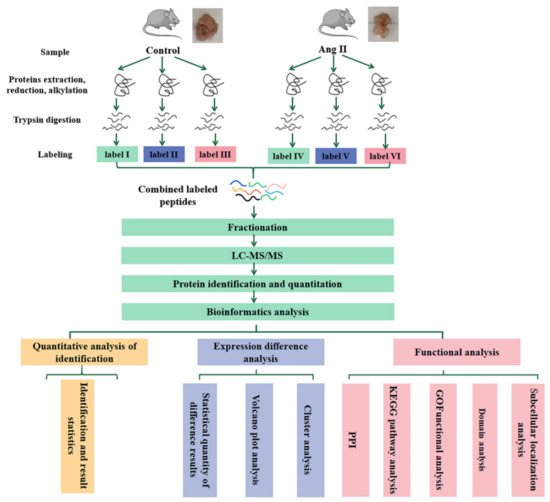
Figure 1.
Workflow for the whole study. tPVAT samples in each group (no less than 600 mg per group) were subjected to three biological replicates (each replicate is a mixture of tPVAT from 5–7 mice). LC-MS/MS, liquid chromatography-tandem mass spectrometry; GO, gene ontology; KEGG, Kyoto Encyclopedia of Genes and Genomes; PPI, Protein Protein Interaction.
The removed tPVAT around the thoracic aorta was ground to powder in liquid nitrogen. Proteins were extracted in lysis buffer (4% SDS, 100 mM Tris-HCL, 1 mM DTT, pH 7.6) for 30 min on ice. Then, cells were further broken using an ultrasonic cell disruptor, followed by centrifugation at 14,000 rpm for 1.5 h at 19 °C using a TL-100 ultracentrifuge (Beckman, Palo Alto, Brea, CA, USA). Finally, the middle layer of aqueous liquid was retained. The amount of protein was quantified with the BCA Protein Assay Kit (Bio-Rad, Hercules, CA, USA). Protein digestion by trypsin was performed according to filter-aided sample preparation (FASP) procedure described previously [17]. The digest peptides of each sample were desalted on C18 Cartridges (Empore™ SPE Cartridges C18, Oxford, PA, USA (standard density), bed I.D. 7 mm, volume 3 mL, Sigma), concentrated by vacuum centrifugation and reconstituted in 40 µL of 0.1% (v/v) formic acid. The peptide content was estimated by UV light spectral density at 280 nm using an extinctions coefficient of 1.1 of 0.1% (g/L) solution that was calculated on the basis of the frequency of tryptophan and tyrosine in vertebrate proteins.
100 μg peptide mixture of each sample was labeled using TMT reagent according to the manufacturer’s instructions (Thermo Scientific, Waltham, MA, USA). Labeled peptides were fractionated by SCX chromatography using the AKTA Purifier system (GE Healthcare, Chicago, IL, USA). The dried peptide mixture was reconstituted and acidified with buffer A (10 mM KH2PO4 in 25% of ACN, pH 3.0) and loaded onto a PolySULFOETHYL 4.6 × 100 mm column (5 µm, 200 Å, PolyLC Inc., Columbia, MD, USA). The peptides were eluted at a flow rate of 1 mL/min with a gradient of 0% buffer B (500 mM KCl, 10 mM KH2PO4 in 25% of ACN, pH 3.0) for 25 min, 0–10% buffer B during 25–32 min, 10–20% buffer B during 32–42 min, 20–45% buffer B during 42–47 min, 45–100% buffer B during 47–52 min, 100% buffer B during 52–60 min, and buffer B was reset to 0% after 60 min. The elution was monitored by absorbance at 214 nm, and fractions were collected every 1 min. The collected fractions were desalted on C18 Cartridges and concentrated by vacuum centrifugation.
Liquid chromatography tandem mass spectrometry (LC-MS/MS) analysis was performed on a Q Exactive mass spectrometer (Thermo Scientific, Waltham, MA, USA) that was coupled to Easy nLC (Proxeon Biosystems, now Thermo Fisher Scientific) for 60/90 min. The peptides were loaded onto a reverse phase trap column (Thermo Scientific Acclaim PepMap100, 100 μm × 2 cm, nanoViper C18), connected to the C18-reversed phase analytical column (Thermo Scientific Easy Column, 10 cm long, 75 μm inner diameter, 3 μm resin) in buffer A (0.1% Formic acid) and separated with a linear gradient of buffer B (84% acetonitrile and 0.1% Formic acid) at a flow rate of 300 nL/min, controlled by IntelliFlow technology. The mass spectrometer was operated in positive ion mode. MS data was acquired using a data-dependent top-10 method, dynamically choosing the most abundant precursor ions from the survey scan (300–1800 m/z) for HCD fragmentation. Automatic gain control (AGC) target was set to 3e6, and maximum inject time to 10 ms. Dynamic exclusion duration was 40.0 s. Survey scans were acquired at a resolution of 70,000 at m/z 200 and resolution for HCD spectra was set to 17,500 at m/z 200, and isolation width was 2 m/z. Normalized collision energy was 30 eV and the underfill ratio, which specifies the minimum percentage of the target value likely to be reached at maximum fill time, was defined as 0.1%. The instrument was run with peptide recognition mode enabled.
2.7. Identification and Quantitation of Proteins
The MS raw data for each sample were searched using the MASCOT engine (Matrix Science, London, UK; version 2.2), embedded into Proteome Discoverer 1.4 software for identification and quantitation analysis. Related parameters and instructions were shown in Supplementary Materials Table S1. The mass spectrometry proteomics data have been deposited to the ProteomeXchange Consortium via the PRIDE partner repository with the dataset identifier PXD029980.
2.8. Bioinformatic Analysis
Upregulated genes and downregulated genes were used to conduct a cluster analysis, a subcellular localization analysis, a Gene Ontology (GO, Valencia, Spain) analysis, a Kyoto Encyclopedia of Genes and Genomes (KEGG, Kyoto, Japan) pathway and enrichment analysis, and a protein-protein interaction (PPI, Hinxton, Cambridgeshire, UK) analysis.
2.8.1. Cluster Analysis
Cluster 3.0 (http://bonsai.hgc.jp/~mdehoon/software/cluster/software.htm, accessed on 17 February 2020) and Java Treeview software 3.0 (http://jtreeview.sourceforge.net, accessed on 17 February 2020) were used to perform hierarchical clustering analysis. Euclidean distance algorithm for similarity measure and average linkage clustering algorithm (clustering uses the centroids of the observations) for clustering were selected when performing hierarchical clustering. A heat map was often presented as a visual aid, in addition to the dendrogram.
2.8.2. Subcellular Localization
CELLO (http://cello.life.nctu.edu.tw/, accessed on 17 February 2020), which is a multi-class SVM classification system, was used to predict protein subcellular localization.
2.8.3. GO Analysis
The protein sequences of the selected differentially expressed proteins (DEPs) were locally searched using the NCBI BLAST+ client software (ncbi-blast-2.2.28 + -win32.exe) and InterProScan to find homologue sequences, then GO terms were mapped and sequences were annotated using the software program Blast2GO (version 2.5.0). The GO annotation results were plotted by R scripts.
2.8.4. KEGG Pathway
Following annotation steps, the studied proteins were blasted against the online KEGG database (http://geneontology.org/, accessed on 17 February 2020) to retrieve their KEGG orthology identifications and were subsequently mapped to pathways in KEGG. Enrichment analyses were applied based on the Fisher’ exact test, considering the whole quantified proteins as background dataset. Benjamini–Hochberg correction for multiple testing was further applied to adjust derived p-values. Only functional categories and pathways with p-values under a threshold of 0.05 were considered significant.
2.8.5. PPI Analysis
The PPI information of the studied proteins was retrieved from IntAct molecular interaction database (http://www.ebi.ac.uk/intact/, accessed on 17 February 2020) by their gene symbols or STRING software (http://string-db.org/, accessed on 17 February 2020, version 11.5). The results were downloaded in the XGMML format and imported into Cytoscape software (http://www.cytoscape.org/, accessed on 17 February 2020, version 3.2.1) to visualize and further analyze functional protein-protein interaction networks. Furthermore, the degree of each protein was calculated to evaluate the importance of the protein in the PPI network.
2.9. Statistical Analysis
All of the results are expressed as the mean ±SD. One-way ANOVA, followed by Tukey’s post-hoc test, as implemented in SPSS 22.0, was used for statistical analysis. Differences with a value of p < 0.05 were considered to be statistically significant.
3. Results
3.1. Pathological Conversion of tPVAT after Ang II Infusion
To determine the effects of Ang II on the tPVAT phenotype, male C57BL/6J mice aged 42–48 days were infused with Ang II or normal saline for two weeks. Mice that were infused with Ang II were significantly heavier than the controls by 7 and 12 days (Figure 2A). The tPVAT was successfully separated (Figure 2B,C). Figure 2C shows that Ang II infusion made the tPVAT morphology significantly irregular and caused hypertrophy, when compared with the saline group. The tPVAT weight of the Ang II infusion group was significantly higher than that of the control group (Figure 2D). Next, we histologically analyzed tPVAT after Ang II infusion. Mice infused with Ang II had a marked phenotypic conversion of tPVAT from a regular cell size to an irregular size (Figure 2E). Compared with the saline group, the Ang II-infused mice showed a substantial decrease in adipocyte size in tPVAT (Figure 2E).
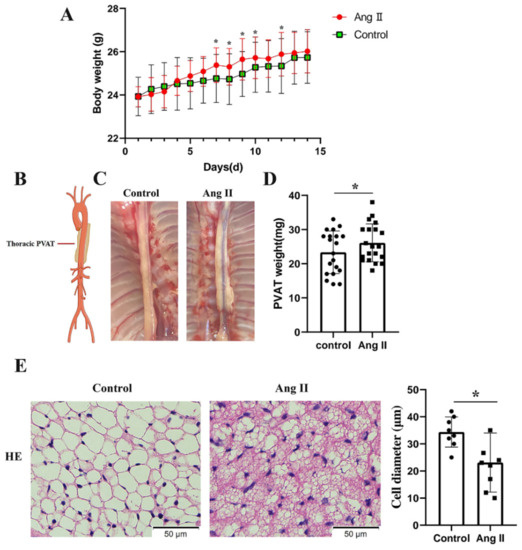
Figure 2.
Phenotypic differences between saline and Ang II infused mice. Mice infused with saline were used as control. (A) Body weights of the mice perfused with saline and Ang II, during 2 weeks of perfusion (n = 20, biological replicates); * p < 0.05, vs. the control group (saline infusion). (B) Simplified schematic showing thoracic PVAT (tPVAT) in mice; PVAT, perivascular adipose tissue. (C) Representative picture illustrating isolation of tPVAT. (D) tPVAT weights from saline and Ang II infused mice (n = 20, biological replicates); * p < 0.05, vs. the control group. (E) Hematoxylin and eosin staining of tPVAT and the quantification of cell diameter between saline and Ang II infusion group (n = 8, biological replicates); * p < 0.05, vs. the control group.
3.2. Molecular Changes during tPVAT Pathogenesis Analyzed by LC-MS/MS
To elucidate the molecular events occurring in tPVAT during Ang II infusion, a quantitative proteomic analysis, based on TMT labeling, was executed in the in vivo Ang II infusion model. A total of 30,079 peptide fragments, of which 27,160 were unique peptides corresponding to a total of 5037 proteins (Figure S1), were used. We received a good quality deviation during the data acquisition process using a high-quality Q Exactive mass spectrometer. The mass deviations of all the identified peptides were primarily distributed within 10 ppm, indicating that the identification results were accurate and reliable (Figure S2A). We obtained an ideal score with a median of 27.49, and more than 65.64% of the peptides scored higher than 20 when evaluating each MS2 spectrogram (Figure S2B). The protein ratio distribution of the saline and the Ang II-infused group are shown in Figure S2C. A 1.2-fold change cut-off, with a p-value < 0.05, was used to indicate significant changes in the abundance of the differentially expressed proteins (DEPs) between the saline and Ang II-infused groups.
3.3. Identification of DEPs
In our study, the changes in expression of the DEPs between the saline and Ang II-infused groups were determined using a volcano plot and K-means clustering heatmaps as shown in Figure 3A,B. A total of 291 proteins were found to be significantly differentially expressed between the two groups, of which 145 proteins were upregulated and 146 proteins were downregulated (Figure 3C), indicating a drastic phenotypic alteration of tPVAT during Ang II infusion, when compared with the saline-infused group. The abbreviated lists of the up- and down-regulated proteins are provided in Table 1 and Table 2. As demonstrated in Table 1, most of the top 10 up-regulated proteins have been shown to be involved in epigenetic modification, cell phenotype changes, and differentiation. These proteins include KDM1A, PKN1, and ENGase [18,19,20]. In addition, CtBP1 participates in BAT differentiation [21], and TMEM41B is a novel ER-localized regulator of lipid mobilization and lipid droplets [22]. Regarding the down-regulated proteins, as demonstrated in Table 2, many of the top 10 proteins have been shown to participate in lipid metabolism, brown adipogenesis, and various pathological processes, such as coronary heart disease (CHD) and robust adiposity [23,24,25,26,27,28].
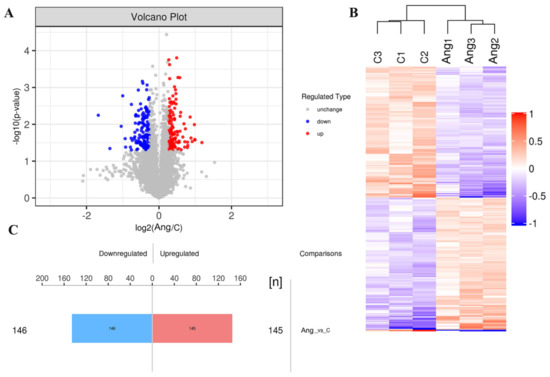
Figure 3.
Differentially expressed proteins (DEPs) of tPVAT were identified in Ang II infused mice. (A) The volcano plot showed the distribution and number of DEPs between the saline and Ang II infused tPVAT. The red dots represent the up-regulated proteins, while the blue dots represent the down-regulated proteins. (B) Hierarchical clustering of DEPs from the Ang II group, compared with the saline group (three biological replicates per group). Red indicates upregulation and blue represents downregulation. (C) The number of DEPs. There are 145 up-regulated proteins and 146 down-regulated proteins.

Table 1.
List of up-regulated proteins during Ang II infusion.
Table 2.
List of down-regulated proteins during Ang II infusion.
In addition, in order to verify the results of the TMT proteomics, we selected the top 10 up- or down-regulated proteins for immunohistochemical analyses. Figure 4 shows that the expressions of KDM1A, PKN1, CtBP1, TMEM41B, PRTN3, GIGYF2, and ALCAM were significantly up-regulated, while that of CCN1, MBNL1, NHP2, RDH10, TIMD4, and TSN were significantly decreased after Ang II infusion. The immunohistochemical results confirmed the expression pattern observed in the quantitative proteomics analysis. Since there were no suitable antibodies for ENGase, RasGRF2, ABHD4, Pate4, Selenof, Reps1, and COQ10B, we did not perform immunohistochemical verification of these proteins.
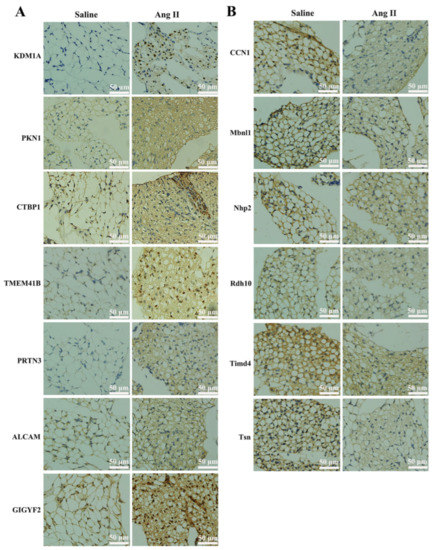
Figure 4.
Immunohistochemical verification of DEPs. (A) Immunohistochemistry staining of up-regulated proteins, such as lysine-specific histone demethylase 1A (KDM1A), serine/threonine-protein kinase N1 (PKN1), C-terminal-binding protein 1 (CtBP1), transmembrane protein 41B (TMEM41B), myeloblastin (PRTN3), CD166 antigen (ALCAM), and GRB10-interacting GYF protein 2 (GIGYF2). Positive staining was indicated by brown coloration, and nuclei were stained with hematoxylin in blue. (B) Immunohistochemistry staining of down-regulated proteins, such as CCN family member 1 (CCN1), muscleblind-like protein 1 (MBNL1), H/ACA ribonucleoprotein complex subunit 2 (NHP2), retinol dehydrogenase 10 (RDH10), T-cell immunoglobulin and mucin domain-containing protein 4 (TIMD4), and Translin (TSN). Positive cells are indicated by brown coloration.
3.4. Bioinformatics Analysis of the Altered Proteins during Ang II Infusion
3.4.1. GO Functional Annotation and Analysis
We used the subcellular structure prediction software CELLO to analyze the subcellular location of all the DEPs. As shown in Figure 5A, most of the proteins were distributed in the nucleus, cytoplasm, extracellular matrix, and mitochondria. The DEPs were then analyzed against the GO database using three sets of ontologies: biological process (BP), molecular function (MF), and cellular component (CC). The most enriched GO terms of BP, MF, and CC were annotated as a gene silencing (12 proteins, richFactor = 0.16), monosaccharide binding (9 proteins, richFactor = 0.17), extracellular matrix (22 proteins, richFactor = 0.12), respectively (Figure 5B,C and Table 3). Other important BPs were included in DNA packaging, monocarboxylic acid transport, positive regulation of immunoglobulin secretion, organic acid transmembrane transport, carboxylic acid transmembrane transport, etc. (Figure 5C). Other important MFs included CoA-ligase activity, acid-thiol ligase activity, medium-chain fatty acid-CoA ligase activity, ligase activity, forming carbon-sulfur bonds, and organic hydroxy compound transmembrane transporter activity (Figure 5C). Other important CCs included host intracellular organelles, host intracellular membrane-bounded organelles, SUMO ligase complex, and Smc5–Smc6 complex (Figure 5C).
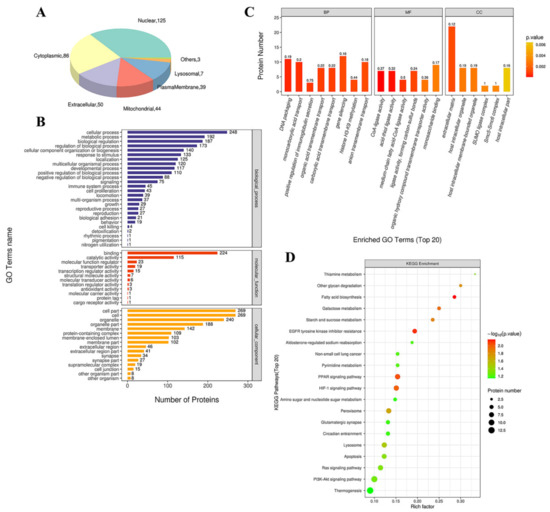
Figure 5.
Functional analysis of DEPs. (A) Subcellular location of DEPs between saline and Ang II group. The numbers show the proteins located in different subcellular components. (B) Overall enriched GO terms. The vertical axis with different colors of the bar charts represents the significance of enrichment of the three categories (biological processes, molecular functions, cellular components). The horizontal axes represent the number of DEPs. (C) Top 20 enriched GO analyses of Ang II-altered proteins. BP: biological processes; MF: molecular functions; CC: cellular components. The color gradient from orange to red represents the p value. The numbers above the bar charts represent the richFactor (richFactor ≤ 1). (D) KEGG pathway enrichment bubble chart. The horizontal axes represent the richFactor (richFactor ≤ 1), which represents the ratio of the number of DEPs annotated to the KEGG pathway to the number of all identified proteins annotated to the KEGG category. The vertical axis represents the statistical results of DEPs under Top 20 KEGG pathways. The color of the bubble represents the significance of the enriched KEGG pathways. The color gradient from green to red represents the p value; the closer to red color, the lower the p value and the higher the significance level corresponding to the enrichment.
Table 3.
Distribution of proteins and signaling pathways response to Ang II infusion, based on GO and KEGG analysis.
3.4.2. KEGG Pathway Analysis
By searching the major biological pathways and relevant regulatory processes involved in the KEGG, we analyzed all of the DEPs in the saline and Ang II infusion groups. The results of the KEGG pathway analysis showed that the significant enrichment pathways included fatty acid (FA) biosynthesis (4 proteins, richFactor = 0.29), EGFR tyrosine kinase inhibitor resistance (6 proteins, richFactor = 0.19), PPAR signaling pathway (8 proteins, richFactor = 0.15), HIF-1 signaling pathway (8 proteins, richFactor = 0.15), galactose metabolism (4 proteins, richFactor = 0.25), starch and sucrose metabolism (4 proteins, richFactor = 0.24), other glycan degradation (3 proteins, richFactor = 0.30), peroxisome (8 proteins, richFactor = 0.13), lysosome (8 proteins, richFactor = 0.12), thiamine metabolism (2 proteins, richFactor = 0.33), apoptosis (7 proteins, richFactor = 0.12), and Ras signaling pathway (8 proteins, richFactor = 0.11) (Figure 5D and Table 3).
Next, we connected these significant enrichment pathways and found that Ang II infusion deeply affected the fat metabolism and adipocyte differentiation (Figure 6A,B). Figure 6A shows that the up-regulation of acetyl-CoA carboxylase α and acyl-CoA synthetase long-chain family member 5 significantly affected the synthesis of long-chain FAs. In addition, Figure 6B shows that Ang II infusion affected the PPAR signaling pathway by regulating very long-chain acyl-CoA synthase (ACSVL) and FA binding protein 3 (FABP3), and thereby affected lipid metabolism, thermogenesis, and adipocyte differentiation. Additionally, we also found that Ang II infusion could affect many downstream signaling pathways, such as Rac, PI3K/Akt, MAPK, and the HIF-1α pathways, by regulating the Ras signaling that, in turn, affected many cell functions and participated in pathogenesis (Figure 6C).
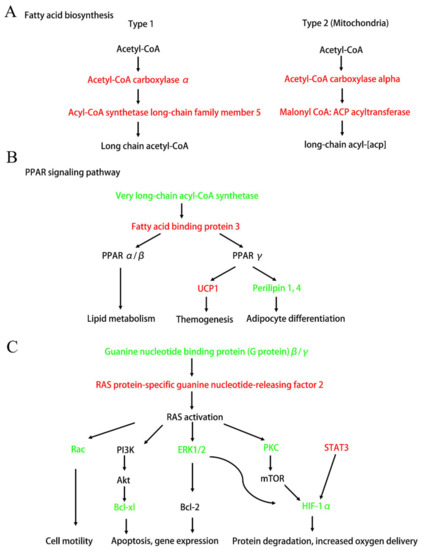
Figure 6.
Diagram of the important signaling pathways that have changed after Ang II infusion. Up-regulated DEPs after Ang II infusion are shown in red. Down-regulated DEPs after Ang II infusion are shown in green. (A) Fatty acid biosynthetic pathway (simplified from Figure S3). (B) PPAR signaling pathway that affects lipid metabolism, themogenesis, and adipocyte differentiation (simplified from Figure S4). (C) Ras and its downstream signaling pathways (simplified from Figures S5–S7). Ras-Rac signaling affects cell motility. Ras-PI3K-Akt and Ras-ERK1/2 signaling affects cell apoptosis and gene expression. Ras-HIF1α pathway affects cell protein degradation and oxygen delivery.
3.4.3. PPI Analysis
In the PPI network, there were 20 high-connectivity degree DEPs with a large circle and a degree value of more than 10 between the saline and Ang II groups (Figure 7). These high-connectivity DEPs were identified as fibronectin (P11276), actin (P60710), mitogen-activated protein kinase (MAPK) 3 (Q63844), H/ACA ribonucleoprotein complex subunit 2 (Q9CRB2), signal transducer and activator of transcription (STAT) 3 (P42227), proliferation-associated protein 2G4 (P50580), nucleolar GTP-binding protein 1 (Q99ME9), eukaryotic translation initiation factor 6 (O55135), COP9 signalosome complex subunit 2 (P61202), Bcl-2-like protein 1 (Q64373), ACSVL (O35488), acetyl-CoA carboxylase 1 (Q5SWU9), 60S ribosomal protein L22 (P67984), hexokinase-2 (O08528), superoxide dismutase [Cu-Zn] (P08228), eukaryotic translation initiation factor 4E (P63073), high mobility group protein B1 (P63158), eukaryotic translation initiation factor 2 subunit 2 (Q99L45), lysine-specific histone demethylase 1A (Q6ZQ88), and ubiquitin carboxyl-terminal hydrolase isozyme L5 (Q9WUP7) (Table 4). Some high-connectivity node proteins in Table 4 were related to the MAPK-Erk, STAT, FA biosynthesis, PPAR, and apoptosis signaling pathways, and these were highly consistent with those obtained using KEGG.

Figure 7.
Protein protein interaction (PPI) analysis of DEPs between saline and Ang II infusion group. The circled nodes represent DEPs, and the lines represent protein-protein interactions. Red circles represent up-regulation proteins. Blue circles represent down-regulation proteins. The size of the circle indicates the degree of protein connectivity.
Table 4.
DEPs with high connectivity degree in PPI analysis between saline and Ang II infusion group.
4. Discussion
PVAT is the connective tissue surrounding most of the systemic blood vessels and is now considered to be an important endocrine tissue that maintains the vascular homeostasis. Healthy PVAT has anti-contraction, anti-inflammation, and anti-oxidation effects [6]. According to the region of the vascular layer, where PVAT is located, PVAT shows phenotypic and functional heterogeneity [29]. For example, in the aorta of rodents, PVAT is primarily composed of WAT in the abdominal region, while PVAT is primarily composed of BAT in the thoracic region [30]. Angiotensinogen (AGT) was first found in BAT around the aorta in 1987 [31]. Evidence has demonstrated that the local renin-angiotensin system (RAS) may play an important role in adipocyte growth and differentiation [32]. However, the effect of pathological local RAS activation on the normal physiological function of PVAT is still unknown. Because Ang II is the primary component of RAS, we used the mice Ang II infusion model in the present study to simulate the pathological increase of local RAS at tPVAT. The results showed that Ang II infusion significantly increased the body weight and tPVAT weight of mice. In addition, the morphology of tPVAT also changed, and the distribution of tPVAT around the thoracic aorta appeared uneven (Figure 2A–D). To further verify the influence of Ang II infusion on the structure of tPVAT, we performed H&E staining on tPVAT tissue. The result showed that Ang II significantly changed the diameter and size of adipocytes in tPVAT (Figure 2E). These results indicate that the pathological activation of local RAS may greatly change the structure and function of tPVAT, and thereby affect vascular function.
To further clarify the molecular mechanisms of tPVAT structural changes caused by Ang II infusion, TMT label-based nanoscale LC–MS/MS was used in the present study. We identified a number of novel proteins associated with Ang II infusion and extended our understanding of this process. A total of 291 with significantly differential expression (145 up-regulation and 146 down-regulation) were identified in three biological replicates, and the hierarchical cluster analysis showed that these proteins were wel-distinguished. This indicated that the overall protein screening had reasonable accuracy. Additionally, we selected the top 10 differential expressed proteins with appropriate antibodies for immunohistochemical verification, and the data showed trends that paralleled those observed in the TMT results (Figure 4). To our knowledge, this is the first and most comprehensive large-scale proteomic profiling of Ang II-infused tPVAT, and the data will facilitate future studies of pathological tPVAT after the local activation of RAS.
The GO enrichment results indicated that the most enriched BP, MF, and CC categories after Ang II infusion were gene silencing (up regulation: CtBP1, KDM1A, GIGYF2, MRPL44, STAT3, H3C1; down regulation: BAZ2A, MECP2, TDRKH, H1-2, H1.5, eIF6), monosaccharide binding (up regulation: HK2, P4HA1, OGFOD3, PFKL, GPI; down regulation: Mbl2, MANBA, DBH, GNPNAT1), and extracellular matrix (up regulation: FN1, POSTN, CTSL, TNC, MATN2, TGFBI, ITIH3, SRPX2, HSD17B12, ALPL, LRRc17; down regulation: ANXA2, FBLN5, ANXA4, LTBP-4, ANXA11, AGRN, MFAP1a, Mbl2, EFEMP1, CCN1, Marco), respectively. We found that the genes in gene silencing, such as CtBP1, KDM1A, MECP2, STAT3, eIF6, were involved in regulating adipocyte inflammatory, differentiation, reconstruction, oxidation, and metabolism [21,33,34,35,36,37,38]. In addition, a large number of extracellular matrix components and regulatory proteins have changed after Ang II infusion, and these may participate in regulating cell proliferation, migration, and other phenotypic transformations.
As highlighted by the KEGG analysis, the most important networks, after Ang II infusion, were related to FA biosynthesis, PPAR signaling, Ras signaling, MAPK-Erk pathway, STAT3, and the HIF-1α pathway (Figure 6). Although it has been reported that Ang II induces adipocyte dysfunction, the mechanisms of this action are not very clear [39]. Our current study found that Ang II affected the synthesis of long-chain FAs, by up-regulating acyl-CoA carboxylase α and down-regulating ACSVL (Figure 6A,B). Additionally, these two FA synthesis-related enzymes had a high connectivity degree in the PPI analysis (Figure 7, Table 4) and could serve as possible novel molecular targets for Ang II action. Furthermore, Ang II affected the PPARγ signaling by up-regulating FABP3, which, in turn, promoted UCP1 and suppressed perilipin1, 4 expressions (Figure 6B). FABP3 is one of the members of the lipid-binding proteins superfamily. It is both membrane-bound, aiding cellular long-chain FA uptake, and cytoplasmic, being crucial to intracellular transport of FAs to sites of metabolic conversion [40]. It has been reported that the FABP3-PPARα axis has an indispensable role in Ang II-induced cardiac hypertrophy and heart failure [41]. Therefore, we speculate that the FABP3-PPARα axis also plays an important role in Ang II-induced tPVAT pathogenesis. In addition, Ang II promoted UCP1 and inhibited perilipin 4 expressions (Figure 6B). UCP1 primarily exists in BAT and is a mitochondrial protein embedded in the inner membrane of mitochondria, and it can dissipate the energy stored in mitochondrial electrochemical gradient as heat and “decouple” from ATP synthesis [42]. The thermogenesis of BAT and the energy steady state of the system depend entirely on the action of UCP1, and UCP1 up-regulation indicates adipocyte browning [43,44]. Therefore, the pathological increase of Ang II in this study may affect tPVAT thermometabolism and preadipocyte browning by up-regulating UCP1, which in turn affects vascular function. Perilipin proteins were discovered in the adipocyte, where they regulate lipid storage and lipolysis and are considered direct PPARγ targets [45,46]. Perilipin 1 appears to be a highly specific marker for adipocytic differentiation [47]. Perilipin 4 participates in the formation of lipid droplets and is an adipocyte regulator of triglyceride synthesis and packaging [48]. In the current study, Ang II may regulate the differentiation and function of adipocytes at mice tPVAT by down-regulating perilipin 1 and 4. In brief, the present study suggests that UCP1 and perilipin may be new targets of Ang II infusion, allowing Ang II to directly participate in the regulation of lipid metabolism, transportation, and adipocyte differentiation.
The Ras-ERK pathway is largely known for its regulation of cell proliferation, differentiation, survival, and drug-mediated behaviors. A recent study found that RasGRF2 (RAS protein-specific guanine nucleotide-releasing factor 2) mediates cocaine self-administration (SA) in mice via an ERK-dependent mechanism [49]. Our study discovered that RasGRF2 was up-regulated after Ang II infusion and could serve as a novel target for Ang II action, and the RasGRF2-Ras-ERK signal axis may play an important role in Ang II-mediated tPVAT pathogenesis. In addition, hypoxia inducible factor 1α (HIF-1α) has been reported to participate in the Ang II-mediated inflammatory response process [50], cardiomyocyte hypertrophy [51], preautonomic neurons activation [52], and vascular remodeling [53]. Our study showed a decreased expression level of HIF-1α after Ang II infusion and indicated that HIF-1α may be also a novel biomarker for Ang II-mediated tPVAT pathogenesis. In addition, RasGRF2-ERK-HIF-1α, RasGRF2-PKC-HIF-1α, and the STAT3-HIF-1α axis may be three important pathways at tPVAT with locally pathological activation of RAS, which can be further studied by subsequent researchers. A recent report showed that STAT3/HIF-1α signaling participates in peritoneal fibrosis during long-term peritoneal dialysis (PD) treatment [54]. Our results indicated an increased expression of STAT3 after Ang II infusion, and STAT3 had a high connectivity degree in the PPI analysis (Figure 6C and Table 4). Thus, STAT3 signaling may play an important role in Ang II-mediated phenotypic changes of tPVAT.
In conclusion, the present quantitative proteomic study provided the most comprehensive proteome profiles of mice tPVAT and a list of DEPs between saline-infused and Ang II-infused tPVAT. The bioinformatics analyses found that the functions of these altered proteins were primarily concentrated in gene silencing and the extracellular matrix. More importantly, the present study provided novel molecular targets of Ang II, such as acyl-CoA carboxylase α, ACSVL, UCP1, perilipin, and RasGRF2, as well as important signaling pathways, such as FA biosynthesis, FABP3-PPARα/γ, RasGRF2-ERK-HIF-1α, RasGRF2-PKC-HIF-1α, and STAT3-HIF-1α, during Ang II-induced tPVAT pathogenesis. The data provided here will promote our understanding of the effects of local RAS activation on PVAT and vascular function.
Supplementary Materials
The following are available online at https://www.mdpi.com/article/10.3390/biomedicines9121820/s1. Supplementary figure legends, Figure S1: statistical histogram of protein identification and quantitative results; Figure S2: quality control of peptides; Figure S3: diagram of the fatty acid biosynthesis; Figure S4: diagram of PPAR signaling pathway; Figure S5: diagram of Ras signaling pathway; Figure S6: diagram of HIF-1 signaling pathway; Figure S7: diagram of apoptosis pathway; Table S1: parameters and instructions of MASCOT engine search. Table S2: Quantitative analysis of all differentially expressed proteins.
Author Contributions
Conceptualization, W.Y.; methodology, X.L. and H.G.; software, J.S.; validation, Y.Q. and X.L.; formal analysis, J.S.; investigation, X.L. and H.G.; resources, H.G.; data curation, H.G.; writing—original draft preparation, X.L.; writing review and editing, W.Y.; visualization, H.G.; supervision, W.Y.; project administration, W.Y.; funding acquisition, W.Y. The authors declare that all data were generated in-house and that no paper mill was used. All authors have read and agreed to the published version of the manuscript.
Funding
This work was supported by a grant from the National Natural Sciences Foundation of China (81970226), Key University Science Research Project of Jiangsu Province (19KJA320010).
Institutional Review Board Statement
Male C57BL/6 mice were used as experimental animals. The breeding, maintenance, and feeding of these mice, as well as food and water consumption and weight monitoring, were all carried out in the Laboratory Animal Center, School of Pharmacy, Nantong University. All of the procedures were approved by the Animal Care and Use Committee of Nantong University (Ethic Committee approval number: 1213201.1) and conformed to the NIH Guide for the Care and Use of Laboratory Animals.
Informed Consent Statement
Not applicable.
Data Availability Statement
The data presented in this study are available upon request from the corresponding author.
Conflicts of Interest
The authors declare no conflict of interest.
References
- Bourmoum, M.; Charles, R.; Claing, A. The GTPase ARF6 controls ROS production to mediate angiotensin II-induced vascular smooth muscle cell proliferation. PLoS ONE 2016, 11, e0148097. [Google Scholar] [CrossRef] [PubMed]
- Nour-Eldine, W.; Ghantous, C.M.; Zibara, K.; Dib, L.; Issaa, H.; Itani, H.A.; El-Zein, N.; Zeidan, A. Adiponectin attenuates angiotensin II-induced vascular smooth muscle cell remodeling through nitric oxide and the RhoA/ROCK pathway. Front. Pharmacol. 2016, 7, 86. [Google Scholar] [CrossRef] [PubMed]
- Dai, F.; Qi, Y.; Guan, W.; Meng, G.; Liu, Z.; Zhang, T.; Yao, W. RhoGDI stability is regulated by SUMOylation and ubiquitination via the AT1 receptor and participates in Ang II-induced smooth muscle proliferation and vascular remodeling. Atherosclerosis 2019, 288, 124–136. [Google Scholar] [CrossRef] [PubMed]
- Siegel-Axel, D.I.; Häring, H.U. Perivascular adipose tissue: An unique fat compartment relevant for the cardiometabolic syndrome. Rev. Endocr. Metab. Disord. 2016, 17, 51–60. [Google Scholar] [CrossRef]
- Fernández-Alfonso, M.S.; Gil-Ortega, M.; Aranguez, I.; Souza, D.; Dreifaldt, M.; Somoza, B.; Dashwood, M.R. Role of PVAT in coronary atherosclerosis and vein graft patency: Friend or foe? Br. J. Pharmacol. 2017, 174, 3561–3572. [Google Scholar] [CrossRef]
- Qi, X.Y.; Qu, S.L.; Xiong, W.H.; Rom, O.; Chang, L.; Jiang, Z.S. Perivascular adipose tissue (PVAT) in atherosclerosis: A double-edged sword. Cardiovasc. Diabetol. 2018, 17, 134. [Google Scholar] [CrossRef]
- Langin, D.; Arner, P. Importance of TNF alpha and neutral lipases in human adipose tissue lipolysis. Trends. Endocrinol. Metab. 2006, 17, 314–320. [Google Scholar] [CrossRef]
- Cao, H. Adipocytokines in obesity and metabolic disease. J. Endocrinol. 2014, 220, T47–T59. [Google Scholar] [CrossRef]
- Cannon, B.; Nedergaard, J. Brown adipose tissue: Function and physiological significance. Physiol. Rev. 2004, 84, 277–359. [Google Scholar] [CrossRef]
- Kern, P.A.; Finlin, B.S.; Zhu, B.; Rasouli, N.; McGehee, R.E., Jr.; Westgate, P.M.; Dupont-Versteegden, E.E. The effects of temperature and seasons on subcutaneous white adipose tissue in humans: Evidence for thermogenic gene induction. J. Clin. Endocrinol. Metab. 2014, 99, E2772–E2779. [Google Scholar] [CrossRef]
- Lin, J.Z.; Martagón, A.J.; Cimini, S.L.; Gonzalez, D.D.; Tinkey, D.W.; Biter, A.; Baxter, J.D.; Webb, P.; Gustafsson, J.Å.; Hartig, S.M.; et al. Pharmacological activation of thyroid hormone receptors elicits a functional conversion of white to brown fat. Cell. Rep. 2015, 13, 1528–1537. [Google Scholar] [CrossRef]
- Wu, J.; Boström, P.; Sparks, L.M.; Ye, L.; Choi, J.H.; Giang, A.H.; Khandekar, M.; Virtanen, K.A.; Nuutila, P.; Schaart, G.; et al. Beige adipocytes are a distinct type of thermogenic fat cell in mouse and human. Cell 2012, 150, 366–376. [Google Scholar] [CrossRef]
- Uysal, K.T.; Wiesbrock, S.M.; Marino, M.W.; Hotamisligil, G.S. Protection from obesity-induced insulin resistance in mice lacking TNF-alpha function. Nature 1997, 389, 610–614. [Google Scholar] [CrossRef]
- Janke, J.; Engeli, S.; Gorzelniak, K.; Luft, F.C.; Sharma, A.M. Mature adipocytes inhibit in vitro differentiation of human preadipocytes via angiotensin type 1 receptors. Diabetes 2002, 51, 1699–1707. [Google Scholar] [CrossRef]
- Than, A.; Leow, M.K.; Chen, P. Control of adipogenesis by the autocrine interplays between angiotensin 1-7/Mas receptor and angiotensin II/AT1 receptor signaling pathways. J. Biol. Chem. 2013, 288, 15520–15531. [Google Scholar] [CrossRef]
- Sysoeva, V.Y.; Ageeva, L.V.; Tyurin-Kuzmin, P.A.; Sharonov, G.V.; Dyikanov, D.T.; Kalinina, N.I.; Tkachuk, V.A. Local angiotensin II promotes adipogenic differentiation of human adipose tissue mesenchymal stem cells through type 2 angiotensin receptor. Stem. Cell. Res. 2017, 25, 115–122. [Google Scholar] [CrossRef]
- Wiśniewski, J.R.; Zougman, A.; Nagaraj, N.; Mann, M. Universal sample preparation method for proteome analysis. Nat. Methods 2009, 6, 359–362. [Google Scholar] [CrossRef]
- Francois, A.A.; Obasanjo-Blackshire, K.; Clark, J.E.; Boguslavskyi, A.; Holt, M.R.; Parker, P.J.; Marber, M.S.; Heads, R.J. Loss of Protein Kinase Novel 1 (PKN1) is associated with mild systolic and diastolic contractile dysfunction, increased phospholamban Thr17 phosphorylation, and exacerbated ischaemia-reperfusion injury. Cardiovasc. Res. 2018, 114, 138–157. [Google Scholar] [CrossRef]
- Fang, Y.; Liao, G.; Yu, B. LSD1/KDM1A inhibitors in clinical trials: Advances and prospects. J. Hematol. Oncol. 2019, 12, 129. [Google Scholar] [CrossRef]
- Fairbanks, A.J. Chemoenzymatic synthesis of glycoproteins. Curr. Opin. Chem. Biol. 2019, 53, 9–15. [Google Scholar] [CrossRef]
- Farmer, S.R. Molecular determinants of brown adipocyte formation and function. Genes. Dev. 2008, 22, 1269–1275. [Google Scholar] [CrossRef] [PubMed]
- Moretti, F.; Bergman, P.; Dodgson, S.; Marcellin, D.; Claerr, I.; Goodwin, J.M.; DeJesus, R.; Kang, Z.; Antczak, C.; Begue, D.; et al. TMEM41B is a novel regulator of autophagy and lipid mobilization. EMBO. Rep. 2018, 19, e45889. [Google Scholar] [CrossRef] [PubMed]
- Kim, K.H.; Won, J.H.; Cheng, N.; Lau, L.F. The matricellular protein CCN1 in tissue injury repair. J. Cell. Commun. Signal. 2018, 12, 273–279. [Google Scholar] [CrossRef] [PubMed]
- Ren, B.; Liu, M.; Ni, J.; Tian, J. Role of selenoprotein f in protein folding and secretion: Potential involvement in human disease. Nutrients 2018, 10, 1619. [Google Scholar] [CrossRef] [PubMed]
- Zhang, Q.H.; Yin, R.X.; Chen, W.X.; Cao, X.L.; Chen, Y.M. Association between the TIMD4-HAVCR1 variants and serum lipid levels, coronary heart disease and ischemic stroke risk and atorvastatin lipid-lowering efficacy. Biosci. Rep. 2018, 38, BSR20171058. [Google Scholar] [CrossRef] [PubMed]
- Fu, X.; Shah, A.P.; Li, Z.; Li, M.; Tamashiro, K.L.; Baraban, J.M. Genetic inactivation of the translin/trax microRNA-degrading enzyme phenocopies the robust adiposity induced by Translin (Tsn) deletion. Mol. Metab. 2020, 40, 101013. [Google Scholar] [CrossRef] [PubMed]
- Hung, C.S.; Lin, J.C. Alternatively spliced MBNL1 isoforms exhibit differential influence on enhancing brown adipogenesis. Biochim. Biophys. Acta. Gene. Regul. Mech. 2020, 1863, 194437. [Google Scholar] [CrossRef]
- Zheng, X.; Ren, B.; Li, X.; Yan, H.; Xie, Q.; Liu, H.; Zhou, J.; Tian, J.; Huang, K. Selenoprotein F knockout leads to glucose and lipid metabolism disorders in mice. J. Biol. Inorg. Chem. 2020, 25, 1009–1022. [Google Scholar] [CrossRef]
- Cheng, C.K.; Bakar, H.A.; Gollasch, M.; Huang, Y. Perivascular adipose tissue: The sixth man of the cardiovascular system. Cardiovasc. Drugs. Ther. 2018, 32, 481–502. [Google Scholar] [CrossRef]
- Miao, C.Y.; Li, Z.Y. The role of perivascular adipose tissue in vascular smooth muscle cell growth. Br. J. Pharmacol. 2012, 165, 643–658. [Google Scholar] [CrossRef]
- Campbell, D.J.; Habener, J.F. Cellular localization of angiotensinogen gene expression in brown adipose tissue and mesentery: Quantification of messenger ribonucleic acid abundance using hybridization in situ. Endocrinology. 1987, 121, 1616–1626. [Google Scholar] [CrossRef]
- Cassis, L.A.; Police, S.B.; Yiannikouris, F.; Thatcher, S.E. Local adipose tissue renin-angiotensin system. Curr. Hypertens. Rep. 2008, 10, 93–98. [Google Scholar] [CrossRef]
- Hanzu, F.A.; Musri, M.M.; Sánchez-Herrero, A.; Claret, M.; Esteban, Y.; Kaliman, P.; Gomis, R.; Párrizas, M. Histone demethylase KDM1A represses inflammatory gene expression in preadipocytes. Obesity 2013, 21, E616–E625. [Google Scholar] [CrossRef]
- Brina, D.; Miluzio, A.; Ricciardi, S.; Clarke, K.; Davidsen, P.K.; Viero, G.; Tebaldi, T.; Offenhäuser, N.; Rozman, J.; Rathkolb, B.; et al. eIF6 coordinates insulin sensitivity and lipid metabolism by coupling translation to transcription. Nat. Commun. 2015, 6, 8261. [Google Scholar] [CrossRef]
- Xiong, Y.; Wang, E.; Huang, Y.; Guo, X.; Yu, Y.; Du, Q.; Ding, X.; Sun, Y. Inhibition of lysine-specific demethylase-1 (LSD1/KDM1A) promotes the adipogenic differentiation of hESCs through H3K4 methylation. Stem. Cell. Rev. Rep. 2016, 12, 298–304. [Google Scholar] [CrossRef]
- Liu, C.; Wang, J.; Wei, Y.; Zhang, W.; Geng, M.; Yuan, Y.; Chen, Y.; Sun, Y.; Chen, H.; Zhang, Y.; et al. Fat-specific knockout of Mecp2 upregulates slpi to reduce obesity by enhancing browning. Diabetes 2020, 69, 35–47. [Google Scholar] [CrossRef]
- Reilly, S.M.; Hung, C.W.; Ahmadian, M.; Zhao, P.; Keinan, O.; Gomez, A.V.; DeLuca, J.H.; Dadpey, B.; Lu, D.; Zaid, J.; et al. Catecholamines suppress fatty acid re-esterification and increase oxidation in white adipocytes via STAT3. Nat. Metab. 2020, 2, 620–634. [Google Scholar] [CrossRef]
- Xu, Y.; Wang, N.; Tan, H.Y.; Li, S.; Zhang, C.; Zhang, Z.; Feng, Y. Panax notoginseng saponins modulate the gut microbiota to promote thermogenesis and beige adipocyte reconstruction via leptin-mediated AMPKα/STAT3 signaling in diet-induced obesity. Theranostics 2020, 10, 11302–11323. [Google Scholar] [CrossRef]
- Lakhani, H.V.; Zehra, M.; Pillai, S.S.; Puri, N.; Shapiro, J.I.; Abraham, N.G.; Sodhi, K. Beneficial role of HO-1-SIRT1 axis in attenuating angiotensin II-induced adipocyte dysfunction. Int. J. Mol. Sci. 2019, 20, 3205. [Google Scholar] [CrossRef]
- Goel, H.; Melot, J.; Krinock, M.D.; Kumar, A.; Nadar, S.K.; Lip, G.Y.H. Heart-type fatty acid-binding protein: An overlooked cardiac biomarker. Ann. Med. 2020, 52, 444–461. [Google Scholar] [CrossRef]
- Zhuang, L.; Mao, Y.; Liu, Z.; Li, C.; Jin, Q.; Lu, L.; Tao, R.; Yan, X.; Chen, K. FABP3 deficiency exacerbates metabolic derangement in cardiac hypertrophy and heart failure via PPARα pathway. Front. Cardiovasc. Med. 2021, 8, 722908. [Google Scholar] [CrossRef] [PubMed]
- Betz, M.J.; Enerbäck, S. Targeting thermogenesis in brown fat and muscle to treat obesity and metabolic disease. Nat. Rev. Endocrinol. 2018, 14, 77–87. [Google Scholar] [CrossRef] [PubMed]
- Eugene Chen, Y. Editorial: The Yin and Yang of perivascular adipose tissue in vascular disease. Cardiovasc. Drugs. Ther. 2018, 32, 477–479. [Google Scholar] [CrossRef] [PubMed]
- Liang, X.; Qi, Y.; Dai, F.; Gu, J.; Yao, W. PVAT: An important guardian of the cardiovascular system. Histol. Histopathol. 2020, 35, 779–787. [Google Scholar]
- Dalen, K.T.; Schoonjans, K.; Ulven, S.M.; Weedon-Fekjaer, M.S.; Bentzen, T.G.; Koutnikova, H.; Auwerx, J.; Nebb, H.I. Adipose tissue expression of the lipid droplet-associating proteins S3-12 and perilipin is controlled by peroxisome proliferator-activated receptor-gamma. Diabetes 2004, 53, 1243–1252. [Google Scholar] [CrossRef]
- Smith, C.E.; Ordovás, J.M. Update on perilipin polymorphisms and obesity. Nutr. Rev. 2012, 70, 611–621. [Google Scholar] [CrossRef][Green Version]
- Westhoff, C.C.; Mrozinski, J.; Riedel, I.; Heid, H.W.; Moll, R. Perilipin 1 is a highly specific marker for adipocytic differentiation in sarcomas with intermediate sensitivity. J. Cancer Res. Clin. Oncol. 2017, 143, 225–232. [Google Scholar] [CrossRef]
- Han, X.; Zhu, J.; Zhang, X.; Song, Q.; Ding, J.; Lu, M.; Sun, S.; Hu, G. Plin4-dependent lipid droplets hamper neuronal mitophagy in the MPTP/p-induced mouse model of Parkinson’s disease. Front. Neurosci. 2018, 12, 397. [Google Scholar] [CrossRef]
- Bernardi, R.E.; Olevska, A.; Morella, I.; Fasano, S.; Santos, E.; Brambilla, R.; Spanagel, R. The inhibition of RasGRF2, but not RasGRF1, alters cocaine reward in mice. J. Neurosci. 2019, 39, 6325–6338. [Google Scholar] [CrossRef]
- Huang, H.; Fan, Y.; Gao, Z.; Wang, W.; Shao, N.; Zhang, L.; Yang, Y.; Zhu, W.; Chen, Z.; Hu, J.; et al. HIF-1α contributes to Ang II-induced inflammatory cytokine production in podocytes. BMC. Pharmacol. Toxicol. 2019, 20, 59. [Google Scholar] [CrossRef]
- Yan, X.; Zhao, R.; Feng, X.; Mu, J.; Li, Y.; Chen, Y.; Li, C.; Yao, Q.; Cai, L.; Jin, L.; et al. Sialyltransferase7A promotes angiotensin II-induced cardiomyocyte hypertrophy via HIF-1α-TAK1 signalling pathway. Cardiovasc. Res. 2020, 116, 114–126. [Google Scholar] [CrossRef]
- Sharma, N.M.; Haibara, A.S.; Katsurada, K.; Nandi, S.S.; Liu, X.; Zheng, H.; Patel, K.P. Central Ang II (Angiotensin II)-mediated sympathoexcitation: Role for HIF-1α (hypoxia-inducible factor-1α) facilitated glutamatergic tone in the paraventricular nucleus of the hypothalamus. Hypertension 2021, 77, 147–157. [Google Scholar] [CrossRef]
- Qi, D.; Wei, M.; Jiao, S.; Song, Y.; Wang, X.; Xie, G.; Taranto, J.; Liu, Y.; Duan, Y.; Yu, B.; et al. Hypoxia inducible factor 1α in vascular smooth muscle cells promotes angiotensin II-induced vascular remodeling via activation of CCL7-mediated macrophage recruitment. Cell Death Dis. 2019, 10, 544. [Google Scholar] [CrossRef]
- Yang, X.; Bao, M.; Fang, Y.; Yu, X.; Ji, J.; Ding, X. STAT3/HIF-1α signaling activation mediates peritoneal fibrosis induced by high glucose. J. Transl. Med. 2021, 19, 283. [Google Scholar] [CrossRef]
Publisher’s Note: MDPI stays neutral with regard to jurisdictional claims in published maps and institutional affiliations. |
© 2021 by the authors. Licensee MDPI, Basel, Switzerland. This article is an open access article distributed under the terms and conditions of the Creative Commons Attribution (CC BY) license (https://creativecommons.org/licenses/by/4.0/).