Abstract
Background/Objectives: There is clear evidence for the higher prevalence of varicose veins (VVs) among women. In this regard, the research on sex differences affecting this condition is very important for sex-specific health care. We aimed to assess how male or female sex may contribute to the changes to gene expression profiles in the vein wall during varicose transformation. Methods: Paired varicose vein (VV) and non-varicose vein (NV) segments were harvested from patients with VVs after venous surgery. Processed RNAs from those samples were subjected to gene expression analysis by reverse transcription quantitative polymerase chain reaction (RT-qPCR) followed by further data analysis. Multiple linear regression (MLR) analysis was performed to identify and characterize relationships among multiple factors (relative mRNA levels of a gene in NV or VV or their ratio, as dependent variables) and sex (independent variable, used individually or in combination with other patient’s characteristics). For sex-specific gene regulation analysis, all potential binding sites for sex hormone receptors were identified in each gene’s regulatory region sequence. Results: Using the independent method and a replicative patient sample set, we validated our previous data on 23 genes’ differential expression in VVs and obtained insights on their sex-specific regulation. Sex (as an individual independent variable or in combination with other parameters—patient characteristics such as Age, BMI, CEAP class, Height, VVD manifestation and duration) was a moderate predictor (0.40 < R < 0.59; p (R) < 0.05) for the STK38L expression in VVs (with its higher mRNA level in NVs and VVs of women compared to men); sex was a strong predictor (0.6 < R < 0.79; p (R) < 0.05) for the TIMP1 expression in VVs (with its lower mRNA level in VVs of women compared to men); sex was a moderate predictor (0.40 < R < 0.59; p (R) < 0.05) for the EBF1 expression in NVs (with its lower mRNA level in NVs of women compared to men). Conclusions: Confirmed differential expression of the studied genes in VVs indicates their plausible participation in vein wall remodeling. Sex-specific expression in veins for the subset of those genes suggests their hormonal regulation as well as other mechanisms involved in VV pathogenesis. This work enriches our understanding of sex features for the development of VVs and may provide the foundation for future investigations and beneficial treatment options.
1. Introduction
Varicose veins (VVs) are the most common form of chronic venous disease [1], defined as dilated, tortuous superficial veins with deformation of the vessel wall accompanied by valve insufficiency and impaired blood flow [2]. This condition corresponds to class C2 according to the clinical, etiological, anatomical, and pathophysiological (CEAP) classification [3], the global prevalence of which is 19% [1]. The absence of timely treatment of VVs leads to complications such as edema and venous ulcers, so the presence of VVs defines a widespread condition with serious consequences for the patient’s life [2].
It is generally accepted that females have a higher risk factor in the development of VVs [4], which is confirmed by a number of studies [5,6,7,8,9]. While the estimate of this prevalence varies greatly, this may indicate different approaches to the assessment of VVs and different geographic, political, national, and mentality features of the region in which the assessment was carried out. According to 28 studies, the frequency of VVs was estimated as 2 to 56% in men and <1 to 73% in women by Beebe-Dimmer et al. [4]. Nevertheless, there are studies that refute the predominance of VVs in women [10,11,12].
The reasons for the higher prevalence of VVs among women may be genetic, physiological, and anatomical features. Helkkula et al. examined the evidence for sex differences in VV genetics in the Finnish population and, in spite of high similarity in genetic effects and variance between men and women, identified that one female-specific locus near the ERG gene located on the 21 chromosome and two loci located on the X chromosome were associated with VV risk [9]. Due to the presence of a second X chromosome, women have a more active immune system [13], which may contribute to the pathogenesis of VVs characterized by inflammation [14]. Hormonal background changes make a major contribution to the pathogenesis of VVs. Strong arguments in favor of the higher prevalence of VVs among women include specific risk factors like pregnancy, childbirth, and menopause along with hormone replacement therapy, wearing high heels, and taking oral contraceptives. In a meta-analysis by Ismai et al., it was shown that a history of pregnancy increases the risk of VVs by 82% [15]. Mullane found a dependence of the incidence of VVs on the number of childbirths; the study showed that 13% of primiparous, 30% of secundiparous, and 57% of multiparous women suffer from VVs [16]. Such values may be a consequence of physiological changes associated with pregnancy and childbirth [17,18] and additional stress on the mother’s cardiovascular system [17]. A decrease in estrogen levels in women during menopause also contributes to deformation of the venous wall, which is manifested by a 2-fold increase in the risk of VVs [12]. Differences in skeleton, muscle, and adipose tissue distribution may also contribute significantly to this pathology. A study by Baldazzi et al. showed that the venous reflux related to VVs differs between the sexes: they found a predisposition to an ascending modality of VV progression in women (due to insufficient tributaries), while a descending mechanism is suggested in men (due to incompetence of the saphenofemoral junction) [19].
Epigenetic features defined by sex are of great importance in the development of cardiovascular diseases, which emphasizes the need to take into account sex characteristics when prescribing therapy [20]. Sex may influence gene expression, particularly in the venous wall, which can govern the course of pathogenesis and susceptibility to treatment. García-Honduvilla et al. showed differences in the expression of sex hormone receptors between the sexes (in norm and pathology) [21]. Unfortunately, there are no other data from the available literature on the difference in gene expression in healthy and varicose veins between men and women. We have previously published studies dedicated to changes in gene expression in the venous wall upon varicose transformation [22,23,24,25,26,27,28,29], some of them only as abstracts in conference proceedings [30,31,32,33,34,35]; however, we did not test the influence of sex on its relative values. Based on the above, in the present study we used some new data, as well as our previous data, to conduct an additional analysis to identify the effect of sex on the expression of genes involved in varicose transformation. Investigation of sex distinctions in the pathogenesis and treatment susceptibility of chronic venous diseases will help to provide a more personalized approach to the diagnosis and treatment of these conditions.
2. Materials and Methods
2.1. Participants of the Study
Patients (162 men and 368 women, mean age 47 years) had a clinical diagnosis of mostly C2–C4 (i.e., VVs requiring medical intervention) according to the CEAP classification. Exclusion criteria were absence of visible VVs and post-thrombotic changes in deep veins on the leg with VVs. Descriptive (categorical) characteristics of the patient sample studied according to leg are given in Figure 1.
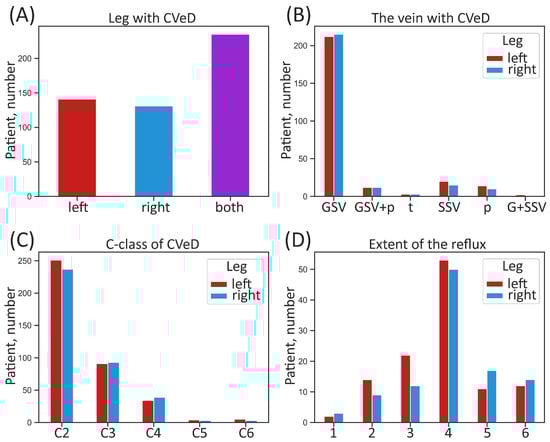
Figure 1.
Categorical characteristics of the whole sample of patients according to leg. (A) Number of patients suffering from CVeD in the right, left, or both legs; (B) number of patients with different anatomical manifestation of CVeD; (C) number of patients with different clinical class of CVeD; (D) number of patients with different extent of pathological venous reflux. CVeD—chronic venous disease; GSV—great saphenous vein; G + SSV—small and great saphenous vein; GSV + p—great saphenous vein and perforators; SSV—small saphenous vein; p—perforators; t—tributaries; C-class (C)—clinical class according to the CEAP classification. The extent of pathological venous reflux is coded as follows: 1—to the upper third of the thigh, 2—to the middle third of the thigh, 3—to the lower third of the thigh, 4—to the upper third of the calf, 5—to the middle third of the calf, 6—to the lower third of the calf.
Instead of tables, figures describing several parameters of the study cohort were generated for better visualization and perception. Descriptive (numerical) characteristics of the studied patient sample according to sex are given in Figure 2.

Figure 2.
Numerical characteristics of the whole sample of patients according to sex. (A) Number of patients; (B) distribution of age; (C) distribution of height; (D) distribution of weight; (E) distribution of BMI; (F) distribution of age of CVeD manifestation; (G) distribution of duration of CVeD. The box borders show the interquartile range (IQR), the horizontal line inside it indicates the median, and the whiskers show the 1.5 of IQR, points outside the whiskers represent numerical outliers (>1.5 of IQR); * p-value < 0.05, ** p-value < 0.01, *** p-value < 0.001 (Mann–Whitney U test); BMI—body mass index.
The entire study sample consisted of 530 individuals with VVs who underwent varicose vein surgery in 2013–2021. Numbers of patients in the sample subsets intended to evaluate the expression of one particular gene varied from 12 to 35 corresponding to 24–70 paired varicose vein (VV) and non-varicose vein (NV) segments.
2.2. Sample Collection, RNA Extraction, and Processing
Paired VV and NV segments (case and control, respectively) of the basin of the great saphenous vein (GSV) were harvested from each patient with VVs. Surgical material was immediately placed in liquid nitrogen (for snap-freezing) then put at –80 °C until the time to be used. Total RNAs were isolated from homogenized vein samples according to the protocol used by Korolenya et al. [36], and their integrity was confirmed by visualization of intact 18S and 28S rRNA under UV light. For equal conditions in subsequent qPCR reactions, RNA samples were made equal in concentrations though further normalization to reference genes in each sample was performed during the data analysis. Then, the cDNAs were synthesized using the reverse transcriptase (DNA-Synthesis, Moscow, Russia) in accordance with the instructions given by Korolenya et al. [36]. Synthesized cDNA samples were diluted 10-fold with nuclease-free water and taken for gene expression analysis.
2.3. Gene Expression Analysis by Reverse Transcription qPCR
Determination of relative mRNA level (normalized to reference genes) was performed by SYBR Green-based qPCR using a CFX-96 thermal cycler (Bio-Rad, Hercules, CA, USA). Primer design was performed using Oligo Analyzer (version 1.0.0) and Annhyb (version 2.22) software. Primer sequences are given in Supplementary Table S1. A subset of reference genes—ACTB and GAPDH—was selected to be used for normalization according to our geNorm-analysis using qBase+ software (version 3.2) carried out earlier (ACTB, GAPDH, and POLR2A were the 3 most stable housekeeping genes expressed in venous samples) [22].
Amplification mixtures (20 µL) contained up to 25 ng of template cDNAs (calculated per RNAs), forward and reverse primers (300 nM), Taq polymerase (2 U) per reaction (DNA-Synthesis), and buffer (10 mM Tris-HCl (pH 8.9), 25 mM MgCl2, 55 mM KCl, 0.2 mM dNTPs, and 0.1% Tween-20). SYBR Green I was used as an intercalating dye. The following PCR program was used: 96 °C for 3 min, then 40 cycles of 96 °C for 10 s, 58–62 °C for 10 s, 72 °C for 10 s, and 75–87 °C for 5 s (for collecting fluorescent signals at SYBR channel). Each measurement was performed in technical triplicate and included a standard curve of four serial dilution points of mixed samples’ cDNA, a no-template control, and each test cDNA. For quantifying small differences in relative gene expression, we used the standard curve method as more reliable compared to the ΔΔCt method, since PCR efficiency for one primer pair may fluctuate from run to run. An outlier replicate was excluded from the analysis for the samples with standard deviation of ΔCq values of the three replicates > 0.5. For all qPCR systems, standard curves were generated using the same reference sample prepared from the vein according to the same protocol as for all the samples analyzed. Bio-Rad CFX Maestro results were exported as Excel and Rdml files and imported into qBase+ software (version 3.2) for further analysis according to the software manual and additional literature [37,38].
2.4. Statistical Analysis
Statistical analysis was performed using qBase+ (version 3.2), Microsoft Excel (version 2508, build 19127.20240), STATISTICA (version 8.0), and Past (version 4.16c) software. All the graphs were generated using data visualization libraries for Python (version 3.9.10)—Matplotlib (version 3.7.1) and Seaborn (version 0.13.2). Box plots were constructed to visualize the distribution of values: the horizontal line inside the box indicates the median, the box borders show the interquartile range (IQR)—values between the 1st and 3rd quartiles—and the whiskers show the maximum and minimum values. In the case of describing numerical characteristics of the patient sample (Figure 2), the whiskers show the 1.5 of IQR, and points outside the whiskers represent numerical outliers (>1.5 of IQR).
Sample data distribution was checked using the Shapiro–Wilk, Kolmogorov–Smirnov, and Lilliefors normality tests. Differences between men and women were tested using Student’s t-test or Mann–Whitney U test, depending on the normality. Gene expression differences between paired VV and NV segments were analyzed mostly by the one-sample Wilcoxon signed-rank test (when the distribution of gene expression relative values was not normal); in case of normal distribution (only for 3 genes), paired Student’s t-test was applied. To detect associations between sex and another categorical feature, the chi-square test was used (results are shown in heatmaps). Statistical significance threshold for all the tests was set at p-value < 0.05.
2.5. Multiple Linear Regression Analysis
Multiple linear regression (MLR) analysis was performed using STATISTICA (version 8.0), Past (version 4.16c), and Microsoft Excel (version 2508, build 19127.20240) software. MLR theoretically could enable us to (a) describe relationships among the independent variable sex and the dependent variables (relative mRNA levels), (b) estimate the values of the dependent variables from the observed independent variable sex, and (c) identify risk factors which influence the outcome and determine individual prognoses [39]. For correct variables combination and procedures, we followed the recommendations described by Schneider et al. [39]. To avoid excessive collinearity and confounding, ‘BMI’ (instead of ‘Weight’) was left in the independent variable list since it reflects weight adjusted to height and is also not collinear to it. ‘Forward’ method was selected for a stepwise or ridge regression procedure. We had to exclude some samples from MLR analysis in cases where some of the questionnaires with patient characteristics missed a few data. To ensure regression model stability, we performed the multicollinearity diagnostics [40]. Namely, variance inflation factor (VIF) analysis was carried out for simple linear regression when sex was the only independent predictor variable# (being nominal categorical—binary variable containing only two mutually exclusive categories—men or women). Generalized variance inflation factor (GVIF, computed using the corresponding VIF values) analysis was carried out for multiple linear regression when all parameters (sex and other independent predictor variables including non-binary categorical variable ‘CEAP class’) were applied together*. The formulas were VIF = 1/(1 − R2) and GVIF = VIF^(1/(2×*df)), where R2 is a coefficient of multiple determination, and df is a degree of freedom. The results are shown in the last column of Supplementary Table S2. We considered that multicollinearity is present when the VIF was higher than 5 to 10 (average threshold used is often 4 to 5), and GVIF values above 2.5 to 5 (average threshold used is often 3.16). The residual analysis (accessing Durbin–Watson d and serial correlation of residuals) in STATISTICA (version 8.0) software was additionally performed to reveal instability linked to uneven sample sizes. For labeling the strength of the association, the following criteria were used for absolute values of r/R: 0–0.19 was considered as very weak correlation, 0.2–0.39 as weak correlation, 0.40–0.59 as moderate correlation, 0.6–0.79 as strong correlation, and 0.8–1 as very strong correlation [41].
When performing MLR analysis ‘Sex predictor variable + all other parameters vs. gene expression relative values’, independent predictor variables (patient characteristics such as sex, age, BMI, VVD manifestation, CEAP class, height, and VVD duration, available to us from the questionnaires) were applied together in order to observe their possible effects on each of the dependent variables: ‘gene expression relative value in NV’, ‘gene expression relative value in VV’, or ‘NV:VV or VV:NV ratio of gene expression relative values’.
When performing MLR analysis ‘Sex predictor variable separately vs. gene expression relative values’ (analog of simple linear regression) we used all three variables (‘gene expression relative value in NV’, ‘gene expression relative value in VV’, and ‘NV:VV or VV:NV ratio of gene expression relative values’) in order to visualize the results in one graph since there was no confounding between them. The graphs with scatter plots and corresponding regression lines for the relationship between the dependent (gene expression) variable and the independent (sex) variable were (a) incorporated in the corresponding figures within the Section 3 for the genes with certain significance or (b) presented in Supplementary Figures S1–S20 for the genes with incomplete significance.
Brief summary tables of the sex-related MLR analysis results for gene expression that showed certain significance were incorporated in the corresponding figures in the Section 3. Full summary table of the sex-related MLR analysis results on the expression of genes with incomplete significance (as well as of those genes described in the Section 3 is presented as Supplementary Table S2.
2.6. Sex-Specific Gene Regulation Analysis Through Identification of Sex Hormone-Related Transcription Factor Binding Sites
In order to obtain insights on the sex-specific regulation of the studied genes, a search for sex hormone-related transcription factor binding sites (TFBS) within the regulatory regions of these genes containing their promoters and associated enhancers and silencers was carried out using the MATCH Suite (release 3.1) software integrated into the TRANSFAC® 2.0 solution for gene regulation analysis at https://genexplain.com/transfac (accessed on 26 July 2025) [42]. The focus was set up for TFBS for transcription factors acting themselves as nuclear receptors for sex hormones as their ligands; therefore, TFBS corresponding to androgen receptors (AR), estrogen receptors (ER), and progesterone receptors (PR) were considered in particular. Whole analysis workflow was performed according to the manufacturer’s MATCH Suite User guide release 3.1 (geneXplain). We analyzed the most active promoters in the range of [−1000, +100] bp from TSS and all known enhancers and silencers associated with those genes. Only matrices associated with transcription factors belonging to the ‘Reproductive system development’ Gene Ontology category <GO:0061458> were taken into the constructed profile. The selection of the most promising transcription factors regulating the input genes was based on complex criteria including (1) estimation of cumulative binding affinity of the transcription factors to the analyzed regulatory regions, and (2) high average expression of these factors among all tissues and their expression specificity values. In the regulatory regions of the input genes, potential TFBS were identified and checked for cumulative binding affinity. Using the MATCH™ algorithm, all potential binding sites for sex hormone receptors were identified in each regulatory region sequence. The data were extracted in respective tables for further analysis.
3. Results
3.1. The Associations Between Sex and Some Descriptive Characteristics of Patients
Anterior to evaluation of sex-related differences in the gene expression in varicose veins, we decided to assess possible connections between sex of the patients and their descriptive characteristics according to the information provided in the questionnaires. To detect associations between sex and another categorical parameter, we used the chi-square test. The results were generated as heatmaps and presented in Appendix A. According to our population-specific data, there are statistically significant differences between men and women in anatomical manifestation of CVeD in the left leg (Figure A1A) and clinical class of CVeD in the right leg (with a tendency for the left leg) (Figure A1C,D). There is a prominent difference between men and women in CVeD manifestation in great saphenous vein + perforators (10.98% in men vs. 1.67% in women), as well as in small saphenous vein only (14.63% in men vs. 4.44% in women) of the left leg, albeit women are more likely to develop CVeD only in the great saphenous vein of the left leg compared to men (85% vs. 70.73%, correspondingly). One can see that men tend to develop CVeD of a more severe clinical class (C4–C6). There was no difference in the extent of pathological venous reflux between men and women.
Upon assessment of possible associations between sex and such categorical parameters as family history for CVeD and comorbidities, it was shown that compared to women, a larger percentage of men had CVeD family history (36.54% in men vs. 21.27% in women) and liver and/or gallbladder diseases (8.33% in men vs. 2.7% in women), albeit a larger percentage of women, compared to men, suffered from hypothyroidism (5.86% in women vs. 0% in men) and autoimmune diseases (10.81% in women vs. 3.7% in men) (Figure A2A–D).
3.2. Gene Expression Analysis Reveals a Set of Genes with Altered mRNA Level in VVs
In this study, we first aimed to validate, using an independent method and a replicative patient sample set, our microarray data [22] on a set (23) of genes differentially expressed in varicose venous segments compared to normal ones in patients with varicose veins. Using reverse transcription quantitative polymerase chain reaction (RT-qPCR) we verified altered expression for a set of genes listed in Table 1. For three of those genes (CHRDL2, COMP, and MFAP5) we reconfirmed their validated differential expression on a larger sample set.

Table 1.
Differentially expressed genes confirmed by RT-qPCR.
The illustration of the Table data (distribution of gene expression relative values in NV vs. VV segments in the whole patient sample) is presented in Figure 3A, Figure 4A and Figure 5A (shown further) and Supplementary Figures S1A–S20A. Using an independent method, we revealed that 16 genes (CALU, CASZ1, CCL2, CHRDL2, COL15A1, COMP, EFEMP1, GPI, ITGA5, MFAP5, MYO18B, PLA2G2A, STK38L, SULF1, TIMP1, TNC) are upregulated (↑) and 7 genes (ABCA1, AXL, EBF1, Mn-SOD, MYOD1, PPP1R12B, VCL) are downregulated (↓) in VVs. These findings are consistent with our previous transcriptome analysis. Changes in the level of transcripts of these genes in VVs indicate their plausible participation in the remodeling of the venous wall.
3.3. The Associations Between Sex and Differential Expression of Some Genes in Patients’ Veins
Then, we evaluated sex-related differences in the expression of the genes differentially expressed in VVs validated by RT-qPCR (Table 1). For this, we measured gene expression differences (in mRNA relative values) regarding an independent predictor variable—sex. Initially, we searched for possible differences in gene expression between men and women (a) within NV samples and (b) within VV samples, as well as (c) within NV/VV or VV/NV paired samples’ ratio, depending on the downregulation or upregulation of a gene, which could also be informative, for each gene from our list. It turned out, that only in case of three genes—the STK38L, TIMP1, and EBF1—certain differences were observed (see Figure 3B, Figure 4B and Figure 5B in the text below) compared to other genes investigated (see Supplementary Figures S1B–S20B). Therefore, we decided to illustrate the results for these genes within the main text.
To see whether there is a relationship between each dependent variable—normalized gene expression value that reflects relative mRNA level of a gene in NV or VV or their ratio (NV/VV or VV/NV, depending on the downregulation or upregulation of a gene) and the independent variable—and sex, scatter diagrams for all genes were constructed. The results are shown in the graphs with correlations (scatter plot and the corresponding regression line) in Figure 3C, Figure 4C and Figure 5C in the text below for the STK38L, TIMP1, and EBF1 genes or in Supplementary Figures S1C–S20C for other genes investigated.
To further identify and characterize relationships among sex and multiple factors (relative mRNA level of a gene in NV or VV, or their ratio), multiple linear regression (MLR) analysis was performed (for the details, see the Section 2. Two kinds of MLR were implemented to the gene expression data: (1) all additional parameters available (such as age, BMI, VVD manifestation, CEAP class, height, VVD duration) were applied simultaneously with the main studied independent predictor variable—sex (to take into account their possible joint influence) vs. dependent variables (gene expression relative values in series: for NV, VV, or their ratio); (2) only the main studied independent predictor variable—sex—was applied vs. dependent variables; gene expression relative values for NV, VV, and their ratio. The data tables on both kinds of MLR analyses for all the models used is presented in Figure 3D, Figure 4D and Figure 5D in the text below for the STK38L, TIMP1, and EBF1 genes or in Supplementary Table S2 for other genes investigated. According to the multicollinearity diagnostics performed to ensure regression model stability, none of our regression models had the multicollinearity issue since VIFs and GVIFs were below their thresholds (the results are shown in the last column of Supplementary Table S2).
Additionally, using MATCH Suite (release 3.1 by geneXplain) software package, we performed gene regulation analysis for the aforementioned genes demonstrating expression differences in veins in a sex-specific manner, as well as for some other genes with a similar tendency. The goal of the analysis was to reveal sex hormone-related transcription factor binding sites (TFBS) for the studied genes and to identify the transcription factors regulating those genes through their regulatory regions (promoter and associated enhancers and silencers). Specifically, we were interested in TFBS for transcription factors themselves acting as nuclear receptors for their ligands—sex hormones. These receptors include androgen receptors (AR), estrogen receptors (ER), and progesterone receptors (PR). Such TFBS are crucial for regulating gene expression and are located in the regulatory regions of genes that are responsive to sex hormones like androgen, estrogen, and others. The results of the analysis are shown in Table 2 and Supplementary Table S3.
Table 2.
Sex hormone-related TFBS within regulatory regions of the genes demonstrating differences (p-value < 0.05) and tendencies (0.05 < p-value < 0.1) for sex-specific expression in veins.
3.3.1. STK38L
For the STK38L gene located on the chromosome 12, we observed the differences in its expression between men and women in both sample subsets—NVs and VVs: it was higher in NVs and VVs of women 3.11-fold (p-value = 0.014) and 2.69-fold (p-value = 0.024), correspondingly (Figure 3B).

Figure 3.
STK38L gene expression (mRNA level) data analysis. (A) Distribution of gene expression relative values in paired non-varicose vs. varicose vein segments in patients of the whole sample; (B) distribution of gene expression relative values in non-varicose and varicose vein segments according to sex; (C) scatter plot and the corresponding regression line for the relationship between the dependent (gene expression) variable and independent (sex) variable; (D) multiple linear regression analysis results of the STK38L gene expression. The box borders show the interquartile range, the horizontal line inside it indicates the median, and the whiskers show the maximum and minimum values; NV—non-varicose vein; VV—varicose vein; MLR—multiple linear regression; ** p-value < 0.01, * p-value < 0.05 (Wilcoxon test (A), Student’s t-test, Mann–Whitney U test (B)); † all parameters (independent predictor variables) applied together: sex, age, BMI, VVD manifestation, CEAP class, height, VVD duration (data are provided only for sex); # sex is the only independent predictor variable; Beta—regression coefficient; R—coefficient of multiple correlation (the positive square root of the coefficient of multiple determination); p (Beta)—p-value of Beta; p (R)—p-value of R; Beta and R > |±0.25| are displayed in blue at p-value > 0.05; Beta and R > |±0.25| are displayed in red at p-value < 0.05; 0.05 < p-values < 0.1 are displayed in blue; p-values < 0.05 are displayed in red; r—correlation coefficient; r > |±0.3| is displayed in blue; r > |±0.5| is displayed in red; the number of patients of different sexes is indicated in the legend in the brackets; empty graphs (“–”) mean that MLR analysis results are not available (there were no variables in the regression equation).
One can see that STK38L gene expression in VV moderately correlated with sex (r = 0.449, p-value = 0.024) (Figure 3C). According to MLR analysis performed, sex had a direct effect on the STK38L relative mRNA level in VV when it was applied as an independent variable simultaneously with other parameters (Beta = 0.504, p (Beta) = 0.013; R = 0.516, p (R) = 0.033) (Figure 3D). Moreover, the addition of other independent variables in MLR did not change its single effect for VV (Beta = 0.449, p (Beta) = 0.024; R = 0.449, p (R) = 0.024). Sex tended to have a weak effect on the STK38L relative mRNA level in NV but it did not reach statistical significance of Beta and R coefficients.
In a search for sex hormone-related TFBS within regulatory regions of the STK38L gene (see Table 2), we revealed 78 binding sites (two of them in the promoter, and others in the enhancers, with affinity score = 12.20, affinity p-value = 4.88 × 10⁻⁵) for androgen receptor (AR) and progesterone receptor (PR), as well as 43 binding sites (one of them in the promoter, and others in the enhancers, with affinity score = 10.35, affinity p-value = 5.68 × 10⁻⁴) for estrogen receptor 1 (ER-alpha), estrogen receptor 2 (ER-beta), estrogen-related receptor alpha (ERR1), estrogen-related receptor beta (ERR2), and estrogen-related receptor gamma (ERR3) pointing to sex hormones’ effect on this gene’s expression in veins.
3.3.2. TIMP1
For the TIMP1 gene located on the chromosome X, we observed the difference in its expression between men and women in VV sample subset: it was 1.32-fold higher (p-value = 0.031) in VVs of men (Figure 4B). Additionally, when comparing the TIMP1 expression in VV/NV paired samples’ ratio between men and women, we found that it tended to be 2.49-fold higher (p-value = 0.077) in men compared to women.

Figure 4.
TIMP1 gene expression (mRNA level) data analysis. (A) Distribution of gene expression relative values in paired non-varicose vs. varicose vein segments in patients of the whole sample; (B) distribution of gene expression relative values in non-varicose and varicose vein segments according to sex; (C) scatter plot and the corresponding regression line for the relationship between the dependent (gene expression) variable and independent (sex) variable; (D) multiple linear regression analysis results of the TIMP1 gene expression. The box borders show the interquartile range, the horizontal line inside it indicates the median, and the whiskers show the maximum and minimum values; NV—non-varicose vein; VV—varicose vein; MLR—multiple linear regression; * p-value < 0.05, ** p-value < 0.01 (Wilcoxon test (A), Student’s t-test (B)); † all parameters (independent predictor variables) applied together: sex, age, BMI, VVD manifestation, CEAP class, height, VVD duration (data are provided only for sex); # sex is the only independent predictor variable; Beta—regression coefficient; R—coefficient of multiple correlation (the positive square root of the coefficient of multiple determination); p (Beta)—p-value of Beta; p (R)—p-value of R; Beta and R > |±0.25| are displayed in blue at p-value > 0.05; Beta and R > |±0.25| are displayed in red at p-value < 0.05; 0.05 < p-values < 0.1 are displayed in blue; p-values < 0.05 are displayed in red; r—correlation coefficient; r > |±0.5| are displayed in red; the number of patients of different sexes is indicated in the legend in the brackets; empty graphs (“–”) mean that MLR analysis results are not available (there were no variables in the regression equation).
One can see that TIMP1 gene expression in VV strongly correlated with sex (r = −0.612, p-value = 0.026) and for VV/NV ratio it had a tendency to moderate correlation (r = −0.5127, p-value = 0.073) (Figure 4C). According to linear regression analysis performed, when sex was the only independent predictor variable applied, sex had a strong reverse effect on the TIMP1 relative mRNA level in VV (Beta = −0.612, p (Beta) = 0.026; R = 0.612, p (R) = 0.026) (Figure 4D). Sex tended to have a moderate reverse effect on the VV/NV ratio of the TIMP1 expression but it did not reach statistical significance of Beta and R coefficients. The addition of other independent predictor variables in MLR changed its single effect for VV/Beta coefficient was tiny and did not reach statistical significance despite high R = 0.867 at p (R) = 0.004, meaning that additional parameters other than sex made more substantial relative contribution in the prediction of the dependent variable (TIMP1 expression in VV).
In a search for sex hormone-related TFBS within regulatory regions of the TIMP1 gene (see Table 2), we revealed only five binding sites within its enhancer (with affinity score = 8.44, affinity p-value = 1.85 × 10⁻²) for AR and PR, indicating that besides sex hormones’ effect, another way of sex influence on this gene’s expression in veins may take place since it is located directly on the X chromosome.
3.3.3. EBF1
For the EBF1 gene located on the chromosome 5, we observed the difference in its expression between men and women in NV sample subset: it was 1.77-fold higher (p-value = 0.046) in NVs of men (Figure 5B). However, a tendency for its sex-specific expression in VV sample subset was also detected: it was 1.39-fold higher (p-value = 0.104) in VVs of men compared to women.

Figure 5.
EBF1 gene expression (mRNA level) data analysis. (A) Distribution of gene expression relative values in paired non-varicose vs. varicose vein segments in patients of the whole sample; (B) distribution of gene expression relative values in non-varicose and varicose vein segments according to sex; (C) scatter plot and the corresponding regression line for the relationship between the dependent (gene expression) variable and independent (sex) variable; (D) multiple linear regression analysis results of the EBF1 gene expression. The box borders show the interquartile range, the horizontal line inside it indicates the median, and the whiskers show the maximum and minimum values; NV—non-varicose vein; VV—varicose vein; MLR—multiple linear regression; *** p-value < 0.001, * p-value < 0.05 (Wilcoxon test (A), Student’s t-test (B)); † all parameters (independent predictor variables) applied together: sex, age, BMI, VVD manifestation, CEAP class, height, VVD duration (data are provided only for sex); # sex is the only independent predictor variable; Beta—regression coefficient; R—coefficient of multiple correlation (the positive square root of the coefficient of multiple determination); p (Beta)—p-value of Beta; p (R)—p-value of R; Beta and R > |±0.25| are displayed in blue at p-value > 0.05; Beta and R > |±0.25| are displayed in red at p-value < 0.05; 0.05 < p-values < 0.1 are displayed in blue; p-values < 0.05 are displayed in red; r—correlation coefficient; r > |±0.3| is displayed in blue; r > |±0.5| is displayed in red; the number of patients of different sexes is indicated in the legend in the brackets; empty graphs (“–”) mean that MLR analysis results are not available (there were no variables in the regression equation).
One can see that EBF1 gene expression in NV moderately correlated with sex (r = −0.560, p-value = 0.046) (Figure 5C). According to the MLR analysis performed, sex had a strong reverse effect on the EBF1 relative mRNA level in NV (Beta = −0.659, p (Beta) = 0.027) pointing to a considerable relative contribution of sex compared to other independent parameters applied (since R = 0.642, p (R) = 0.070) in the prediction of the dependent variable (EBF1 expression in NV) (Figure 5D). An exceedingly reverse effect of sex on the EBF1 relative mRNA level in VV was observed when it was applied as an independent variable simultaneously with other parameters (Beta = −1.609, p (Beta) = 0.002; R = 0.895, p (R) = 0.021). Even though Beta coefficient appeared to be greater than 1 it was not excluded from the analysis because that could not be due to multicollinearity of sex variable with other parameters studied. Sex as an individual predictor was examined further and indicated that it was a moderate predictor for the EBF1 expression in NV (Beta = −0.560, p (Beta) = 0.046; R = 0.560, p (R) = 0.046).
In a search for sex hormone-related TFBS within regulatory regions of the EBF1 gene (see Table 2), we revealed 59 binding sites (two of them in the promoter, and others in the enhancers, with affinity score = 4.39, affinity p-value = 6.88 × 10⁻⁵) for PR and AR, as well as 52 binding sites in the enhancers of this gene (with affinity score = 6.06, affinity p-value = 3.6 × 10⁻³) for ER-alpha, ER-beta, ERR1, ERR2, and ERR3, which points to sex hormones’ effect on this gene’s expression in veins.
Additionally, we also performed a search for sex hormone-related TFBS within the regulatory regions of the genes demonstrating tendencies for sex-specific expression (see Supplementary Table S3): downregulated VCL (1.31-fold lower in VVs of women, p-value = 0.082) and PPP1R12B (1.95-fold lower in NVs of women, p-value = 0.081), as well as upregulated ITGA5 (1.32-fold lower in VVs of women, p-value = 0.061; 1.44-fold lower in VV/NV ratio of women, p-value = 0.090). As a result, 29 (5 of them in the promoter, and others in the enhancers), 14 (2 of them in the promoter, and others in the enhancers), and 16 (1 of them in the promoter, and others in the enhancers) TFBS for AR and PR were found for the VCL, PPP1R12B, and ITGA5 genes, respectively, as well as 23 (in the enhancers), 6 (in the enhancers), and 28 (2 of them in the promoter, and others in the enhancers) TFBS for ER-alpha, ER-beta, ERR1, ERR2, and ERR3, were found for the VCL, PPP1R12B, and ITGA5 genes, respectively, on average, with lower affinity values compared to the STK38L and EBF1 genes demonstrating sex-specific expression in veins.
4. Discussion
The necessity for differential treatment of various diseases depending on sex has long been reported. Sex has been suggested for considering as an important variable to study the pathogenesis of certain diseases [20]. In chronic venous diseases, sex differences are also of high significance to clinical research and practice. As such, sex and age are determining factors for chronic venous disease and influence the risk by 10.7% [43,44]. Studies of changes in gene expression provide insights into the molecular mechanisms implicated in the transition from a healthy to a disease state and can be used to identify patients at higher risk for particular medical conditions, higher symptom burden, and adverse consequences associated with various treatments [45]. It was demonstrated that changes in the expression level of genes (in most cases, with nonlinear relationship between expression and a phenotype) may predictably alter genetic interactions [46]. During critical developmental stages, human body systems demonstrate sex-specific gene expression that may be regulated by hormone-responsive elements related to those genes and could influence the incidence and manifestation of certain diseases across sexes [20]. In the case of VVs, venous transformation can be considered as the formation of a modified organ, when critical stages of this process governed by sex-specific gene expression also take place.
In the present study, first of all, we validated our previous microarray data [22] for a set of genes differentially expressed in VVs (Table 1), thereby confirming their plausible participation in the remodeling of the venous wall. Then, we evaluated sex-specific differences in the expression of these genes within NV and VV sample (or their paired ratio) subsets separately. Certain sex-related differences have been observed for the expression of the STK38L (higher in NVs and VVs of women), TIMP1 (higher in VVs of men, tended to be higher in VV/NV ratio of men) and EBF1 (higher in NVs of men, tended to be higher VVs of men) genes (Figure 3B, Figure 4B and Figure 5B), compared to other genes investigated (Supplementary Figures S1B–S20B). However, the tendencies for sex-specific expression were detected for the VCL (higher in VVs of men), PPP1R12B (higher in NVs of men), and ITGA5 (higher in VVs and VV/NV ratio of men).
The results of MLR analyses enabled us to extract additional information regarding the association of sex (along with various parameters—other predictor variables) with the expression level of the studied genes in veins. As such, sex (either as the only independent variable or in combination with other parameters) directly affected the STK38L expression in VVs (being higher in women) suggesting its sex-dependent involvement in the development of the disease. For the TIMP1 gene, sex (only as a separate independent variable) obviously affected its expression in VVs (being higher in men). Sex also influenced the EBF1 mRNA level in NVs. Since the EBF1 was downregulated in VVs and its expression was 1.77-fold lower (before varicose transformation) in NVs of women compared to men, it is logical to assume the existence of systemic effects of this gene’s product on the development of VVs and additional evidence of the female sex as a risk factor for this pathology.
Sex differences in gene expression vary not only across the genome but between individuals, which was demonstrated in our data on gene expression with interindividual variability. The study by Oliva et al. highlighted that overlapping distributions of gene expression between the sexes could be the result of not strictly dimorphic interindividual variation [47,48]. It was shown that STK38L (serine/threonine kinase 38 like) gene product promotes cardiac fibroblast activation and proliferation, and its increased expression is closely associated with atrial fibrillation characterized by atrial fibrosis and TGF-β1-induced myocardial fibrosis [49]. Additionally, STK38L is involved in apoptosis signaling, alignment of mitotic chromosomes, controlling centrosome duplication, and G1/S transition, promoting G1 progression [50]. It is noteworthy that TIMP1 gene is located on the X chromosome and therefore can escape random X inactivation, which may result in higher expression levels of this gene in women than in men [51]; moreover, this gene inactivation is polymorphic in human females, which results in predisposition of some women to this gene’s expression [52], and its transcription is highly inducible in response to many cytokines and hormones. Notwithstanding this, according to our data for veins, we observed a higher expression level of this gene in VVs of men compared to women, as well as a tendency for higher VV/NV expression ratio in men. The explanation for this phenomenon could be that men have an always-active single X chromosome, while women have two X chromosomes but a randomly inactive one, causing mosaic expression and often reduced gene dosage per cell for many X-linked genes, also taking into account tissue-specific distribution of the female/male gene fold ratio for some X-linked genes (ranging from 3 to 18% of genes with higher expression in males depending on tissue) [53]. Interestingly, sex differences in extracellular matrix production and remodeling related, in particular, to matrix metalloproteinases and their tissue inhibitors were demonstrated [54]. The important regulatory effect of the TIMP1, being expressed in the liver endothelial and stellate cell populations, on the formation and degradation of liver fibrosis was observed [55], as well as its participation in ventricular remodeling caused by hypertension, leading to myocardial fibrosis [56]. The EBF1 gene was prioritized as one of the most likely causative genes for VVs development [57]. Its product is a transcription factor that promotes B cell and pericyte cell differentiation (being a bona fide pericyte marker) [58], is involved in blood pressure and hypertension, and is associated with carotid intimal thickness [59], cardiovascular, and metabolic risk [60,61], as well as immune response/inflammation [57]. The mechanotransduction protein vinculin, encoded by the VCL gene (its defects cause dilated cardiomyopathy), is important for the endothelial barrier due to the recruitment of vinculin to AJs protein, which results in strengthening the endothelial cell–cell junctions in blood vessels and preventing developing vessels from vascular leakage [62]. As for the PPP1R12B gene coding for myosin phosphatase 1 regulatory subunit 12B (that undergoes insulin-stimulated phosphorylation [63]), its intronic variant (rs1819043) is directly involved in the reproductive system and associated with sex ratio [64], and another variant (rs697455) serves as a sex-different autosomal marker [65]. The PPP1R12B was identified as a key biomarker for abdominal aortic aneurysm prediction: its downregulation in this disease was linked to increased N6-methyladenosine levels [66]. It is noteworthy that environmentally altered PPP1R12B expression (in animal models) sex-dependently involved motivation-related brain regions [67]. The ITGA5 gene was shown to be among the four common genes of all three important processes (‘extracellular matrix organization’, ‘cell adhesion’, ‘blood vessel morphogenesis’) largely activated in VV condition, and its product—integrin alpha-5 protein—was identified as a potential primary master regulator of VV pathogenesis [22].
In terms of genetic mechanisms, there are two general models (not necessarily exclusive of one another) known to explain sex differences in gene expression: (1) when hormones in men and women differentially influence various genes’ expression level and (2) when rate-limiting step in different pathways is encoded/influenced by an X- or Y-chromosome-linked gene with dosage differences between men and women [68]. Besides possible mechanisms exerting sex differences in VVs, such as skewed X chromosome inactivation and genes escaping it, cellular mosaicism, and miRNAs encoded on the X chromosome, the most studied have been effects of sex hormones and their receptors. These receptors, specifically distributed on the cell surface according to sex, may define differences in susceptibility to disease, the average age of onset, and response to therapy [69]. Due to both genomic and nongenomic effects of sex hormones on the endothelium and smooth muscle cells, the vascular effects of sex hormones could be different in the two sexes [69]. Regarding the contribution of hormonal regulation in the process of varicose transformation, a possible causal relationship between sex steroids (elevated serum estradiol and testosterone levels along with downregulation of hormonal receptors and enzymes involved in steroid metabolism) and VVs was shown in men [70]. In addition, greater venous distensibility and VVs in menopausal women have been associated with high estrogen levels [21]. How hormones affect molecular changes occurring within the venous wall, remains to be established considering many factors implicated, including differences in the stimulation or inhibition of cell populations by sex hormones, differences in the regulation of vascular tone and synthesis of the extracellular matrix products, as well as hormones’ and their receptors’ actions in numerous pathways [69]. For instance, Fan et al. have partly explained the sex-stratified prevalence of VVs by the greater odds ratio of higher serum sex hormone-binding globulin (SHBG) levels in women, compared to men [71]. While discussing sex differences in vascular endothelial function regarding COVID-19, Kitselman et al. called attention to the existence of a testosterone-inducible element located in the promoter of the host transmembrane serine protease gene—TMPRSS2, which explains sex-based differences in the immune response [51]. They also mentioned the potential reason for the observed sex differences in myalgic encephalomyelitis chronic fatigue syndrome (ME-CFS)—a recurrent chronic disease predominantly affecting females (as in case of varicose veins) and linked to endothelial dysfunction and the immune system: the modulation of cytokine gene expression by steroid hormones, such as estrogen. In the context of the vein-specific inflammation component in the process of varicose transformation, it is worthy of noting about direct estrogen-related stimulation of IL-1 production by macrophages [51].
Besides the hormonal hypothesis, epigenetics as the unifying mechanism in explaining sex-specific differences in disease susceptibility has been amply demonstrated [72]. In this regard, a large-scale meta-analysis with integration of the DNA methylome and transcriptome in human skeletal muscle identified sex-specific genes associated with muscle contraction, substrate metabolism and anatomical structure-related pathways, suggesting DNA methylation and gene expression differences between men and women in skeletal muscle are functionally linked, and that hormone-related transcription factor binding sites (TFBS) and muscle fiber type proportions underlie those differences [73]. This has also been in tune with our sample set: we observed sex-specific differences in anatomical manifestation of CVeD (Figure A1) and additionally proved that compared to men, a larger percentage of women suffered from hypothyroidism and autoimmune diseases (Figure A2)—the conditions to which they had a higher susceptibility [20] since their vascular dysfunction is often characterized by an imbalance of thyroid hormones. Sex-related features of insulin resistance and vascular calcification were also observed in women [20].
Additional analysis on the regulatory regions of the studied genes helped us uncover meaningful biological insights on sex differences in the genetic regulation of gene expression and gain a more thorough view of the sex-related molecular basis of VVs. Indeed, the integration of regulatory region motif searches for sex hormone-related TFBS with signaling pathway knowledge available in the geneXplain platform allowed us to move from a descriptive list of gene expression changes to a testable model of why those changes occurred. As a result, we identified matrices (site models) regulating the input genes through sex hormone-inducible transcription factors (AR, PR, ER-alpha, ER-beta, ERR1, ERR2, ERR3) (see Table 2 and Supplementary Table S3). As for the STK38L, 78 (2 in the promoter; 76 in the enhancers) TFBS for AR and PR, and 43 (1; 42) TFBS for ER-alpha, ER-beta, ERR1, ERR2, and ERR3 were revealed. As for the TIMP1, 5 (0; 5) TFBS for AR and PR were found. As for the EBF1, 59 (2; 57) TFBS for AR and PR, and 52 (0; 52) TFBS for ER-alpha, ER-beta, ERR1, ERR2, ERR3 were identified. This indicates that STK38L and EBF1 expression in veins is affected by sex hormones while the expression of the TIMP1, located on the X chromosome, is most likely affected by sex through different mechanisms. Among many differentially expressed genes found on the X chromosome, only 4% were with sex-differential expression [48]. Another prominent example: in a search for sex hormone-related TFBS within regulatory regions of the Mn-SOD gene, we did not reveal any, which may indicate that sex hormones do not affect this gene’s expression in veins.
Our data are consistent with the fact that the vast majority of AR binding sites is located in enhancers, with few binding sites found in promoters; moreover, clinical AR binding sites display remarkable plasticity and reprogramming during disease progression so that AR may gain many more additional binding sites [74]. Several studies have shown that the epigenetic landscape of enhancers is intricately organized by several regulatory protein complexes during development into a predetermined pattern [75]. Using STARR-seq, three different classes of binding sites constituting inducible, inactive, and constitutive enhancers, were revealed. While 81% of AR binding sites did not demonstrate any enhancer activity and approximately 12% exhibited constitutive enhancer activity independently of AR binding, only 7% of the regions showed AR-activated or inducible enhancer activity [74]. Also, a comprehensive genome-wide analysis revealed that enhancer activity is strongly influenced by the genomic location of a full estrogen response element and that active ER binding site clusters (being associated with more pronounced expression changes) are more likely to be found nearby regulated genes [76]. For instance, though there are many ER binding site clusters throughout the genome, it was shown that most genes do not have an active cluster within 100 kb that resembles particular enhancers [76].
The latter is true for our data (see Supplementary Table S3). Compared to the genes which demonstrate sex-specific expression in veins, it may seem that some other genes’ regulatory regions contain even more sex hormone-inducible TFBS, such as in case of the ABCA1 gene: it has 156 (9; 147) TFBS for AR and PR, as well as 53 (0; 53) TFBS for ER-alpha, ER-beta, ERR1, ERR2, and ERR3. Nevertheless, merely a large number of particular TFBS does not guarantee sex-specific regulation of a gene because only 37 out of 147 and 15 out of 53 TFBS in enhancers, correspondingly, are located within 100 kb of the ABCA1 gene’s promoter, meaning that the majority of them are not sex hormone-inducible. Moreover, the ABCA1 was absent among sex-biased genes in the data presented within the scrutinizing work by Oliva et al. who provided an extensive characterization of sex differences in the human (44 tissue sources) transcriptome and its genetic regulation [47].
Oliva et al. concluded that sex-specifically expressed genes are involved in diverse biological functions and not primarily driven by tissue-specific gene expression; so that sex-related distribution of epigenetic marks (such as H3K27me3), the enrichment of TFBS in sex-biased gene promoters, along with the high tissue specificity of sex-biased gene expression, implies the latter is mediated by specific transcription factors [47]. According to their data, we can conclude that sex-specific regulation of a gene strongly depends on the tissue/organ where it is expressed: for instance, it is very true for the TIMP1 gene which expression is female-biased particularly in artery_tibial (enrichment p-value = 2.05 × 10⁻¹³), brain_cortex (enrichment p-value = 2.39 × 10⁻⁸), brain_hippocampus (enrichment p-value = 3.21 × 10⁻⁹). Therefore, we can somehow unambiguously extrapolate that to vein_saphenous (also attributing to the ‘blood vessel’ tissue group) investigated in our study. As for the limitations of the work by Oliva et al., over two-thirds of the samples were from men, meaning that studies were unevenly statistically powered to detect sex differences [48].
Limitations of the present study include the small study sample with a fewer number of men than women, which may not be representative of all men who develop VVs. The interpretability of these results may be limited by the complex interrelations of the expression of genes investigated with other associated conditions and comorbidities. Certainly, the sex-specific regulation of those genes in varicose and normal superficial veins requires further clinical and laboratory studies.
Last but not least, there may be sex differences in pharmacological effects of any drugs due to disparities in pharmacokinetics and pharmacodynamics of their absorption, distribution, metabolism, and excretion. Therefore, this knowledge when being applied could be essential to ensure the proper effects of drugs [77]. As an example, sex differences in aspirin treatment were experimentally proved: it was less effective in preventing retinal ischemia in female than in male diabetic rats [78]. Additionally, there could be modulating effects of some vasoactive substances on hormonal responsiveness: in case of resveratrol, such differences were observed between males and females [79]. We should also consider sex differences regarding VVs in order to move forward towards the personalized genomic medicine application.
5. Conclusions
The present study is one of the few attempts, to the best of our knowledge, to assess how male or female sex may contribute to the changes to gene expression profiles in the vein wall during varicose transformation. After verification of altered expression of a set of genes in VVs, we have shown sex-specific expression in veins for the STK38L, TIMP1, and EBF1 genes, as well as some sex-related tendencies for other genes differentially expressed in VVs, and that sex was a predictor for their expression. Furthermore, using a search for binding sites for transcription factors—sex hormone receptors—within the regulatory regions of the studied genes, we obtained insights on their sex-specific regulation. To further delve into the mechanisms of these genes’ sex-specific regulation it is necessary to reveal complex transcription factor interactions in promoters and enhancers, which may help us understand how gene expression patterns define cell identity and disease. Understanding sex features for the development of VVs may provide the foundation for preventative measures, beneficial treatments, and curative therapies.
Supplementary Materials
The following supporting information can be downloaded at https://www.mdpi.com/article/10.3390/biomedicines13102373/s1. Table S1: Primers used in the study; Table S2: Sex-related multiple linear regression analysis results of the expression of genes (listed in the alphabetical order) not included in figures of the main text (due to incomplete significance) and, for the reference (at the end of the Table), genes included in figures of the main text; Table S3: Sex hormone-related TFBS within regulatory regions of the genes (listed in the alphabetical order) not included in Table 2 of the main text; Figures S1–S20: Gene expression (mRNA level) data analysis results for genes (listed in the alphabetical order) not included in figures of the main text (due to incomplete significance).
Author Contributions
Conceptualization, M.A.S. and M.L.F.; methodology, M.A.S. and V.A.K.; software, V.A.K.; validation, M.A.S., V.A.K. and F.A.S.; formal analysis, M.A.S. and V.A.K.; investigation, M.A.S., V.A.K. and F.A.S.; resources, K.A.G., K.S.S., A.I.S. and M.L.F.; data curation, M.A.S., V.A.K., K.A.G. and K.S.S.; writing—original draft preparation, M.A.S. and V.A.K.; writing—review and editing, M.A.S.; visualization, M.A.S. and V.A.K.; supervision, M.A.S.; project administration, M.A.S.; funding acquisition, M.A.S. and M.L.F. All authors have read and agreed to the published version of the manuscript.
Funding
This work was supported by the Russian state-funded project for ICBFM SB RAS (grant number 125012300674-9).
Institutional Review Board Statement
The study was conducted in accordance with the Declaration of Helsinki and approved by the Ethics Committee of the Institute of Chemical Biology and Fundamental Medicine (protocols No.15, 2013-09-13, and No.03, 2019-10-06).
Informed Consent Statement
Informed consent was obtained from all subjects involved in the study.
Data Availability Statement
Data are contained within the article and Supplementary Materials.
Acknowledgments
The authors are grateful to Alexander Kel and Daria Stelmashenko (geneXplain GmbH, Wolfenbüttel, Germany) for the helpful advice and technical support on the MATCH Suite software, and the native English speaker Holly Jacob (Texas A&M University, USA) for editing assistance and thorough text revision.
Conflicts of Interest
The authors declare no conflicts of interest. The funders had no role in the design of the study; in the collection, analyses, or interpretation of data; in the writing of the manuscript; or in the decision to publish the results.
Abbreviations
The following abbreviations are used in this manuscript:
| AR | Androgen receptor |
| BMI | Body mass index |
| cDNA | Complementary DNA |
| CEAP | Clinical, Etiological, Anatomical, and Pathophysiological (classification) |
| CVeD | Chronic venous disease |
| ER-alpha | Estrogen receptor 1 |
| ER-beta | Estrogen receptor 2 |
| ERR1 | Estrogen-related receptor alpha |
| ERR2 | Estrogen-related receptor beta |
| ERR3 | Estrogen-related receptor gamma |
| GO | Gene Ontology |
| GSV | Great saphenous vein |
| IQR | Interquartile range |
| MLR | Multiple linear regression |
| mRNA | Messenger ribonucleic acid |
| NVs | Non-varicose veins |
| PR | Progesterone receptor |
| RT-qPCR | Reverse transcription quantitative polymerase chain reaction |
| SSV | Small saphenous vein |
| TFBS | Transcription factor binding sites |
| VVD | Varicose vein disease |
| VVs | Varicose veins |
Appendix A
Appendix A.1

Figure A1.
Heatmaps depicting the percentage of patients (among those patients who provided data in the questionnaires) and their number in the brackets on descriptive characteristics (categorical parameters) according to sex. (1st Panel): percentage of patients with different anatomical manifestation of CVeD in the left (A) and right (B) leg; (2nd Panel): percentage of patients with different clinical class of CVeD in the left (C) and right (D) leg; (3rd Panel): percentage of patients with a different extent of pathological venous reflux in the left (E) and right (F) leg. Colors represent the percentage levels from low (blue) to high (red); p-value (in the brackets) shows the likelihood of the data occurring under the null hypothesis of the chi2 test (categorical parameter vs. sex). CVeD—chronic venous disease; GSV—great saphenous vein; G + SSV—small and great saphenous vein; GSV + p—great saphenous vein and perforators; SSV—small saphenous vein; p—perforators; t—tributaries; C-class (C)—clinical class according to the CEAP classification. The extent of pathological venous reflux is coded as follows: 1—to the upper third of the thigh, 2—to the middle third of the thigh, 3—to the lower third of the thigh, 4—to the upper third of the calf, 5—to the middle third of the calf, 6—to the lower third of the calf.
Appendix A.2

Figure A2.
Heatmaps depicting the percentage of patients (among those patients who provided data in the questionnaires) and their number in the brackets on family history for CVeD and comorbidities (categorical parameters) according to sex. Percentage of patients without (−) and with (+) family history for CVeD (A), and patients not suffering (−) and suffering (+) from hypothyroidism (B), liver and/or gallbladder diseases (C), autoimmune diseases (D), hypertension (E), obesity (F), diabetes (G), other cardiovascular diseases (H), musculoskeletal disorders (I), and gastrointestinal disorders (J). Colors represent the percentage levels from low (blue) to high (red); p-value (in the brackets) shows the likelihood of the data occurring under the null hypothesis of the chi2 test (categorical parameter vs. sex). CVeD—chronic venous disease; CVDs—cardiovascular diseases; MSDs—musculoskeletal disorders; GI—gastrointestinal.
References
- Salim, S.; Machin, M.; Patterson, B.O.; Onida, S.; Davies, A.H. Global epidemiology of chronic venous disease: A systematic review with pooled prevalence analysis. Ann. Surg. 2021, 274, 971–976. [Google Scholar] [CrossRef]
- Antani, M.R.; Dattilo, J.B. Varicose Veins; StatPearls Publishing: Treasure Island, FL, USA, 2023. [Google Scholar]
- Lurie, F.; Passman, M.; Meisner, M.; Dalsing, M.; Masuda, E.; Welch, H.; Bush, R.L.; Blebea, J.; Carpentier, P.H.; De Maeseneer, M.; et al. The 2020 update of the CEAP classification system and reporting standards. J. Vasc. Surg. Venous Lymphat. Disord. 2020, 8, 342–352. [Google Scholar] [CrossRef]
- Beebe-Dimmer, J.L.; Pfeifer, J.R.; Engle, J.S.; Schottenfeld, D. The epidemiology of chronic venous insufficiency and varicose veins. Ann. Epidemiol. 2005, 15, 175–184. [Google Scholar] [CrossRef] [PubMed]
- Zamboni, P.; Gianesini, S.; Menegatti, E.; Tacconi, G.; Palazzo, A.; Liboni, A. Great saphenous varicose vein surgery without saphenofemoral junction disconnection. Br. J. Surg. 2010, 97, 820–825. [Google Scholar] [CrossRef] [PubMed]
- Brand, F.N.; Dannenberg, A.L.; Abbott, R.D.; Kannel, W.B. The epidemiology of varicose veins: The Framingham Study. Am. J. Prev. Med. 1988, 4, 96–101. [Google Scholar] [CrossRef] [PubMed]
- Scott, T.E.; LaMorte, W.W.; Gorin, D.R.; Menzoian, J.O. Risk factors for chronic venous insufficiency: A dual case-control study. J. Vasc. Surg. 1995, 22, 622–628. [Google Scholar] [CrossRef]
- Criqui, M.H.; Denenberg, J.O.; Bergan, J.; Langer, R.D.; Fronek, A. Risk factors for chronic venous disease: The San Diego Population Study. J. Vasc. Surg. 2007, 46, 331–337. [Google Scholar] [CrossRef]
- Helkkula, P.; Hassan, S.; Saarentaus, E.; Vartiainen, E.; Ruotsalainen, S.; Leinonen, J.T.; FinnGen; Palotie, A.; Karjalainen, J.; Kurki, M.; et al. Genome-wide association study of varicose veins identifies a protective missense variant in GJD3 enriched in the Finnish population. Commun. Biol. 2023, 6, 71. [Google Scholar] [CrossRef]
- Evans, C.J.; Fowkes, F.G.; Ruckley, C.V.; Lee, A.J. Prevalence of varicose veins and chronic venous insufficiency in men and women in the general population: Edinburgh Vein Study. J. Epidemiol. Community Health 1999, 53, 149–153. [Google Scholar] [CrossRef]
- Naik, B.; Kumar, M.; Khanna, A.K.; Suman, P.K. Clinico-histopathological study of varicose vein and role of matrix metalloproteinases-1, matrix metalloproteinases-9 and tissue inhibitor of matrix metalloproteinase-1 in varicose vein formation. Indian J. Pathol. Microbiol. 2016, 59, 25–30. [Google Scholar]
- Zolotukhin, I.A.; Seliverstov, E.I.; Shevtsov, Y.N.; Avakiants, I.P.; Nikishkov, A.S.; Tatarintsev, A.M.; Kirienko, A.I. Prevalence and risk factors for chronic venous disease in the general Russian population. Eur. J. Vasc. Endovasc. Surg. 2017, 54, 752–758. [Google Scholar] [CrossRef]
- Ivan, S.; Daniela, O.; Jaroslava, B.D. Sex differences matter: Males and females are equal but not the same. Physiol. Behav. 2023, 259, 114038. [Google Scholar] [CrossRef]
- Jacobs, B.N.; Andraska, E.A.; Obi, A.T.; Wakefield, T.W. Pathophysiology of varicose veins. J. Vasc. Surg. Venous Lymphat. Disord. 2017, 5, 460–467. [Google Scholar] [CrossRef]
- Ismail, L.; Normahani, P.; Standfield, N.J.; Jaffer, U. A systematic review and meta-analysis of the risk for development of varicose veins in women with a history of pregnancy. J. Vasc. Surg. Venous Lymphat. Disord. 2016, 4, 518–524.e1. [Google Scholar] [CrossRef]
- Mullane, D.J. Varicose veins of pregnancy. Am. J. Obstet. Gynecol. 1952, 63, 620–628. [Google Scholar] [CrossRef][Green Version]
- Lohr, J.M.; Bush, R.L. Venous disease in women: Epidemiology, manifestations, and treatment. J. Vasc. Surg. 2013, 57, 37S–45S. [Google Scholar] [CrossRef]
- Han, A. Sex/gender differences in chronic venous disease. In Sex/Gender-Specific Medicine in Clinical Areas; Kim, N., Ed.; Springer: Singapore, 2024; pp. 355–365. [Google Scholar] [CrossRef]
- Baldazzi, G.; Tessari, M.; Zamboni, M.; Pagani, A.; Zamboni, P. The sex prevalence of lower limb varicose vein networks. J. Vasc. Surg. Venous Lymphat. Disord. 2024, 12, 101944. [Google Scholar] [CrossRef] [PubMed]
- Shi, Y.; Ma, J.; Li, S.; Liu, C.; Liu, Y.; Chen, J.; Liu, N.; Liu, S.; Huang, H. Sex difference in human diseases: Mechanistic insights and clinical implications. Signal. Transduct. Target. Ther. 2024, 9, 238. [Google Scholar] [CrossRef]
- García-Honduvilla, N.; Asúnsolo, Á.; Ortega, M.A.; Sainz, F.; Leal, J.; Lopez-Hervas, P.; Pascual, G.; Buján, J. Increase and redistribution of sex hormone receptors in premenopausal women are associated with varicose vein remodelling. Oxidative Med. Cell. Longev. 2018, 2018, 3974026. [Google Scholar] [CrossRef] [PubMed]
- Smetanina, M.A.; Kel, A.E.; Sevost’ianova, K.S.; Maiborodin, I.V.; Shevela, A.I.; Zolotukhin, I.A.; Stegmaier, P.; Filipenko, M.L. DNA methylation and gene expression profiling reveal MFAP5 as a regulatory driver of extracellular matrix remodeling in varicose vein disease. Epigenomics 2018, 10, 1103–1119. [Google Scholar] [CrossRef] [PubMed]
- Smetanina, M.A.; Shadrina, A.S.; Zolotukhin, I.A.; Seliverstov, E.I.; Filipenko, M.L. Differentially expressed genes in varicose veins disease: Current state of the problem, analysis of the published data. J. Venous Disord. 2017, 11, 190–204. (In Russia) [Google Scholar] [CrossRef]
- Smetanina, M.A.; Sipin, F.A.; Seliverstov, E.I.; Zolotukhin, I.A.; Filipenko, M.L. Differentially expressed genes in lower limb varicose vein disease. J. Venous Disord. 2020, 14, 122–134. (In Russia) [Google Scholar] [CrossRef]
- Zolotukhin, I.A.; Porembskaya, O.Y.; Smetanina, M.A.; Sazhin, A.V.; Filipenko, M.L.; Kirienko, A.I. Varicose veins: On the verge of discovering the cause? Ann. Russ. Acad. Med. Sci. 2020, 75, 36–45. [Google Scholar] [CrossRef]
- Smetanina, M.A.; Shevela, A.I.; Gavrilov, K.A.; Filipenko, M.L. The genetic constituent of varicose vein pathogenesis as a key for future treatment option development. Vessel Plus 2021, 5, 19. [Google Scholar] [CrossRef]
- Korolenya, V.A.; Gavrilov, K.A.; Sevostyanova, K.S.; Shevela, A.I.; Filipenko, M.L.; Smetanina, M.A. Expression of the ACTA1, PLXNA4, and SEMA3A genes in varicose veins of patients with different length of great saphenous vein reflux. J. Venous Disord. 2022, 16, 270–278. [Google Scholar] [CrossRef]
- Gavrilov, K.A.; Smetanina, M.A.; Korolenya, V.A.; Sevostyanova, K.S.; Filipenko, M.L.; Shevela, A.I. Molecular genetic aspects of varicose vein disease: Modern concepts. J. Venous Disord. 2024, 18, 48–53. (In Russia) [Google Scholar] [CrossRef]
- Korolenya, V.; Filipenko, M.; Smetanina, M. Varicose vein disease in the context of insulin resistance. Vessel Plus 2024, 8, 35. [Google Scholar] [CrossRef]
- Shevela, A.I.; Gavrilov, K.; Sevostyanova, K.S.; Filipenko, M.L.; Smetanina, M.A. Altered expression of the extracellular matrix related genes COL15A1, CHRDL2, EFEMP1 and TIMP1 in varicose veins. Eur. J. Vasc. Endovasc. Surg. 2020, 60, e75–e76. [Google Scholar] [CrossRef]
- Smetanina, M.A.; Korolenya, V.A.; Ershov, N.I.; Arslanbekov, M.M.; Zolotukhin, I.A.; Filipenko, M.L. Genetic factors leading to recurrent varicose veins after surgical treatment. J. Vasc. Surg. Venous Lymphat. Disord. 2021, 9, 537. [Google Scholar] [CrossRef]
- Korolenya, V.A.; Gavrilov, K.A.; Sevostyanova, K.S.; Shevela, A.I.; Filipenko, M.L.; Smetanina, M.A. GPI, CALU, PLA2G2A Genes are Differentially Expressed in Varicose Veins. In Proceedings of the 14th St. Petersburg Venous Forum (Christmas Meetings), Saint-Petersburg, Russia, 8–10 December 2021. [Google Scholar]
- Smetanina, M.A.; Korolenya, V.A.; Gavrilov, K.A.; Sevostyanova, K.S.; Shevela, A.I.; Filipenko, M.L. CCL2, SULF1, and CASZ1 Genes are Up-regulated in Varicose Veins. In Proceedings of the 14th St. Petersburg Venous Forum (Christmas Meetings), Saint-Petersburg, Russia, 8–10 December 2021. [Google Scholar]
- Smetanina, M.A.; Korolenya, V.A.; Kel, A.E.; Arslanbekov, M.M.; Zolotukhin, I.A.; Filipenko, M.L. Systemic changes of gene expression in venous tissue leading to varicose vein disease could be potentially treated by targeting PSMA7 and DUSP9 genes’ activity. J. Vasc. Surg. Venous Lymphat. Disord. 2022, 10, 543. [Google Scholar] [CrossRef]
- Gavrilov, K.A.; Shevela, A.I.; Smetanina, M.A.; Koroleva, L.S.; Sevostyanova, K.S. Horizons of Molecular Genetic Diagnosis and Varicose Veins Treatment. In Proceedings of the UIP XIX World Congress of Phlebology, Istanbul, Turkey, 12–16 September 2022. [Google Scholar] [CrossRef]
- Korolenya, V.A.; Gavrilov, K.A.; Sevostyanova, K.S.; Shevela, A.I.; Filipenko, M.L.; Smetanina, M.A. Evaluation of advantages of lithium chloride as a precipitating agent in RNA isolation from frozen vein segments. Bull. Exp. Biol. Med. 2022, 173, 384–389. [Google Scholar] [CrossRef]
- Hellemans, J.; Mortier, G.; De Paepe, A.; Speleman, F.; Vandesompele, J. qBase relative quantification framework and software for management and automated analysis of real-time quantitative PCR data. Genome Biol. 2007, 8, R19. [Google Scholar] [CrossRef] [PubMed]
- Hellemans, J.; Vandesompele, J. qPCR data analysis: Unlocking the secret to successful results. In PCR Troubleshooting and Optimization: The Essential Guide; Kennedy, S., Oswald, N., Eds.; Caister Academic Press: Louvain, Belgium, 2011. [Google Scholar]
- Schneider, A.; Hommel, G.; Blettner, M. Linear regression analysis: Part 14 of a series on evaluation of scientific publications. Dtsch. Ärztebl. Int. 2010, 107, 776–782. [Google Scholar] [CrossRef] [PubMed]
- Kim, J.H. Multicollinearity and misleading statistical results. Korean J. Anesthesiol. 2019, 72, 558–569. [Google Scholar] [CrossRef] [PubMed]
- Correlation and Regression. Available online: https://www.bmj.com/about-bmj/resources-readers/publications/statistics-square-one/11-correlation-and-regression (accessed on 25 July 2025).
- Matys, V.; Kel-Margoulis, O.V.; Fricke, E.; Liebich, I.; Land, S.; Barre-Dirrie, A.; Reuter, I.; Chekmenev, D.; Krull, M.; Hornischer, K.; et al. TRANSFAC® and its module TRANSCompel®: Transcriptional gene regulation in eukaryotes. Nucleic Acids Res. 2006, 34, D108–D110. [Google Scholar] [CrossRef]
- Kienzl, P.; Deinsberger, J.; Weber, B. Chronic venous disease: Pathophysiological aspects, risk factors, and diagnosis. Hamostaseologie 2024, 44, 277–286. [Google Scholar] [CrossRef]
- Fiebig, A.; Krusche, P.; Wolf, A.; Krawczak, M.; Timm, B.; Nikolaus, S.; Frings, N.; Schreiber, S. Heritability of chronic venous disease. Hum. Genet. 2010, 127, 669–674. [Google Scholar] [CrossRef]
- Singh, K.P.; Miaskowski, C.; Dhruva, A.A.; Flowers, E.; Kober, K.M. Mechanisms and measurement of changes in gene expression. Biol. Res. Nurs. 2018, 20, 369–382. [Google Scholar] [CrossRef]
- Li, X.; Lalić, J.; Baeza-Centurion, P.; Dhar, R.; Lehner, B. Changes in gene expression predictably shift and switch genetic interactions. Nat. Commun. 2019, 10, 3886. [Google Scholar] [CrossRef]
- Oliva, M.; Muñoz-Aguirre, M.; Kim-Hellmuth, S.; Wucher, V.; Gewirtz, A.D.H.; Cotter, D.J.; Parsana, P.; Kasela, S.; Balliu, B.; Viñuela, A.; et al. The impact of sex on gene expression across human tissues. Science 2020, 369, eaba3066. [Google Scholar] [CrossRef]
- Wilson, M.A. Searching for sex differences. Science 2020, 369, 1298–1299. [Google Scholar] [CrossRef]
- Zhang, Y.; Zhang, R.; Wang, X.; Fang, S.; Wang, B. Role of STK38L in atrial fibrillation-associated myocardial fibrosis: Findings from RNA-seq analysis. Cardiovasc. Diagn. Ther. 2024, 14, 798–809. [Google Scholar] [CrossRef] [PubMed]
- Cornils, H.; Kohler, R.S.; Hergovich, A.; Hemmings, B.A. Downstream of human NDR kinases: Impacting on c-myc and p21 protein stability to control cell cycle progression. Cell Cycle 2011, 10, 1897–1904. [Google Scholar] [CrossRef]
- Kitselman, A.K.; Bédard-Matteau, J.; Rousseau, S.; Tabrizchi, R.; Daneshtalab, N. Sex differences in vascular endothelial function related to acute and long COVID-19. Vasc. Pharmacol. 2024, 154, 107250. [Google Scholar] [CrossRef]
- Anderson, C.L.; Brown, C.J. Epigenetic predisposition to expression of TIMP1 from the human inactive X chromosome. BMC Genet. 2005, 6, 48. [Google Scholar] [CrossRef]
- Talebizadeh, Z.; Simon, S.D.; Butler, M.G. X chromosome gene expression in human tissues: Male and female comparisons. Genomics 2006, 88, 675–681. [Google Scholar] [CrossRef]
- Lafta, M.S.; Mwinyi, J.; Affatato, O.; Rukh, G.; Dang, J.; Andersson, G.; Schiöth, H.B. Exploring sex differences: Insights into gene expression, neuroanatomy, neurochemistry, cognition, and pathology. Front. Neurosci. 2024, 18, 1340108. [Google Scholar] [CrossRef]
- van Riet, S.; Julien, A.; Atanasov, A.; Nordling, Å.; Ingelman-Sundberg, M. The role of sinusoidal endothelial cells and TIMP1 in the regulation of fibrosis in a novel human liver 3D NASH model. Hepatol. Commun. 2024, 8, e0374. [Google Scholar] [CrossRef] [PubMed]
- Hu, G.F.; Meng, L.B.; Li, J.; Xu, J.; Xu, H.X.; Liu, D.P. HLA-B and TIMP1 as hub genes of the ventricular remodeling caused by hypertension. Aging 2024, 16, 8260–8278. [Google Scholar] [PubMed]
- Shadrina, A.S.; Sharapov, S.Z.; Shashkova, T.I.; Tsepilov, Y.A. Varicose veins of lower extremities: Insights from the first large-scale genetic study. PLoS Genet. 2019, 15, e1008110. [Google Scholar] [CrossRef]
- Pagani, F.; Tratta, E.; Dell’Era, P.; Cominelli, M.; Poliani, P.L. EBF1 is expressed in pericytes and contributes to pericyte cell commitment. Histochem. Cell Biol. 2021, 156, 333–347. [Google Scholar] [CrossRef]
- Xie, G.; Myint, P.K.; Voora, D.; Laskowitz, D.T.; Shi, P.; Ren, F.; Wang, H.; Yang, Y.; Huo, Y.; Gao, W.; et al. Genome-wide association study on progression of carotid artery intima media thickness over 10 years in a Chinese cohort. Atherosclerosis 2015, 243, 30–37. [Google Scholar] [CrossRef]
- Li, Y.; Xie, Z.; Chen, L.; Yan, J.; Ma, Y.; Wang, L.; Chen, Z. Association in a Chinese population of a genetic variation in the early B-cell factor 1 gene with coronary artery disease. BMC Cardiovasc. Disord. 2017, 17, 57. [Google Scholar] [CrossRef] [PubMed]
- Singh, A.; Babyak, M.A.; Nolan, D.K.; Brummett, B.H.; Jiang, R.; Siegler, I.C.; Kraus, W.E.; Shah, S.H.; Williams, R.B.; Hauser, E.R. Gene by stress genome-wide interaction analysis and path analysis identify EBF1 as a cardiovascular and metabolic risk gene. Eur. J. Hum. Genet. 2015, 23, 854–862. [Google Scholar] [CrossRef]
- van der Stoel, M.M.; Kotini, M.P.; Schoon, R.M.; Affolter, M.; Belting, H.G.; Huveneers, S. Vinculin strengthens the endothelial barrier during vascular development. Vasc. Biol. 2023, 5, e220012. [Google Scholar] [CrossRef]
- Pham, K.; Langlais, P.; Zhang, X.; Chao, A.; Zingsheim, M.; Yi, Z. Insulin-stimulated phosphorylation of protein phosphatase 1 regulatory subunit 12B revealed by HPLC-ESI-MS/MS. Proteome Sci. 2012, 10, 52. [Google Scholar] [CrossRef]
- Ryu, D.; Ryu, J.; Lee, C. Genome-wide association study reveals sex-specific selection signals against autosomal nucleotide variants. J. Hum. Genet. 2016, 61, 423–426. [Google Scholar] [CrossRef] [PubMed]
- Zuo, L.; Wang, T.; Lin, X.; Wang, J.; Tan, Y.; Wang, X.; Yu, X.; Luo, X. Sex difference of autosomal alleles in populations of European and African descent. Genes Genom. 2015, 37, 1007–1016. [Google Scholar] [CrossRef] [PubMed]
- Jia, D.; Wang, K.; Huang, L.; Zhou, Z.; Zhang, Y.; Chen, N.; Yang, Q.; Wen, Z.; Jiang, H.; Yao, C.; et al. Revealing PPP1R12B and COL1A1 as piRNA pathway genes contributing to abdominal aortic aneurysm through integrated analysis and experimental validation. Gene 2024, 897, 148068. [Google Scholar] [CrossRef]
- Liu, K.; Zhao, J.; Chen, C.; Xu, J.; Bell, R.L.; Hall, F.S.; Koob, G.F.; Volkow, N.D.; Qing, H.; Lin, Z. Epistatic evidence for gender-dependant slow neurotransmission signalling in substance use disorders: PPP1R12B versus PPP1R1B. eBioMedicine 2020, 61, 103066. [Google Scholar] [CrossRef]
- Wizemann, T.M.; Pardue, M.L. Institute of Medicine (US) Committee on Understanding the Biology of Sex and Gender Differences. In Exploring the Biological Contributions to Human Health: Does Sex Matter? National Academies Press: Washington, DC, USA, 2001. [Google Scholar]
- Orshal, J.M.; Khalil, R.A. Gender, sex hormones, and vascular tone. Am. J. Physiol. Regul. Integr. Comp. Physiol. 2004, 286, R233–R249. [Google Scholar] [CrossRef]
- Kendler, M.; Makrantonaki, E.; Tzellos, T.; Kratzsch, J.; Anderegg, U.; Wetzig, T.; Zouboulis, C.; Simon, J.C. Elevated sex steroid hormones in great saphenous veins in men. J. Vasc. Surg. 2010, 51, 639–646. [Google Scholar] [CrossRef]
- Fan, Q.; Meng, Y.; Nie, Z.; Xie, S.; Chen, C. Sex hormone-binding globulin exerts sex-related causal effects on lower extremity varicose veins: Evidence from gender-stratified Mendelian randomization. Front. Endocrinol. 2023, 14, 1230955. [Google Scholar] [CrossRef] [PubMed]
- Migliore, L.; Nicolì, V.; Stoccoro, A. Gender specific differences in disease susceptibility: The role of epigenetics. Biomedicines 2021, 9, 652. [Google Scholar] [CrossRef]
- Landen, S.; Jacques, M.; Hiam, D.; Alvarez-Romero, J.; Harvey, N.R.; Haupt, L.M.; Griffiths, L.R.; Ashton, K.J.; Lamon, S.; Voisin, S.; et al. Skeletal muscle methylome and transcriptome integration reveals profound sex differences related to muscle function and substrate metabolism. Clin. Epigenet. 2021, 13, 202. [Google Scholar] [CrossRef]
- Özturan, D.; Morova, T.; Lack, N.A. Androgen receptor-mediated transcription in prostate cancer. Cells 2022, 11, 898. [Google Scholar] [CrossRef]
- Maurya, S.S. Role of enhancers in development and diseases. Epigenomes 2021, 5, 21. [Google Scholar] [CrossRef] [PubMed]
- Carleton, J.B.; Ginley-Hidinger, M.; Berrett, K.C.; Layer, R.M.; Quinlan, A.R.; Gertz, J. Regulatory sharing between estrogen receptor α bound enhancers. Nucleic Acids Res. 2020, 48, 6597–6610. [Google Scholar] [CrossRef] [PubMed]
- Yoon, S. Pharmacokinetics/pharmacodynamics and sex differences. In Sex/Gender-Specific Medicine in Clinical Areas; Kim, N., Ed.; Springer: Singapore, 2024; pp. 541–552. [Google Scholar] [CrossRef]
- González-Correa, J.A.; Arrebola, M.M.; Muñoz-Marín, J.; Moreno, A.; Guerrero, A.; Arranz, I.; De La Cuesta, F.S.; De La Cruz, J.P. Gender differences in the effect of aspirin on retinal ischemia, prostanoid synthesis and nitric oxide production in experimental type 1-like diabetes. Vasc. Pharmacol. 2007, 47, 83–89. [Google Scholar] [CrossRef]
- Soylemez, S.; Gurdal, H.; Sepici, A.; Akar, F. The effect of long-term resveratrol treatment on relaxation to estrogen in aortae from male and female rats: Role of nitric oxide and superoxide. Vasc. Pharmacol. 2008, 49, 97–105. [Google Scholar] [CrossRef]
Disclaimer/Publisher’s Note: The statements, opinions and data contained in all publications are solely those of the individual author(s) and contributor(s) and not of MDPI and/or the editor(s). MDPI and/or the editor(s) disclaim responsibility for any injury to people or property resulting from any ideas, methods, instructions or products referred to in the content. |
© 2025 by the authors. Licensee MDPI, Basel, Switzerland. This article is an open access article distributed under the terms and conditions of the Creative Commons Attribution (CC BY) license (https://creativecommons.org/licenses/by/4.0/).