

High-Resolution Imaging of Cones and Retinal Arteries in Patients with Diabetes Mellitus Type 1 Using Adaptive Optics (rtx1)

 , and
, and
Abstract
1. Introduction
2. Material and Methods
2.1. Study Population
2.2. Methods of Metabolic Compensation Assessment
2.3. The Ocular Assessment Methods
2.4. Statistical Analyses
3. Results
4. Discussion
5. Conclusions
Author Contributions
Funding
Institutional Review Board Statement
Informed Consent Statement
Data Availability Statement
Conflicts of Interest
References
- Jing, X.; Chen, J.; Dong, Y.; Han, D.; Zhao, H.; Wang, X.; Gao, F.; Li, C.; Cui, Z.; Liu, Y.; et al. Related factors of quality of life of type 2 diabetes patients: A systematic review and meta-analysis. Health Qual. Life Outcomes 2018, 16, 189. [Google Scholar] [CrossRef] [PubMed]
- American Diabetes Association. Economic Costs of Diabetes in the U.S. in 2017. Diabetes Care 2018, 41, 917–928. [Google Scholar] [CrossRef] [PubMed]
- IDF Diabetes Atlas 2021—10th Edition. Available online: www.diabetesatlas.org (accessed on 1 April 2024).
- WHO. Definition. In Diagnosis and Classification of Diabetes Mellitus and Its Complications; Report of a WHO consultation. Part 1. Diagnosis and classification of Diabetes mellitus; WHO: Geneva, Switzerland, 1999. [Google Scholar]
- King, H.; Aubert, R.E.; Herman, W.H. Global burden of diabetes 1995–2025: Prevalence, numerical estimates, and projections. Diabetes Care 1998, 21, 1414–1431. [Google Scholar] [CrossRef] [PubMed]
- Aiello, L.P.; Gardner, T.W.; King, G.L.; Blankenship, G.; Cavallerano, J.D.; Ferris, F.L., 3rd; Klein, R. Diabetic retinopathy. Diabetes Care 1998, 21, 143–156. [Google Scholar] [CrossRef] [PubMed]
- Solomon, S.D.; Chew, E.; Duh, E.J.; Sobrin, L.; Sun, J.K.; VanderBeek, B.L.; Wykoff, C.C.; Gardner, T.W. Diabetic Retinopathy: A Position Statement by the American Diabetes Association. Diabetes Care 2017, 40, 412–418. [Google Scholar] [CrossRef] [PubMed]
- Teo, Z.L.; Tham, Y.C.; Yu, M.; Chee, M.L.; Rim, T.H.; Cheung, N.; Bikbov, M.M.; Wang, Y.X.; Tang, Y.; Lu, Y.; et al. Global Prevalence of Diabetic Retinopathy and Projection of Burden through 2045: Systematic Review and Meta-analysis. Ophthalmology 2021, 128, 1580–1591. [Google Scholar] [CrossRef] [PubMed]
- Williams, D.R. Imaging single cells in the living retina. Vis. Res. 2011, 51, 1379–1396. [Google Scholar] [CrossRef]
- Purves, D.; Augustine, G.J.; Fitzpatrick, D.; Katz, L.C.; LaMantia, A.S.; McNamara, J.O.; Williams, S.M. Neuroscience, 2nd ed.; Co396.nes and Color Vision; Sinauer Associates: Sunderland, MA, USA, 2001. Available online: https://www.ncbi.nlm.nih.gov/books/NBK11059/ (accessed on 12 March 2024).
- Kolb, H. Photoreceptors. In Webvision: The Organization of the Retina and Visual System; Kolb, H., Fernandez, E., Nelson, R., Eds.; University of Utah Health Sciences Center: Salt Lake City, UT, USA, 1995. Available online: https://www.ncbi.nlm.nih.gov/books/NBK11522/ (accessed on 14 March 2024).
- Tonade, D.; Kern, T.S. Photoreceptor cells and RPE contribute to the development of diabetic retinopathy. Prog. Retin Eye Res. 2021, 83, 100919. [Google Scholar] [CrossRef]
- Elsner, A.E.; Walker, B.R.; Gilbert, R.N.; Parimi, V.; Papay, J.A.; Gastr, T.J.; Burns, S.A. Cone Photoreceptors in Diabetic Patients. Front. Med. 2022, 9, 826643. [Google Scholar] [CrossRef]
- Cho, N.C.; Poulsen, G.L.; Ver Hoeve, J.N.; Nork, T.M. Selective loss of S-cones in diabetic retinopathy. Arch. Ophthalmol. 2000, 118, 1393–1400. [Google Scholar] [CrossRef]
- Kern, T.S.; Berkowitz, B.A. Photoreceptors in diabetic retinopathy. J. Diabetes Investig. 2015, 6, 371–380. [Google Scholar] [CrossRef] [PubMed]
- Hu, K.; Jiang, M.; Zhou, Q.; Zeng, W.; Lan, X.; Gao, Q.; Mei, F.; Zhao, L.; Chen, F.; Wu, A.; et al. Association of Diabetic Retinopathy with Stroke: A Systematic Review and Meta-Analysis. Front. Neurol. 2021, 12, 626996. [Google Scholar] [CrossRef] [PubMed]
- Viigimaa, M.; Sachinidis, A.; Toumpourleka, M.; Koutsampasopoulos, K.; Alliksoo, S.; Titma, T. Macrovascular Complications of Type 2 Diabetes Mellitus. Curr. Vasc. Pharmacol. 2020, 18, 110–116. [Google Scholar] [CrossRef] [PubMed]
- Wilkinson, C.P.; Ferris, F.L.; Klein, R.E.; Lee, P.P.; Agardh, C.D.; Davis, M.; Dills, D.; Kampik, A.; Pararajasegaram, R.; Verdaguer, J.T. Global Diabetic Retinopathy Project Group. Proposed International clinical diabetic retinopathy and diabetic macular edema disease severity scales. Ophthalmology 2003, 110, 1677–1682. [Google Scholar] [CrossRef] [PubMed]
- American Diabetes Association; Professional Practice Committee: Standards of Medical Care in Diabetes—2022. Diabetes Care 2022, 45 (Suppl. 1), S3. [CrossRef]
- Sherr, J.L.; Heinemann, L.; Fleming, G.A.; Bergenstal, R.M.; Bruttomesso, D.; Hanaire, H. Automated insulin delivery: Benefits, challenges, and recommendations. A Consensus Report of the Joint Diabetes Technology Working Group of the European Association for the Study of Diabetes and the American Diabetes Association. Diabetologia 2023, 66, 3–22. [Google Scholar] [CrossRef] [PubMed]
- Members, T.F.; Mancia, G.; Fagard, R.; Narkiewicz, K.; Redon, J.; Zanchetti, A.; Bohm, M.; Christiaens, T.; Cifkova, R.; De Backer, G.; et al. 2013 ESH/ESC Guidelines for the management of arterial hypertension. Eur. Heart J. 2013, 34, 2159–2219. [Google Scholar]
- NHLBI Obesity Education Initiative Expert Panel on the Identification, Evaluation, and Treatment of Obesity in Adults (US). Clinical Guidelines on the Identification, Evaluation, and Treatment of Overweight and Obesity in Adults: The Evidence Report; National Heart, Lung, and Blood Institute: Bethesda, MD, USA, 1998. Available online: https://www.ncbi.nlm.nih.gov/books/NBK2003/ (accessed on 10 March 2024).
- Curcio, C.A.; Sloan, K.R.; Kalina, R.E.; Hendrickson, A.E. Human photoreceptor topography. J. Comp. Neurol. 1990, 292, 497–523. [Google Scholar] [CrossRef]
- Curcio, C.A.; Sloan, K.R., Jr.; Packer, O.; Hendrickson, A.E.; Kalina, R.E. Distribution of cones in human and monkey retina: Individual variability and radial asymmetry. Science 1987, 236, 579–582. [Google Scholar] [CrossRef]
- Park, S.P.; Chung, J.K.; Greenstein, V.; Tsang, S.H.; Chang, S. A study of factors affecting the human cone photoreceptor density measured by adaptive optics scanning laser ophthalmoscope. Exp. Eye Res. 2013, 108, 1–9. [Google Scholar] [CrossRef]
- Song, H.; Chui, T.Y.; Zhong, Z.; Elsner, A.E.; Burns, S.A. Variation of cone photoreceptor packing density with retinal eccentricity and age. Investig. Ophthalmol. Vis. Sci. 2011, 52, 7376–7384. [Google Scholar] [CrossRef] [PubMed]
- Ooto, S.; Hangai, M.; Sakamoto, A.; Tsujikawa, A.; Yamashiro, K.; Ojima, Y.; Yamada, Y.; Mukai, H.; Oshima, S.; Inoue, T.; et al. High-resolution imaging of resolved central serous chorioretinopathy using adaptive optics scanning laser ophthalmoscopy. Ophthalmology 2010, 117, 1800–1809.e2. [Google Scholar] [CrossRef] [PubMed]
- Lombardo, M.; Parravano, M.; Serrao, S.; Ziccardi, L.; Giannini, D.; Lombardo, G. Investigation of Adaptive Optics Imaging Biomarkers for Detecting Pathological Changes of the Cone Mosaic in Patients with Type 1 Diabetes Mellitus. PLoS ONE 2016, 11, e0151380. [Google Scholar] [CrossRef] [PubMed]
- Cristescu, I.E.; Balta, F.; Zagrean, L. Cone photoreceptor density in type 1 diabetic patients measured with an adaptive optics retinal camera. Rom. J. Ophthalmol. 2019, 63, 153–160. [Google Scholar] [CrossRef] [PubMed]
- Lammer, J.; Prager, S.G.; Cheney, M.C.; Ahmed, A.; Radwan, S.H.; Burns, S.A.; Silva, P.S.; Sun, J.K. Cone Photoreceptor Irregularity on Adaptive Optics Scanning Laser Ophthalmoscopy Correlates with Severity of Diabetic Retinopathy and Macular Edema. Investig. Ophthalmol. Vis. Sci. 2016, 57, 6624–6632. [Google Scholar] [CrossRef] [PubMed]
- Tan, W.; Wright, T.; Rajendran, D.; Garcia-Sanchez, Y.; Finkelberg, L.; Kisilak, M.; Campbell, M.; Westall, C.A. Cone-Photoreceptor Density in Adolescents with Type 1 Diabetes. Investig. Ophthalmol. Vis. Sci. 2015, 56, 6339–6343. [Google Scholar] [CrossRef] [PubMed]
- Soliman, M.K.; Sadiq, M.A.; Agarwal, A.; Sarwar, S.; Hassan, M.; Hanout, M.; Graf, F.; High, R.; Do, D.V.; Nguyen, Q.D.; et al. HighResolution Imaging of Parafoveal Cones in Different Stages of Diabetic Retinopathy Using Adaptive Optics Fundus Camera. PLoS ONE 2016, 11, e0152788. [Google Scholar] [CrossRef]
- Zaleska-Żmijewska, A.; Wawrzyniak, Z.M.; Dąbrowska, A.; Szaflik, J.P. Adaptive Optics (rtx1) High-Resolution Imaging of Photoreceptors and Retinal Arteries in Patients with Diabetic Retinopathy. J. Diabetes Res. 2019, 2019, 9548324. [Google Scholar] [CrossRef]


| Assessed Laboratory Indicators | Recommended Range |
|---|---|
| Glycated hemoglobin (HbA1c) | ≤7.0% (≤53 mmol/mol) |
| Concentration of total cholesterol | <200 mg/dL (<5.2 mmol/L) |
| Concentration of HDL | >40 mg/dL (>1.0 mmol/L) in men >45 mg/dL (>1.2 mmol/L) in women |
| Concentration of LDL | <100 mg/dL (2.6 mmol/L) |
| Concentration of triglycerydes | <150 mg/dL (<1.7 mmol/L) |
| Concentration of creatinine | 0.6–1.3 mg/dL (53–115 µmol/L) |
| Glomerular filtration rate (GFR) | <90 mL/min/1.73 m2 |
| albumin/creatinine ratio (ACR) | <2.5 mg/g creatinine |
| Clinical Parameter | Control Group | DM1 | p Mann–Whitney U test | ||
|---|---|---|---|---|---|
| Mean ± SD | Median IQR | Mean ± SD | Median IQR | ||
| n (%) | 41 (60) | - | 27 (40) | - | |
| Age—years (SD) | 41.02 ± 9.84 | 40 37–50 | 42.11 ± 9.69 | 42 34–48 | 0.75 |
| Diabetes duration [years] | - | - | 22.07 ± 10.28 | 24 15–29 | - |
| HbA1c [%] | 5.23 ± 0.20 | 5.20 5.10–5.48 | 7.58 ± 1.14 | 7.45 6.78–8.68 | <0.001 |
| BMI [kg/m2] | 24.6 ± 3.6 | 24.5 21.7–26.2 | 24.2 ± 2.6 | 23.6 22.0–26.2 | 0.88 |
| Total Cholesterol [mg/dL] | 179.7 ± 24.2 | 179.5 160.0–193.3 | 196.5 ± 46.3 | 190.5 157.5–232.0 | 0.23 |
| HDL cholesterol [mg/dL] | 64.6 ± 14.6 | 61.0 54.0–76.5 | 77.0 ± 21.0 | 72.5 63.0–93.5 | 0.049 |
| LDL cholesterol [mg/dL] | 99.7 ± 41.1 | 108.0 67.0–118.8 | 127.1 ± 42.3 | 114.0 92.5–165.8 | 0.13 |
| Triglycerides [mg/dL] | 98.0 ± 33.8 | 99.5 72.8–119.8 | 86.0 ± 38.2 | 76.0 54.8–115.3 | 0.20 |
| Creatinine [mg/dL] | 0.88 ± 0.16 | 0.85 0.80–0.98 | 0.86 ± 0.13 | 0.85 0.80–0.90 | 0.83 |
| eGFR [mL/min/1.73 m2] | 83.0 ± 9.9 | 82.9 77.1–90.7 | 83.8 ± 13.4 | 81.9 76.9–93.0 | 0.79 |
| ACR [mg/g creatinine] | 0.67± 0.63 | 0.45 0.20–0.88 | 1.28 ± 1.72 | 0.45 0.20–1.95 | 0.68 |
| Vascular Parameters | Control Group | DM 1 | p Mann–Whitney U test | ||
|---|---|---|---|---|---|
| Mean ± SD | Median IQR | Mean ± SD | Median IQR | ||
| SBPb [mmHg] | 130.3 ± 10.6 | 131.0 124.5–137.0 | 132.4 ± 14.6 | 134.0 121.0–146.0 | 0.51 |
| DBPb [mmHg] | 84.7 ± 8.5 | 85.0 78.5–90.0 | 83.7 ± 8.4 | 83.0 77.0–92.0 | 0.53 |
| MAPb [mmHg] | 99.9 ± 8.6 | 101.7 94.7–105.5 | 100.0 ± 9.8 | 100.7 91.7–107.3 | 0.98 |
| PPb [mmHg] | 45.6 ± 7.1 | 45.0 40.5–50.5 | 48.7 ± 9.8 | 49.0 42.0–55.0 | 0.15 |
| HRb [bpm] | 66.1 ± 10.9 | 63.0 60.0–70.5 | 67.6 ± 9.8 | 65.0 62.0–72.0 | 0.40 |
| SBPc [mmHg] | 118.2 ± 10.7 | 118.0 112.0–125.5 | 120.4 ± 13.5 | 122.0 110.0–133.0 | 0.38 |
| DBPc [mmHg] | 85.5 ± 8.6 | 87.0 79.5–91.0 | 84.6 ± 8.6 | 83.0 79.0–92.0 | 0.59 |
| MAPc [mmHg] | 98.5 ± 8.8 | 100.0 92.0–103.5 | 99.3 ± 9.9 | 100.0 92.0–106.0 | 0.87 |
| PPc [mmHg] | 32.7 ± 7.5 | 31.0 27.0–37.5 | 35.7 ± 9.1 | 37.0 27.0–41.0 | 0.13 |
| HRc [bpm] | 70.2 ± 10.8 | 70.0 62.5–78.5 | 72.2 ± 11.1 | 72.0 65.0–78.0 | 0.52 |
| PWV [m/s] | 6.1 ± 1.1 | 6.3 5.1–6.9 | 6.4 ± 1.4 | 6.4 5.1–7.6 | 0.45 |
| APc [mmHg] | 6.0 ± 6.8 | 5.0 1.0–9.0 | 8.26 ± 6.4 | 7.0 3.0–12.0 | 0.14 |
| Alx [%] | 15.9 ± 16.2 | 18.0 4.5–27.0 | 20.8 ± 14.1 | 20.0 10.0–32.0 | 0.22 |
| IOP OD [mmHg] | 14.0 ± 1.8 | 14.0 13.5–15.0 | 16.9 ± 3.2 | 17.0 15.3–18.8 | 0.004 |
| IOP OS [mmHg] | 14.1 ± 2.1 | 14.0 12.0–16.0 | 16.9 ± 3.4 | 17.5 14.5–19.0 | 0.006 |
| Retinal Arteriolar Morphological Parameters | Control Group | DM 1 | p Mann–Whitney U test | ||
|---|---|---|---|---|---|
| Mean ± SD | Median IQR | Mean ± SD | Median IQR | ||
| VD right eye [µm] | 119.4 ± 13.5 | 119.9 112.0–127.4 | 123.1 ± 24.4 | 124.1 104.9–140.3 | 0.44 |
| VD left eye [µm] | 119.3 ± 12.8 | 120.1 109.4–128.5 | 123.4 ± 23.1 | 124.6 110.7–136.4 | 0.19 |
| LD right eye [µm] | 96.6 ± 12.7 | 96.0 87.7–102.3 | 96.0 ± 21.7 | 93.9 79.3–110.0 | 0.77 |
| LD left eye [µm] | 93.6 ± 17.2 | 96.5 87.4–103.3 | 95.8 ± 19.4 | 99.8 86.2–107.9 | 0.45 |
| WT right eye [µm] | 11.42 ± 1.62 | 11.45 10.48–12.10 | 13.57 ± 3.40 | 12.35 10.95–16.00 | 0.020 |
| WT left eye [µm] | 11.59 ± 1.36 | 11.45 10.61–12.29 | 13.76 ± 3.47 | 13.40 10.98–16.05 | 0.009 |
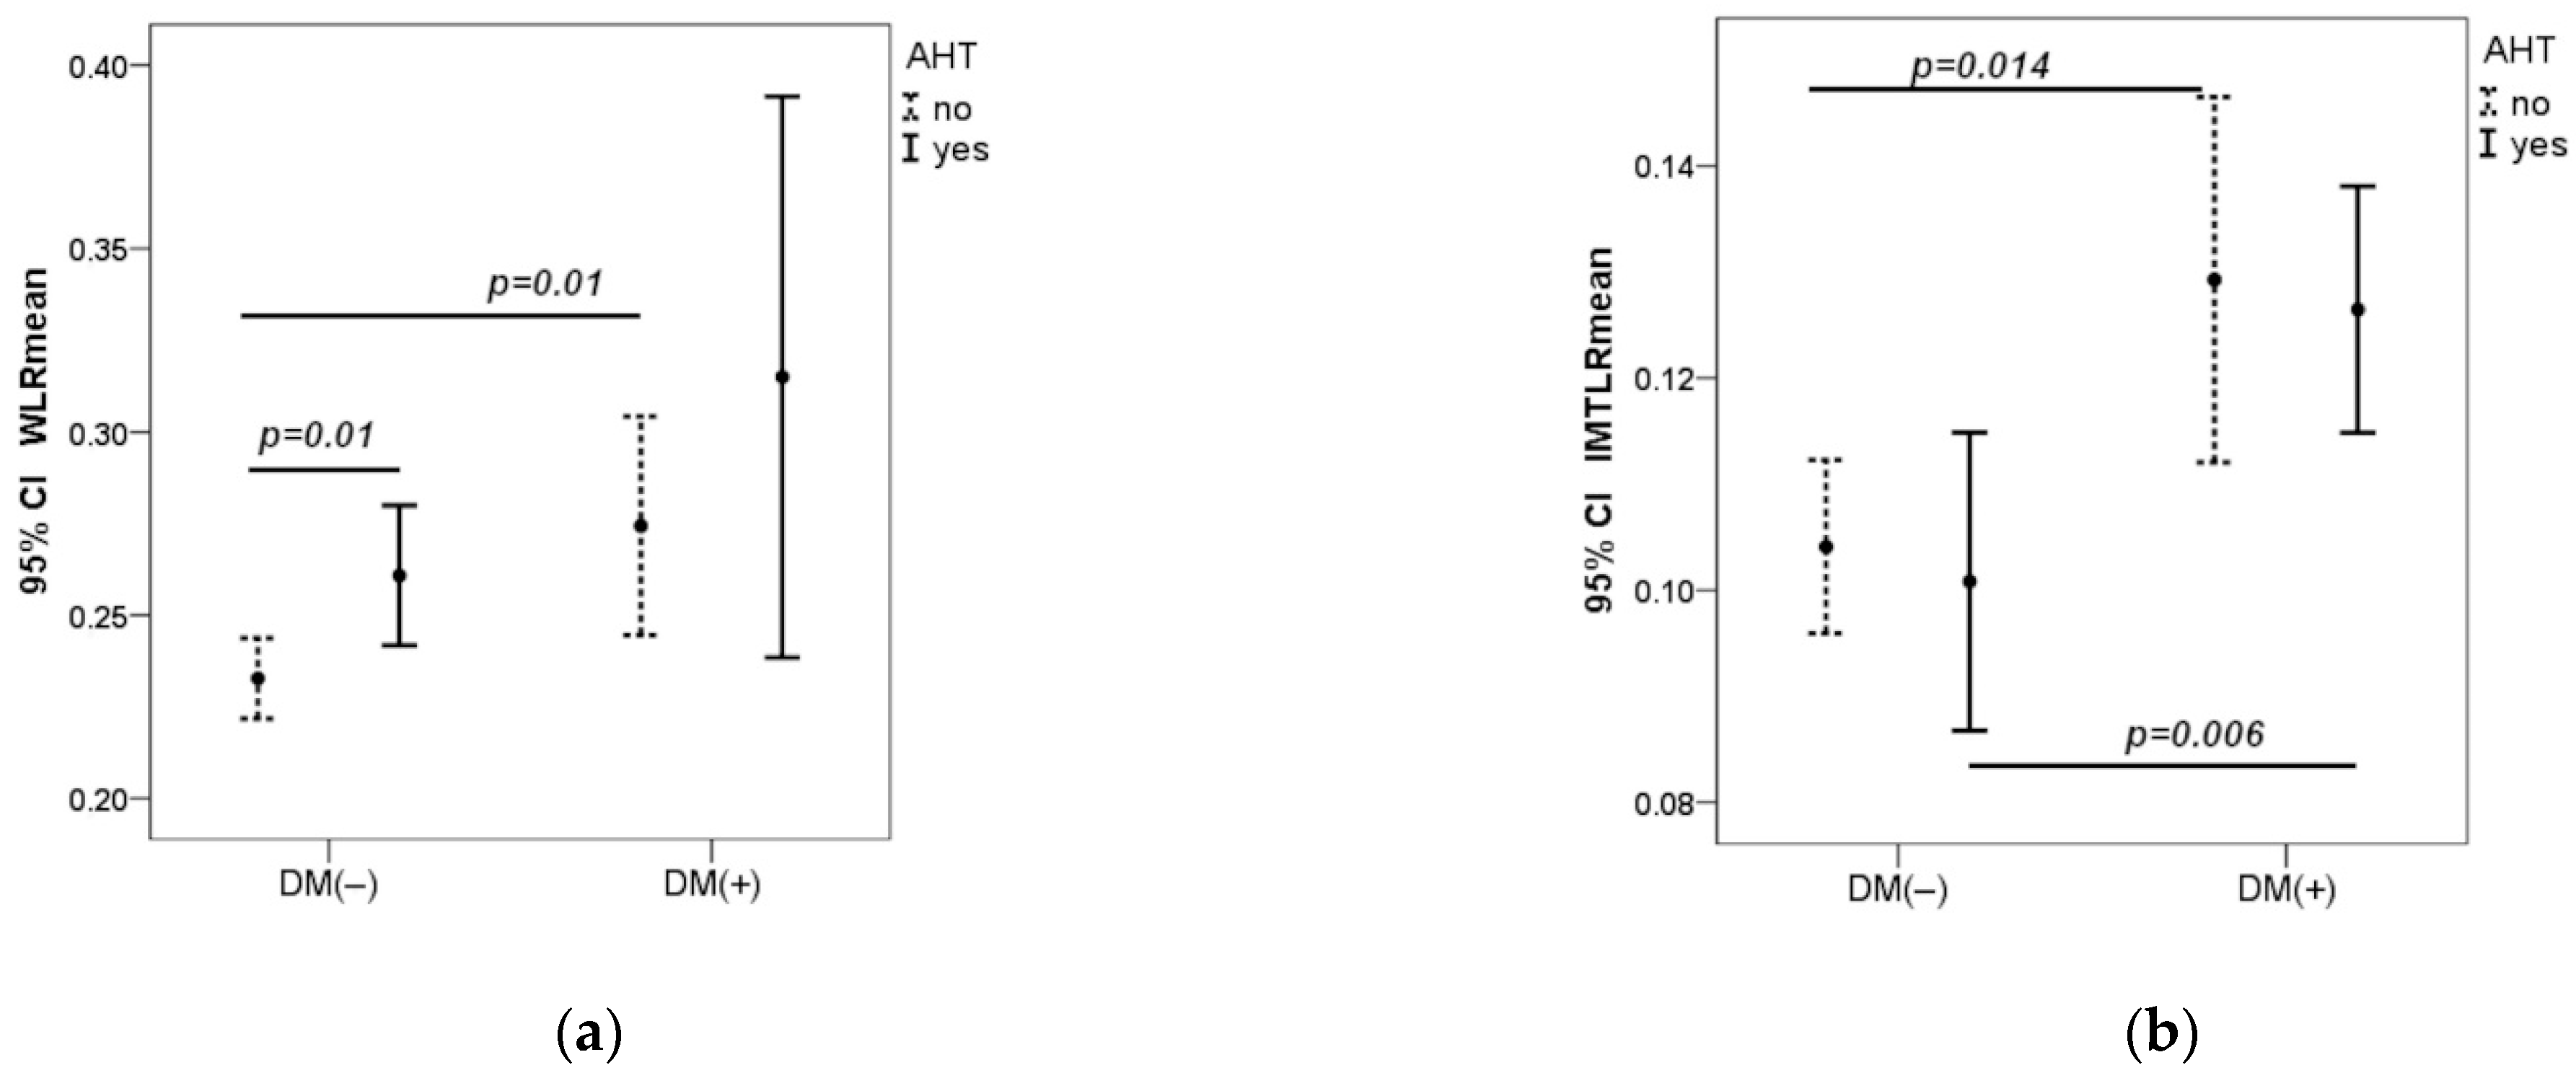
| WLR right eye | 0.24 ± 0.04 | 0.24 0.22–0.27 | 0.29 ± 0.09 | 0.30 0.22–0.34 | 0.018 |
| WLR left eye | 0.24 ± 0.03 | 0.24 0.22–0.27 | 0.29 ± 0.08 | 0.27 0.23–0.33 | 0.014 |
| WCSA right eye [µm2] | 3889 ± 824 | 38307 3391–4196 | 4764 ± 1847 | 4470 3531–5992 | 0.040 |
| WCSA left eye [µm2] | 3872 ± 852 | 3825 3313–4399 | 4757 ± 1878 | 4709 3665–5952 | 0.016 |
| Cones Morphological Parameters | Control Group | DM 1 | p Mann–Whitney U test | ||
|---|---|---|---|---|---|
| Mean ± SD | Median IQR | Mean ± SD | Median IQR | ||
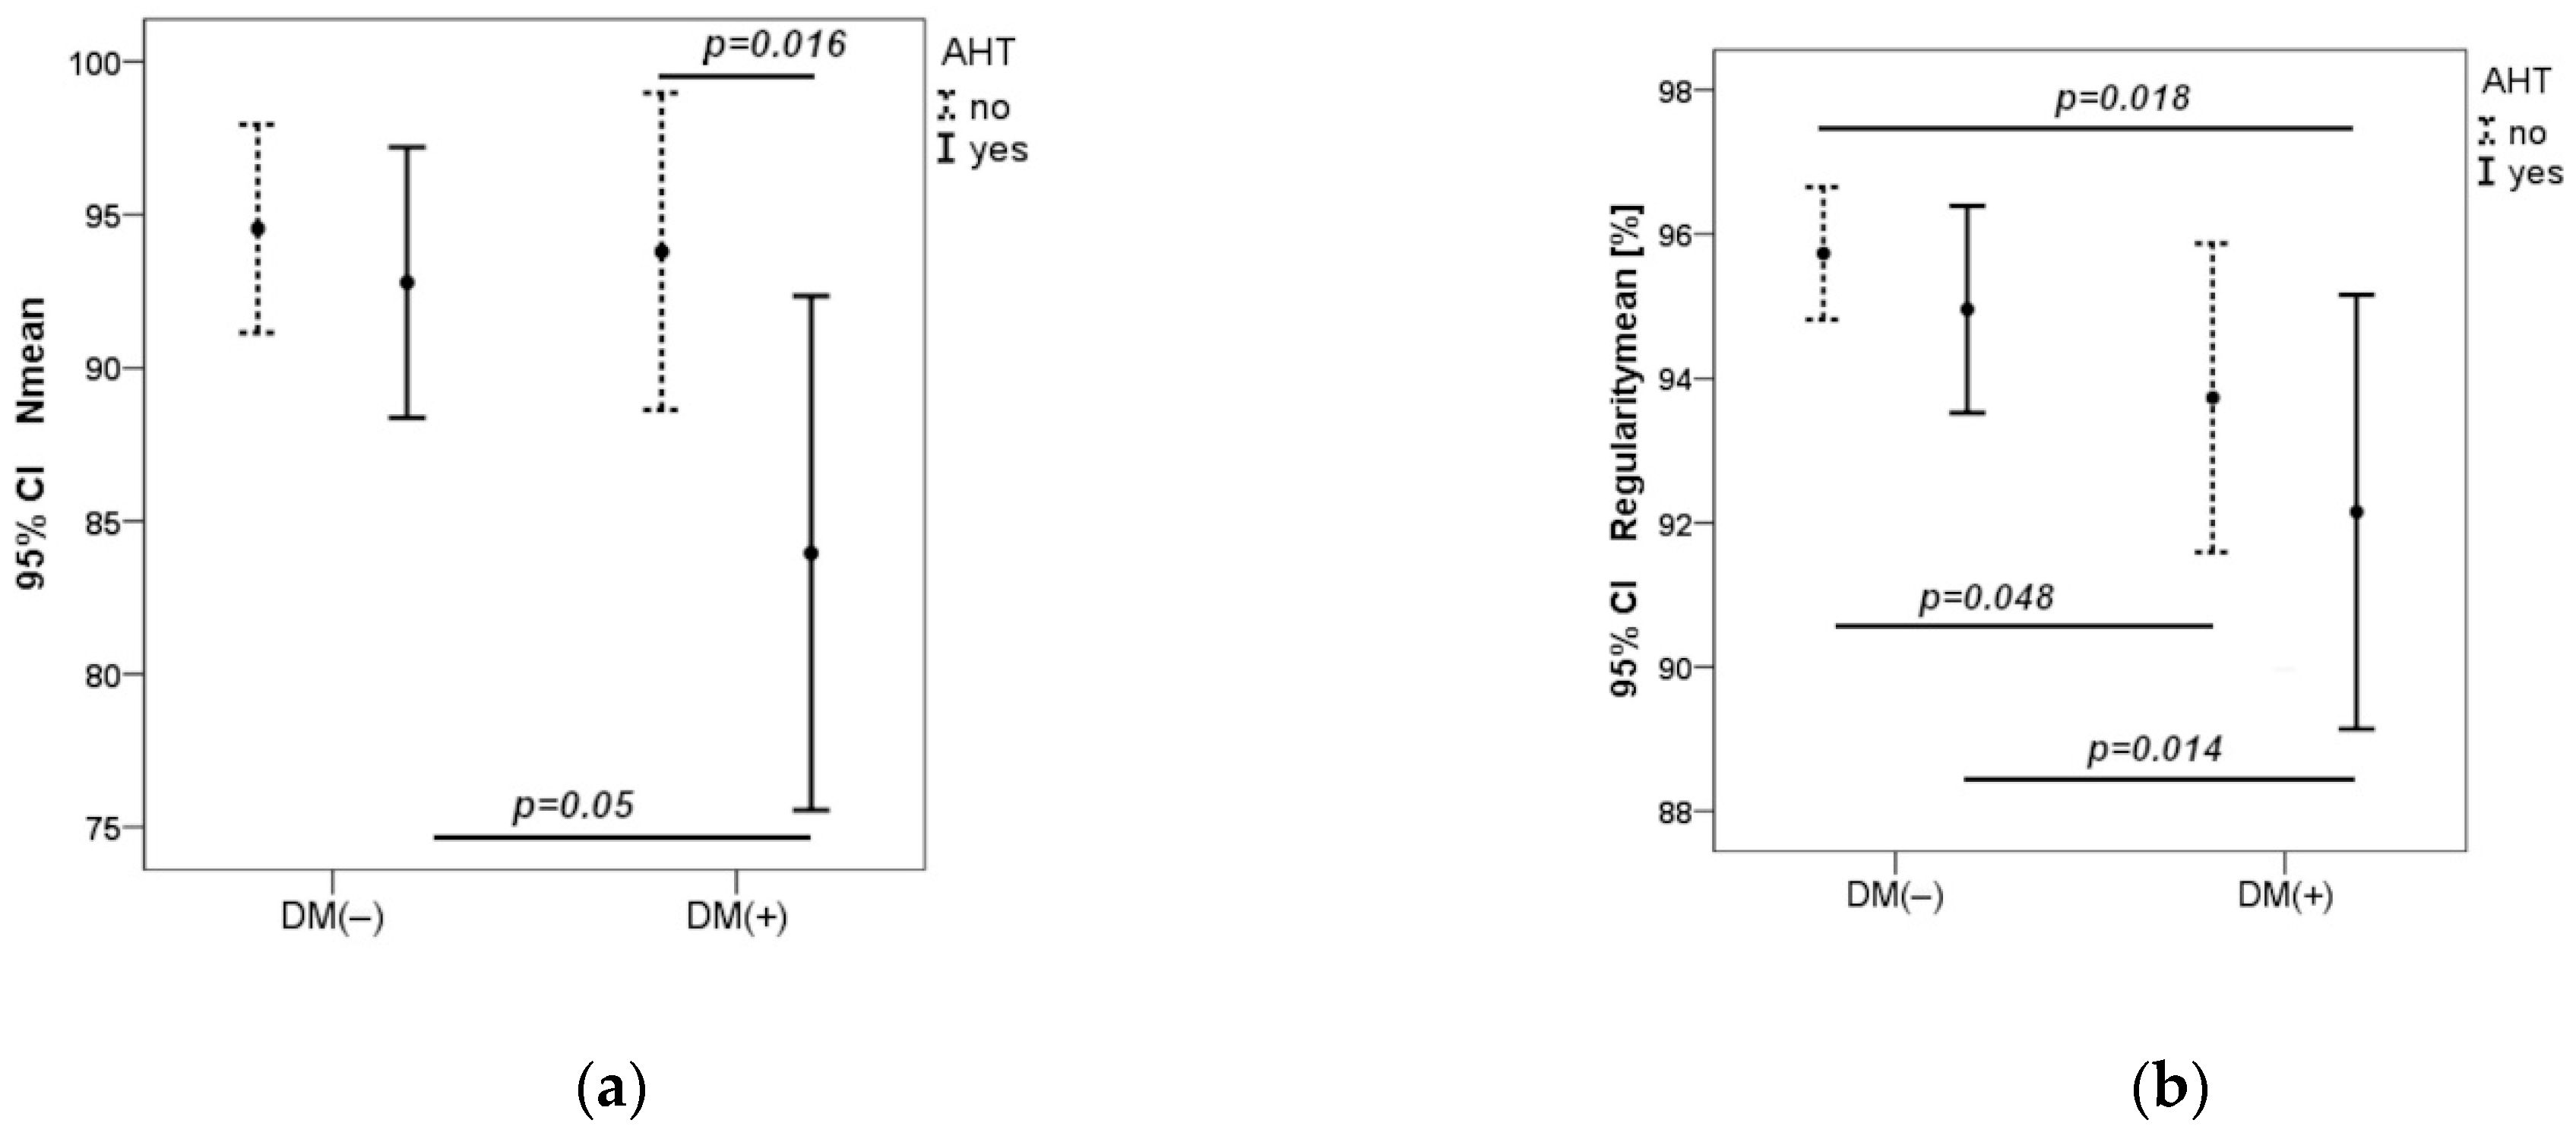
| n right eye | 93.1 ± 9.3 | 93.5 85.5–99.8 | 91.9 ± 14.8 | 92.0 85.0–102.5 | 0.99 |
| n left eye | 95.1 ± 10.3 | 95.0 86.8–102.0 | 87.4 ± 10.2 | 90.0 81.0–94.0 | 0.016 |
| D right eye [cells/mm2] | 24,812 ± 2299 | 24,655 (22,932–26,663) | 24,685 ± 3990 | 26,039 (21,937–27,971) | 0.43 |
| D left eye [cells/mm2] | 25,510 ± 27,748 | 24,875 (23,208–28,145) | 23,495 ± 3585 | 24,128 (21,291–25,208) | 0.045 |
| S right eye [µm] | 7.01 ± 0.33 | 7.03 (6.73–7.30) | 7.11 ± 0.67 | 6.79 (6.62–7.67) | 0.59 |
| S leftt eye [µm] | 6.90 ± 0.43 | 6.97 (6.56–7.19) | 7.18 ± 0.62 | 7.08 (6.94–7.61) | 0.043 |
| R right eye [%] | 96.5 ± 2.4 | 96.8 (95.0–98.1) | 94.0 ± 4.5 | 93.1 (91.0–98.5) | 0.047 |
| R left eye [%] | 96.6 ± 2.5 | 97.0 (95.1–98.9) | 95.0 ± 3.5 | 95.3 (92.4–97.8) | 0.076 |
| DP right eye [%] | 9.40 ± 2.05 | 9.25 (7.83–10.50) | 10.97 ± 3.00 | 11.70 (8.75–12.30) | 0.020 |
| DP left t eye [%] | 9.28 ± 2.09 | 8.65 (7.90–10.43) | 10.30 ± 2.45 | 10.20 (8.30–12.30) | 0.12 |
| Common Carotid Artery Morphological Parameters | Control Group | DM 1 | p Mann–Whitney U test | ||
|---|---|---|---|---|---|
| Mean ± SD | Median IQR | Mean ± SD | Median IQR | ||
| IMT right side [cm] | 0.056 ± 0.015 | 0.055 0.050–0.070 | 0.072 ± 0.017 | 0.080 0.060–0.090 | <0.001 |
| IMT left side [cm] | 0.055 ± 0.012 | 0.050 0.049–0.060 | 0.070 ± 0.015 | 0.070 0.060–0.080 | <0.001 |
| LDCA right side [cm] | 0.55 ± 0.07 | 0.53 0.51–0.60 | 0.57 ± 0.09 | 0.56 0.51–0.61 | 0.34 |
| LDCA left side [cm] | 0.53 ± 0.06 | 0.53 0.50–0.56 | 0.56 ± 0.09 | 0.53 0.49–0.63 | 0.36 |
| IMTLR right side [cm] | 0.10 ± 0.02 | 0.11 0.08–0.12 | 0.13 ± 0.03 | 0.13 0.10–0.16 | 0.004 |
| IMTLR left side [cm] | 0.10 ± 0.02 | 0.10 0.09–0.11 | 0.13 ± 0.03 | 0.13 0.10–0.15 | 0.001 |
Disclaimer/Publisher’s Note: The statements, opinions and data contained in all publications are solely those of the individual author(s) and contributor(s) and not of MDPI and/or the editor(s). MDPI and/or the editor(s) disclaim responsibility for any injury to people or property resulting from any ideas, methods, instructions or products referred to in the content. |
© 2024 by the authors. Licensee MDPI, Basel, Switzerland. This article is an open access article distributed under the terms and conditions of the Creative Commons Attribution (CC BY) license (https://creativecommons.org/licenses/by/4.0/).
Share and Cite
Matuszewski, W.; Szklarz, M.; Wołos-Kłosowicz, K.; Harazny, J.M.; Bandurska-Stankiewicz, E. High-Resolution Imaging of Cones and Retinal Arteries in Patients with Diabetes Mellitus Type 1 Using Adaptive Optics (rtx1). Biomedicines 2024, 12, 863. https://doi.org/10.3390/biomedicines12040863
Matuszewski W, Szklarz M, Wołos-Kłosowicz K, Harazny JM, Bandurska-Stankiewicz E. High-Resolution Imaging of Cones and Retinal Arteries in Patients with Diabetes Mellitus Type 1 Using Adaptive Optics (rtx1). Biomedicines. 2024; 12(4):863. https://doi.org/10.3390/biomedicines12040863
Chicago/Turabian StyleMatuszewski, Wojciech, Michał Szklarz, Katarzyna Wołos-Kłosowicz, Joanna Maria Harazny, and Elżbieta Bandurska-Stankiewicz. 2024. "High-Resolution Imaging of Cones and Retinal Arteries in Patients with Diabetes Mellitus Type 1 Using Adaptive Optics (rtx1)" Biomedicines 12, no. 4: 863. https://doi.org/10.3390/biomedicines12040863
APA StyleMatuszewski, W., Szklarz, M., Wołos-Kłosowicz, K., Harazny, J. M., & Bandurska-Stankiewicz, E. (2024). High-Resolution Imaging of Cones and Retinal Arteries in Patients with Diabetes Mellitus Type 1 Using Adaptive Optics (rtx1). Biomedicines, 12(4), 863. https://doi.org/10.3390/biomedicines12040863