Correction: Musumeci et al. Intranasal Administration of a TRAIL Neutralizing Monoclonal Antibody Adsorbed in PLGA Nanoparticles and NLC Nanosystems: An In Vivo Study on a Mouse Model of Alzheimer’s Disease. Biomedicines 2022, 10, 985


 ,
,  ,
,  ,
,  ,
,  ,
, 
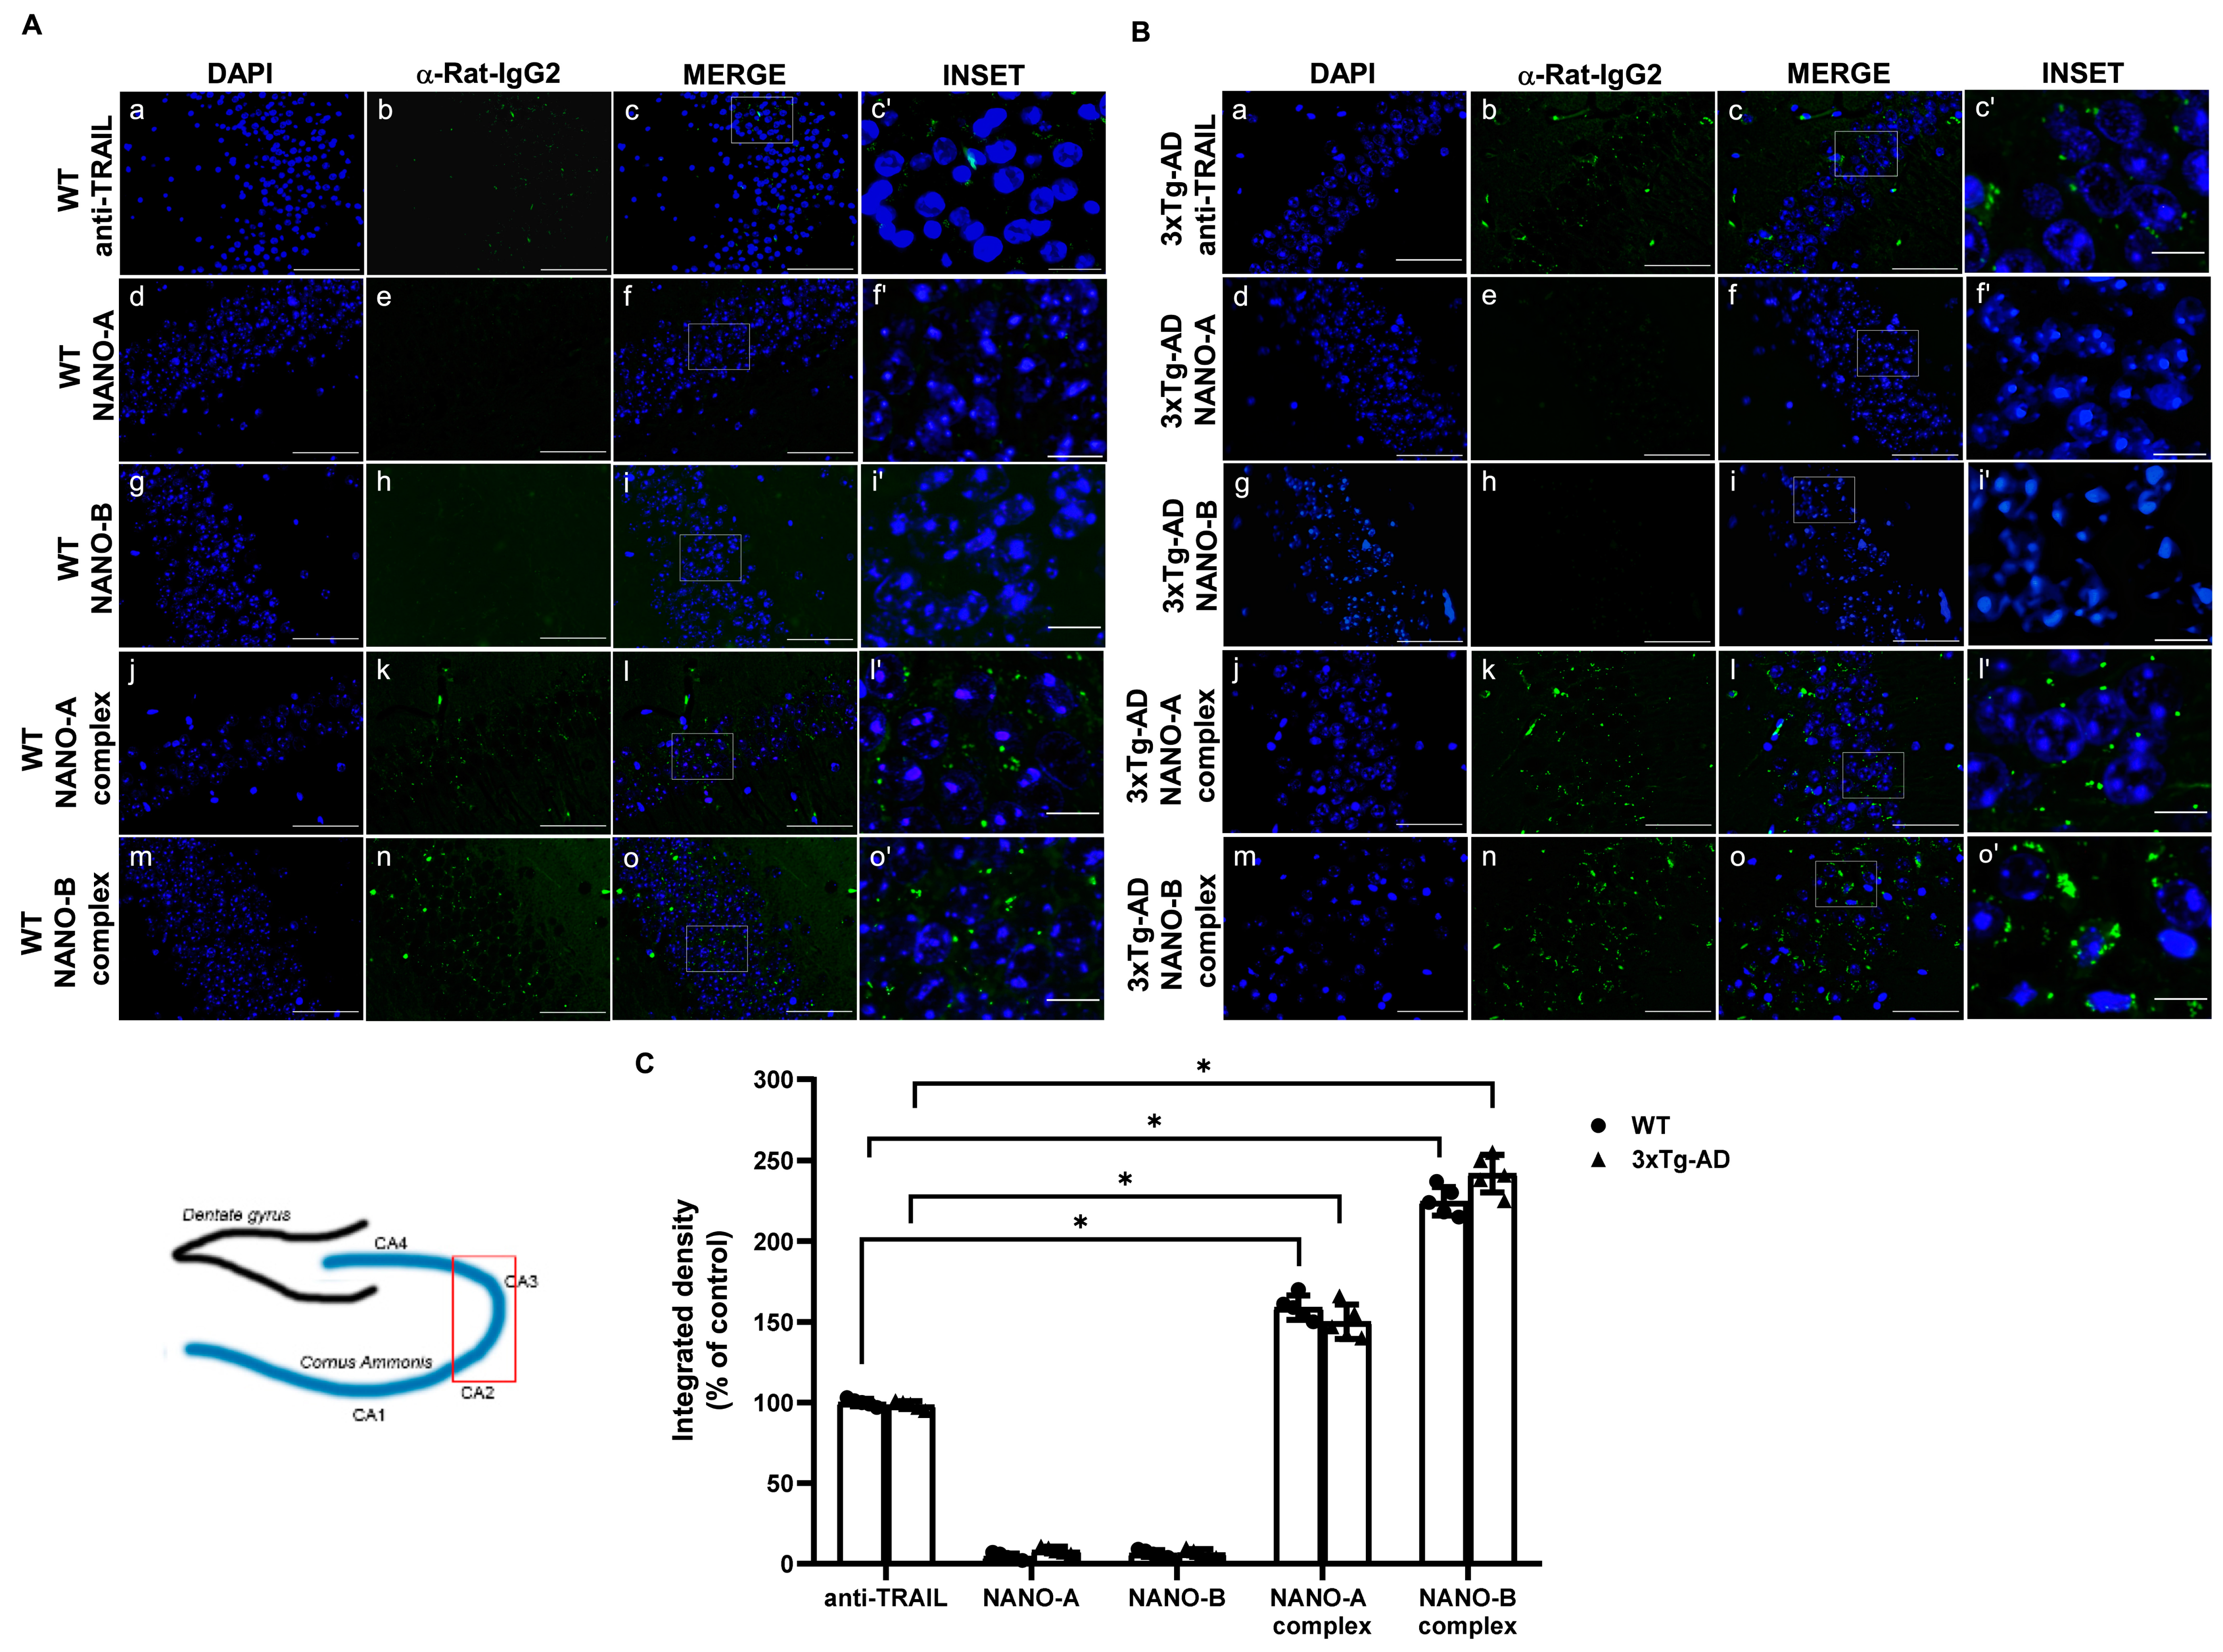
Error in Figure
Reference
- Musumeci, T.; Di Benedetto, G.; Carbone, C.; Bonaccorso, A.; Amato, G.; Lo Faro, M.J.; Burgaletto, C.; Puglisi, G.; Bernardini, R.; Cantarella, G. Intranasal Administration of a TRAIL Neutralizing Monoclonal Antibody Adsorbed in PLGA Nanoparticles and NLC Nanosystems: An In Vivo Study on a Mouse Model of Alzheimer’s Disease. Biomedicines 2022, 10, 985. [Google Scholar] [CrossRef] [PubMed]
Disclaimer/Publisher’s Note: The statements, opinions and data contained in all publications are solely those of the individual author(s) and contributor(s) and not of MDPI and/or the editor(s). MDPI and/or the editor(s) disclaim responsibility for any injury to people or property resulting from any ideas, methods, instructions or products referred to in the content. |
© 2024 by the authors. Licensee MDPI, Basel, Switzerland. This article is an open access article distributed under the terms and conditions of the Creative Commons Attribution (CC BY) license (https://creativecommons.org/licenses/by/4.0/).
Share and Cite
Musumeci, T.; Di Benedetto, G.; Carbone, C.; Bonaccorso, A.; Amato, G.; Lo Faro, M.J.; Burgaletto, C.; Puglisi, G.; Bernardini, R.; Cantarella, G. Correction: Musumeci et al. Intranasal Administration of a TRAIL Neutralizing Monoclonal Antibody Adsorbed in PLGA Nanoparticles and NLC Nanosystems: An In Vivo Study on a Mouse Model of Alzheimer’s Disease. Biomedicines 2022, 10, 985. Biomedicines 2024, 12, 2447. https://doi.org/10.3390/biomedicines12112447
Musumeci T, Di Benedetto G, Carbone C, Bonaccorso A, Amato G, Lo Faro MJ, Burgaletto C, Puglisi G, Bernardini R, Cantarella G. Correction: Musumeci et al. Intranasal Administration of a TRAIL Neutralizing Monoclonal Antibody Adsorbed in PLGA Nanoparticles and NLC Nanosystems: An In Vivo Study on a Mouse Model of Alzheimer’s Disease. Biomedicines 2022, 10, 985. Biomedicines. 2024; 12(11):2447. https://doi.org/10.3390/biomedicines12112447
Chicago/Turabian StyleMusumeci, Teresa, Giulia Di Benedetto, Claudia Carbone, Angela Bonaccorso, Giovanni Amato, Maria Josè Lo Faro, Chiara Burgaletto, Giovanni Puglisi, Renato Bernardini, and Giuseppina Cantarella. 2024. "Correction: Musumeci et al. Intranasal Administration of a TRAIL Neutralizing Monoclonal Antibody Adsorbed in PLGA Nanoparticles and NLC Nanosystems: An In Vivo Study on a Mouse Model of Alzheimer’s Disease. Biomedicines 2022, 10, 985" Biomedicines 12, no. 11: 2447. https://doi.org/10.3390/biomedicines12112447
APA StyleMusumeci, T., Di Benedetto, G., Carbone, C., Bonaccorso, A., Amato, G., Lo Faro, M. J., Burgaletto, C., Puglisi, G., Bernardini, R., & Cantarella, G. (2024). Correction: Musumeci et al. Intranasal Administration of a TRAIL Neutralizing Monoclonal Antibody Adsorbed in PLGA Nanoparticles and NLC Nanosystems: An In Vivo Study on a Mouse Model of Alzheimer’s Disease. Biomedicines 2022, 10, 985. Biomedicines, 12(11), 2447. https://doi.org/10.3390/biomedicines12112447