Regional Differences and Influencing Factors of Allocation Efficiency of Rural Public Health Resources in China

Abstract
1. Introduction
2. Method and Data
2.1. Game Cross-Efficiency Model
2.2. Theil Index Model
2.3. Gini Index Model
2.4. Bootstrap Truncated Regression Model
2.5. Index System and Data Sources
- (1)
- Input index: The input index of the public health resources usually includes three main categories, that is, the health human resources, the health material resources and the health financial resources. In the design of the specific indexes, the number of doctors, nurses and beds are generally selected as the input indexes [17,25]. According to the statistical data of the health departments in China, considering the representativeness and accessibility of the input index, the number of personnel in the rural health institutions (the total number of doctors and nurses) is selected as an alternative index of the labor input, and the number of beds in the rural health institutions is selected as an alternative index of the material input. Meanwhile, considering the fact that health institutions are the important spatial carrier for carrying out the health activities, the number of the rural health institutions is also used as another alternative index of the material input. Although drugs are an important variable of the material input, they are mainly suitable for the hospital efficiency evaluation level. Because it is difficult to obtain the regional data of drugs, they are not considered here. The rural medical and healthcare expenditure can provide the financial support for the rural health activities, and so it is selected as an alternative index of the financial input.
- (2)
- Output index: The final output of the public health resource input is the improvement of the population health. However, because of the complexity of the health improvement measurement and the difficulty of the data acquisition, some process indexes are usually used to replace it [5]. According to the statistical data of the health departments in China, considering the representativeness and accessibility of the output index, the rural diagnosis and treatment person-time, the rural number of people receiving hospitalizations and the rural average hospitalization days are selected as the output indexes of the rural public health resources. See Table 1 for details.
3. Results and Discussion
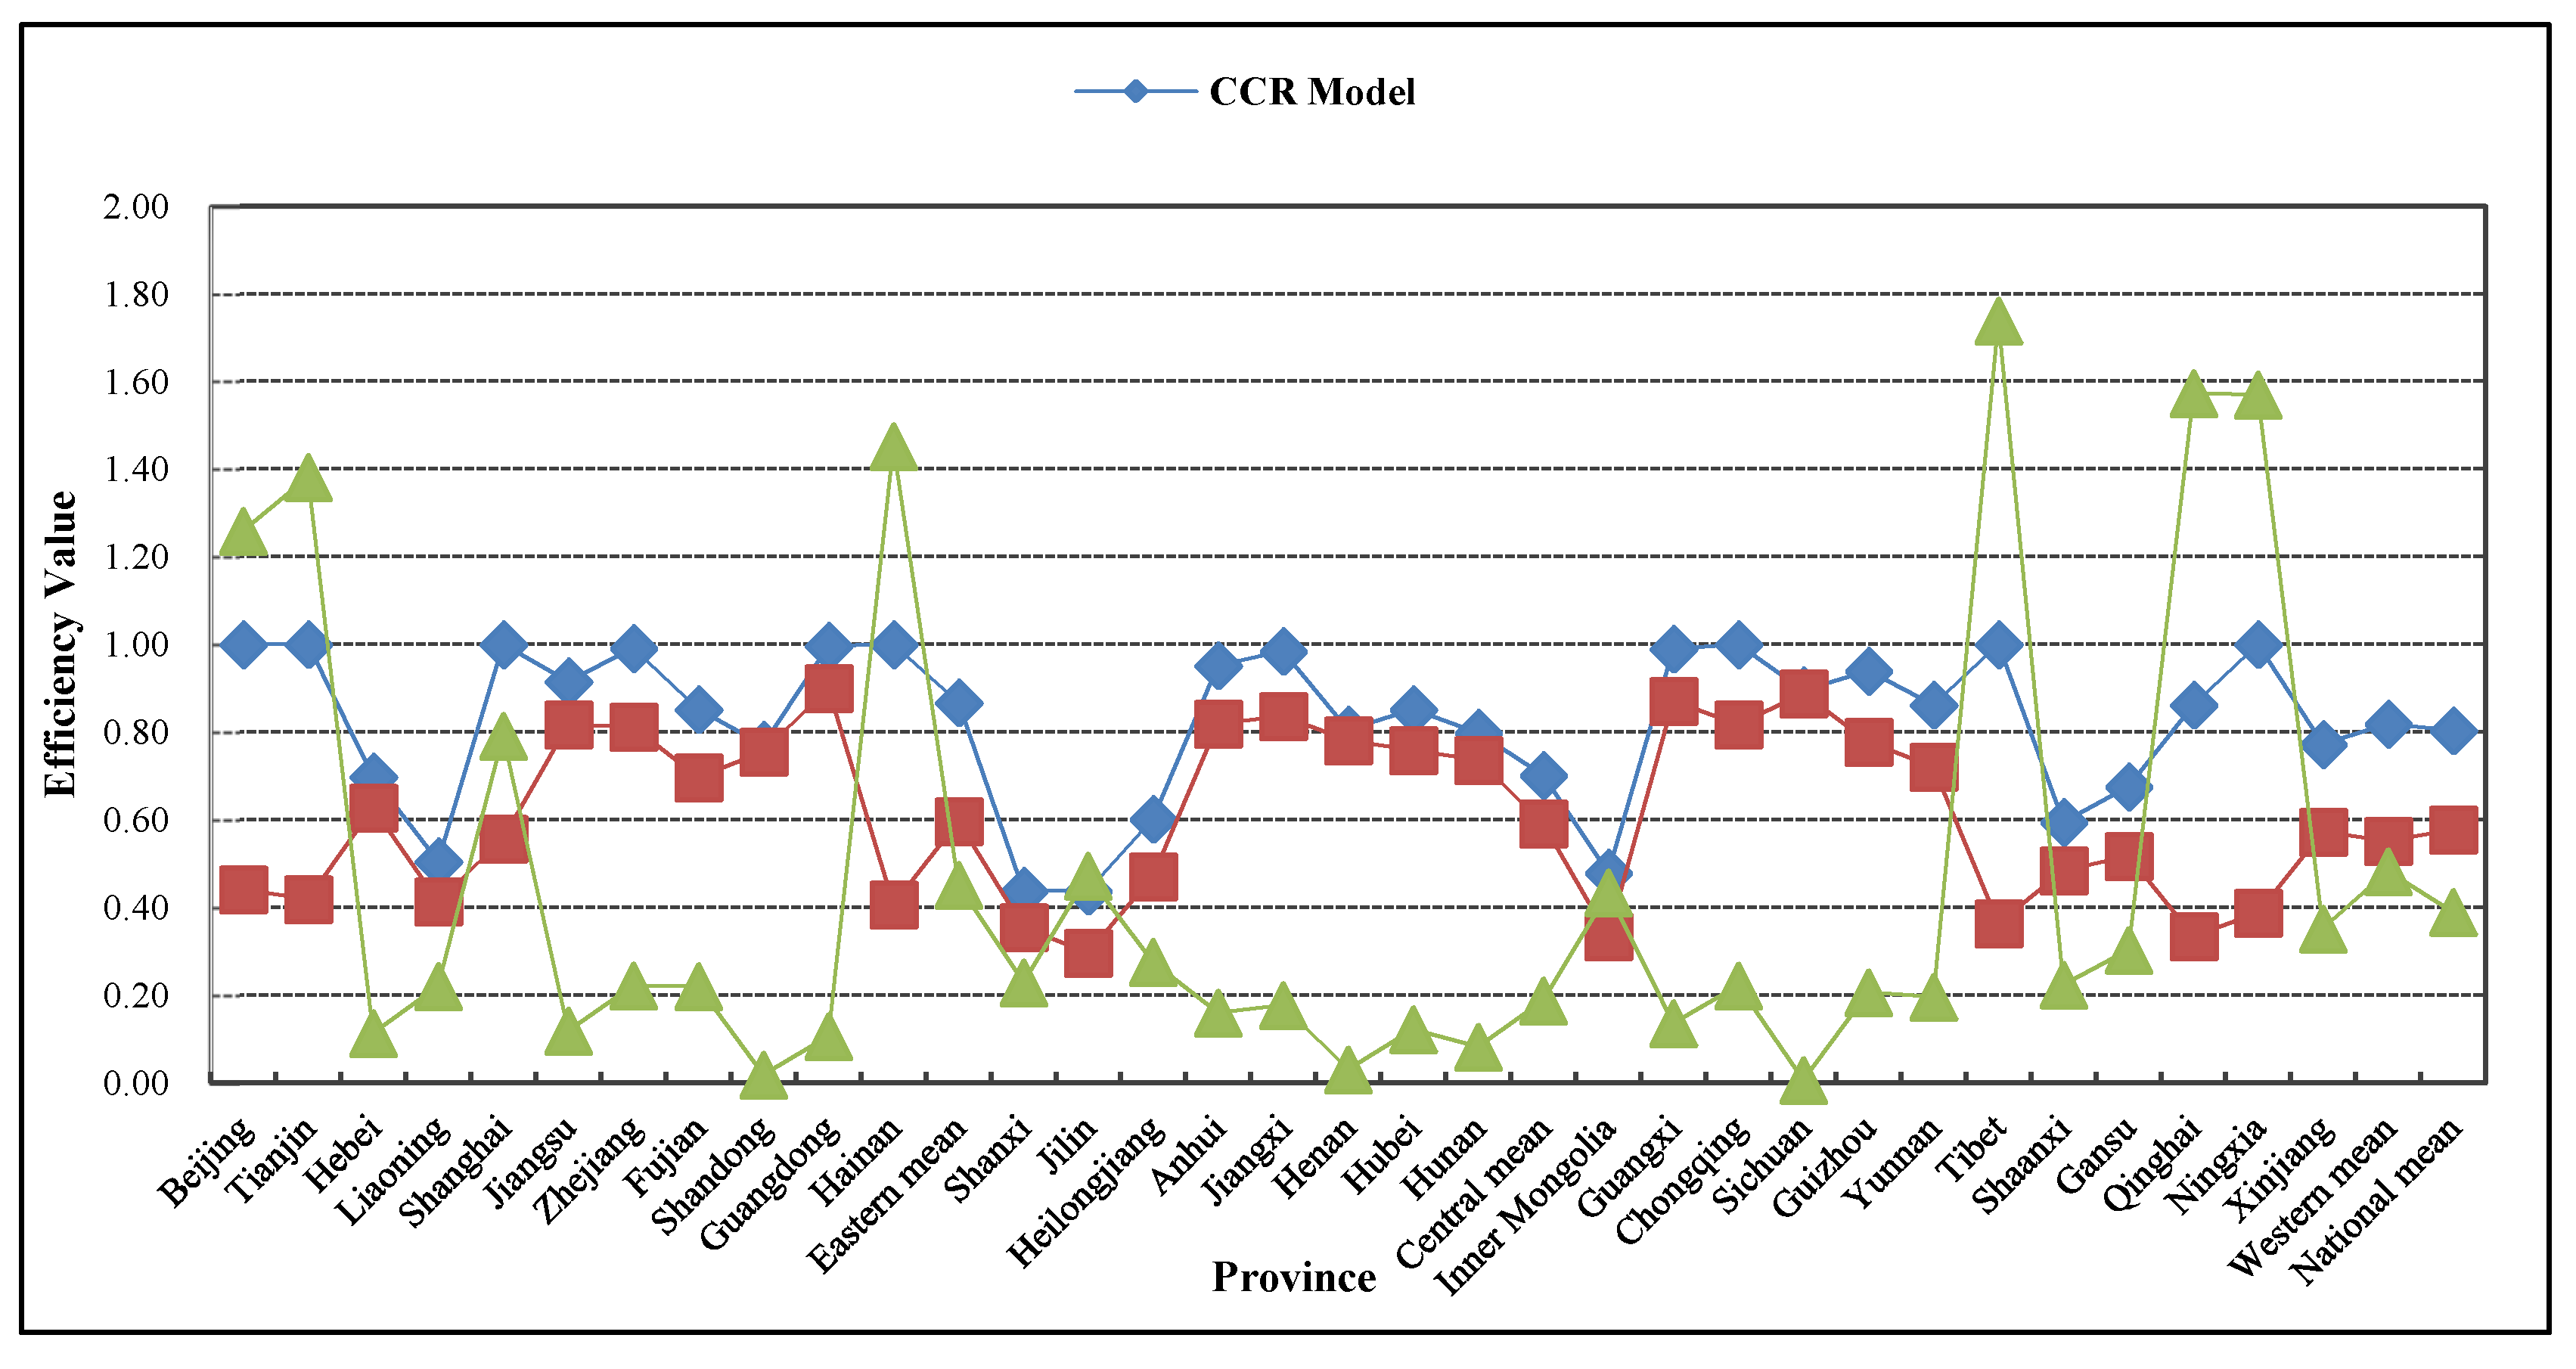
3.1. Allocation Efficiency of Rural Public Health Resources in China: Comparison between CCR Model and Game Cross-Efficiency Model
3.2. Temporal and Spatial Evolution of Allocation Efficiency of Rural Public health Resources in China
3.2.1. Interannual Changes
3.2.2. Interprovincial Changes
3.3. Regional Differences in Allocation Efficiency of Rural Public Health Resources in China
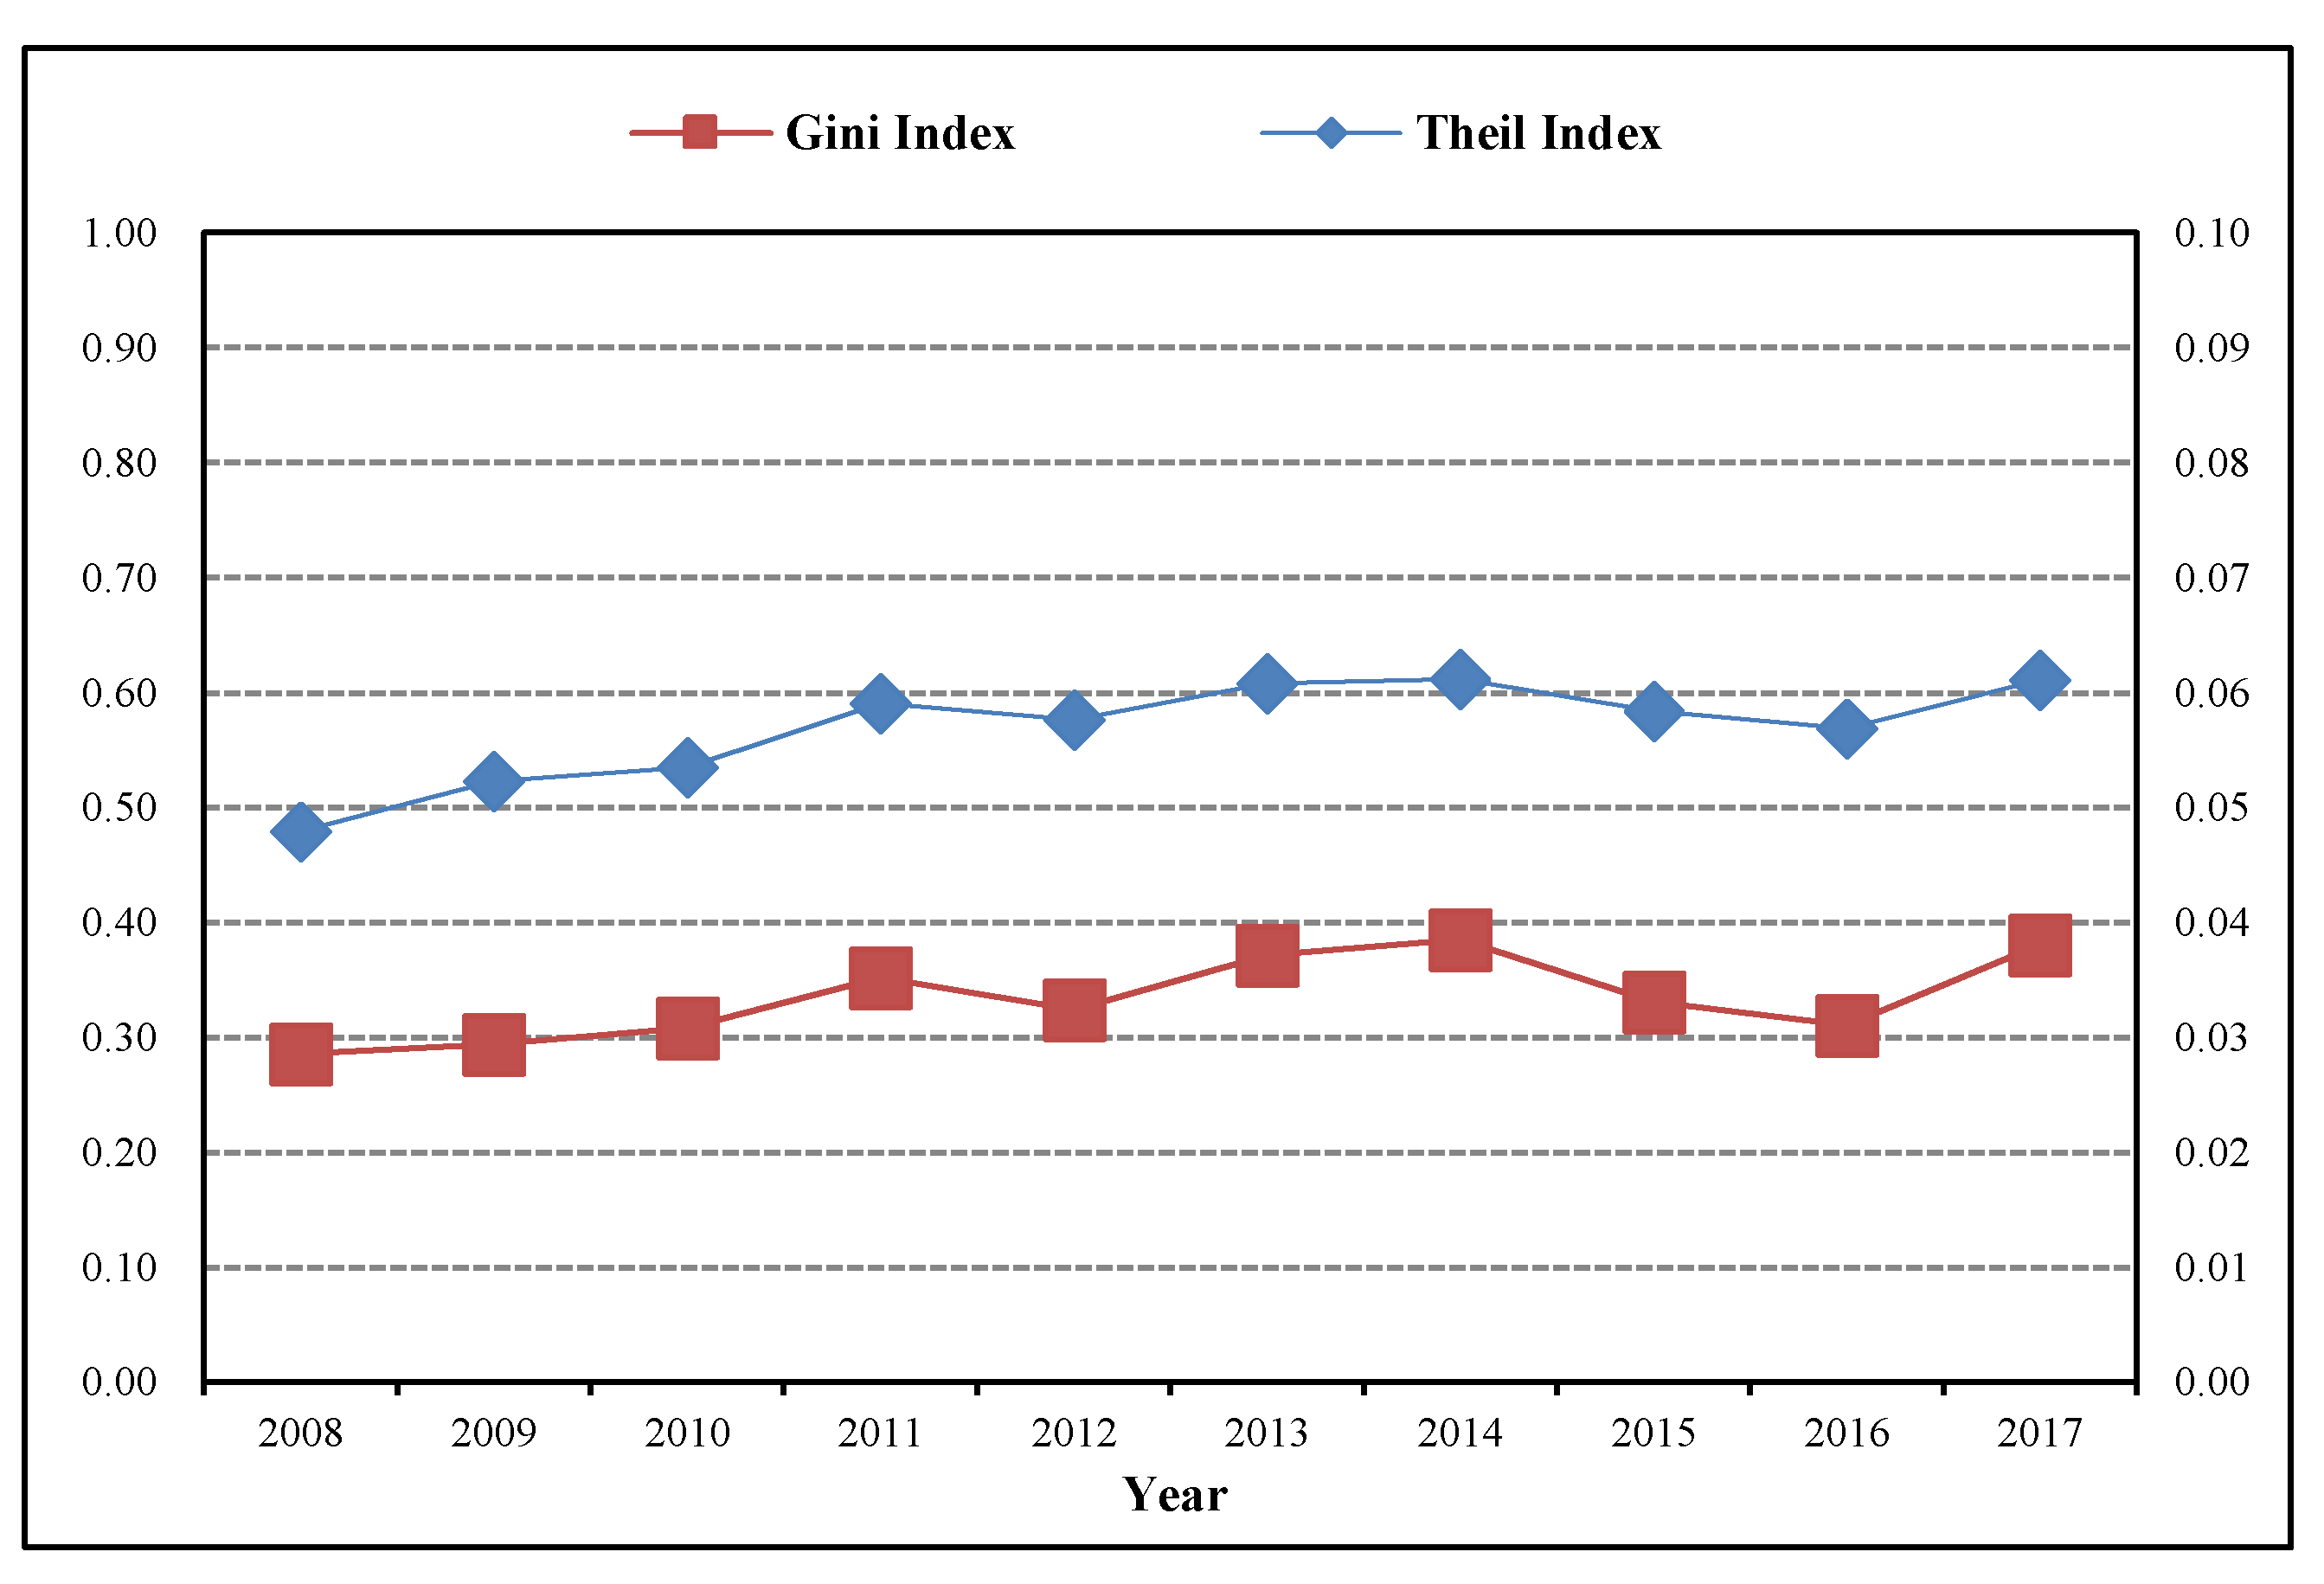
3.3.1. Total Regional Differences in Allocation Efficiency of Rural Public Health Resources in China
3.3.2. Sources of Regional Differences in Allocation Efficiency of Rural Public Health Resources in China
3.4. Influencing Factors of Allocation Efficiency of Rural Public Health Resources in China
- (1)
- Economic factors. According to the relevant literature, this paper mainly investigates the three economic variables including the economic development level, the living conditions, and the governmental financial support. First, the economic development level is expressed by the per capita GDP (yuan). It is generally believed that the economic development of a region can provide the strong support for the rural public health expenditure. Second, the living conditions are expressed by the per capita disposable income of rural residents (yuan). It is generally believed that the higher the living standard of rural residents, the higher the cognition and demand for the public health resources. Third, the governmental financial support is expressed by the proportion of the public health expenditure to the total fiscal expenditure. It is generally believed that the higher the public health expenditure, the more likely to cause the waste of funds and the lax management, resulting in the low allocation efficiency.
- (2)
- Social factors. According to common practice of the existing literature, the social factors affecting the public health expenditure are mainly considered from four aspects: the population quantity, the population quality, the population structure, and the social support level. First, the population quantity reflects the demand degree for the public health resources, and then affects the governmental public health expenditure and the allocation efficiency of the public health resources. It is measured by the population density index and is expressed by the number of people per square kilometer in the rural areas. Second, the population quality in an area is mainly reflected in the education level of population. The lower the education level of residents, the lower the cognition and demand for the public health resources, resulting in a lower allocation efficiency of the rural public health resources. The education level is concretely expressed by the proportion of illiterate persons to the rural population aged 15 and above. Third, the population structure will affect the demand for the public health resources and the fiscal expenditure. The larger the urban population in a region, the more public health resources need to be invested in cities, and then the supply and management of the rural public health resources are ignored, resulting in the decline of the allocation efficiency. The population structure is measured by the urbanization level and is concretely expressed by the proportion of the urban population to the total population. Fourth, the social support level reflects the major demand groups of the rural public health resources in a region. It is expressed by the proportion of the rural children, youth, and the elderly population to the total population. The higher the social support level, the higher the demand for the rural public health resources, which will lead to the improvement of the allocation efficiency.
- (1)
- There are the regional differences in the impact of the economic development level on the allocation efficiency of the rural public health resources. The eastern and western regions have passed the 1% significance test, and the regression coefficient is respectively 0.313 and −0.212. This indicates that the variable promotes the allocation efficiency of the rural public health resources in the eastern region and hinders that in the western region. For the eastern region, the improvement of the economic development level enables more rural residents to enjoy the fruits of the economic development and obtain more public health resources. For the western region, although the economy has developed, the city-centric unbalanced development strategy will make the government invest more resources in the urban development. Not only is the supply of the rural public health resources insufficient, but the allocation efficiency is also low. The nationwide and the central regions have not passed the significance test.
- (2)
- There are the regional differences in the impact of the living conditions on the allocation efficiency of the rural public health resources. The living condition variable in the nationwide, eastern, and western regions has all passed the 5% significance test except for that in the central region, and the regression coefficient is respectively 0.094, −0.138, and 0.283. This indicates that the variable promotes the allocation efficiency of the rural public health resources in the nationwide and western regions, and hinders that in the eastern region. As a developing country, China has a large proportion of rural residents with poor living conditions. With the implementation of the national poverty alleviation strategy, the living conditions of rural residents have been improved and the demand for the public health resources has increased, and then the allocation efficiency of the rural public health resources has been improved. The improvement of the living conditions has greatly increased the demand for the public health resources and has a bigger improvement effect on the allocation efficiency of the rural public health resources, especially in the western region with the relatively low per capita disposable income of rural residents. However, the per capita disposable income of rural residents in the eastern region is very high, and they pay more attention to their own health and are less likely to get sick. The further improvement of the living standards reduces the allocation efficiency of the rural public health resources instead.
- (3)
- The governmental financial support plays an obstacle role in improving the allocation efficiency of the rural public health resources. The coefficient of the governmental financial support variable in the nationwide, eastern, central, and western regions is respectively −0.197, −0.306, −0.004, and −0.098, and all of them have passed the 5% and below significance test except for that in the central region. This shows that with the increase of the total financial inputs into the public health in China, the rural public health expenditure is also increasing year by year. However, the system and mechanism problem of the public health management gives rise to the spatial imbalance of the public health resource supply, and accordingly leads to the mismatch between supply and demand and distorts the allocation efficiency of the rural public health resources.
- (4)
- The population density plays a promotion role in improving the allocation efficiency of the rural public health resources in China. The population density variable in the nationwide, eastern, and western regions has all passed the 5% and below significance test except for that in the central region, and the regression coefficient is respectively 0.065, 0.060, and 0.052. This is mainly because the high population density brings the scale efficiency to the utilization of the rural public health resources, and then improves the allocation efficiency of the rural public health resources.
- (5)
- The education level plays a promotion role in improving the allocation efficiency of the rural public health resources in China. The regression coefficient of the education level variable in the nationwide, eastern, central, and western regions is respectively −0.003, −0.011, −0.018, and −0.013, and all have passed the 10% and below significance test. This indicates that the higher the illiterate person rate in rural residents, the lower the allocation efficiency of the public health resources. With the higher education level of villagers, the greater the demand for the public health resources. This is conducive to the effective allocation of the rural public health resources.
- (6)
- The urbanization level plays an obstacle role in improving the allocation efficiency of the rural public health resources in China. The regression coefficient of the urbanization level variable in the nationwide, eastern, central, and western regions is respectively −0.308, −0.673, −0.122, and −0.375, and all of them have passed the 1% significance test except for that in the central region. When other conditions remain the same, because of the improvement of the urbanization level, a great deal of rural population flows into cities, and the rural public health resources are relatively idle and have not been efficiently utilized.
- (7)
- The social support level plays a promotion role in improving the allocation efficiency of the rural public health resources in China. The regression coefficient of the social support level variable in the nationwide, eastern, central, and western regions is respectively 0.576, 0.355, 0.684 and 0.444, and all have passed the 5% and below significance test. Compared with the middle-aged and young people, the elderly and children have a greater demand for the rural public health resources. Therefore, the higher the rural social support level, the higher the demand for the rural public health resources, and the more fully the rural public health resources may be utilized. And then improve the allocation efficiency of the rural public health resources.
4. Conclusions
- (1)
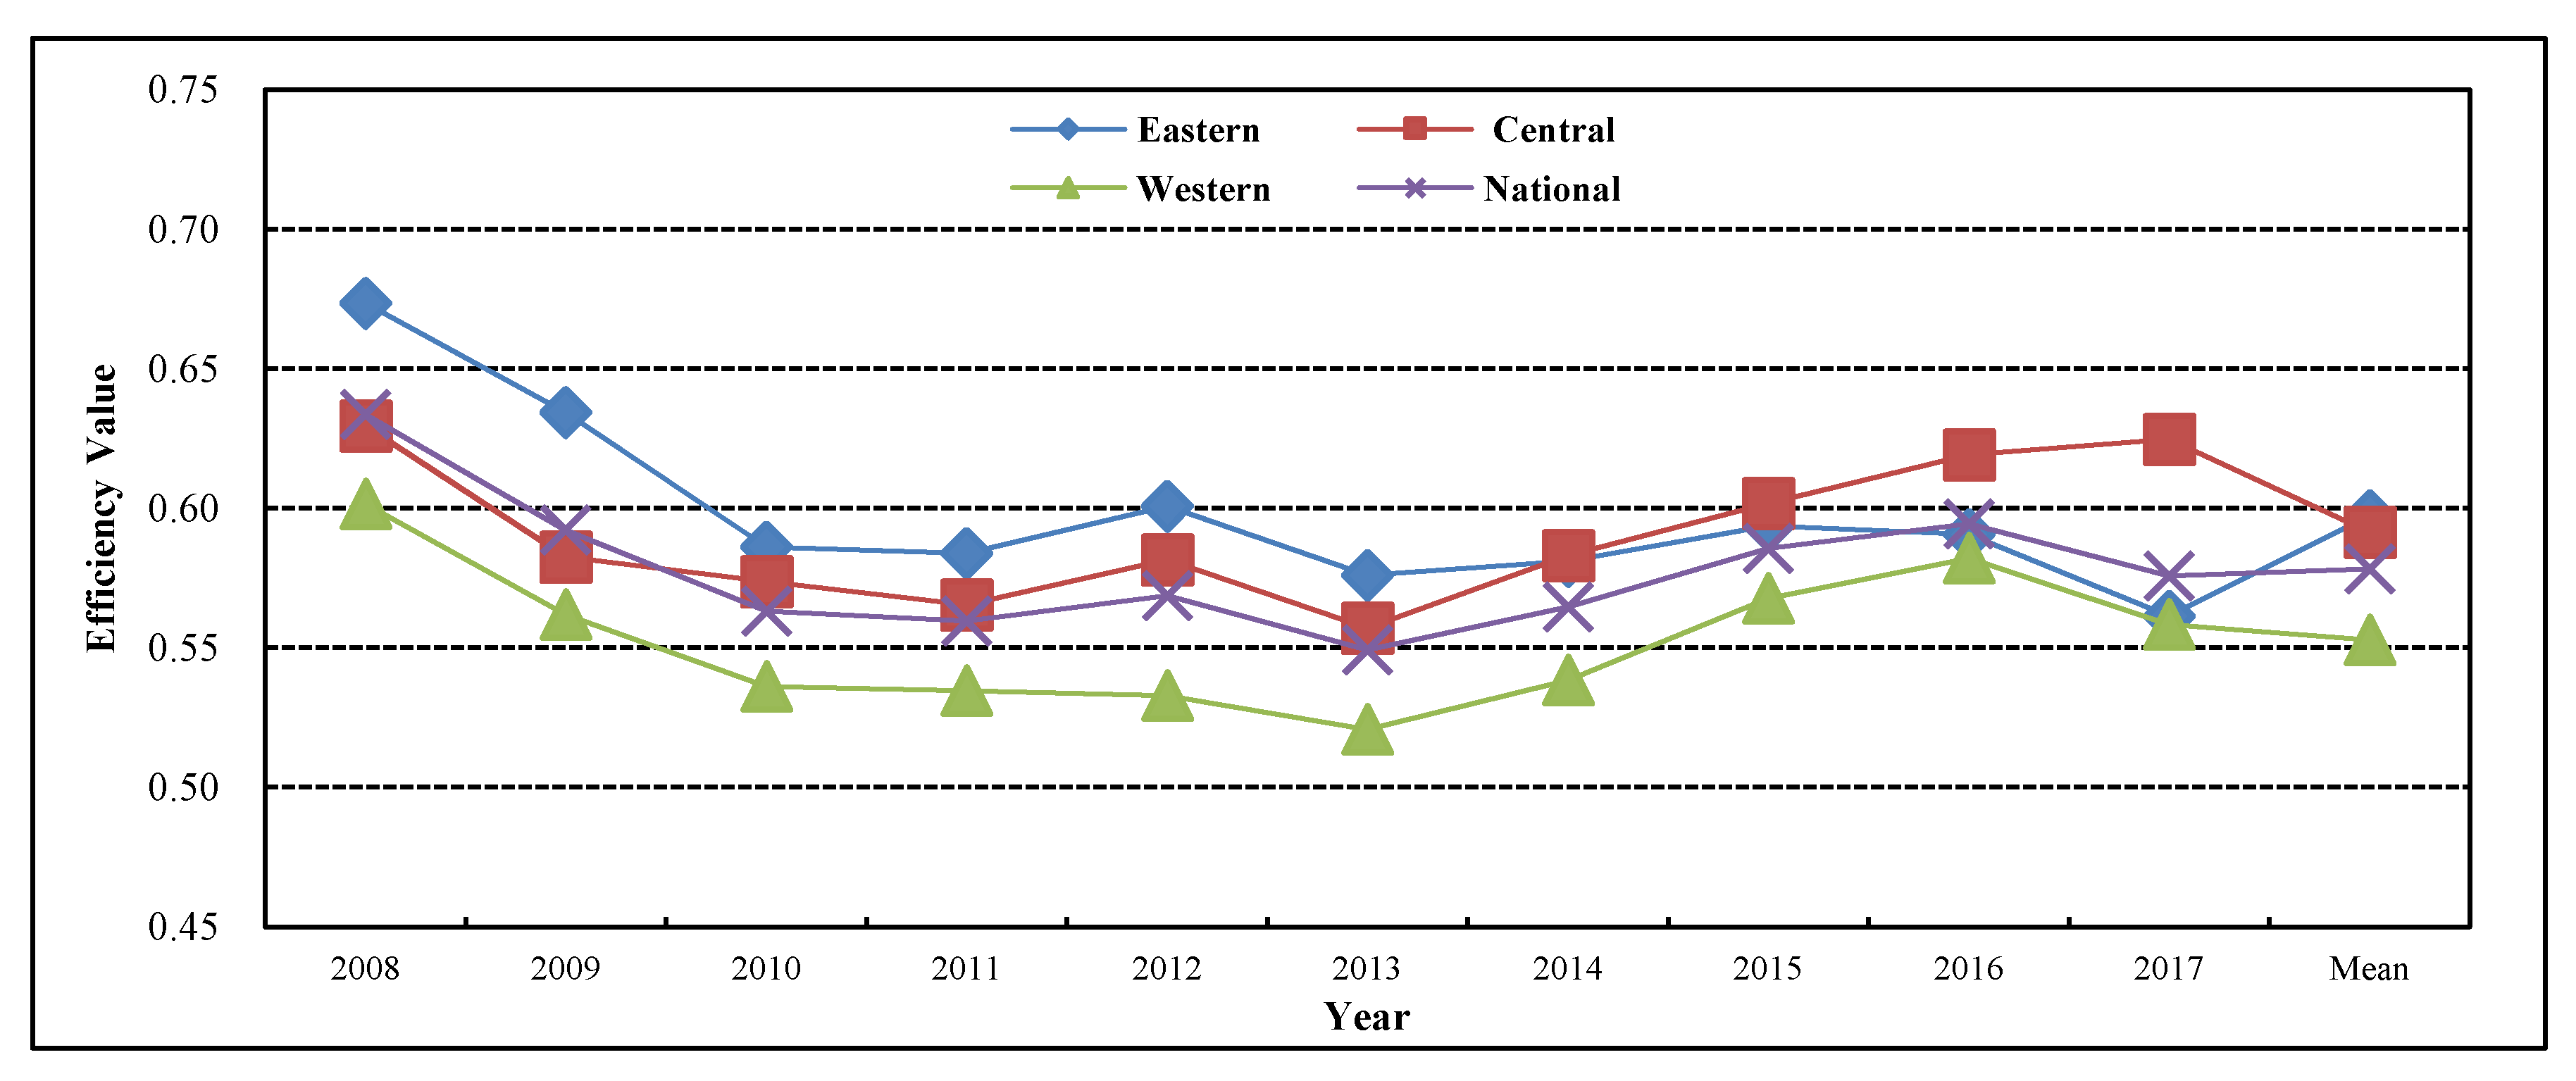
- The total allocation efficiency level of the rural public health resources in China from 2008 to 2017 is relatively low, and it presents a U-shaped trend of first falling and then rising.
- (2)
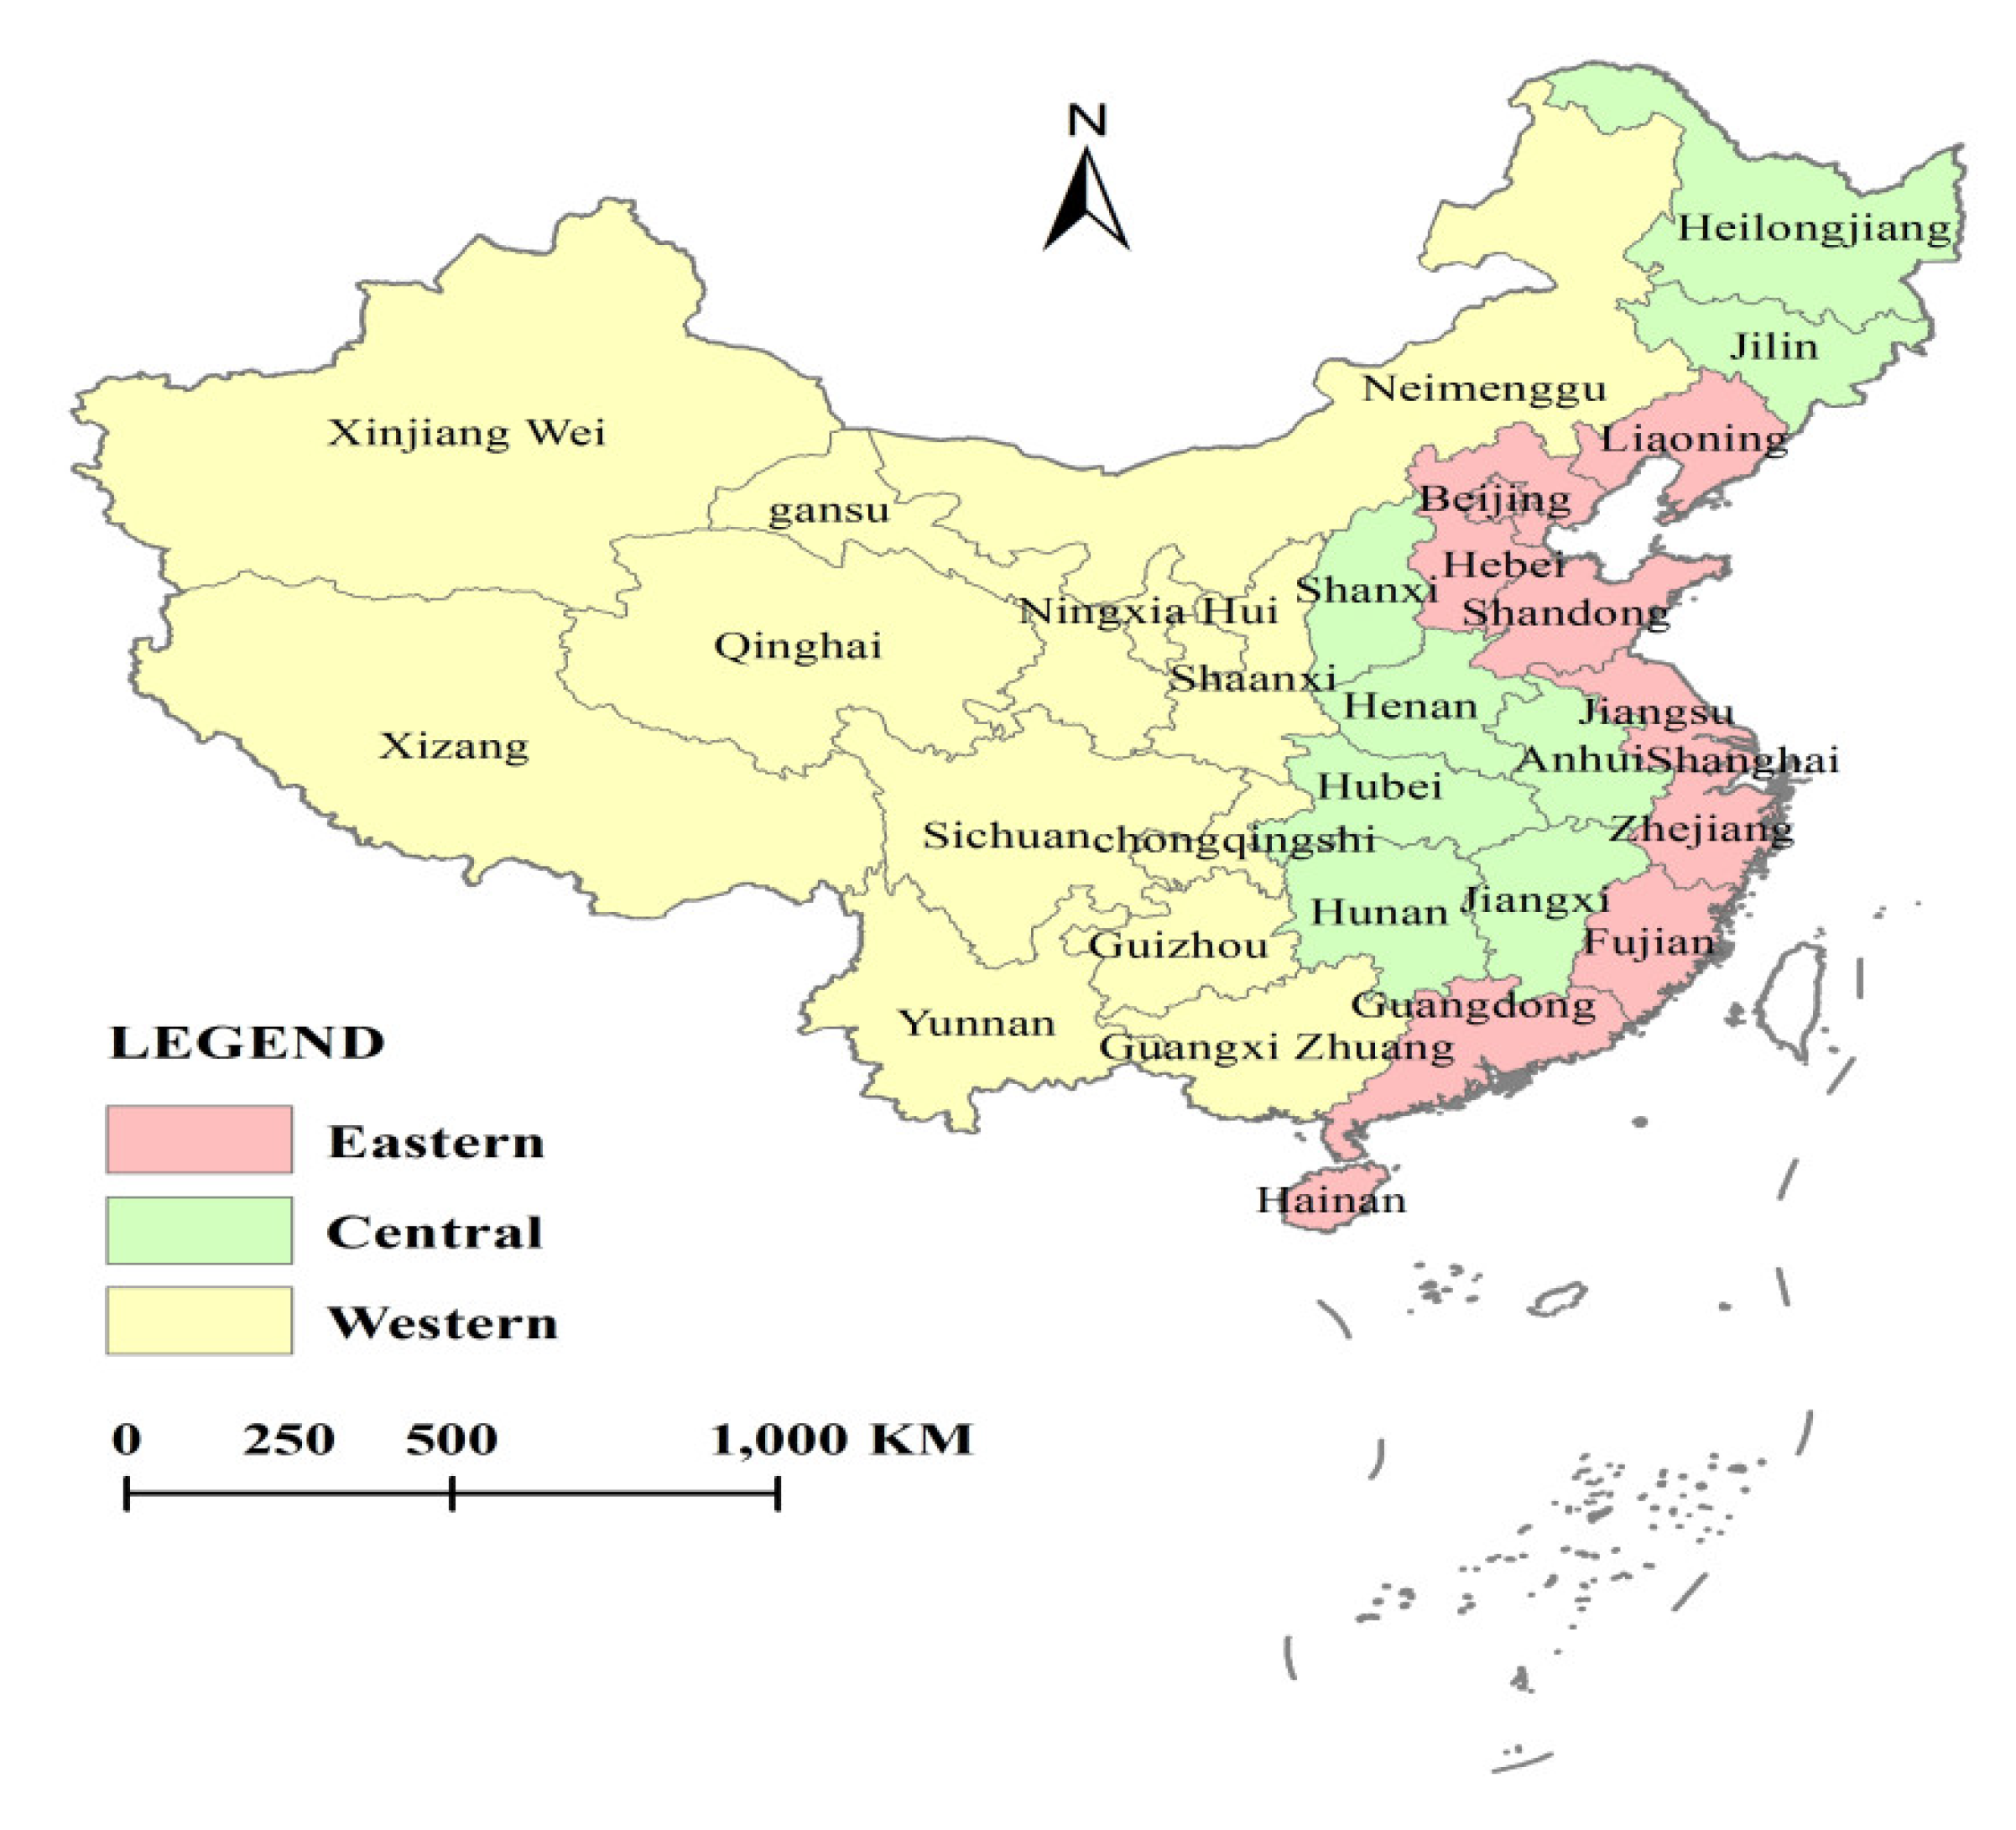
- The changing trend of the allocation efficiency of the rural public health resources in the eastern, central, and western regions of China from 2008 to 2017 is similar to that in the nationwide region, and it shows a gradient trend that “the allocation efficiency in the eastern region is high, the allocation efficiency in the western region is low, and the allocation efficiency in the central region is at the medium level”. However, the gap among the three regions is continually narrowing.
- (3)
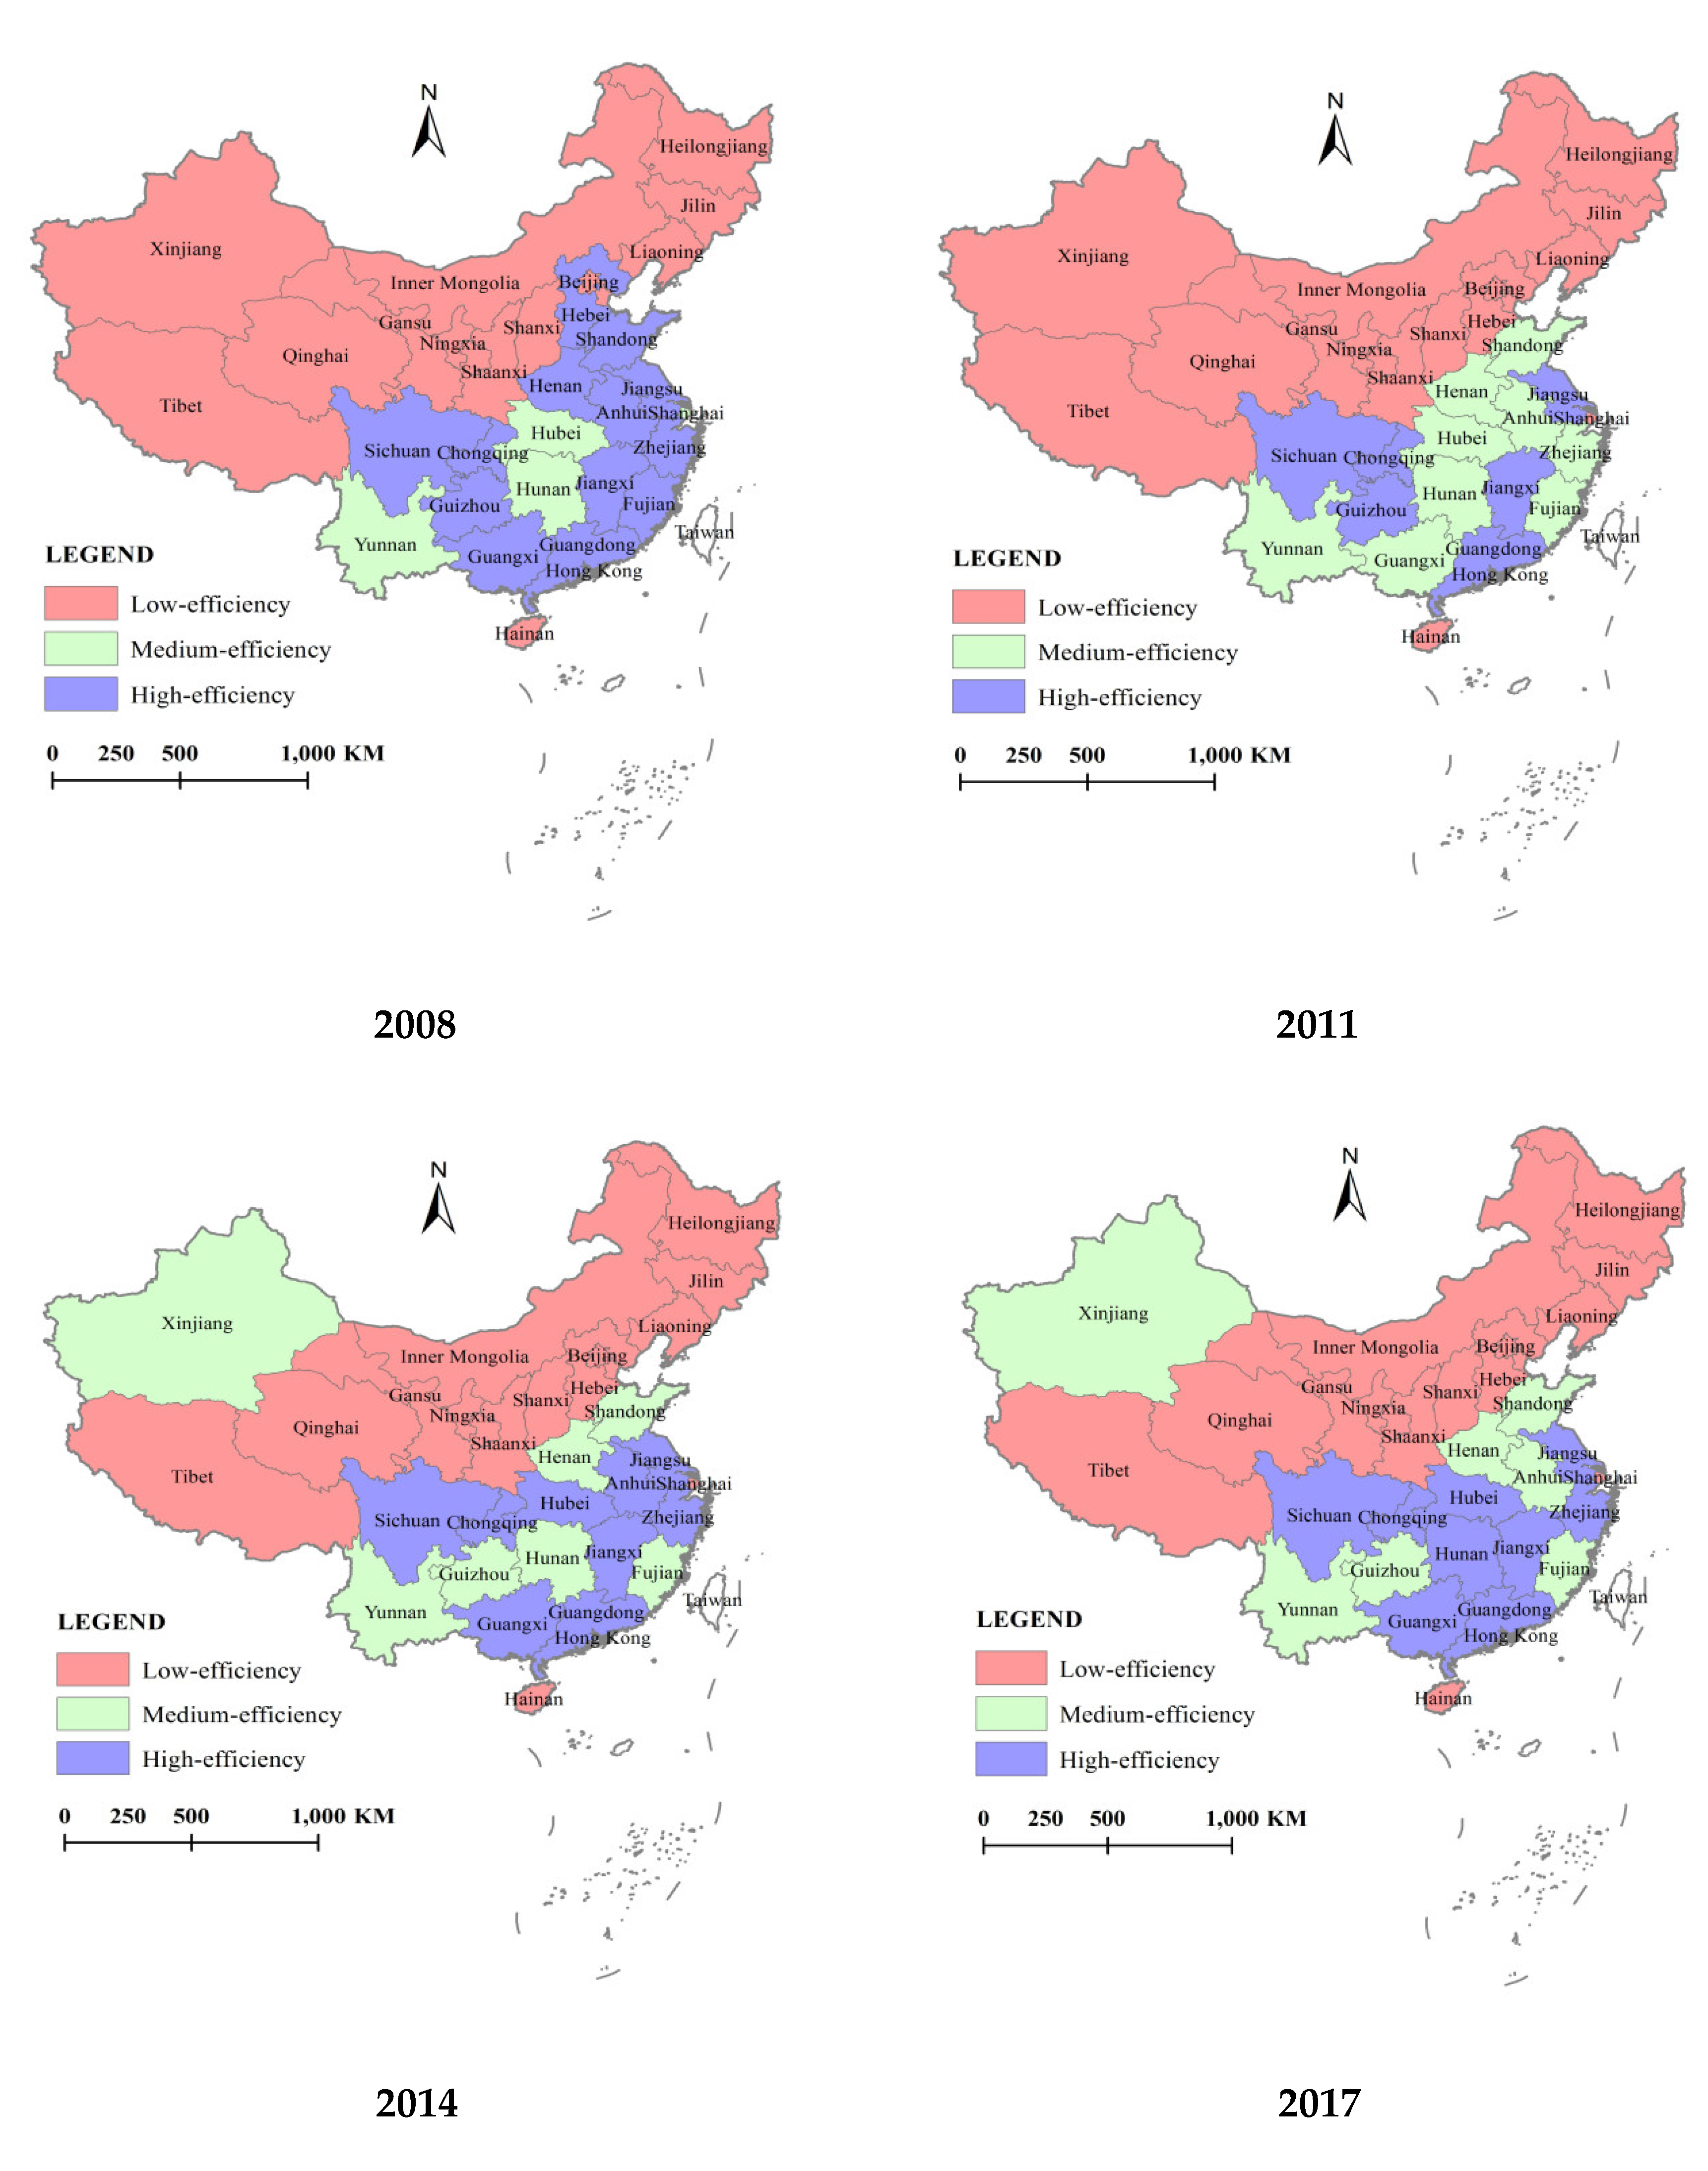
- Because of the unbalanced development of China’s economy, the supply of the rural public health resources in different provinces showed an unbalanced state, and accordingly resulted that the allocation efficiency of the rural public health resources presented an obvious unbalanced trend of “the high-efficiency province reduction, the medium- and low-efficiency province expansion”. With the continuous deepening of the regional coordinated development strategy, the supply of the rural public health resources tended to balance, and the unbalanced trend of the allocation efficiency of the rural public health resources was eased. However, the unbalanced problem of the rural public health resource supply is still noticeable.
- (4)
- To judge from the source of the regional differences, from 2008 to 2017, the average contribution rate of the intra-regional differences measured by the Theil index is 98.67% and much higher than that of the inter-regional differences (1.33%), while the average contribution rate of the intra-regional differences measured by the Gini index is 65.26% and also much higher than that of the inter-regional differences (17.34%). This shows that the intra-regional differences have become the major source of the regional differences in the allocation efficiency of the rural public health resources in China. However, the contribution rate of the inter-regional differences had presented a sustained rising state after 2013, and it cannot be ignored.
- (5)
- The improvement of the education level and the social support level will generally improve the allocation efficiency of the rural public health resources in China and its three regions. The improvement of the governmental financial support and the urbanization level will reduce the allocation efficiency of the rural public health resources in China and its three regions. The economic development level, the living conditions and the population density are the important influencing factors of the allocation efficiency differences of the rural public health resources in the three regions.
Author Contributions
Funding
Conflicts of Interest
References
- National Bureau of Statistics of the People’s Republic of China. Bulletin of National Economic and Social Development Statistics of the People’s Republic of China in 2018. Available online: http://www.stats.gov.cn/tjsj/zxfb/201902/t20190228_1651265.html (accessed on 28 February 2019).
- National Health Commission of the People’s Republic of China. Interpretation of Action Plan for Health Poverty Alleviation Project. Available online: http://www.nhc.gov.cn/zwgk/jdjd/201704/76fb599e9b91427e891396edd5bb6ea8.shtml (accessed on 20 April 2017).
- Banerjee, A.; Duflo, E. Poor Economics: A Radical Rethinking of the Way to Fight Global Poverty; Public Affairs: New York, NY, USA, 2011. [Google Scholar]
- Chernew, M.E.; Newhouse, J.P. Health care spending growth. Handb. Health Econ. 2011, 2, 1–43. [Google Scholar]
- Varabyova, Y.; Schreyögg, J. International comparisons of the technical efficiency of the hospital sector: Panel data analysis of OECD countries using parametric and non-parametric approaches. Health Policy 2013, 112, 70–79. [Google Scholar] [CrossRef]
- Xu, G.C.; Zheng, J.; Zhou, Z.J. Comparative Study of Three Commonly Used Methods for Hospital Efficiency Analysis in Beijing Tertiary Public Hospitals, China. Chin. Med. J. 2015, 128, 3185–3190. [Google Scholar] [CrossRef]
- Mitropoulos, P.; Talias, Μ.A.; Mitropoulos, I. Combining stochastic DEA with Bayesian analysis to obtain statistical properties of the efficiency scores: An application to Greek public hospitals. Eur. J. Oper. Res. 2015, 243, 302–311. [Google Scholar] [CrossRef]
- Rouyendegh, B.D.; Oztekin, A.; Ekong, J. Measuring the efficiency of hospitals: A fully-ranking DEA-FAHP approach. Ann. Oper. Res. 2016, 278, 361–378. [Google Scholar] [CrossRef]
- Kawaguchi, H.; Tone, K.; Tsutsui, M. Estimation of the efficiency of Japanese hospitals using a dynamic and network data envelopment analysis model. Health Care Manag. Sci. 2014, 17, 101–112. [Google Scholar] [CrossRef]
- Sohn, M.; Choi, M. Association between Efficiency and Quality of Health Care in South Korea Long-term Care Hospitals: Using the Data Envelopment Analysis and Matrix Analysis. J. Korean Acad. Nurs. 2014, 44, 418–427. [Google Scholar] [CrossRef]
- Chowdhury, H.; Zelenyuk, V.; Laporte, A. Analysis of productivity, efficiency and technological changes in hospital services in Ontario: How does case-mix matter? Int. J. Prod. Econ. 2014, 150, 74–82. [Google Scholar] [CrossRef]
- Gholami, R.; Higón, D.A.; Emrouznejad, A. Hospital performance: Efficiency or quality? Can we have both with IT? Expert Syst. Appl. 2015, 42, 5390–5400. [Google Scholar] [CrossRef]
- Flokou, A.; Aletras, V.; Niakas, D. A window-DEA based efficiency evaluation of the public hospital sector in Greece during the 5-year economic crisis. PLoS ONE 2017, 12, e0177946. [Google Scholar] [CrossRef] [PubMed]
- Blatnik, P.; Bojnec, Š.; Tušak, M. Measuring efficiency of secondary healthcare providers in Slovenia. Open Med. 2017, 12, 214–225. [Google Scholar] [CrossRef]
- Campanella, P.; Azzolini, E.; Izzi, A. Hospital efficiency: How to spend less maintaining quality? Ann. Dell’Istituto Super. di Sanita 2017, 53, 46–53. [Google Scholar]
- Fuentes, R.; Ferrándiz, G.R.; Fuster, G.B. Efficiency of acute public hospitals in the region of Murcia, Spain. J. Comp. Eff. Res. 2019, 8, 929–946. [Google Scholar] [CrossRef] [PubMed]
- Jat, T.R.; Sebastian, M.S. Technical efficiency of public district hospitals in Madhya Pradesh, India: A data envelopment analysis. Glob. Health Action 2013, 6, 1–8. [Google Scholar]
- Giménez, V.; Prieto, W.; Prior, D. Evaluation of efficiency in Colombian hospitals: An analysis for the post-reform period. Socio-Econ. Plan. Sci. 2019, 65, 20–35. [Google Scholar] [CrossRef]
- Hu, H.H.; Qi, Q.; Yang, C.H. Evaluation of China’s regional hospital efficiency: DEA approach with undesirable output. J. Oper. Res. Soc. 2012, 63, 715–725. [Google Scholar] [CrossRef]
- Cheng, Z.H.; Cai, M.; Tao, H.B. Efficiency and productivity measurement of rural township hospitals in China: A bootstrapping data envelopment analysis. BMJ Open 2016, 6, e011911. [Google Scholar] [CrossRef]
- Zheng, W.; Sun, H.; Zhang, P. A four-stage DEA-based efficiency evaluation of public hospitals in China after the implementation of new medical reforms. PLoS ONE 2018, 13, e0203780. [Google Scholar] [CrossRef]
- Li, B.; Mohiuddin, M.; Liu, Q. Determinants and Differences of Township Hospital Efficiency among Chinese Provinces. Int. J. Environ. Res. Public Health 2019, 16, 1601. [Google Scholar] [CrossRef]
- Ancarani, A.; Di, M.C.; Giammanco, M.D. The impact of managerial and organizational aspects on hospital wards’ efficiency: Evidence from a case study. Eur. J. Oper. Res. 2009, 194, 280–293. [Google Scholar] [CrossRef]
- Sulku, S.N. The health sector reforms and the efficiency of public hospitals in Turkey: Provincial markets. Eur. J. Public Health 2012, 22, 634–638. [Google Scholar] [CrossRef] [PubMed]
- Jiang, S.; Min, R.; Fang, P. The impact of healthcare reform on the efficiency of public county hospitals in China. BMC Health Serv. Res. 2017, 17, 838. [Google Scholar] [CrossRef] [PubMed]
- Evaraj, S.; Patel, P.C. Negative Association of Hospital Efficiency under Increasing Geographic Elevation on Acute Myocardial Infarction In-Patient Mortality. J. Healthc. Qual. 2018, 40, 9–18. [Google Scholar]
- Cheng, G.; Zervopoulos, P.D. Estimating the technical efficiency of health care systems: A cross-country comparison using the directional distance function. Eur. J. Oper. Res. 2014, 238, 899–910. [Google Scholar] [CrossRef]
- Moran, V.; Jacobs, R. An international comparison of efficiency of inpatient mental Cross health care systems. Health Policy 2013, 112, 88–99. [Google Scholar] [CrossRef] [PubMed][Green Version]
- Ozcan, Y.A.; Khushalani, J. Assessing efficiency of public health and medical care provision in OECD countries after a decade of reform. Cent. Eur. J. Oper. Res. 2017, 25, 325–343. [Google Scholar] [CrossRef]
- Hafidz, F.; Ensor, T.; Tubeuf, S. Efficiency measurement in health facilities: A systematic review in low-and middle-income countries. Appl. Health Econ. Health Policy 2018, 16, 465–480. [Google Scholar] [CrossRef]
- Ahmed, S.; Hasan, M.Z.; MacLennan, M. Measuring the efficiency of health systems in Asia: A data envelopment analysis. BMJ Open 2019, 9, e022155. [Google Scholar] [CrossRef]
- Halkos, G.E.; Tzeremes, N.G. A conditional nonparametric analysis for measuring the efficiency of regional public healthcare delivery: An application to Greek prefectures. Health Policy 2011, 103, 73–82. [Google Scholar] [CrossRef]
- Tigga, N.S.; Mishra, U.S. On measuring technical efficiency of the health system in India: An application of Data Envelopment Analysis. J. Health Manag. 2015, 17, 285–298. [Google Scholar] [CrossRef]
- Ibrahim, M.D.; Daneshvar, S. Efficiency Analysis of Healthcare System in Lebanon Using Modified Data Envelopment Analysis. J. Healthc. Eng. 2018, 2008, 1–6. [Google Scholar] [CrossRef] [PubMed]
- Serván-Mori, E.; Chivardi, C.; Mendoza, M.Á. A longitudinal assessment of technical efficiency in the outpatient production of maternal health services in México. Health Policy Plan. 2018, 33, 888–897. [Google Scholar] [CrossRef] [PubMed]
- Stefko, R.; Gavurova, B.; Kocisova, K. Healthcare efficiency assessment using DEA analysis in the Slovak Republic. Health Econ. Rev. 2018, 8, 6. [Google Scholar] [CrossRef] [PubMed]
- Liu, Q.; Li, B.; Mohiuddin, M. Prediction and Decomposition of Efficiency Differences in Chinese Provincial Community Health Services. Int. J. Environ. Res. Public Health 2018, 15, 2265. [Google Scholar] [CrossRef]
- Du, T. Performance Measurement of Healthcare Service and Association Discussion between Quality and Efficiency: Evidence from 31 Provinces of Mainland China. Sustainability 2018, 10, 74. [Google Scholar] [CrossRef]
- Chai, P.; Zhang, Y.; Zhou, M. Technical and scale efficiency of provincial health systems in China: A bootstrapping data envelopment analysis. BMJ Open 2019, 9, e027539. [Google Scholar] [CrossRef]
- Wang, M.; Tao, C. Research on the Efficiency of Local Government Health Expenditure in China and Its Spatial Spillover Effect. Sustainability 2019, 11, 2469. [Google Scholar] [CrossRef]
- Gong, G.; Chen, Y.; Gao, H. Has the Efficiency of China’s Healthcare System Improved after Healthcare Reform? A Network Data Envelopment Analysis and Tobit Regression Approach. Int. J. Environ. Res. Public Health 2019, 16, 4847. [Google Scholar] [CrossRef]
- Du, T.; Ran, L.; Li, J.L. Dynamic evaluation of medical and health service efficiency in China based on DtSBM model. J. Beijing Inst. Technol. (Soc. Sci. Ed.) 2019, 21, 82–94. [Google Scholar]
- Yu, D.; Tang, W. Marine Healthcare System: An Analysis of Economy and Efficiency. J. Coast. Res. 2019, 94, 926–929. [Google Scholar] [CrossRef]
- Chen, D.; Cheng, J.Y. Government supply efficiency of rural medical and health in China—An analysis based on stochastic production boundary model. J. Shandong Univ. (Philos. Soc. Sci.) 2011, 1, 64–71. [Google Scholar]
- Xue, L. Efficiency measurement and influencing factors analysis of provincial rural medical and health services in China—An empirical study based on stochastic frontier production function. Rural Econ. 2013, 10, 76–81. [Google Scholar]
- Mitropoulos, P.; Kounetas, K.; Mitropoulos, I. Factors affecting primary health care centers’ economic and production efficiency. Ann. Oper. Res. 2016, 247, 807–822. [Google Scholar] [CrossRef]
- Lee, S.; Kim, C. Estimation of Association between Healthcare System Efficiency and Policy Factors for Public Health. Appl. Sci. 2018, 8, 2674. [Google Scholar] [CrossRef]
- Han, H.W.; Miao, Y.Q. An empirical study on the efficiency accounting and influencing factors of local government health expenditure—DEA-Tobit analysis based on panel data of 31 provinces in China. J. Financ. Econ. 2010, 36, 4–15. [Google Scholar]
- Zhang, Z.F. Fiscal decentralization, health reform and local government health expenditure efficiency—Measurement and demonstration based on inter-provincial panel data. Financ. Trade Econ. 2013, 9, 28–42. [Google Scholar]
- Liu, Z.; Zhang, X.; Yang, D. The efficiency evaluation of Out-of-Pocket healthcare expenditure in China: Data envelopment analysis-tobit analysis based on panel data. Healthmed 2012, 6, 4244–4252. [Google Scholar]
- Guo, H.N.; Zhao, Y.; Niu, T. Hong Kong Hospital Authority resource efficiency evaluation: Via a novel DEA-Malmquist model and Tobit regression model. PLoS ONE 2017, 12, e0184211. [Google Scholar] [CrossRef]
- Simar, L.; Wilson, P.W. Estimation and inference in two-stage semi-parametric models of production processes. J. Econ. 2007, 136, 31–64. [Google Scholar] [CrossRef]
- Charnes, A.; Cooper, W.W.; Rhodes, E. Measuring the efficiency of decision making units. Eur. J. Oper. Res. 1979, 6, 429–444. [Google Scholar] [CrossRef]
- Banker, R.D.; Charnes, A.; Cooper, W.W. Some Models for Estimating Technical and Scale Inefficiencies in Data Envelopment Analysis. Manag. Sci. 1984, 9, 1078–1092. [Google Scholar] [CrossRef]
- Sexton, R.J. The formation of cooperatives: A game-theoretic approach with implications for cooperative finance, decision making, and stability. Am. J. Agric. Econ. 1986, 68, 214–225. [Google Scholar] [CrossRef]
- Liang, L.; Wu, J.; Cook, W.D. The DEA game cross-efficiency model and its Nash equilibrium. Oper. Res. 2008, 56, 1278–1288. [Google Scholar] [CrossRef]
- Liang, L.; Wu, J. A retrospective and perspective view on cross efficiency of data envelopment analysis (DEA). J. Univ. Sci. Technol. China 2013, 43, 941–947. [Google Scholar]
- Theil, H. Economics and Information Theory; North-Holland: Amsterdam, The Netherlands, 1967. [Google Scholar]
- Bourguignon, F. Decomposable Income Inequality Measures. Econometrica 1979, 47, 901–920. [Google Scholar] [CrossRef]
- Cowell, F.A. On the Structure of Additive Inequality Measures. Rev. Econ. Stud. 1980, 47, 521–531. [Google Scholar] [CrossRef]
- Shorrocks, A.F. The Class of Additively Decomposable Inequality Measures. Econometrica 1980, 48, 613–625. [Google Scholar] [CrossRef]
- Dagum, C. A new approach to the decomposition of the Gini income inequality ratio. Empir. Econ. 1997, 4, 515–531. [Google Scholar] [CrossRef]


| Index | Variable | Variable Declaration |
|---|---|---|
| input index (xk0) | personnel input (x1) | number of personnel in rural health institutions (person) |
| bed input (x2) | number of beds in rural health institutions (unit) | |
| institutional input (x3) | number of rural health institutions (unit) | |
| expenditure input (x4) | rural medical and healthcare expenditure (10,000 yuan) | |
| output index (yi0) | hospital business output (y1,2,3) | rural diagnosis and treatment person-time (10,000 person-time) |
| rural number of people receiving hospitalizations (10,000 person) | ||
| rural average hospitalization days (day) |
| Year | Theil Index Decomposition | Gini Index | ||||||||||
|---|---|---|---|---|---|---|---|---|---|---|---|---|
| Total Regional Differences | Source of Differences | Contribution Rate (%) | Total G | Source of Differences | Contribution Rate (%) | |||||||
| Intra-Regional | Inter-Regional | Intra-Regional | Inter-Regional | Gw | Gnb | Gt | Gw | Gnb | Gt | |||
| 2008 | 0.0479 | 0.0469 | 0.0010 | 97.94 | 2.06 | 0.2855 | 0.1841 | 0.0660 | 0.0354 | 64.45 | 23.11 | 12.43 |
| 2009 | 0.0523 | 0.0514 | 0.0009 | 98.22 | 1.78 | 0.2938 | 0.1970 | 0.0446 | 0.0522 | 67.04 | 15.19 | 17.77 |
| 2010 | 0.0535 | 0.0531 | 0.0004 | 99.23 | 0.77 | 0.3083 | 0.2360 | 0.0452 | 0.0271 | 76.54 | 14.66 | 8.80 |
| 2011 | 0.0591 | 0.0586 | 0.0005 | 99.10 | 0.90 | 0.3516 | 0.2458 | 0.0413 | 0.0645 | 69.91 | 11.75 | 18.35 |
| 2012 | 0.0576 | 0.0568 | 0.0008 | 98.62 | 1.38 | 0.3241 | 0.1959 | 0.0482 | 0.0800 | 60.46 | 14.88 | 24.66 |
| 2013 | 0.0608 | 0.0603 | 0.0005 | 99.25 | 0.75 | 0.3714 | 0.2384 | 0.0610 | 0.0720 | 64.18 | 16.40 | 19.41 |
| 2014 | 0.0613 | 0.0607 | 0.0005 | 99.15 | 0.85 | 0.3849 | 0.2401 | 0.0578 | 0.0870 | 62.39 | 15.02 | 22.59 |
| 2015 | 0.0584 | 0.0579 | 0.0005 | 99.13 | 0.87 | 0.3312 | 0.1966 | 0.0661 | 0.0685 | 59.37 | 19.97 | 20.66 |
| 2016 | 0.0570 | 0.0561 | 0.0008 | 98.58 | 1.42 | 0.3103 | 0.1897 | 0.0735 | 0.0471 | 61.15 | 23.67 | 15.18 |
| 2017 | 0.0611 | 0.0595 | 0.0016 | 97.44 | 2.56 | 0.3804 | 0.2551 | 0.0715 | 0.0538 | 67.06 | 18.80 | 14.14 |
| Mean | 0.0569 | 0.0561 | 0.0008 | 98.67 | 1.33 | 0.3342 | 0.2179 | 0.0575 | 0.0588 | 65.26 | 17.34 | 17.40 |
| Year | Inter-Regional Gini Index | Intra-Regional Gini Index | ||||
|---|---|---|---|---|---|---|
| Between Eastern and Central Region | Between Eastern and Western Region | Between Central and Western Region | Eastern Region | Central Region | Western Region | |
| 2008 | 0.3701 | 0.4401 | 0.3307 | 0.3571 | 0.1656 | 0.3379 |
| 2009 | 0.3889 | 0.4586 | 0.3468 | 0.3671 | 0.1258 | 0.3304 |
| 2010 | 0.3627 | 0.3965 | 0.3616 | 0.3350 | 0.0939 | 0.3708 |
| 2011 | 0.4398 | 0.4759 | 0.3435 | 0.3218 | 0.0895 | 0.3248 |
| 2012 | 0.3872 | 0.4196 | 0.3495 | 0.2913 | 0.1492 | 0.3337 |
| 2013 | 0.4248 | 0.4784 | 0.3725 | 0.3369 | 0.1497 | 0.3293 |
| 2014 | 0.4431 | 0.4501 | 0.3418 | 0.3591 | 0.1299 | 0.3120 |
| 2015 | 0.3716 | 0.4440 | 0.3947 | 0.3837 | 0.0943 | 0.3789 |
| 2016 | 0.3304 | 0.3907 | 0.3352 | 0.3542 | 0.1134 | 0.3516 |
| 2017 | 0.4013 | 0.4614 | 0.3718 | 0.3718 | 0.1345 | 0.3856 |
| Explanatory Variable | Nationwide | Eastern | Central | Western |
|---|---|---|---|---|
| economic development level | −0.055 (−1.031) | 0.313 *** (3.319) | −0.173 (−0.748) | −0.212 *** (−2.785) |
| living conditions | 0.094 ** (2.135) | −0.138 ** (−2.974) | 0.156 (0.868) | 0.283 ** (4.926) |
| governmental financial support | −0.197 *** (−4.713) | −0.306 *** (−3.013) | −0.004(−0.042) | −0.098 ** (−2.138) |
| population density | 0.065 *** (9.318) | 0.060 ** (2.048) | −0.049 (−0.514) | 0.052 *** (7.832) |
| education level | −0.003 * (−1.774) | −0.011 * (−1.723) | −0.018 ** (−2.203) | −0.013 *** (−6.248) |
| urbanization level | −0.308 *** (−3.452) | −0.673 *** (−3.821) | −0.122(−0.254) | −0.375 *** (−3.934) |
| social support level | 0.576 *** (13.354) | 0.355 ** (2.643) | 0.684 *** (3.657) | 0.444 *** (8.543) |
| constant | −0.244 (−0.863) | 0.601 (0.867) | −0.841 (−0.654) | 0.323 (1.031) |
| R-squared | 0.684 | 0.734 | 0.833 | 0.884 |
| Adj R-squared | 0.676 | 0.722 | 0.817 | 0.876 |
| sample N | 310 | 110 | 80 | 120 |
© 2020 by the authors. Licensee MDPI, Basel, Switzerland. This article is an open access article distributed under the terms and conditions of the Creative Commons Attribution (CC BY) license (http://creativecommons.org/licenses/by/4.0/).
Share and Cite
Liu, T.; Li, J.; Chen, J.; Yang, S. Regional Differences and Influencing Factors of Allocation Efficiency of Rural Public Health Resources in China. Healthcare 2020, 8, 270. https://doi.org/10.3390/healthcare8030270
Liu T, Li J, Chen J, Yang S. Regional Differences and Influencing Factors of Allocation Efficiency of Rural Public Health Resources in China. Healthcare. 2020; 8(3):270. https://doi.org/10.3390/healthcare8030270
Chicago/Turabian StyleLiu, Tao, Jixia Li, Juan Chen, and Shaolei Yang. 2020. "Regional Differences and Influencing Factors of Allocation Efficiency of Rural Public Health Resources in China" Healthcare 8, no. 3: 270. https://doi.org/10.3390/healthcare8030270
APA StyleLiu, T., Li, J., Chen, J., & Yang, S. (2020). Regional Differences and Influencing Factors of Allocation Efficiency of Rural Public Health Resources in China. Healthcare, 8(3), 270. https://doi.org/10.3390/healthcare8030270