Article

Innovative Mesosystems Algorithm for Sustainable Development Priority Areas Identification in Industry Based on Decision Trees Construction

by
Aleksey I. Shinkevich
1,*,
Irina G. Ershova
2,
Farida F. Galimulina
1 and
Alla A. Yarlychenko
1
1
Logistics and Management Department, Kazan National Research Technological University, 420015 Kazan, Russia
2
Department of Finance and Credit, Southwest State University, 305040 Kursk, Russia
*
Author to whom correspondence should be addressed.
Mathematics 2021, 9(23), 3055; https://doi.org/10.3390/math9233055
Submission received: 13 November 2021 / Revised: 25 November 2021 / Accepted: 26 November 2021 / Published: 28 November 2021

Abstract

:
Globally, assessing sustainable development methodology is kept in sustainable society index (SSI) format, but at the level of meso- and microsystems it remains undeveloped. The aim of the study is to typologize innovative mesosystems in Russian industry in the context of sustainable development based on the CART algorithm and to develop an algorithm for identifying priority areas of sustainable development. The research methods applied included formalization, a systematic approach, and the CART algorithm (calculation of the Gini index, training sample segmentation, the use of a recursive function and regression assessment). As a result of the study, the algorithm for the differentiated identification of innovative mesosystems sustainable development priority directions in industry based on the unique author’s methodology (ISDI) is proposed. The predominance of mesosystems with weak level of sustainable development requiring state support in favor of such mesosystems restructure is revealed. The novelty of the research lies in the development of new science-based solutions to ensure an accelerated transition of industry to the path of sustainable development. The difference of the author’s approach from the provisions known in science is the inclusion of environmental innovations in the mechanism for managing the sustainable development of innovative mesosystems and subsequent accounting in the process of mathematical processing of an array of data, which determines the uniqueness of the constructed decision trees.

1. Introduction

Modern trends in industrial development—the concept of sustainable development, ESG initiative, green industry, carbon neutrality, etc.—are implemented to different degrees at the micro, meso and macro levels. Cross-country comparisons of sustainable society index (SSI) level indicate the lag of Russian industry compared to other countries: at the end of 2019, the consolidated indicator of human wellbeing in Russia was 7.6 points (the top position was taken by Bermuda—9.7), environmental wellbeing—2.6 points (the top position was taken by the Northern Mariana Islands—9.6), “economic wellbeing”—4.9 points (the top position was taken by the Cayman Islands and Liechtenstein—10) [1]. The reasons for rating low positions are the differences existing between mesosystems in industry specialization, resource base availability, innovation activity, investment attractiveness, etc., that affects the state of macro environment as a whole. The existing heterogeneity of mesosystems in industry dictates the need to form a flexible approach to management based on the methodology for their sustainable development assessment.
The foregoing actualizes the problems highlighted in this study and determines its purpose—innovative mesosystems typologization in industry in the context of sustainable development based on the CART algorithm and the development of an algorithm for identifying sustainable development priority areas adequate to the identified type of mesosystems. The study is important for reducing the polarization of mesosystems at the national level and at aligning mesosystems position relative to the average level in Russia.
In this study, a systematic approach is implemented: the author contributed to the development of the methodology for sustainable industry development in Russia and applied mathematical tools, in total, allowing to obtain reliable results, the practical value of which lies in the development of recommendations flexible system.
The theoretical and methodological study basis has an extensive array of research works. Our research focuses on the concept of sustainable development and its implementation in industry. A number of works contain the results of a study of general issues of industrial enterprises transition to sustainable development [2,3,4,5,6,7,8]. Chen’s work emphasizes that the competitiveness of modern industrial enterprises is due precisely to their focus on sustainable development, taking into account environmental performance [9]. Holden et al. introduces the concept of “space for sustainable development”, defining threshold boundaries within which the state of the system is stable [10].
Innovative aspects of industrial development at mesosystems level are considered by scientists in the context of ensuring competitiveness [11], a differentiated approach to the management of mesosystems innovative development in Russian industry [12], the efficiency increase of organizational and economic processes of implementing an innovative strategy of microsystems [13], the ratio of costs and benefits of innovation activity [14], diffusion of innovations [15], etc.
An extensive number of scientific works are mainly devoted to the environmental aspects of mesosystems sustainable development in industry [16,17,18,19,20]. In particular, Zhao et al. investigates the specifics of carbon trading mechanism implementation and the subsequent effect in relation to 3E (economy, energy, and environment) [21].
Socio-economic systems are described by a nonlinear function of behavior, which determines the use of a wide range of mathematical tools. These include cluster analysis, factor analysis, decision trees, and other data processing methods. A contribution to sustainable development methodology progress is made by Koh et al., whose methodological solution is based on a systematic approach that integrates the efficiency of natural and social resources use; the “integrated resource efficiency index” (IRE-index) and the “integrated resource efficiency view” (IREV) are being proposed [22]. In the works of Lubnina et al. a method for calculating an aggregated indicator based on the summation of subindicators (economic, environmental, and social reliability of production), is adjusted by a relative weighting factor [23,24,25]. A capacious technique using factor analysis is proposed [26] in relation to agriculture; the authors considered factor loadings of particular indicators for assessing sustainable development without aggregation into a complex indicator. The approach of Miola and Schiltz is based on the absolute dependence of the country’s position at the world level on the chosen method for sustainable development assessment and is also based on a comparative analysis of various methods for measuring the achievement of sustainable development goals [27]. In addition, the study touches on the issue of managing mesosystems in the context of resource cycles closure, that is relevant for the global economy, namely, a closed cycle of water use. This benchmark is set by the UN Sustainable Development Goals (Goal 12: Ensure Sustainable Consumption and Production Patterns) [28].
The use of mathematical tools for calculating the integral indicator of sustainable development is reflected in numerous works of scientists. Therefore, in the work of Galal and Moneim, a mathematical model of nonlinear programming is built, the objective function of which is to maximize the manufacturing enterprise sustainability index, depending on three fundamental factors of sustainable development. The model is developed in order to determine promising directions for ensuring sustainable development of a manufacturing enterprise [29].
Pieloch-Babiarz et al. when studying the influence of macroeconomic indicators on enterprises sustainable development, determines the indicator of microsystem sustainable development by summing three particular standardized indicators corresponding to its factors [30]. At the same time, the authors do not take into account enterprises innovative activities nature, which, in our opinion, is an integral element of industry greening (in particular, through production facilities modernization).
As for cluster analysis as a classification tool, it does not reflect the sequence of distribution of observations into groups, which limits the researcher’s ability to visually select the number of iterations.
The decision tree tool used for mesosystems typology is disclosed in the works of Rutkowski et al. [31], Kuswanto and Mubarok [32], Xu et al. [33], Breiman et al. [34], Apté and Weiss [35], who consistently describe observations segmentation method, based on mathematical functions, in particular, on the calculation of the Gini index. A common modelling tool is the CART algorithm, which is primary in our study [36,37,38]. This method, in comparison with other mathematical tools, allows not only to take into account the influence of several variables on an independent variable in the classification process, but also to observe the sequence, the logic of classification, as well as to fix the intervals of values for each of the selected groups of observations.
Nevertheless, despite the extensive scientific groundwork in the field of sustainable development, in our opinion, there are also methodological gaps such as no standardized methodology for assessing the innovative mesosystems sustainable development (there is only for a macrosystem in the sustainable society index (SSI) format [1]); environmental innovations are not taken into account when assessing the sustainable development of different levels systems; the clustering method prevails to identify the typology of mesosystems, the CART algorithm is poorly applied, allowing clear and consistent observations classification; there is no complex differentiated mechanism for managing innovative mesosystems, that is in turn simultaneously takes into account different classification algorithms. The aforementioned dictates the need to solve the identified shortcomings and to develop methodological tools in the field of ensuring innovative mesosystems sustainable development in industry based on the construction of decision trees.
In addition, the conceptual apparatus needs to be clarified within the semantic aspects of this work. In the scientific literature, the allocation of systems of different levels is presented in the social plane, where microsystems are understood as the closest environment of children, mesosystems are an interconnected set of micro-systems, macrosystems unite larger systems [39]; in the medical plane [40]. From the point of view of economics, we associate systems with the level of management: microsystem—the management system of an individual organization, mesosystem—the management system of the development of a region or an industrial complex, macrosystem—the level of management of the economy of the whole country. By “innovative mesosystem” we mean a set of interconnected microsystems, united on a territorial basis, characterized by socio-economic development level, industry specifics, resource base availability, innovative activity, and investment attractiveness.

2. Materials and Methods

In order to form a representative sample and to develop well-grounded organizational decisions in the framework of industrial development management in Russia, an array of data characterizing the innovative development of mesosystems in industry [41,42] has been collected. The data set includes mesosystems that are distinguished by industrial sector activity, patent activity, innovative activity in environmental safety field, and, in general, meeting the principles of sustainable development (66 observations).
Measures development to ensure industry sustainable development is due to the limitations of mesosystems (strengths and weaknesses), that determined the stages of the study:
  • Innovative mesosystems comparative analysis in industry according to the level of an integral indicator of sustainable development;
  • Innovative mesosystems typology identification in industry in Russia based on sustainable development factors and the author’s system of key performance indicators;
  • Algorithm formation for differentiated priority areas identification for industry innovative mesosystems sustainable development.
The set of indicators relies on the author’s approach specificity, focused on innovative and sustainable development comprehensive assessment of Russian industry mesosystems. The methodology is based on the geometric mean calculation, that is influenced by different factors dimensionality and the greater clarity of sustainable development factors comparison.
The integral indicator of innovative mesosystems sustainable development in industry (ISDI) is adopted as a dependent variable (target), the calculation method of which is based on the geometric mean and is described by the Formula (1):
I S D I = I e c o n × I s o c × I e c o l 3 ,
where Iecon is an economic factor for innovative mesosystems sustainable development in industry, Isoc is a social factor, Iecol is an environmental factor:
I e c o n = V e n t × V R O A × V p a t 3 , I s o c = V I n P e r s × V P e r s 2 , I e c o l = V E n v I n × V r e c × V neutr 3 ,
where Vent is the share of manufacturing enterprises with a high carbon footprint,%; VROA is return of manufacturing industries assets in the mesosystem,%; Vpat is the patent applications quality index; VInPers is the personnel number index engaged in research and development, referred to the average personnel number in Russia (the absolute NInPers personnel indicator number, thousand people, is used to construct classification trees); VPers is the share of people employed in manufacturing from the total number of people employed,%; VEnvIn is share of organizations implementing environmental innovations,%; Vrec is volume of circulating and consistently index of used water in the mesosystem, referred to the average volume in Russia; Vneutr is the share of captured and neutralized air pollutants in the total amount of waste pollutants from stationary sources in the mesosystem,%.
The Vent indicator covers the manufacturing industries with environment highest negative impact and reflects the share of regional enterprises operating in the production of coke and petroleum products (720.6 thousand tons of pollutant emissions into the atmosphere), chemicals and medicines (364.7 thousand tons), metallurgical production (3696.1 thousand tons) and the production of non-metallic mineral products (382.4 thousand tons).
Patent applications Vpat quality index is defined as the ratio of issued patents number to the number of filed patent applications, Formula (3):
V p a t = N c l a i m s N p a t . i s . ,
where Nclaims is the number of claims for patents, units; Npat.is.—patents issued, units.
When calculating organizations share that carried out environmental innovations, VEnvIn method of calculating the average harmonic is applied, the choice of which is due to mesosystem specifics in terms of all or some types of environmental innovations implementation. In this regard, the Formula (4) is applied:
V E n v I n = n i = 1 n 1 d ,
where n is the innovations type that improve environmental safety in production of goods, works, services (reduction of material costs, energy consumption for production, carbon dioxide emissions, transition to safe or less hazardous types of raw materials and materials, environmental pollution reduction, recycling of waste production and resources, conservation and reproduction of natural resources used by agriculture); d is the share of organizations in mesosystem that carried out the n-th type of environmental innovation.
In order to identify the specifics of innovative mesosystems sustainable development in Russian industrial production, a simple two-dimensional histogram of the ISDI frequency distribution is used, and a normal distribution density law is set.
The regression construction and classification trees are based on the CART algorithm, applied for classification tree construction, based on the Gini index [31,32,33,34] and the data array t that is determined by the Formula (5):
G i n i t = 1 i = 1 n p i 2 ,
where n is the number of classes, p is the probability that observations belong to the i-th class.
When dividing the data array t into two classes (t1 and t2) with the corresponding set of observations (N1 and N2), the Gini index represents the data set t uncertainty degree and is determined by the Formula (6):
G i n i s p l i t t = N 1 N G i n i t 1 + N 2 N G i n i t 2 .
The higher the Gini index Ginisplit(t) value, the higher the degree of uncertainty in data selection. In this regard, the minimum value of the Gini index Ginisplit(t) determines the choice of partitioning the array into t1 and t2.
When constructing a regression tree, mathematical data processing is based on identifying the correlation between the dependent continuous variable Y and the independent variables X, i.e., dataset (training sample) t has the form (7):
t = Y 1 ,   X 1 , Y 2 ,   X 2 Y N ,   X N .
The input data set is training, it is recursively divided into two groups, and then the output value is determined for each of regression tree two branches. Regression estimation is carried out according to the Formula (8):
f ^ = 1 N × i = 1 N Y i × I t X ,
where N is the number of observations (the number of innovative mesosystems), It is a function of space that describes the entry of observation Xi into the space ti, belonging to a particular class and that is described by Expression (9):
t 1 = X i t : X i a , t 2 = X i t : X i > a ,
where a is the segmentation point for the Xi variable.
As a result of dividing the input data array into two classes, the regression estimate will take the form (10):
f ^ X = 1 N 1 × I 1 Y i × I t 1 X + 1 N 2 × I 2 Y i × I t 2 X ,
where I1 and I2 are t1 and t2 spaces functions, respectively; N1 and N2 are the observations numbers in the space t1 and t2, respectively.
The estimation of the distribution quality of observations is carried out by minimizing squares sum of the differences method, and the choice of the tree branch is based on the calculation of the root-mean-square error σ2, which has the form (11):
σ 2 = 1 N × i = 1 N Y i f ^ X i 2 m i n .
When constructing classification and regression trees, the tools of the Statistica software package are used: data mining—general classification/regression tree models and data mining—interactive trees (C&RT, CHAID). The calculations of sustainable development indicators, as well as specific indicators, are carried out in the Microsoft Excel environment.

3. Results

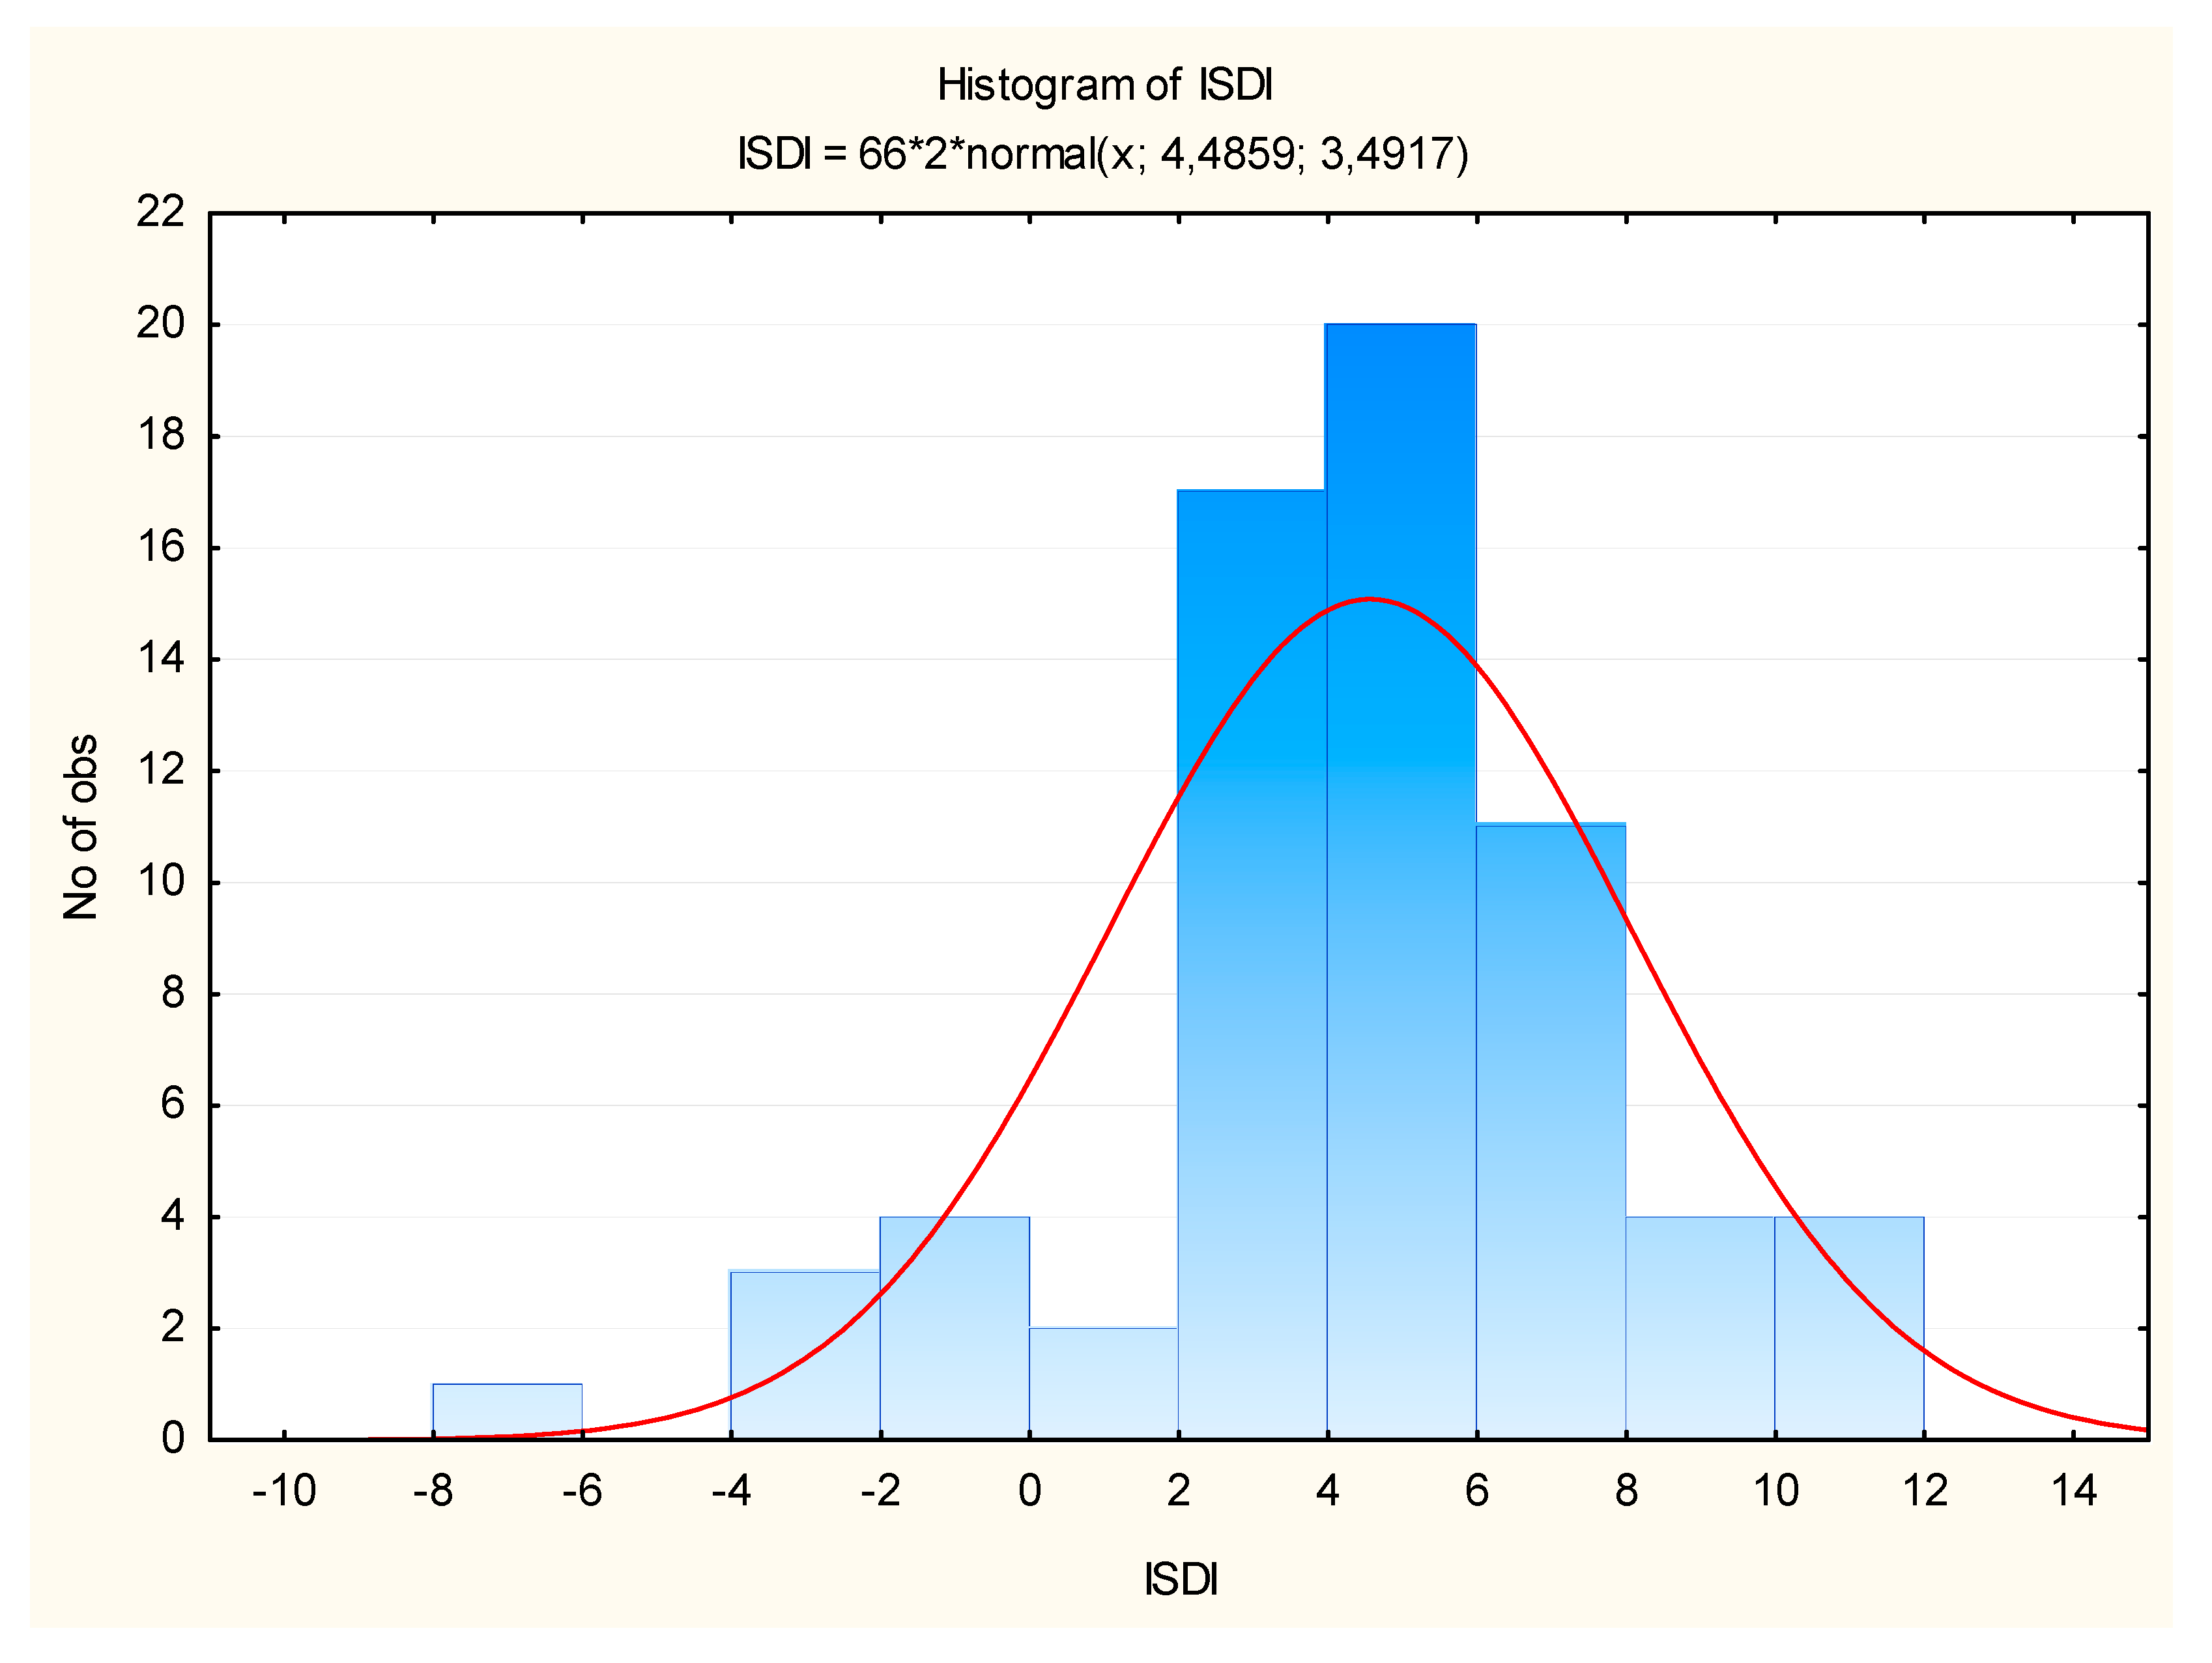
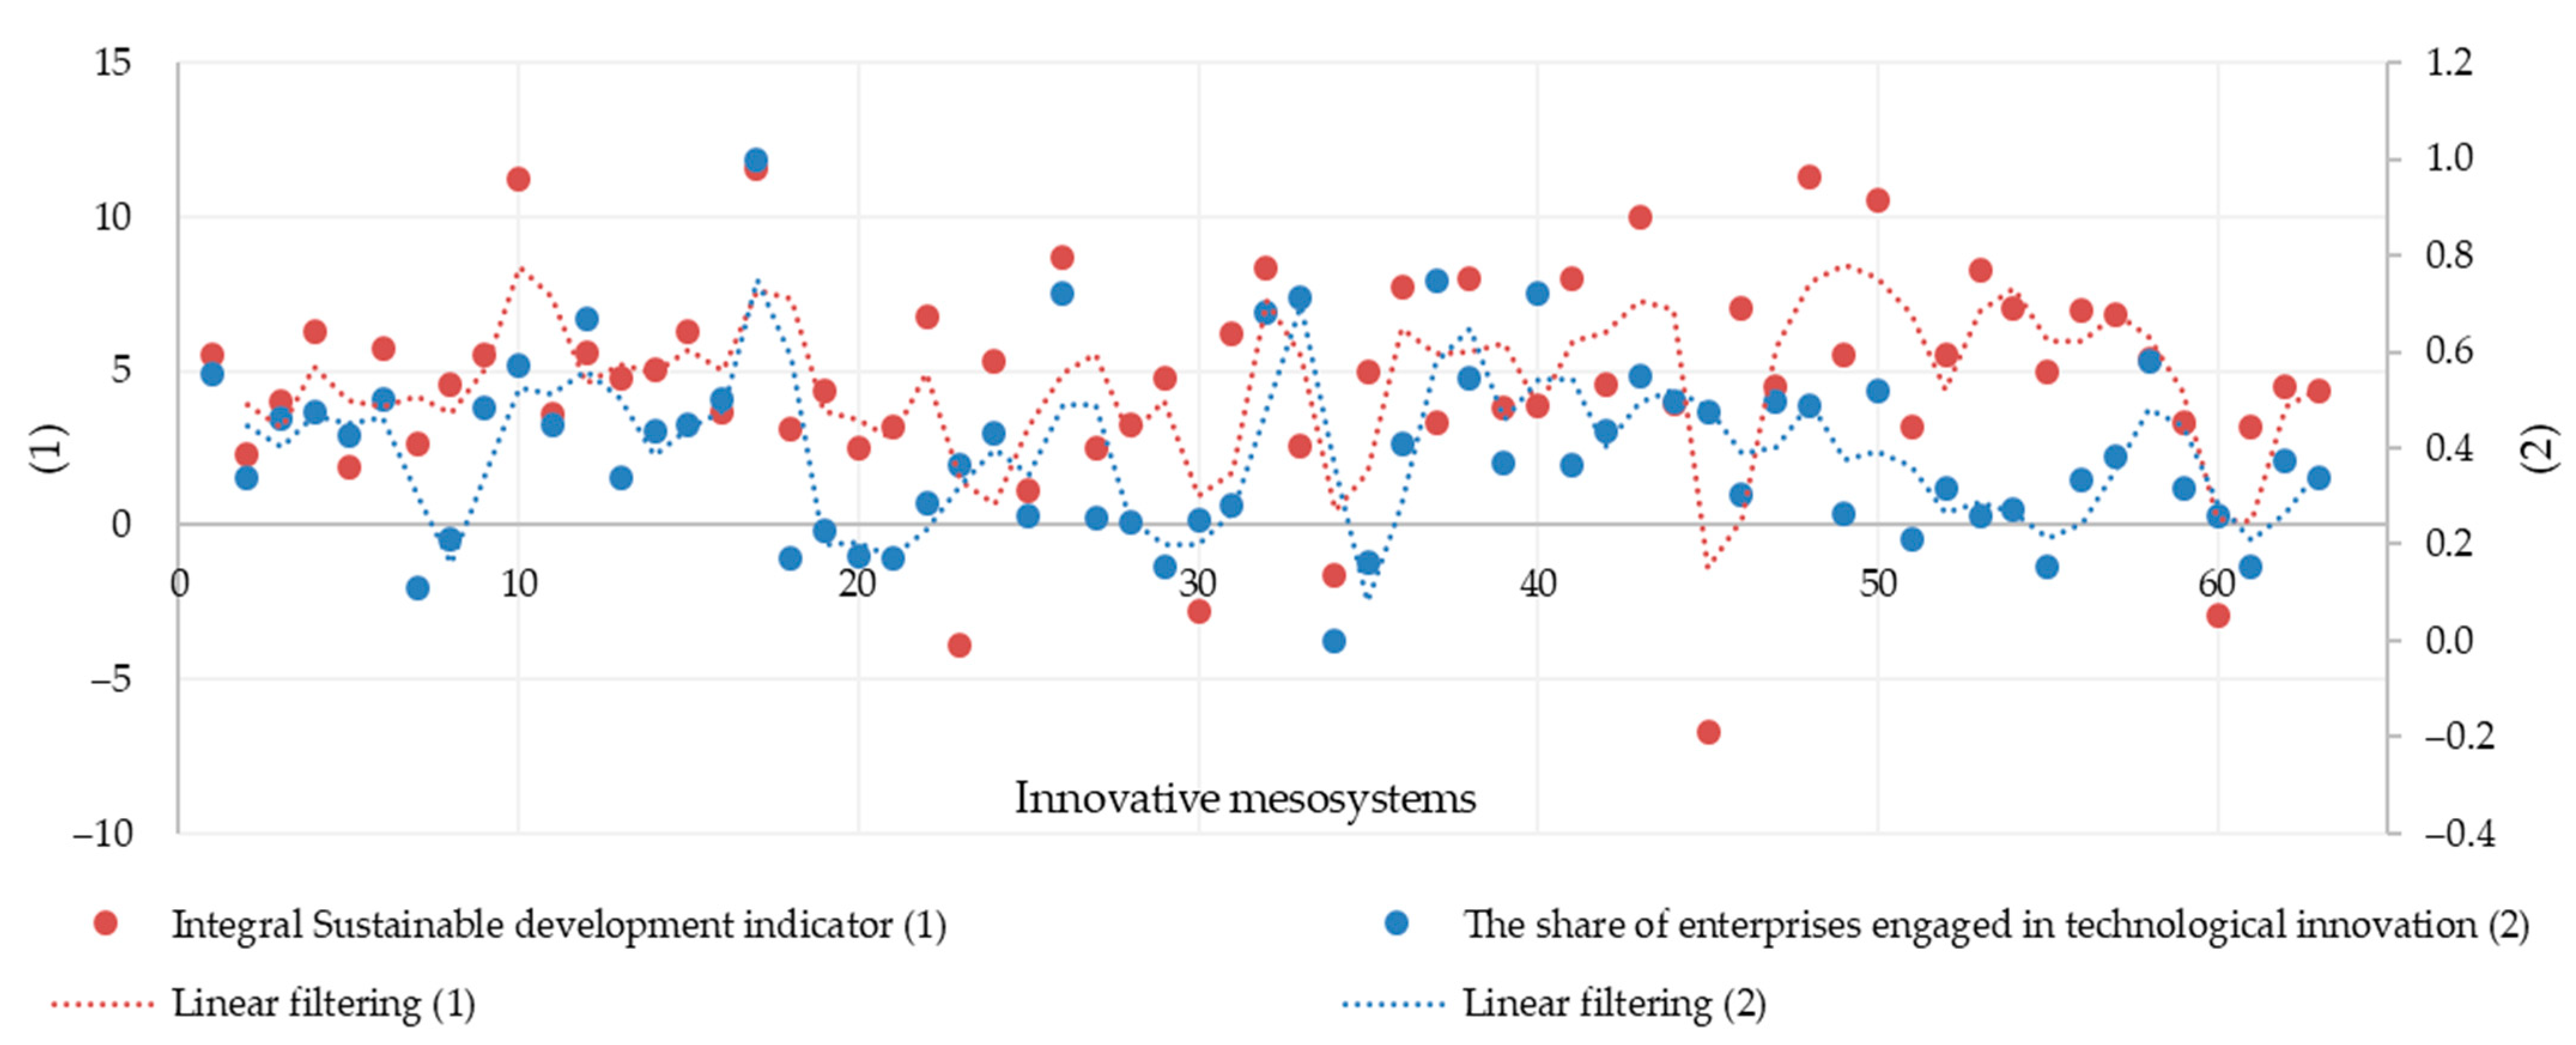
3.1. Patterns of Innovative Mesosystems Development in Industry in Russia

The author’s use of methodology makes it possible to give a numerical assessment of industry factors innovative mesosystems sustainable development (Table 1). A number of values are negative due to negative return on assets. We deliberately do not resort to transforming negative values in order to focus on the most problematic mesosystems with their innovative and industrial activity.
The presented data set is characterized by the following statistical indicators:
  • The maximum value is 11.55 (Moscow city);
  • Minimum value—−6.71 (Samara Region);
  • Sample variance—11.76;
  • Standard error—3.43;
  • Arithmetic middling is 4.7;
  • Asymmetric property—−0.75;
  • Mode—5.56;
  • Median—4.79.
An analytical study of innovative mesosystems sustainable development data array factors in industry in Russia and the integral indicator of their sustainable development at the first stage is carried out by constructing a simple two-dimensional histogram of the ISDI frequency distribution (Figure 1). Indicator uniform intervals are set with a step equal to 2. A total 10 ranges are obtained, indicating high spread of the indicator and uneven innovative mesosystems sustainable development. The resulting distribution often makes it possible to identify the following patterns of development:
  • In total, 19 mesosystems or 29% of observations (ISDI ∈ (6; 12)) have high ISDI values, mainly due to high number of researchers or good environmental conditions, allowing us to judge the environmental and social responsibility of industrial enterprises and industrial regions of Russia.
  • Further, 37 mesosystems or 56% of observations (ISDI ∈ (2; 6)) prevail in terms of innovations development in industry from the standpoint of environmental safety; this category prevails in terms of observations share;
  • In addition, 10 mesosystems or 15% of observations (ISDI ∈ (−8; 2)) are characterized by a low or even negative index value, which is primarily due to ineffective asset management, which in the case of high wear and tear of equipment has negative impact not only on industrial products quality, but also on the environment quality.
The proposed methodology has no analogues in the “arsenal” of the Federal State Statistics Service. At the same time, within the framework of the study, the quality of the proposed methodological solution was assessed by comparing the calculated values with the values of the indicator reflecting the share of organizations that carried out technological innovations in the mesosystem (the choice in favor of this indicator as a base for comparison is due to the object of the study—innovative mesosystems). The indicators are normalized by the minimax method according to Formula (12):
x n o r m = x i x m i n x m a x x m i n .
As a result of assessing the quality of the author’s methodology, a graph of deviations of the obtained values of the integral indicator of the sustainable development of innovative mesosystems in industry from the values of the share of organizations implementing technological innovations in the mesosystem (Figure 2) is constructed. The graph shows a certain coincidence of patterns, as evidenced by the accuracy estimate of the model, based on the calculation of the standard deviation and equal to 61%. We emphasize that the proposed author’s methodology is unique, and currently there is no statistical basis for an integrated assessment of the sustainable development of systems at different levels.
The identified patterns of development confirm the need to develop a differentiated approach for ensuring and supporting the innovative mesosystems sustainable development, in particular, taking into account their industry specifics, since regions with a high volume of metallurgical production, oil, gas and metal ore production experience the greatest pressure on the environment (Tyumen Region, Kemerovo Region, Krasnoyarsk Territory, Sverdlovsk Region, etc.).

3.2. Multi-Criteria and Variable Typology of Innovative Mesosystems in Industry in Russia

The level of sustainable development (ISDI) integral indicator is selected as a dependent variable.
The mesosystem decision tree method is applied in two variations such as classification and regression trees, the fundamental difference of which is that in the first case, discrete forecasting takes place (a terminal node (leaf) is a class of observations corresponding to a node), in the second case, continuous forecasting (terminal node is the modal interval of the dependent variable).
For the purpose of constructing a classification tree, the ISDI dependent variable is reflected as a categorical one, having the values “high” or “low” level of sustainable development integral indicator of the innovative mesosystem:
«high», if Integral SDI ≥ 5,
«low», if Integral SDI < 5.
The classification tree is built in two versions. At the first stage, aggregated factors of sustainable development were used as classification criteria, and at the second stage, private indicators of innovative mesosystems were used. Such a dual approach allows a comprehensive approach to the development of strategic solutions that ensure the transition of the studied objects to sustainable development.
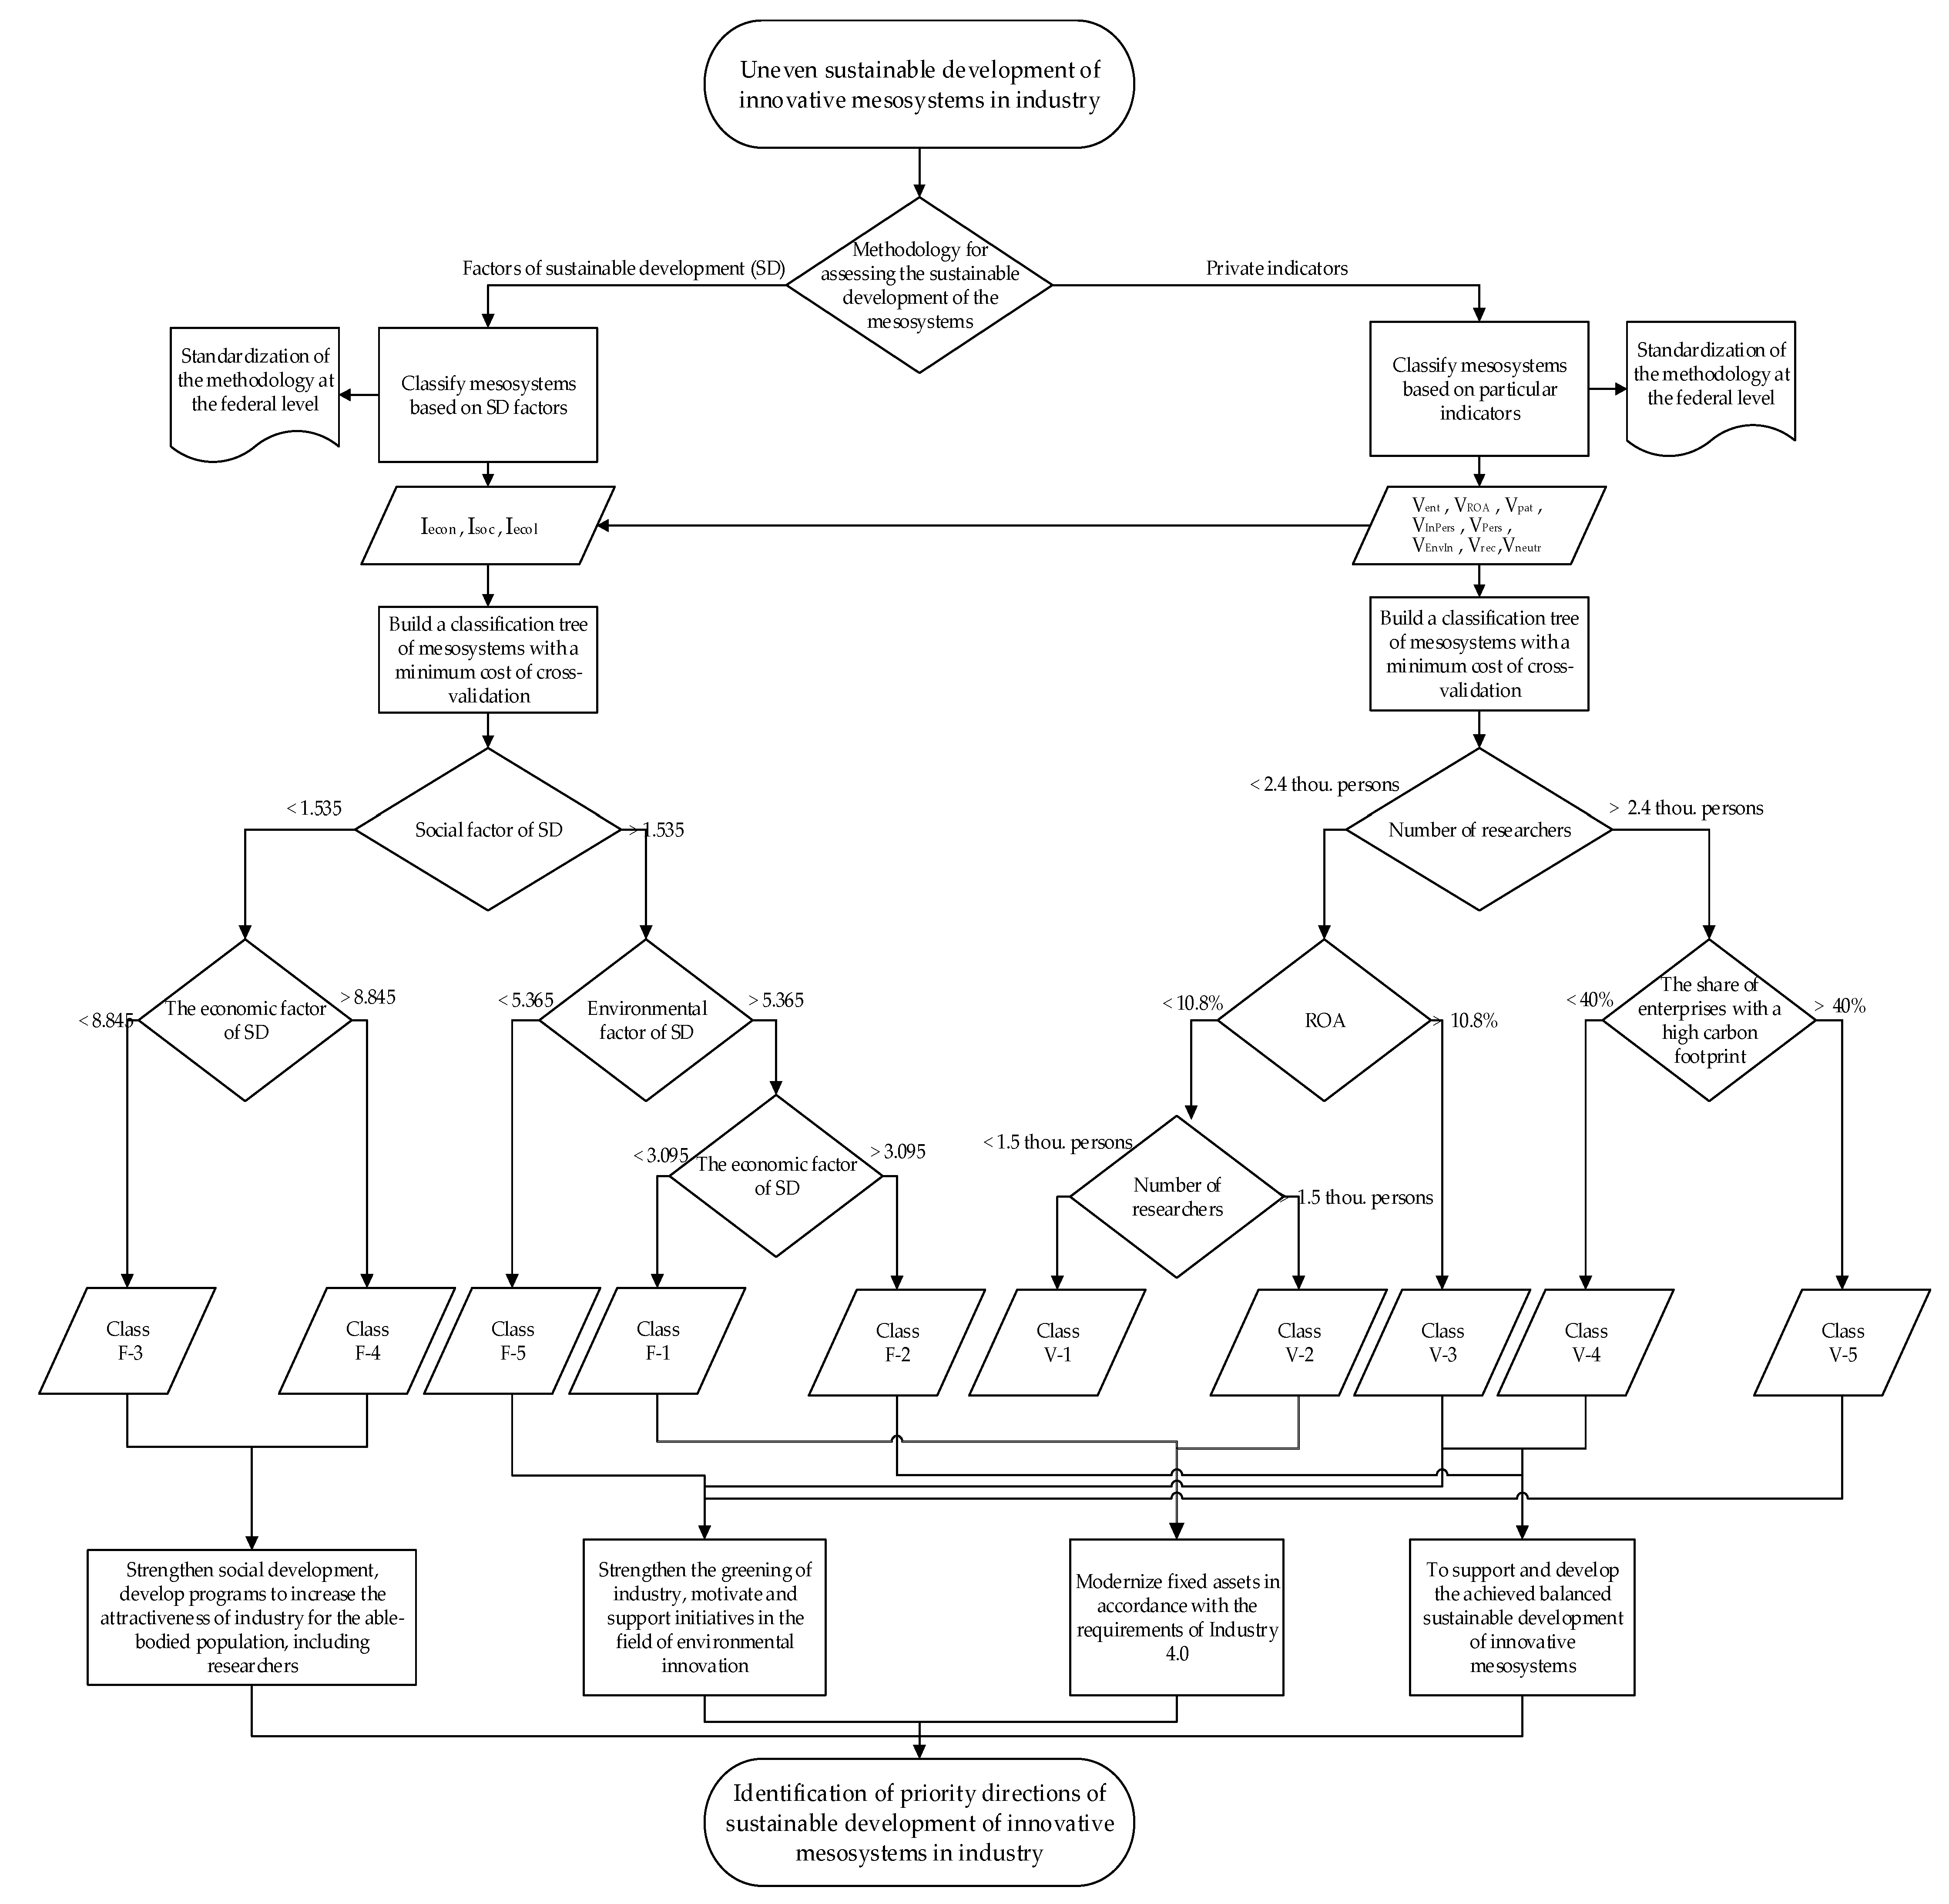
  • In the first version, the categorical independent variables are the factors of sustainable development calculated by the author’s method—economic, social, environmental (Figure 3). Out of the four alternatives, a tree with the lowest cross-validation cost of 0.12 is selected, with five terminal nodes (red blocks), four decision nodes (blue blocks), and nine nodes (ID). Terminal vertices imply the absence of further decision-making, which was taken as the final version of the mesosystem classification in this version. Each node is characterized by the number of innovative mesosystems covered. The evaluation of the significance of the input independent variables calculated in the Statistica program allows us to summarize the greatest importance of the economic factor in the classification of observations (significance is 1), and the lesser importance of the environmental (significance is 0.9) and social (significance is 0.57) factors of the sustainable development of innovative mesosystems.
The algorithm and segmentation rules in mathematical expression for observations t have the form (14):
t I D = 2 = X i t : I s o c 1.535 , t I D = 3 = X i t : I s o c > 1.535 , t I D = 4 = X i t : I e c o n 8.845 , t I D = 5 = X i t : I e c o n > 8.845 , t I D = 6 = X i t : I e c o l 5.365 , t I D = 7 = X i t : I e c o l > 5.365 , t I D = 8 = X i t : I e c o n 3.095 , t I D = 9 = X i t : I e c o n > 3.095 .
The root of the tree (ID = 1) reflects the predominance of mesosystems with high level of sustainable development integral indicator. As a result of the first iteration, 66 studied mesosystems are classified according to the level of the social factor of sustainable development into two classes—below and above 1.535, respectively; 59% of mesosystems (39 regions) have relatively high level of innovation system social development. Sustainable development and ESG initiatives are based on the principle of environmental friendliness, and, according to node ID = 7, the industry of more than half of the mesosystems is actively developing in the environmental plane (34 regions). The most important predictor, the economic factor, contributed to innovative mesosystems differentiation:
  • Category F-1 (three mesosystems: Krasnodar Territory, Samara Region and Primorsky Territory)—relatively low level of sustainable development, ecological bias of industrial development, high social factor influence, but low economic development—Iecon ≤ 3.095 (ID = 8);
  • Category F-2 (31 mesosystems: Moscow and the Moscow region, St. Petersburg, the Republic of Tatarstan, the Republic of Bashkortostan, the Novosibirsk region, etc.)—relatively high level of sustainable development, greening of industry, high influence of the social factor, moderate economic development—Iecon > 3.095 (ID = 9);
  • Category F-3 (25 mesosystems: Bryansk Region, Arkhangelsk Region, Kaliningrad Region, etc.)—relatively low level of sustainable development, mostly weak environmentalization of industry, low influence of the social factor, notable economic development—Iecon ≤ 8.845 (ID = 4);
  • Category F-4 (two mesosystems: the Republic of Khakassia and Lipetsk region)—relatively high level of sustainable development, ecologization of industry, low influence of the social factor, high economic development—Iecon ≥ 8.845 (ID = 5);
  • Category F-5 (five mesosystems: Vladimir region, Yaroslavl region, Udmurt Republic, Chuvash Republic, Penza region)—relatively low level of sustainable development, weak emphasis on greening industry, high influence of social factor, noticeable economic development—Iecon ≤ 8.845 (ID = 6).
2.
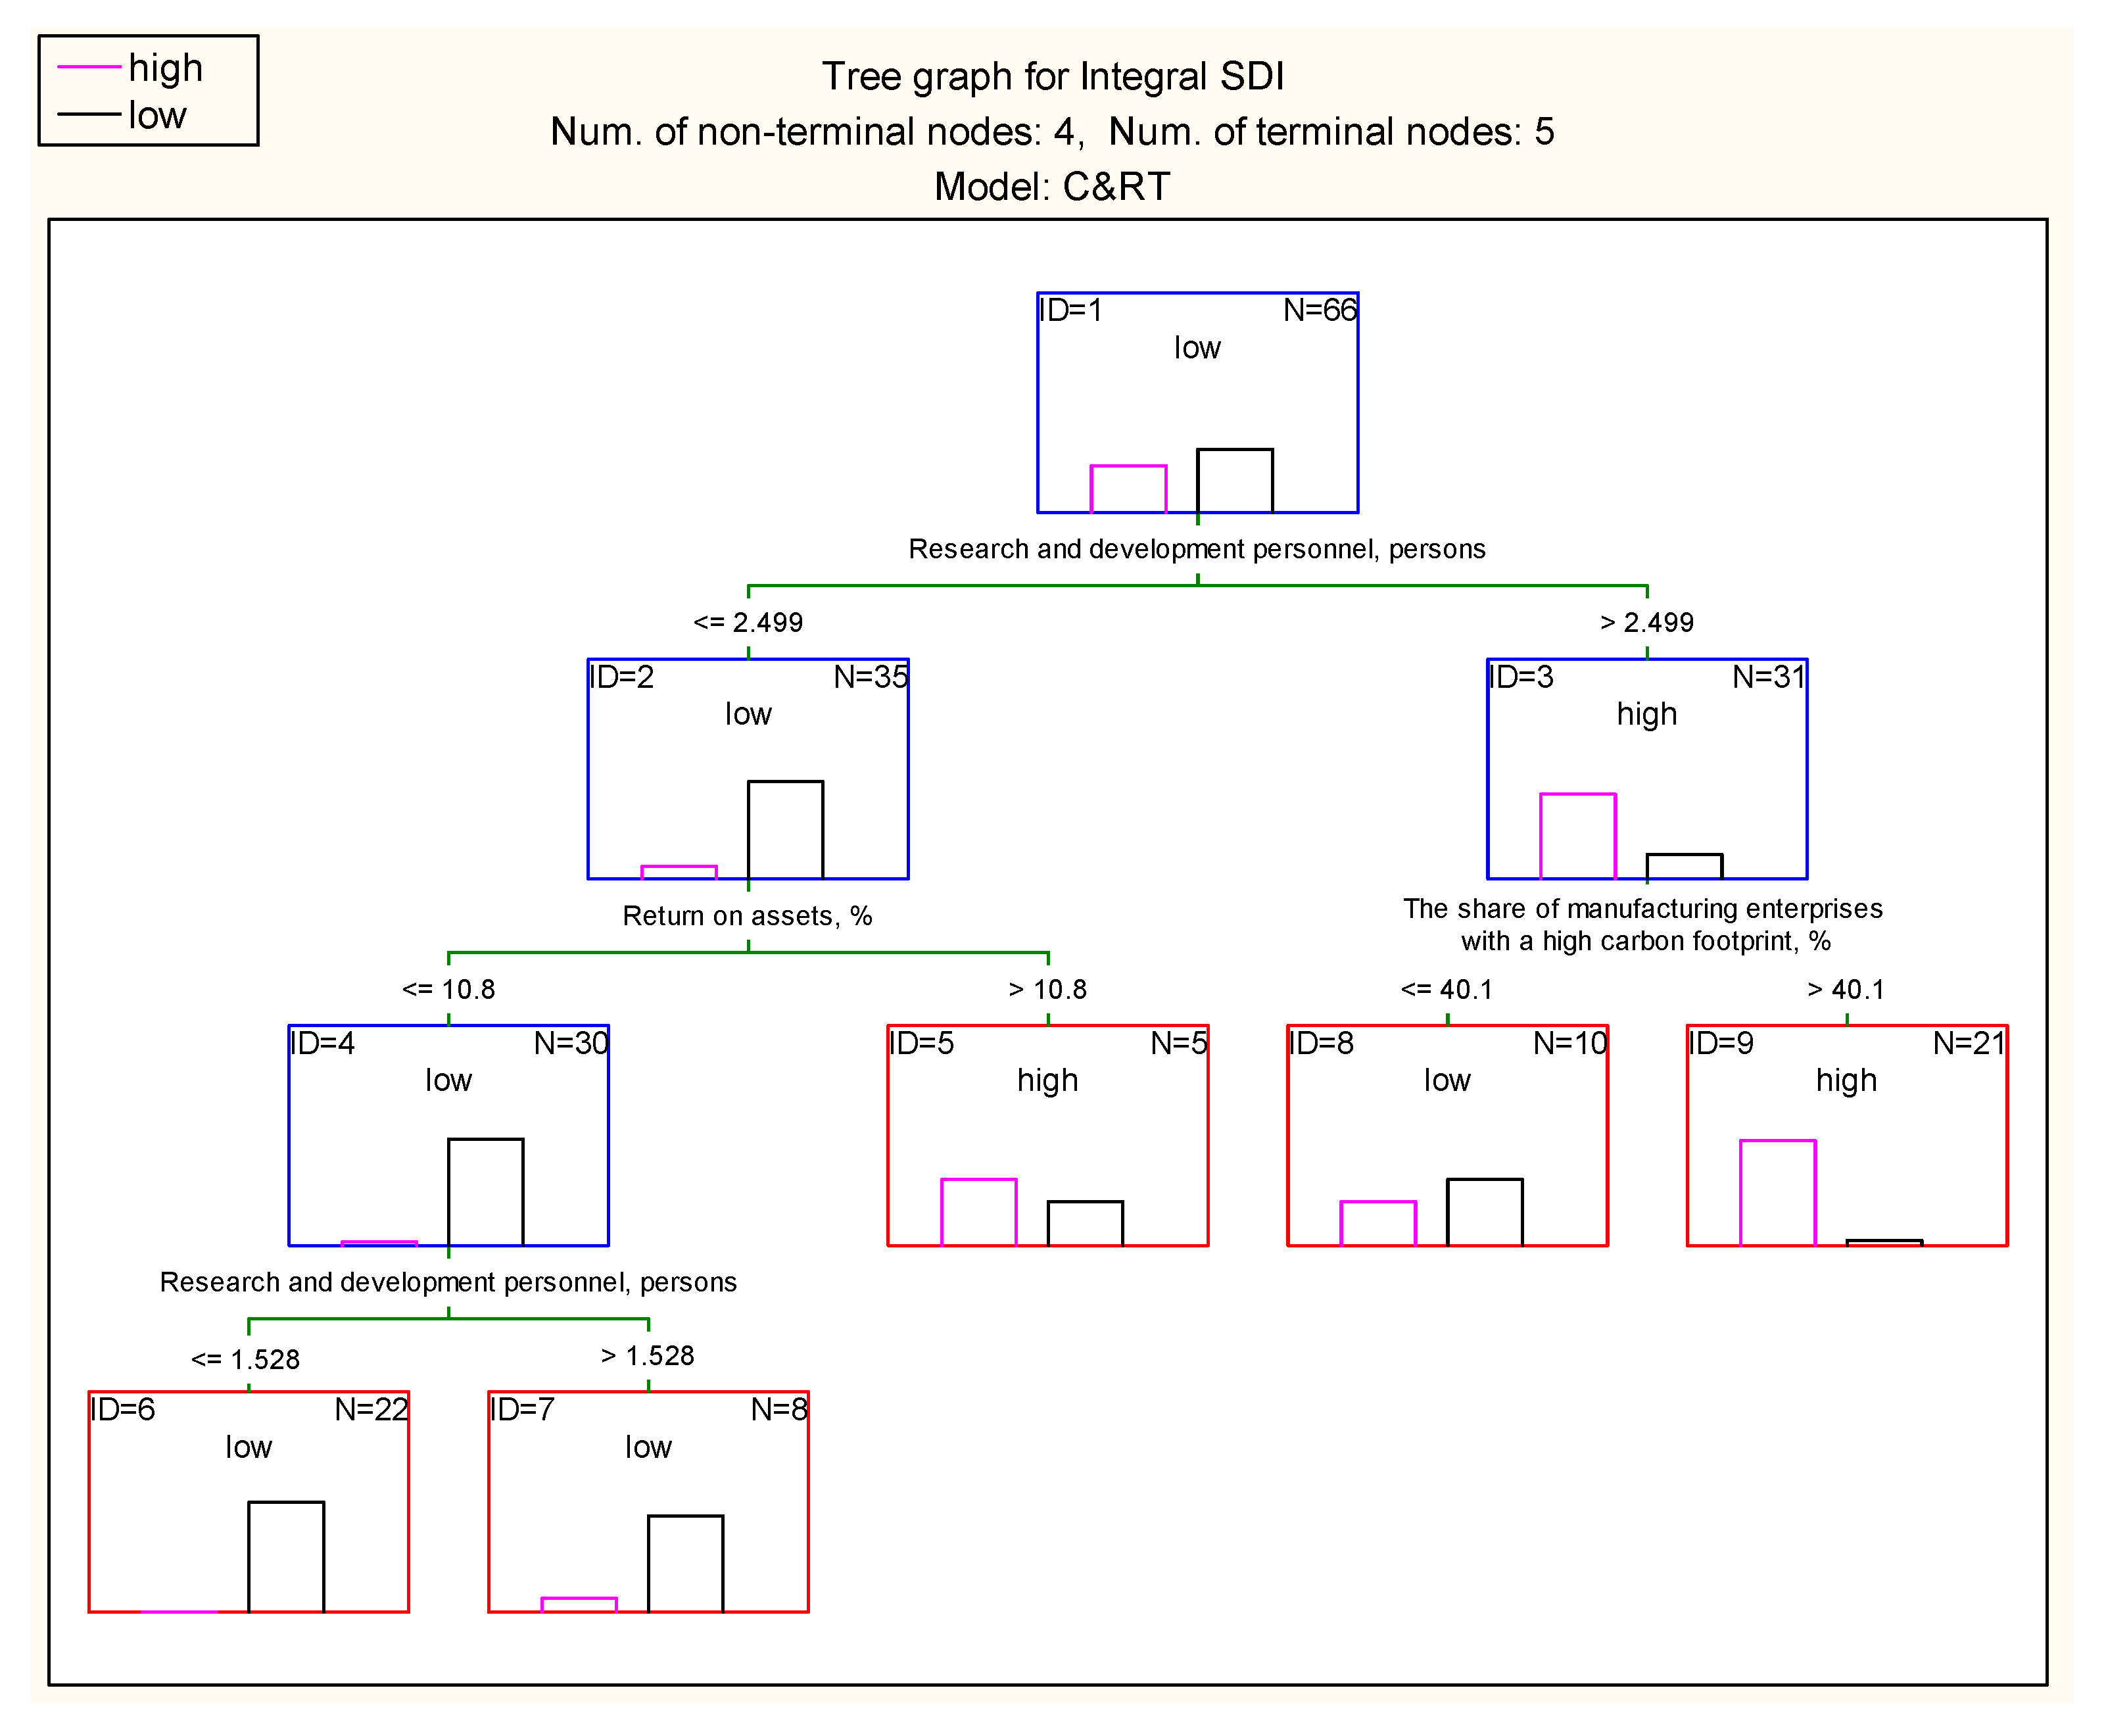
The second version of the classification tree included in the array of independent variables private indicators of innovative mesosystems development, which are most highly correlated with the dependent variable ISDI (Figure 4).
In this case, the key classification criterion is the social factor, namely, the number of researchers of the innovative mesosystem (the predictor value is 1), followed by the return on assets (the significance was 0.93) and the share of manufacturing enterprises with a high carbon footprint (the significance was 0.87). This tree is characterized by the same number of nodes.
The segmentation algorithm for observations t has the form (15):
t I D = 2 = X i t : N I n P e r s 2.499 , t I D = 3 = X i t : N I n P e r s > 2.499 , t I D = 4 = X i t : V R O A 10.8 , t I D = 5 = X i t : V R O A > 10.8 , t I D = 6 = X i t : N I n P e r s 1.528 , t I D = 7 = X i t : N I n P e r s > 1.528 , t I D = 8 = X i t : V e n t 40.1 , t I D = 9 = X i t : V e n t > 40.1 .
In the first step, 66 mesosystems are classified by the number of R&D personnel; at the second step, depending on the size of the population, the monitored objects are subdivided into groups with high and moderate return on assets or into groups with a high and moderate share of enterprises that pollute the environment most intensively. According to the resulting decision tree, there are five types of innovative mesosystems in Russian industry:
  • Category V-1 (22 mesosystems)—relatively low level of sustainable development, moderate return on assets (VROA ≤ 10.8%), the number of researchers—VInPers ≤ 1.528 thousand people (ID = 6);
  • Category V-2 (eight mesosystems)—relatively low level of sustainable development, moderate return on assets (VROA ≤ 10.8%), the number of researchers—1.528 < VInPers ≤ 2.499 thousand people (ID = 7);
  • Category V-3 (five mesosystems)—relatively high level of sustainable development, high return on assets (VROA > 10.8%), the number of researchers VInPers ≤ 2.499 thousand people (ID = 5);
  • Category V-4 (10 mesosystems)—relatively low level of sustainable development, moderate environmental pollution by manufacturing industries (Vent ≤ 40.1%), the number of researchers VInPers > 2.499 thousand people (ID = 8);
  • Category V-5 (21 mesosystems)—relatively high level of sustainable development, intensive environmental pollution by manufacturing industries (Vent > 40.1%), the number of researchers VInPers > 2.499 thousand people (ID = 9).
In general, the results of this classification indicate the prevalence of mesosystems with a low level of sustainable development—40 observed objects (61%).
The results obtained in the form of decision trees and the revealed patterns formed the basis for the formation of an algorithm for the differentiated identification of priority areas for sustainable development of innovative mesosystems in the Russian industry (Figure 5). The proposed algorithm is an integrated approach to the formation of an effective toolkit for managing the development of industrial mesosystems: on the one hand, it is a multifactorial (multicomponent) approach; on the other hand, it covers key management subsystems—asset management, human resources, R&D, resource consumption, and environmental safety. The developed methodology is characterized by the potential to optimize resources, their concentration on problem areas of the industrial system, and to reduce the risks of irrational planning within a single mesosystem.
The implementation of an alternative method of mesosystem typology is based on continuous forecasting. If, in the case of the classification tree, we ranged between the two states of the objective function—the integral indicator of sustainable development low and high levels, in the case of the regression tree, the leaves (red blocks) contain information about the interval of specific values of the objective function (Figure 6). Obviously, the most significant criterion for mesosystems classification is the number of researchers (importance equal to one), approximately equal importance is revealed according to the criteria of return on assets (0.73) and the share of enterprises that intensively pollute the environment as a result of production activity (0.7).
According to the results of the fourth iteration, four classes of innovative mesosystems in industry are identified on the regression tree—blocks ID = 6, 7, 12, 13 (Table 2):
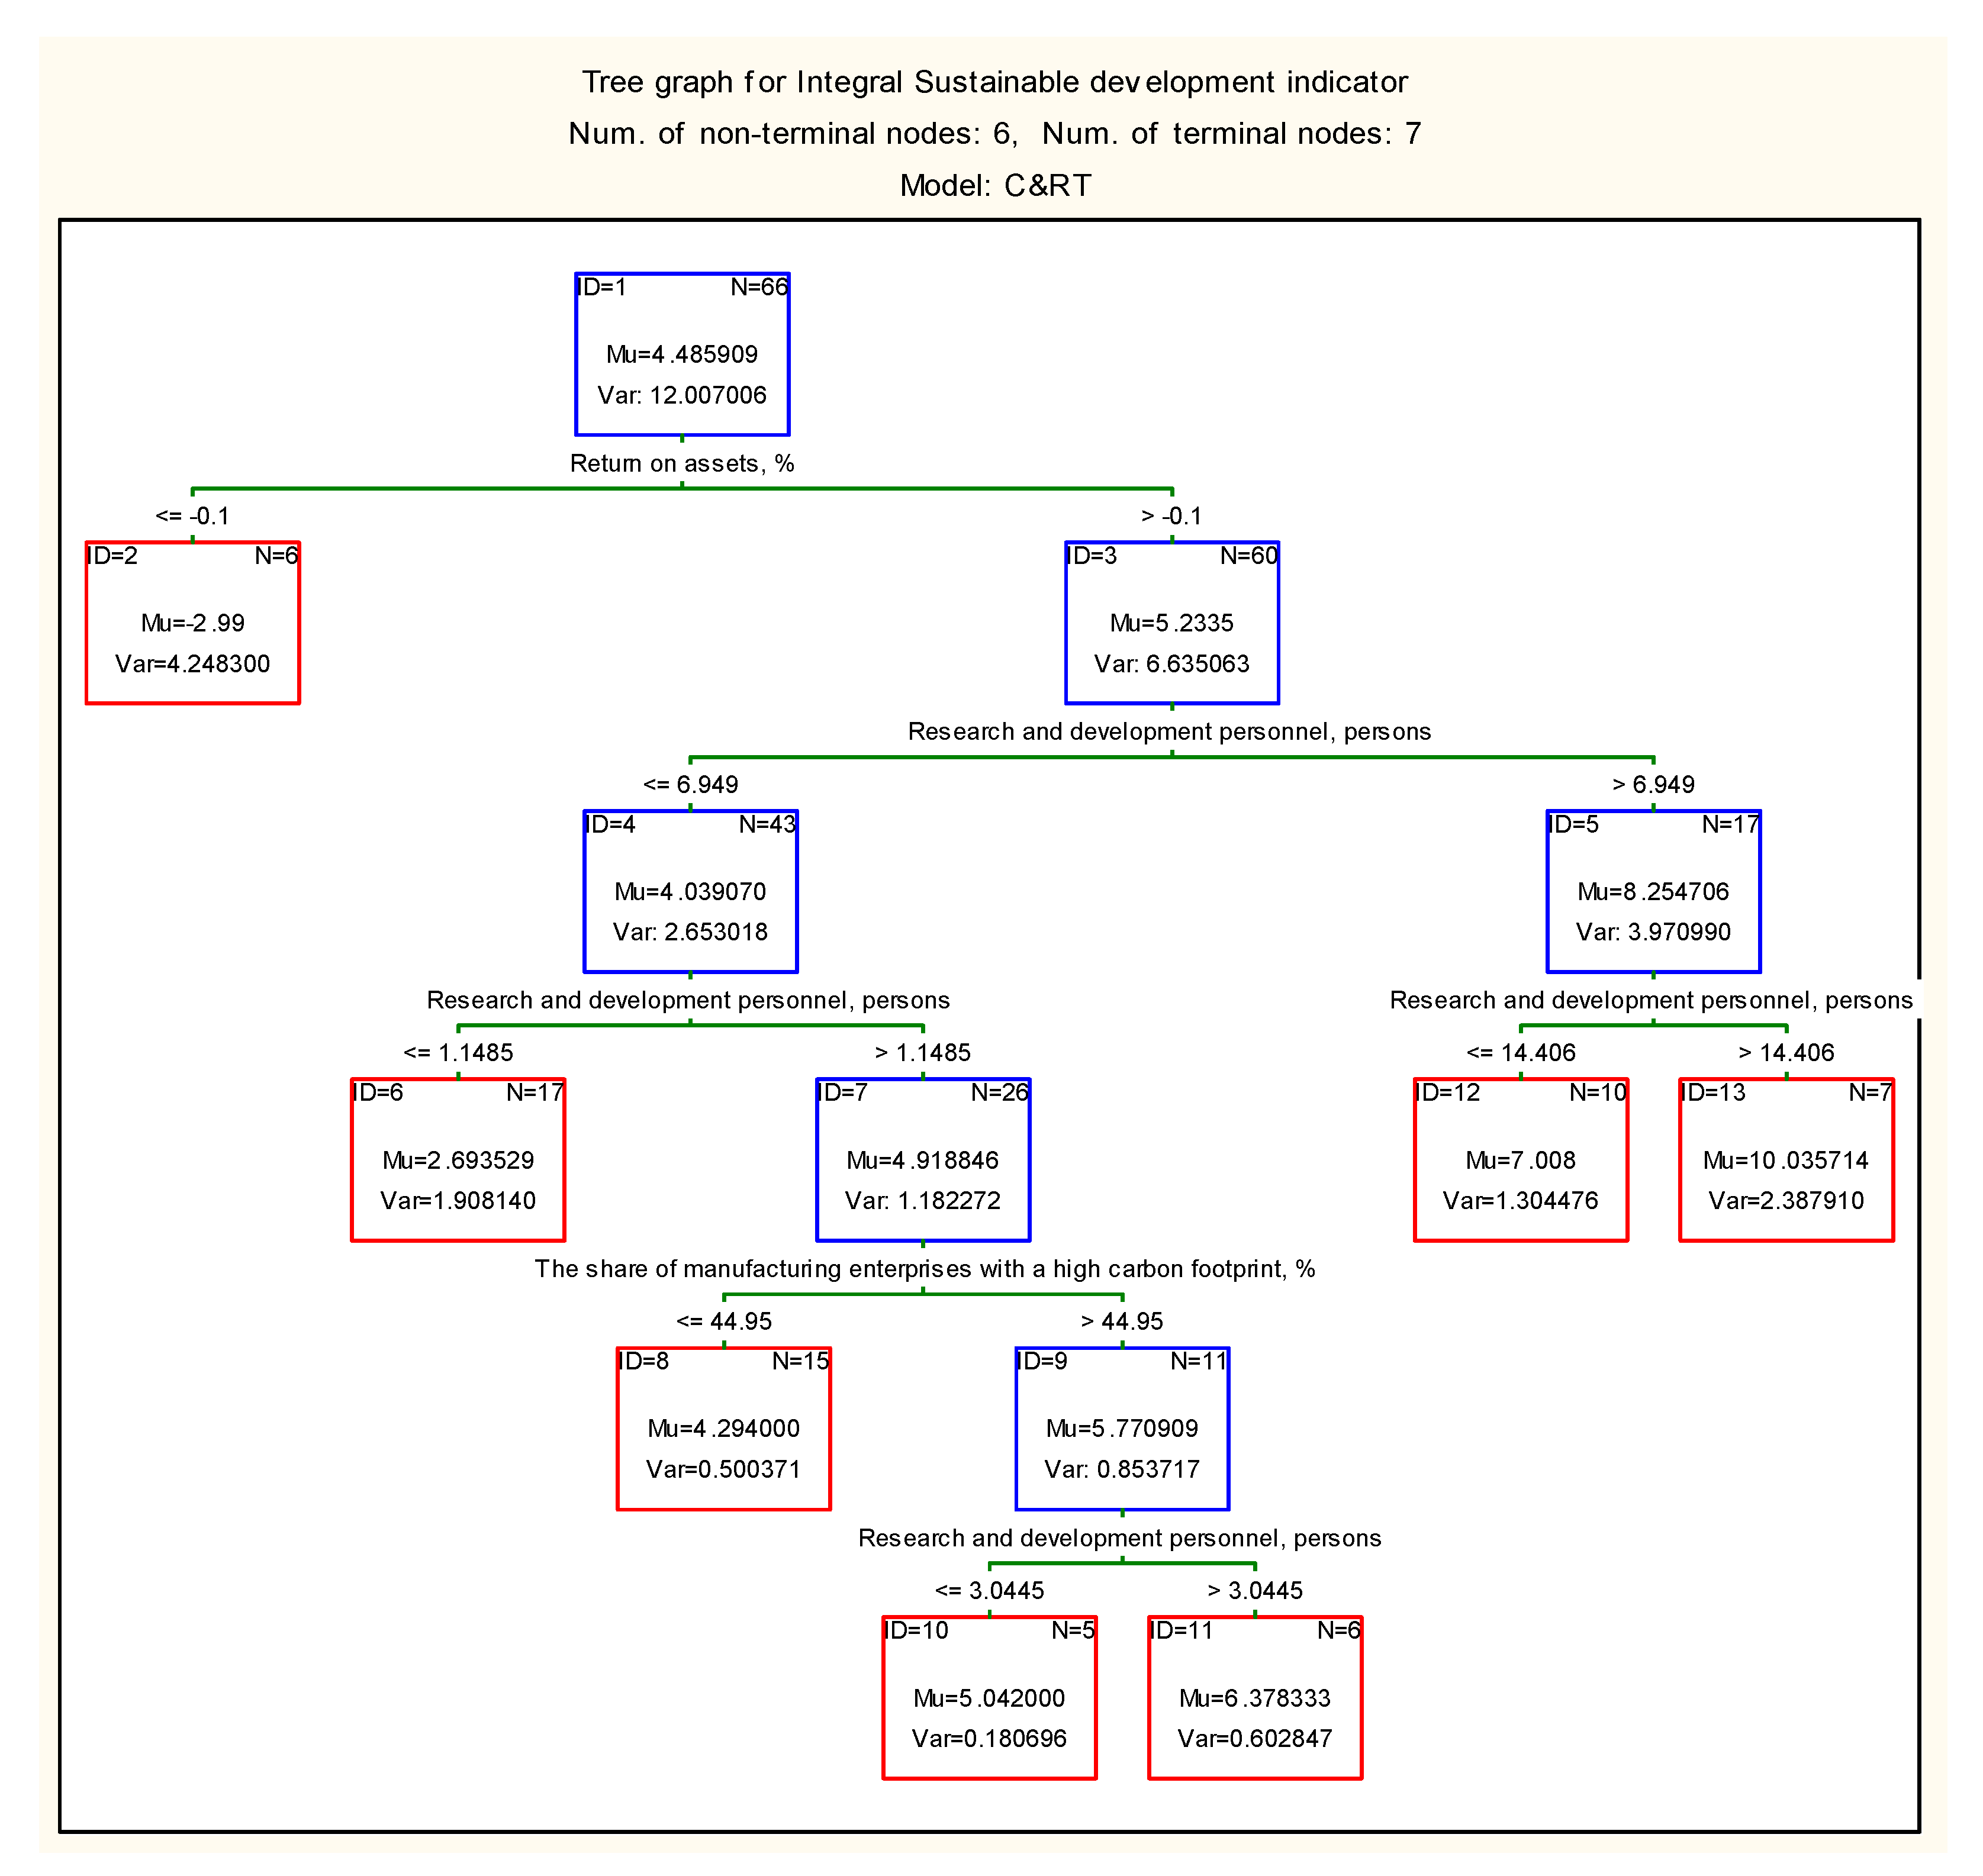
  • Mesosystems of the R-1 class (17 objects) are characterized by relatively low level of sustainable development, the average ISDI value for the class is 2.69; low number of personnel engaged in research and development (less than 1.15 thousand people);
  • Mesosystems of the R-2 class (26 objects)—the most numerous groups of observations, with moderate level of sustainable development; the number of researchers is limited by the interval VInPers ∈ (1.15; 6.95];
  • Mesosystems of Class R-3 (10 objects: Voronezh Region, Kaluga Region, Leningrad Region, Rostov Region, Republic of Bashkortostan, Republic of Tatarstan, Perm Territory, Tyumen Region, Krasnoyarsk Territory, Tomsk Region)—a small group of observations, noticeable level sustainable development; the number of researchers is limited by the interval VInPers ∈ (6.95; 14.41];
  • Mesosystems of Class R-4 (seven objects: Moscow Region, Moscow city, Sankt-Petersburg city, Nizhny Novgorod Region, Sverdlovsk Region, Chelyabinsk Region, Novosibirsk Region)—a small group with high level of sustainable development and high number of research personnel (more 14.41 thousand people).
Thus, mesosystems of Classes 1 and 2 are more in need of the development of a set of measures capable of reducing the separation from mesosystems of Class 4. These measures include:
  • Stimulation of scientific research in the field of ensuring environmental safety (primarily material);
  • Stimulation of production facilities modernization, financial support, easing of the taxation system, acceptable terms of lending to industrial enterprises;
  • Increasing the investment attractiveness of mesosystems, etc.
In general, the presented approaches to the typology of innovative mesosystems in industry make it possible to summarize the prevalence of objects with a low level of sustainable development integral indicator, which determines the importance of a differentiated approach to stimulating the mesosystems sustainable development.

4. Discussion

As noted earlier, the issue of sustainable development is particularly relevant, as evidenced by the vast array of research projects. In particular, the methodology for assessing the sustainable development systems level, fixed for assessing macrosystems [1], has been widely developed, but there is no standardized methodology for micro- and mesosystems. We believe that the existing methodological solutions [22,23,24,25,26,27] are highly specialized. A capacious methodology with the use of factor analysis is presented in [26], nevertheless, particular indicators factor loads for assessing sustainable development are calculated without aggregation into a complex indicator.
The solutions we offer are distinguished by taking into account the synergy of innovation and environmental components in the format of environmental innovations, since only in this case a breakthrough in ensuring country’s sustainable development of industry is possible. In this work, we develop a methodology for assessing sustainable development in the mathematical plane, using the toolkit of decision trees for the typology of innovative mesosystems in industry, which is also based on calculating the integral indicator of sustainable development using the geometric mean method.
The use of the CART algorithm in order to build classification and regression trees is based on the calculation of the Gini index, segmentation of the original data set (training sample) into two sets of observations, the use of a recursive function and regression estimation. The choice in favor of this mathematical tool is due to the possibility of simultaneously, taking into account a number of the most important indicators and visibility in the sequential classification of observations, which fundamentally distinguishes it from cluster analysis.
As a result of the research, the following scientific results are obtained.
  • A unique methodology for assessing the innovative mesosystems sustainable development (ISDI), that takes into account all three factors of sustainable development (economic, social and environmental) and includes an important element of environmental innovation, which allows a comparative assessment of mesosystems in industry, taking into account their level of load on the environment, innovative activity in the field of environmental safety, asset use efficiency and motivated researchers, has been developed. The methodology implementation is aimed at overcoming methodological difficulties determined by the lack of standardized solutions in this area. In addition, the proposed approach is superior to other methodological solutions due to the use of calculating the geometric mean, which makes it possible to take into account the absolute values and differing dimensions of the factors.
  • Revealed patterns of innovative mesosystems sustainable development in industrial production in Russia on the basis of constructing a simple two-dimensional histogram of frequency distribution ISDI (normal distribution density law). Three categories of mesosystems have been identified, differing in the level of sustainable development integral indicator (with high, medium, and low ISDI levels). The first category includes mesosystems characterized by a balance of sustainable development factors and active innovation, which can serve as an example of successful experience in greening industry and compliance with ESG principles, as well as broadcast this experience to regions of the second and third categories.
  • A multicriteria and variable typology of innovative mesosystems in industry in Russia based on the use of mathematical tools—the construction of classification and regression trees are proposed. As a result, three variants of innovative mesosystems classification have been developed:
    • Mesosystem classification tree (dependent variable has discrete values—high and low ISDI levels) based on three factors of sustainable development;
    • Classification tree of mesosystems (discrete) based on particular indicators of the development of innovative mesosystems, most correlated with the dependent variable ISDI;
    • Regression tree (dependent variable ISDI has continuous values) based on particular indicators—the number of researchers, return on assets and the share of enterprises that intensively pollute the environment as a result of production activity.
  • On the basis of the first two types of classification, an algorithm for differentiated identification of sustainable development priority areas of innovative mesosystems in industry is proposed, which allows improving key management subsystems (asset management, human resources, R&D, resource consumption, environmental safety) and focusing resources on solving acute problems facing innovative mesosystems. The third type of classification makes it possible to categorize innovative mesosystems in industry according to the ISDI level and to propose a set of measures to reduce their polarization.
  • It is determined that the economic factor prevailing over environmental and social factors (modernization of petrochemical and metallurgical industry enterprises, increasing the profitability of assets and patent activity of mesosystems), and secondly, the number of personnel realizing their potential in the field of R&D, have the greatest impact on decision-making that stimulate the transition of innovative mesosystems to sustainable development. Accordingly, the program for the development of innovative mesosystems in Russia should stimulate the sustainable development of industry, primarily by regulating these parameters.
In general, the nonlinear behavior of innovative mesosystems has been revealed, which is confirmed by their disproportionality in economic development, innovation activity and environmental responsibility. The predominance of objects with a low level of sustainable development integral indicator is revealed, which actualizes a differentiated approach to stimulating the sustainable development of innovative mesosystems in Russian industry. The provision of the country’s development advanced rates should be conditioned by the resources concentration and support not only on investment-attractive mesosystems. This thesis correlates with the conclusions of the team of scientists Larissa B. et al., who give reasonable arguments in favor of improving the policy of sustainable development, taking into account the differences in cultural capital between countries [43] (adapting to our study—between innovative mesosystems).
The proposed solutions may be taken into account in order to develop a standardized methodology for assessing the innovative mesosystems sustainable development in industry, by government bodies when developing strategies and programs for territorial development in order to prioritize support for mesosystems that are weak in terms of sustainable development.
The study of this problem is planned to be continued within the framework of computer programs applicable for meso- and microsystems development.

Author Contributions

Conceptualization, A.I.S. and F.F.G.; methodology, F.F.G.; formal analysis, I.G.E.; investigation, A.I.S. and A.A.Y.; data curation, I.G.E.; writing—original draft preparation, A.I.S. and F.F.G.; writing—review and editing, A.A.Y.; visualization, F.F.G. All authors have read and agreed to the published version of the manuscript.

Funding

This research received no external funding.

Institutional Review Board Statement

Not applicable.

Informed Consent Statement

Not applicable.

Data Availability Statement

Not applicable.

Acknowledgments

The research was carried out within the framework of the grant of the President of the Russian Federation for state support of leading scientific schools of the Russian Federation, Project Number NSh-2600.2020.6.

Conflicts of Interest

The authors declare no conflict of interest.

References

  1. SSI. Sustainable Society Index. Available online: https://ssi.wi.th-koeln.de/history.html (accessed on 23 October 2021).
  2. Dyrdonova, A.N.; Lin’kova, T.S. Principles of petrochemical cluster’ sustainability assessment based on its members’ energy efficiency performance. E3S Web Conf. 2019, 124, 04013. [Google Scholar] [CrossRef]
  3. Samarina, V.P.; Skufina, T.P.; Savon, D.Y.; Shinkevich, A.I. Management of externalities in the context of sustainable development of the russian arctic zone. Sustainability 2021, 13, 7749. [Google Scholar] [CrossRef]
  4. Samarina, V.P.; Skufina, T.P.; Savon, D.Y.U. Comprehensive assessment of sustainable development of mining and metallurgical holdings: Problems and mechanisms of their resolution. Ugology 2021, 7, 20–24. [Google Scholar] [CrossRef]
  5. Shinkevich, M.V.; Shinkevich, A.I.; Ponkratova, L.A.; Klimova, N.V.; Yusupova, G.F.; Lushchik, I.V.; Zhuravleva, T.A. Models and Technologies to Manage the Institutionalization of Sustainable Innovative Development of Meso-Systems. Mediterr. J. Soc. Sci. 2015, 6, 32–39. [Google Scholar] [CrossRef]
  6. Linnerud, K.; Holden, E.; Simonsen, M. Closing the sustainable development gap: A global study of goal interactions. Sustain. Dev. 2021, 29, 738–753. [Google Scholar] [CrossRef]
  7. Vertakova, Y.V.; Plotnikov, V.A. The Integrated Approach to Sustainable Development: The Case of Energy Efficiency and Solid Waste Management. Int. J. Energy Econ. Policy 2019, 9, 194–201. [Google Scholar] [CrossRef]
  8. Shinkevich, A.I. Sustainable development of territories in the zone of industrial facilities. IOP Conf. Ser. Mater. Sci. Eng. 2020, 890, 012190. [Google Scholar] [CrossRef]
  9. Chen, T. Competitive and sustainable manufacturing in the age of globalization. Sustainability 2017, 9, 26. [Google Scholar] [CrossRef] [Green Version]
  10. Holden, E.; Linnerud, K.; Banister, D. Sustainable development: Our Common Future revisited. Glob. Environ. Chang. 2014, 26, 130–139. [Google Scholar] [CrossRef] [Green Version]
  11. Malysheva, T.V.; Shinkevich, A.I.; Kharisova, G.M.; Nuretdinova, Y.V.; Khasyanov, O.R.; Nuretdinov, I.G.; Zaitseva, N.A.; Kudryavtseva, S.S. The Sustainable Development of Competitive Enterprises through the Implementation of Innovative Development Strategy. Int. J. Econ. Financ. Issues 2016, 6, 185–191. [Google Scholar]
  12. Rajskaya, M.V.; Sagdeeva, A.A.; Panteleeva, Y.V.; Malysheva, T.V.; Ershova, I.G. Differentiated approach problems to innovative development management in Russian regions. Humanit. Soc. Sci. Rev. 2019, 7, 1262–1268. [Google Scholar] [CrossRef] [Green Version]
  13. Barsegyan, N.V.; Salimyanova, I.G.; Kushaeva, E.R. Typology of innovation strategies for petrochemical enterprises. J. Phys. Conf. Ser. 2020, 1515, 042090. [Google Scholar] [CrossRef]
  14. Shinkevich, A.I.; Kudryavtseva, S.S.; Rajskaya, M.V.; Zimina, I.V.; Dyrdonova, A.N.; Misbakhova, C.A. Integral technique for analyzing of national innovation systems development. Espacios 2018, 39, 6. [Google Scholar]
  15. Shinkevich, M.V.; Shinkevich, A.I.; Chudnovskiy, A.D.; Lushchik, I.V.; Kaigorodova, G.N.; Ishmuradova, I.I.; Bashkirtseva, S.A.; Marfina, L.V.; Zhuravleva, T.A. Formalization of sustainable innovative development process in the model of innovations diffusion. Int. J. Econ. Financ. Issues 2016, 6, 179–184. [Google Scholar]
  16. Ratner, S.; Lychev, A.; Rozhnov, A.; Lobanov, I. Efficiency Evaluation of Regional Environmental Management Systems in Russia Using Data Envelopment Analysis. Mathematics 2021, 9, 2210. [Google Scholar] [CrossRef]
  17. Li, D.; Lv, H. Investment in environmental innovation with environmental regulation and consumers’ environmental awareness: A dynamic analysis. Sustain. Prod. Consum. 2021, 28, 1366–1380. [Google Scholar] [CrossRef]
  18. Ren, S.; Sun, H.; Zhang, T. Do environmental subsidies spur environmental innovation? Empirical evidence from Chinese listed firms. Technol. Forecast. Soc. Chang. 2021, 173, 121123. [Google Scholar] [CrossRef]
  19. Ullah, S.; Nasim, A. Do firm-level sustainability targets drive environmental innovation? Insights from BRICS Economies. J. Environ. Manag. 2021, 294, 112754. [Google Scholar] [CrossRef]
  20. Mongo, M.; Belaïd, F.; Ramdani, B. The effects of environmental innovations on CO2 emissions: Empirical evidence from Europe. Environ. Sci. Policy 2021, 118, 1–9. [Google Scholar] [CrossRef]
  21. Zhao, X.; Zhang, Y.; Liang, J.; Li, Y.; Jia, R.; Wang, L. The sustainable development of the economic-energy-environment (3E) system under the carbon trading (CT) mechanism: A Chinese case. Sustainability 2018, 10, 98. [Google Scholar] [CrossRef] [Green Version]
  22. Koh, S.C.L.; Morris, J.; Ebrahimi, S.M.; Obayi, R. Integrated Resource Efficiency: Measurement and Management. Int. J. Oper. Prod. Manag. 2016, 36, 1576–1600. [Google Scholar] [CrossRef]
  23. Lubnina, A.A.; Melnik, A.N.; Smolyagina, M.V. On modelling of different sectors of economy in terms of sustainable development. Int. Bus. Manag. 2016, 10, 5592–5595. [Google Scholar] [CrossRef]
  24. Smolyagina, M.V.; Lubnina, A.A. Concerning the environmental marketing of waste management in the context of sustainable development. Int. J. Pharm. Technol. 2016, 8, 11257–11264. [Google Scholar]
  25. Shinkevich, A.I.; Lubnina, A.A.; Chikisheva, N.M.; Simonova, L.M.; Alenina, E.E.; Khrustalev, B.B.; Sadykova, R.S.; Kharisova, R.R. Innovative forms of production organization in the context of high-tech Meso-economic systems sustainable development. Int. Rev. Manag. Mark. 2016, 6, 219–224. [Google Scholar]
  26. Laurett, R.; Paço, A.; Mainardes, E.W. Measuring sustainable development, its antecedents, barriers and consequences in agriculture: An exploratory factor analysis. Environ. Dev. 2021, 37, 100583. [Google Scholar] [CrossRef]
  27. Miola, A.; Schiltz, F. Measuring sustainable development goals performance: How to monitor policy action in the 2030 Agenda implementation? Ecol. Econ. 2019, 164, 106373. [Google Scholar] [CrossRef]
  28. United Nations. Sustainable Development Goals. Available online: https://www.un.org/sustainabledevelopment/ (accessed on 23 October 2021).
  29. Galal, N.M.; Moneim, A.F.A. A mathematical programming approach to the optimal sustainable product mix for the process industry. Sustainability 2015, 7, 13085–13103. [Google Scholar] [CrossRef] [Green Version]
  30. Pieloch-Babiarz, A.; Misztal, A.; Kowalska, M. An impact of macroeconomic stabilization on the sustainable development of manufacturing enterprises: The case of Central and Eastern European Countries. Environ. Dev. Sustain. 2020, 23, 8669–8698. [Google Scholar] [CrossRef]
  31. Rutkowski, L.; Jaworski, M.; Pietruczuk, L.; Duda, P. The CART decision tree for mining data streams. Inf. Sci. 2014, 266, 1–15. [Google Scholar] [CrossRef]
  32. Kuswanto, H.; Mubarok, R. Classification of Cancer Drug Compounds for Radiation Protection Optimization Using CART. Procedia Comput. Sci. 2019, 161, 458–465. [Google Scholar] [CrossRef]
  33. Xu, L.; Du, H.; Zhang, X. A classification approach for urban metabolism using the CART model and its application in China. Ecol. Indic. 2021, 123, 107345. [Google Scholar] [CrossRef]
  34. Breiman, L.; Friedman, J.H.; Olshen, R.A.; Stone, C.T. Classification and Regression Trees, 1st ed.; Routledge: Boca Raton, FL, USA, 1984; 368p. [Google Scholar] [CrossRef]
  35. Apté, C.; Weiss, S. Data mining with decision trees and decision rules. Future Gener. Comput. Syst. 1997, 13, 197–210. [Google Scholar] [CrossRef]
  36. Gocheva-Ilieva, S.; Kulina, H.; Ivanov, A. Assessment of Students’ Achievements and Competencies in Mathematics Using CART and CART Ensembles and Bagging with Combined Model Improvement by MARS. Mathematics 2021, 9, 62. [Google Scholar] [CrossRef]
  37. Wang, F.; Wang, Q.; Nie, F.; Li, Z.; Yu, W.; Ren, F. A linear multivariate binary decision tree classifier based on K-means splitting. Pattern Recognit. 2020, 107, 107521. [Google Scholar] [CrossRef]
  38. Azad, M.; Moshkov, M. Multi-stage optimization of decision and inhibitory trees for decision tables with many-valued decisions. Eur. J. Oper. Res. 2017, 263, 910–921. [Google Scholar] [CrossRef] [Green Version]
  39. Bronfenbrenner, U.; Evans, G.W. Developmental Science in the 21st Century: Emerging Questions, Theoretical Models, Research Designs and Empirical Findings. Soc. Dev. 2000, 9, 115–125. [Google Scholar] [CrossRef]
  40. Godfrey, M.M.; Melin, C.N.; Muething, S.E.; Batalden, P.B.; Nelson, E.C. Clinical Microsystems, Part 3. Transformation of Two Hospitals Using Microsystem, Mesosystem, and Macrosystem Strategies. Jt. Comm. J. Qual. Patient Saf. 2008, 34, 591–603. [Google Scholar] [CrossRef]
  41. Federal State Statistics Service. Available online: http://www.gks.ru (accessed on 23 October 2021).
  42. HSE University. Available online: https://www.hse.ru (accessed on 23 October 2021).
  43. Larissa, B.; Maran, R.M.; Ioan, B.; Anca, N.; Mircea-Iosif, R.; Horia, T.; Gheorghe, F.; Ema Speranta, M.; Dan, M.I. Adjusted Net Savings of CEE and Baltic Nations in the Context of Sustainable Economic Growth: A Panel Data Analysis. J. Risk Financ. Manag. 2020, 13, 234. [Google Scholar] [CrossRef]
Figure 1. Frequency distribution diagram for the ISDI variable.
Mathematics 09 03055 g001
Figure 2. Deviation schedule.
Mathematics 09 03055 g002
Figure 3. Classification tree for identifying patterns of innovative mesosystems sustainable development in industry (based on sustainable development factors).
Mathematics 09 03055 g003
Figure 4. Classification tree to identify patterns of sustainable development of innovation mesosystems in industry (based on private indicators of mesosystem development).
Mathematics 09 03055 g004
Figure 5. Algorithm for differentiated identification of priority areas for sustainable development of innovative mesosystems in industry.
Mathematics 09 03055 g005
Figure 6. Regression tree for identifying patterns of sustainable development of innovative mesosystems in industry (based on continuous forecasting).
Mathematics 09 03055 g006
Table 1. Factors and integral indicator of innovative mesosystems sustainable development (calculated according to the author’s method).
Innovative MesosystemIeconIecolIsocISDIInnovative MesosystemIeconIecolIsocISDI
Belgorod Region6.5516.741.575.56Sevastopol city3.565.160.962.60
Bryansk Region3.523.760.952.33Republic of Daghestan−1.452.940.98−1.61
Vladimir Region5.123.753.444.04Republic of North
Ossetia—Alania
3.050.010.810.01
Voronezh Region3.9516.393.786.25Stavropol Territory7.5510.081.624.98
Ivanovo Region1.155.311.151.91Republic of Bashkortostan8.9115.533.377.75
Kaluga Region7.435.964.245.73Republic of Mari El−4.450.010.630.01
Kostroma Region5.786.730.462.62Republic of Mordovia4.477.211.153.33
Kursk Region3.8413.741.834.59Republic of Tatarstan5.6318.954.777.98
Lipetsk Region9.9416.661.015.51Udmurtian Republic5.664.772.033.80
Moscow Region7.1216.8011.7611.20Chuvash Republic7.894.421.703.90
Orel Region5.108.321.123.62Perm Territory9.4112.164.457.99
Ryazan Region9.049.002.195.63Kirov Region4.9411.141.724.56
Smolensk Region5.0217.491.254.79Nizhny Novgorod Region9.4111.659.069.98
Tambov Region3.790.011.100.01Penza Region4.404.523.143.97
Tver Region3.4614.452.575.05Samara Region−4.4815.824.27−6.71
Tula Region5.1215.803.116.31Saratov Region6.7619.362.687.05
Yaroslavl Region3.783.753.513.68Ulyanovsk Region3.627.703.204.47
Moscow city6.2318.9213.0711.55Sverdlovsk Region8.8925.396.4111.31
Republic of Karelia2.869.111.143.10Tyumen Region5.8912.312.345.54
Komi Republic7.7510.081.074.37Chelyabinsk Region9.1022.175.8210.55
Arkhangelsk Region1.408.591.302.50Republic of Khakassia10.119.740.343.22
Kaliningrad Region3.407.281.273.16Altay Territory9.969.761.775.56
Leningrad Region5.0517.873.476.79Krasnoyarsk Territory12.8413.923.208.30
Murmansk Region−3.7710.271.50−3.87Irkutsk Region10.9715.122.127.06
Novgorod Region6.9711.971.785.30Kemerovo Region6.1017.141.164.95
Pskov Region2.461.280.491.16Novosibirsk Region5.7711.035.356.98
Sankt-Petersburg city5.5111.5510.268.68Omsk Region11.2611.222.506.81
Republic of Adygeya6.813.730.622.51Tomsk Region4.669.593.485.38
Republic of Crimea4.995.141.333.24Republic of Buryatia4.418.251.013.32
Krasnodar Territory2.7315.282.654.80Republic of Sakha (Yakutia)−2.7610.690.85−2.93
Astrakhan Region−5.164.880.89−2.82Trans-Baikal Territory4.9712.280.543.21
Volgograd Region8.9212.472.186.24Primorye Territory2.3115.962.504.52
Rostov Region7.1220.564.018.37Khabarovsk Territory4.5413.361.364.35
Table 2. Typology of innovative mesosystems based on a regression tree.
CriterionClass 1Class 2Class 3Class 4
Average value of the dependent variable “integral indicator of sustainable development” (ISDI)26934919700810.036
The nature of sustainable development of innovative mesosystemsweakmoderateperceptiblehigh
Number of innovative mesosystems1726107
Classification criterion: number of personnel engaged in research (thousand people)[0; 1149][1149; 6949][6949; 14.406][14.406; +∞)
Publisher’s Note: MDPI stays neutral with regard to jurisdictional claims in published maps and institutional affiliations.

