1. Introduction
Precision manual manufacturing tasks rely heavily on sensorimotor coordination and fine motor control [
1,
2]. Within these environments, variability in operator execution is often reflected in inconsistent process outcomes and deviations during task performance [
1,
3]. This suggests that the reliability of manual manufacturing is closely linked to the consistency of operator movement behavior [
1,
2]. The practical implications of this relationship are well documented in welding process research. Variations in operator technique and process parameter control have been shown to produce measurable differences in weld deposit microstructure, hardness, and service performance outcomes such as wear resistance and ballistic response [
4,
5]. These findings underscore the process-level significance of operator execution consistency. Consequently, managing this variability requires reliable methods for quantifying human performance and examining the motor-level factors associated with process inconsistency.
In practice, expert visual observation and qualitative checklists remain the primary methods for evaluating proficiency in manual manufacturing tasks. However, these methodologies are inherently limited by observer bias and significant inter-rater variability, which hinder reliable performance measurement and preclude meaningful comparison across operators [
6,
7]. This lack of reproducibility further restricts the ability to model longitudinal performance trajectories or perform consistent tracking across repeated sessions. Recent research has therefore explored objective kinematic metrics—such as motion smoothness (jerk), path length, and velocity profiles—as indicators of technical proficiency [
8,
9,
10]. Nevertheless, their systematic application to manual manufacturing tasks remains limited, particularly with respect to the systematic quantification of longitudinal changes in trajectory behavior during complex manual task execution [
11,
12].
Simulation environments offer an alternative measurement setting by enabling controlled data acquisition without interrupting real production workflows. Representing the spatial interaction between a tool and its task environment is a shared challenge across simulation-based systems. Related spatial modeling problems have been addressed in autonomous robotics through hierarchical decomposition approaches such as fuzzy signature-integrated quadtrees [
13], and analogous challenges arise in VR-based simulation platforms, where tool–workpiece geometry must be precisely tracked. More broadly, mathematically grounded representations of dynamic behavior are widely used across engineering domains to support physically interpretable analysis and system design [
14]. In this context, acknowledging the inherent imperfections of real physical systems is crucial. While often considered a drawback, non-idealities can actually enhance the dynamical behavior, fostering complex and organized movement patterns [
15].
VR platforms, in particular, allow high-frequency motion tracking under repeatable conditions [
16,
17,
18]. Kinematic metrics in these environments have been used to differentiate proficiency levels, as experts typically exhibit more stable and consistent motion patterns than novices [
19,
20,
21]. These measurements also support the analysis of longitudinal changes in movement organization, where repeated practice has often been associated with smoother and less variable trajectories over time [
22,
23,
24]. However, although similar approaches are well established in surgical and laboratory-based tasks, their application to manual manufacturing remains limited due to the continuous control and task-dependent sensorimotor demands of industrial operations.
Current VR welding studies have primarily focused on simulator scores, procedural performance, usability-related evaluation, and affective outcomes such as learner confidence [
25,
26,
27]. Although these studies support the value of VR as a controlled measurement and simulation environment, they provide limited insight into how motor behavior evolves during repeated practice. In particular, it remains unclear whether improvements in spatial welding performance are accompanied by parallel changes in movement smoothness, fragmentation, and temporal control. This limitation is important because manual manufacturing performance depends not only on the final task outcome but also on how movement is organized during execution [
1,
2]. Consequently, the use of VR as an objective platform for modeling dynamic trajectory behavior in simulated manufacturing tasks remains underdeveloped [
19].
To address this gap, the present study develops a task-space kinematic analysis framework for representing dynamic trajectory behavior during VR welding. Rather than relying solely on post hoc statistical comparisons or final simulator scores, the framework maps raw 3D motion trajectories onto a physically interpretable 1D progression defined along the weld seam. This task-space representation is then combined with derivative-based kinematic feature extraction to quantify both geometric task accuracy and process-level movement dynamics across repeated trials.
Accordingly, this study examines whether high-frequency kinematic data recorded during VR welding can reveal longitudinal changes in dynamic movement organization beyond what is captured by conventional outcome-based simulator scores. More specifically, it investigates whether spatial accuracy, movement smoothness, and fragmentation exhibit parallel or dissociable temporal patterns across repeated trials and sessions in a computer-simulated manual welding task.
To highlight the methodological positioning of the proposed task-space formulation,
Table 1 summarizes its main characteristics, advantages, and limitations relative to conventional simulator scoring and unconstrained kinematic analysis approaches used in other simulation-based domains.
The primary contributions of this study are summarized as follows:
Adaptation of an Established Kinematic Analysis Framework to VR Welding: This study applies and adapts established kinematic metrics (e.g., SPARC and LNJ) within a VR welding context by integrating them with high-frequency task-space trajectories and trial-level summaries to examine longitudinal changes in welding motion under computer-simulated conditions.
Revealing the Dissociation between Task Outcome and Process-Level Kinematics: This study shows that task-level spatial accuracy and process-level movement organization may evolve differently over time. This provides evidence that successful geometric task completion does not always correspond to smooth, stable, or well-organized motor execution in unconstrained manual tasks.
Task-Space Modeling of a Simulated Manual Welding System: Moving beyond descriptive educational evaluation, the proposed framework transforms unconstrained welding motion into a structured and physically interpretable task-space representation. This parameterization provides a mathematical basis for objective kinematic assessment and establishes a reference structure that can support future engineering developments in automated quality monitoring and motion-based process evaluation for manufacturing tasks.
Longitudinal Analysis of Dynamic Movement Behavior: By examining repeated trials across temporally separated sessions, this study evaluates whether early improvements in spatial performance are accompanied by systematic reorganization of dynamic kinematic features.
2. Methodology
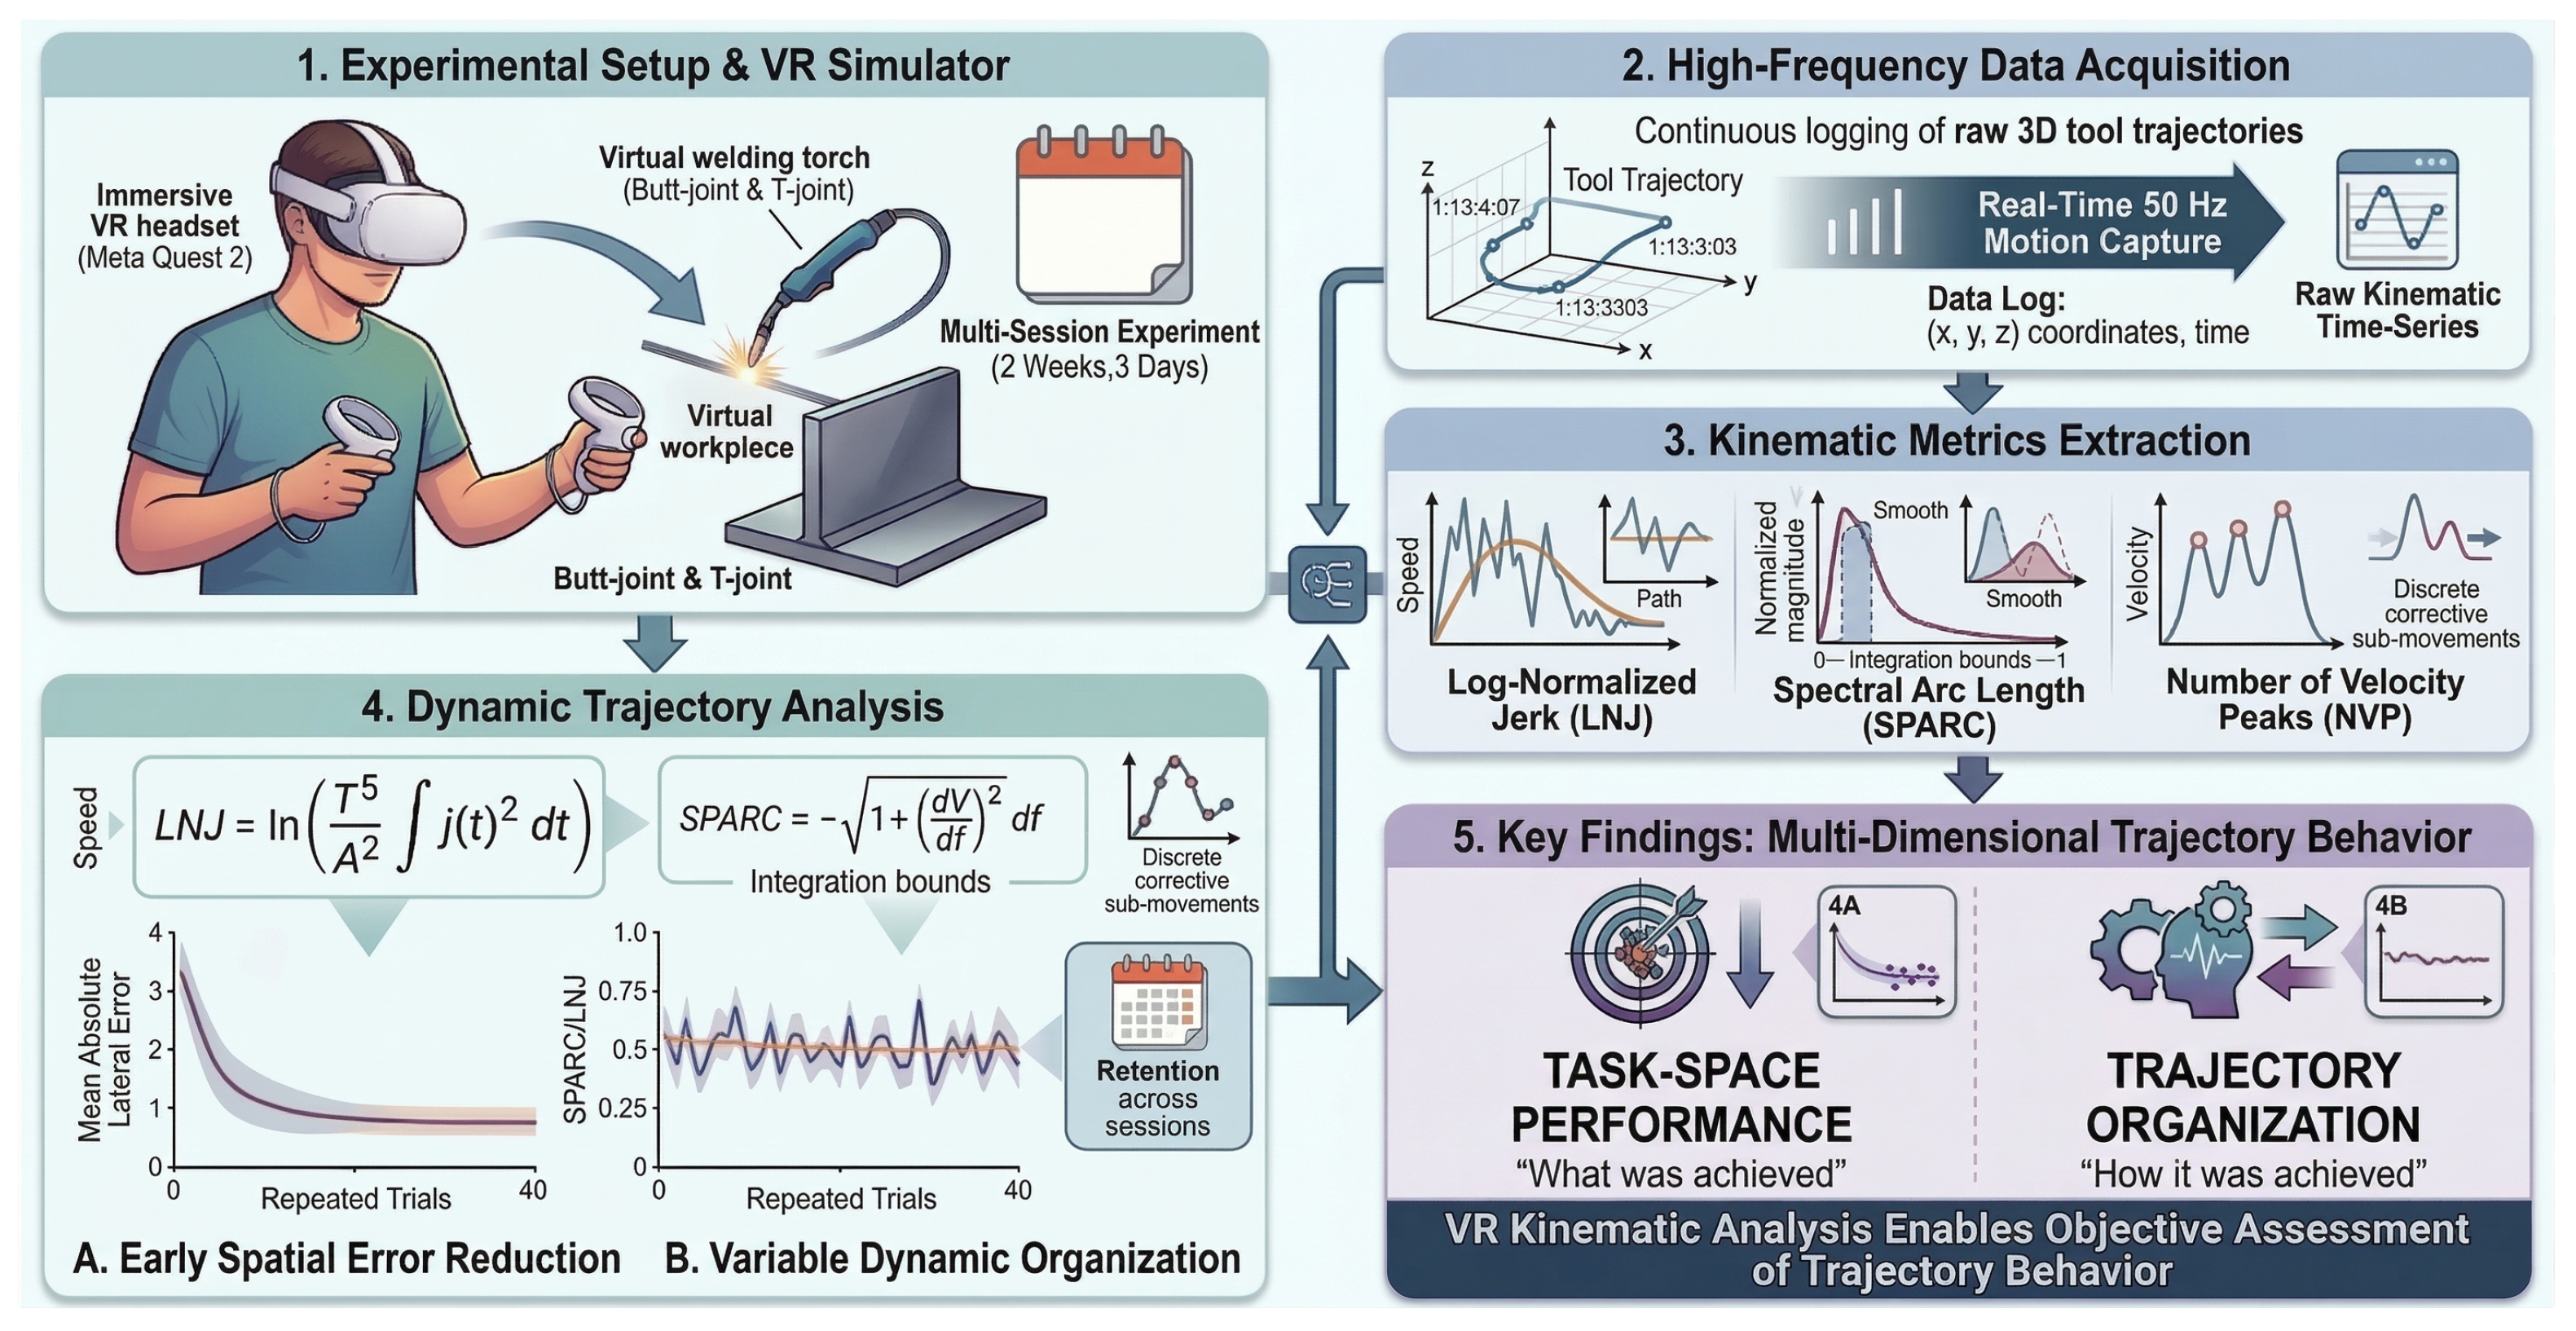
Figure 1 summarizes the overall workflow of this study, including the simulated welding setup, task-space data acquisition, and dynamic kinematic analysis pipeline.
2.1. Experimental Design
Task-space trajectory organization in constrained manual tasks is inherently longitudinal rather than instantaneous, requiring repeated observations across multiple sessions to characterize temporal progression in movement behavior. Experimental studies of complex motor behavior therefore commonly employ multi-session repeated-practice protocols, in which performance changes are tracked across trials and sessions using longitudinal performance profiles [
28,
29]. Such designs enable quantitative evaluation of how task performance evolves over time.
Within these repeated-practice paradigms, performance evolution is not reflected solely by task completion but also by changes in movement organization. With practice, performance may improve through changes in coordination, movement regulation, and error control, rather than through task completion alone [
30]. Long-term behavioral datasets further suggest that performance improvement reflects refined motor execution rather than simple task familiarity, reinforcing the need to analyze behavioral trajectories rather than single outcome scores [
31].
Because repeated measurements collected from the same participants violate the independence assumptions of traditional statistical tests, longitudinal repeated-measures trajectory data require analytical models that account for within-subject variability. Mixed-effects approaches provide a principled framework for modeling such data by accounting for both population-level trends and participant-specific variability in longitudinal trajectory patterns [
31,
32,
33].
In the present study, novice participants completed repeated virtual welding trials across three sessions, enabling analysis of both within-session trajectory changes and between-session preservation. Accordingly, this study adopted a multi-session repeated-measures design to analyze longitudinal changes in welding trajectory behavior across repeated sessions. This design supported systematic evaluation of early trajectory changes, subsequent performance stabilization, and individual variability across repeated trials and sessions.
2.2. Data Acquisition and Signal Processing Rationale
Human motion tracking systems provide position measurements that inherently contain measurement noise introduced by sensing, reconstruction, and tracking processes [
34]. This issue becomes particularly important when derivative-based variables are analyzed, because numerical differentiation amplifies high-frequency signal content and can make velocity, acceleration, and especially jerk estimates unreliable [
34,
35,
36].
To address this challenge, low-pass filtering or adaptive smoothing strategies are commonly used to obtain stable kinematic quantities [
37,
38,
39,
40]. These signal processing procedures help manage the fundamental trade-off between noise suppression and the preservation of structurally meaningful signal features [
41].
Continuous tracking recordings also do not directly correspond to a single motor action and must therefore be partitioned into meaningful analytical units. In movement analysis, untrimmed time series are commonly segmented into discrete actions, task phases, or motion primitives so that extracted variables correspond to a defined motor execution rather than to unrelated motion [
42,
43,
44]. In the present study, this requirement was addressed by defining each welding attempt as a task-specific segment bounded by arc initiation and arc termination events.
In addition, tracking systems may introduce artifacts such as temporary signal loss, pose estimation errors, and unrealistic coordinate spikes. Because natural human motion is smooth, abrupt trajectory discontinuities are typically treated as measurement errors and handled using filtering or sample exclusion procedures [
45]. Segment-level outliers caused by signal dropout can be identified relative to neighboring measurements and corrected or excluded before analysis, while occlusions and pose estimation failures may produce spurious keypoints that do not represent true kinematic behavior [
46,
47]. Accordingly, trajectory-based quality control procedures are commonly applied to identify abnormal samples while preserving genuine motion patterns [
48].
Reliable derivative estimation further depends on adequate sampling frequency. According to the Nyquist principle, the sampling rate must be at least twice the highest movement frequency in order to avoid aliasing in position measurements [
49]. However, sampling near the Nyquist limit may still yield inaccurate time-derivative variables, and insufficient sampling can distort velocity-, acceleration-, and jerk-related measures [
50]. Therefore, relatively high sampling frequencies are generally required for human motion capture when derivative-based kinematic analysis is intended, as low temporal resolution can introduce timing errors in movement event detection [
50,
51]. The 50 Hz logging frequency was intentionally selected as a downsampled rate from the VR tracking system to balance temporal resolution and data storage. Given that the observed welding motion was concentrated predominantly in the low-frequency range, substantially higher sampling rates were not expected to provide proportionally greater behavioral information, whereas they would increase noise sensitivity and data redundancy. To further support this assumption, a representative normalized magnitude spectrum of the seam-projected welding-speed signal is provided in
Supplementary Figure S4. The spectrum shows a dominant frequency at 2.59 Hz and indicates that 72.7% of the spectral energy is concentrated at or below 3 Hz, consistent with predominantly low-frequency voluntary motion.
Based on these considerations, the recorded trajectories were preprocessed through task-based segmentation, signal smoothing, artifact handling, and appropriate sampling-rate selection before derivative-based kinematic features were computed.
2.3. Participants
A total of 20 participants were included in the experimental study. Participants were randomly selected from a cohort of 40 second-year undergraduate students enrolled in the Metallurgical and Materials Engineering program, using a random number generator applied to the class roster. The selected students were invited to participate and provided informed consent prior to the experiment. The age of the participants ranged from 18 to 21 years (mean age = 20.2, SD = 0.67). The sample consisted of 10 male and 10 female students, and all participants were right-handed. The participant sample size was modest; however, the multi-session repeated-measures design yielded approximately 300 trial-level observations across sessions. This longitudinal data structure was suitable for the mixed-effects modeling approach used in this study. In addition, the strict inclusion criteria produced a relatively homogeneous novice sample, which helped reduce confounding inter-subject variability and supported clearer observation of early-stage trajectory adaptation.
Participants were eligible if they had no prior practical welding experience and were able to perform unrestricted upper-limb movements. None of the participants had prior welding experience, formal welding training, or prior exposure to welding simulators or VR-based manual tasks. Individuals with any condition affecting motor coordination, upper-extremity function, neurological status, or uncorrected visual impairment were excluded from participation. Vision was normal or corrected-to-normal; participants who normally wore glasses or contact lenses continued to use them during VR operation. Accordingly, all participants were classified as novices in both welding and VR-mediated manual task execution.
All participants followed the same experimental protocol using identical equipment in the same experimental environment. The order of participation was randomized to avoid systematic ordering effects. Multiple VR systems were operated simultaneously in a shared laboratory space; however, the participants were positioned in separate working areas and could neither see the welding task nor the performance feedback of other participants. Each participant performed the task individually, without instructor correction or coaching.
The participants used two handheld controllers: the dominant hand controlled the virtual welding torch and was used for all kinematic measurements, while the non-dominant hand was limited to auxiliary interface interactions. All welding tasks were performed in a standing posture, and no coordinated bimanual motor control was required for generating the weld bead trajectory.
The experiment consisted of three sessions conducted on different days. The second session was conducted one day after the first, and the third session took place one week later. In each session, the participants performed approximately 5–10 welding attempts, resulting in a total of 15–30 attempts per participant across the experimental protocol. No time limit was imposed, and the participants were free to pause when necessary. Although the number of attempts varied across participants, all completed attempts were retained for subsequent analysis. The varying number of attempts reflected natural differences in task completion and fatigue tolerance across participants.
2.4. Virtual Reality Welding System and Data Acquisition
Experimental data were collected using an immersive VR welding simulation system based on a standalone head-mounted display (Meta Quest 2, Meta Platforms, Inc., Menlo Park, CA, USA) and handheld controllers. The application was executed directly on the headset as a native APK without PC connection, streaming, or external computation. Consequently, tracking, rendering, and data logging were performed locally on the device, minimizing latency and providing temporally consistent motion capture.
The system employed an inside-out optical tracking architecture providing six-degree-of-freedom (6-DoF) tracking. Participants interacted with the simulated welding environment using the native VR controllers rather than a physical welding torch, thereby avoiding mechanical constraints and cable-related motion disturbances. A mild haptic vibration was automatically applied to the controller during arc activation and stopped when the arc terminated, providing tactile confirmation of arc activation without directional guidance.
The virtual welding environment was developed using a custom Unity-based simulator (version 2022.3.62f2). The simulator emulated a Gas Metal Arc Welding (GMAW/MIG–MAG) process in both butt-joint and T-joint configurations. Participants deposited weld beads along predefined joint paths while maintaining torch orientation and travel motion consistent with the task requirements.
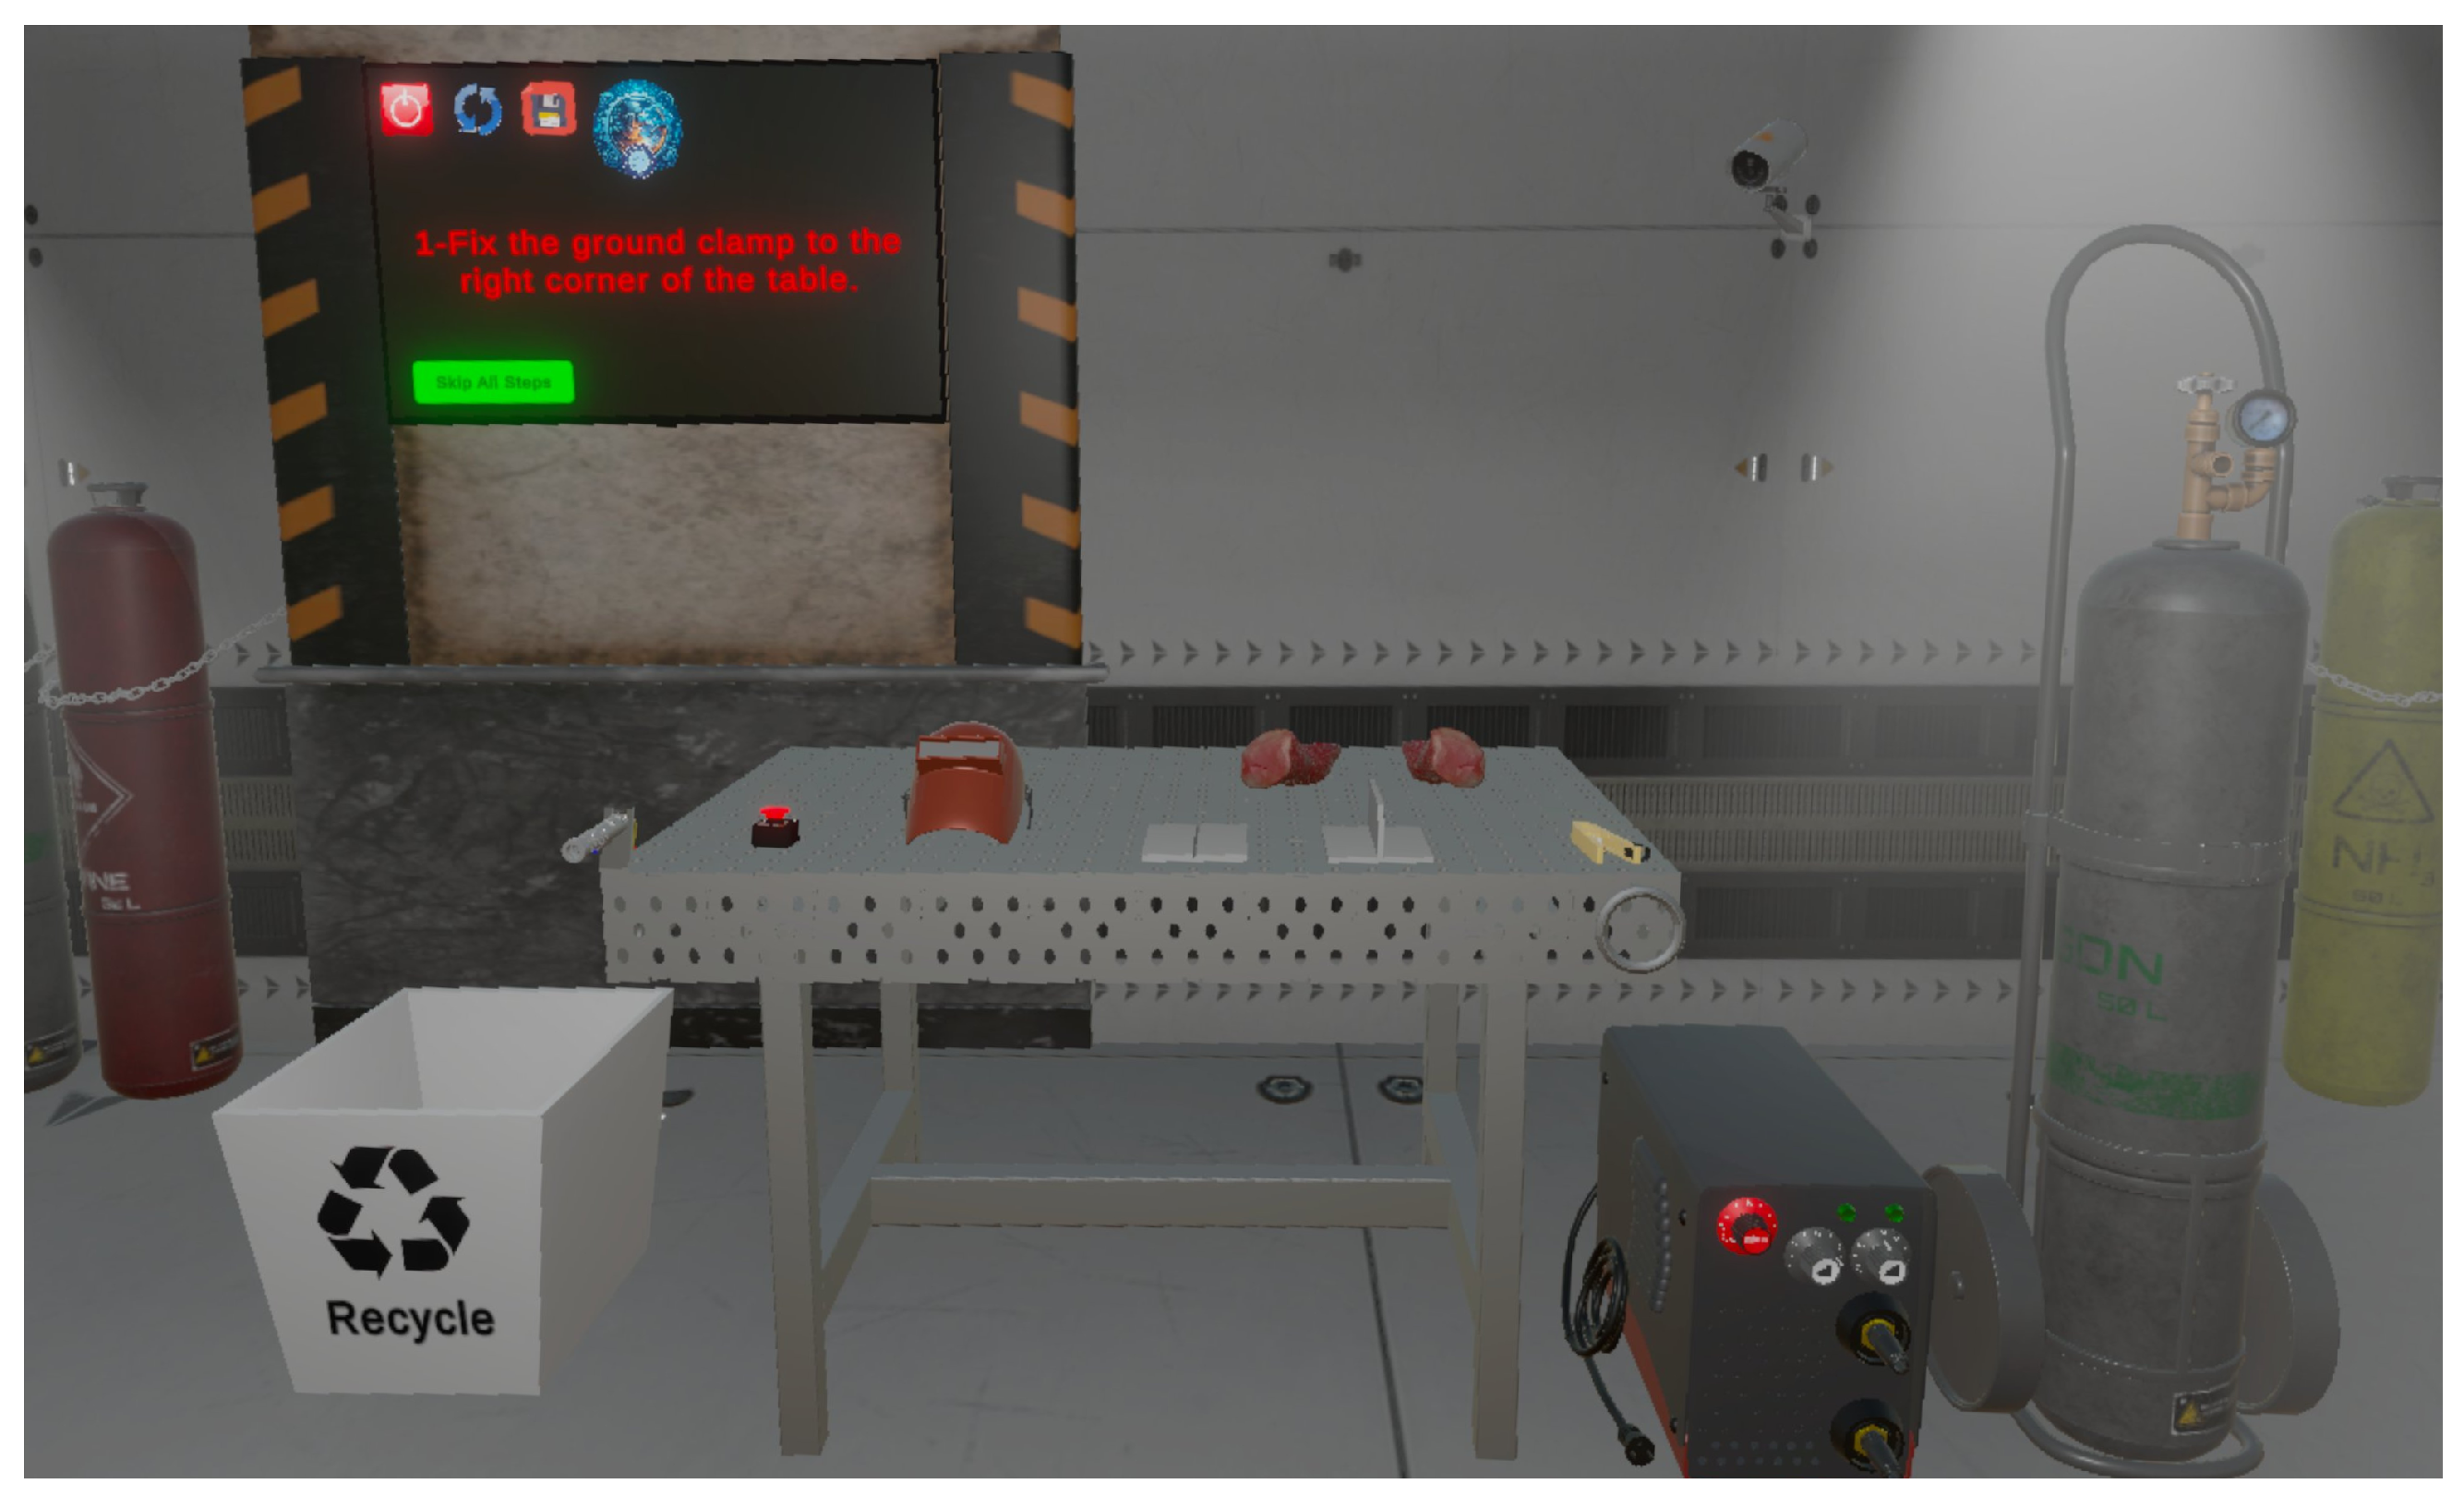
Figure 2 presents a representative view of the Unity-based virtual welding laboratory, and
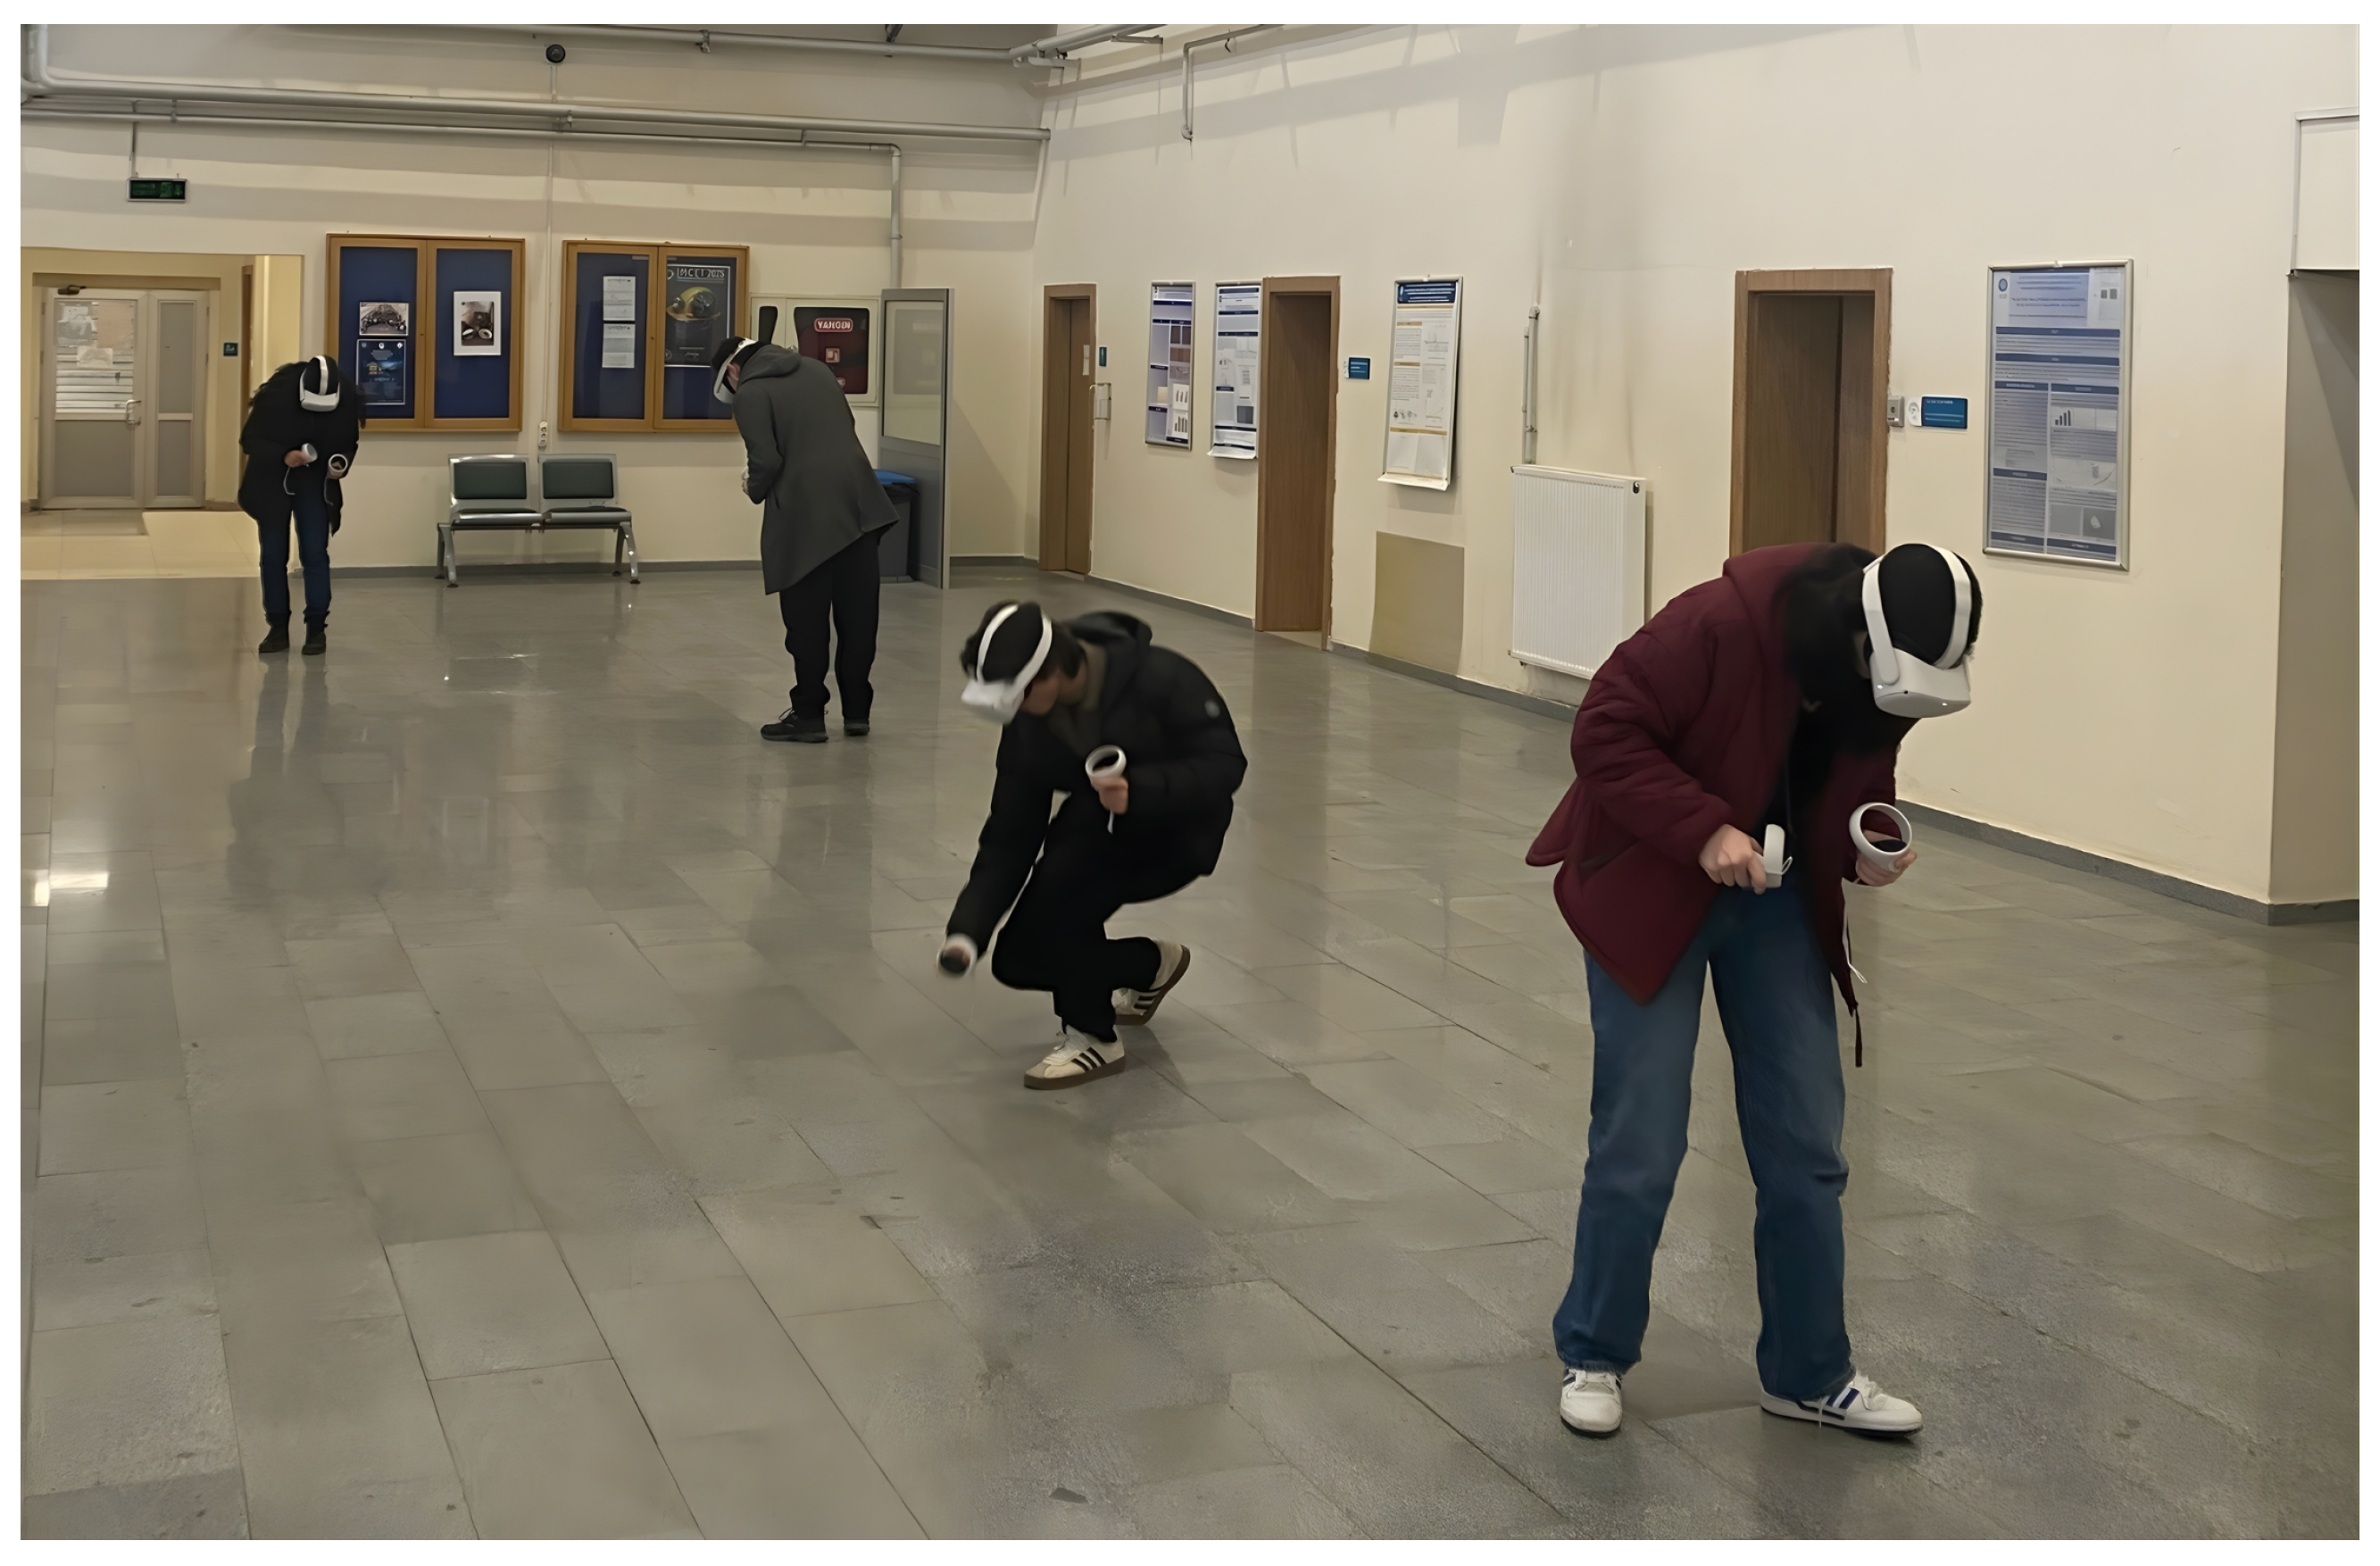
Figure 3 shows a representative experimental session during data collection.
The three-dimensional position of the virtual torch tip was recorded continuously using the Unity engine’s Transform.position property at every sampling instant. The weld seam was defined as a fixed object in the Unity world coordinate system, and the torch tip position was transformed into the local coordinate frame of the workpiece prior to computing all kinematic variables. All kinematic metrics (e.g., path deviation and lateral error) were computed from relative vectors between the torch tip and the target weld seam. Consequently, measured quantities represented tool–task interaction rather than user motion within the room. Head or body movements therefore changed only the visual viewpoint and did not affect the computed kinematic variables.
During each welding attempt, the spatial trajectory of the welding torch tip was recorded as time-resolved three-dimensional coordinates , expressed in millimeters with three-decimal precision. The trajectory data were recorded in real time and stored as a continuous time series from arc initiation to arc termination. Motion data were recorded at a fixed sampling rate of 50 Hz, and all subsequent kinematic analyses were performed on the logged motion samples.
Stand-off distance (contact tip to work distance, CTWD) was computed as the projection of the contact tip position onto the electrode axis (the local torch longitudinal axis). This formulation reflects effective electrode extension along the torch axis rather than simple Euclidean tip-to-surface distance.
The beginning and end of each welding trial were defined by the simulator’s internal welding state. Welding was initiated when the participant pressed the controller trigger to activate the arc, and terminated when the arc stopped. The simulator automatically generated a new trial identifier for each arc activation, and all samples were indexed using the corresponding overall_trial_ID. The trigger event and motion samples were recorded within the same simulation loop, ensuring temporal synchronization between arc activation and kinematic data.
Only samples recorded during the active welding state were logged and stored; idle controller movements before arc activation and after arc termination were not included in the dataset. Accordingly, segmentation did not rely on velocity thresholds, jerk peaks, or manual trimming. Each recorded time series therefore corresponded to a single welding attempt and provided a well-defined task interval for subsequent kinematic analysis.
After each welding trial, participants could access a results screen displaying separate numerical scores for path accuracy, torch angle, travel speed, and stand-off distance. During task execution, optional real-time visual indicators were available for torch angle and stand-off distance, indicating deviation from predefined acceptable ranges. These indicators were available during training and, when not needed, could be disabled. Numerical performance results were displayed only after trial completion and were not visible during welding execution.
All recordings were performed using identical hardware, simulator settings, and session initialization procedures.
3. Dataset Structure and Variable Definitions
The experimental procedure produced a hierarchical dataset with two complementary levels: (i) a high-frequency kinematic time-series dataset containing raw trajectories, and (ii) a trial-level summary dataset containing aggregated performance descriptors. Each welding attempt generated both time-resolved motion recordings and one corresponding trial-level summary entry. This structure separates moment-to-moment trajectory behavior from trial-level task outcomes and supports longitudinal analysis across sessions and repeated trials. It also enables examination of how low-level motor behavior relates to changes in task performance over practice.
3.1. Raw Kinematic Trajectory Dataset
During each welding attempt, the simulator recorded time-resolved kinematic variables at a fixed sampling frequency of 50 Hz. Each row corresponds to a single temporal observation captured between arc ignition and arc termination. Given the slow and quasi-static nature of the welding task, this sampling rate provided sufficient temporal resolution for subsequent kinematic analysis.
Table 2 summarizes the variables stored in the raw trajectory files.
Each record represents a single time-resolved observation of torch motion during active welding. Recording started at arc activation and ended at arc termination; thus, the dataset contains only task-relevant motor behavior. All variables were computed in the workpiece reference frame using the relative transformation between the torch tip and the predefined seam, making them independent of global headset or body motion. Consequently, both spatial errors and kinematic measures are defined in task space rather than controller space.
3.1.1. Spatial Reference Frame and Reproducibility
All spatial measurements were computed in a local coordinate frame attached to the virtual workpiece, rather than in the global VR world space. The coordinate origin was defined at the starting point of the ideal welding seam, and participants were re-centered relative to the workstation before each session, in order to align the physical standing position with the virtual welding bench.
Torch positions were transformed from Unity world coordinates to the workpiece local frame prior to error computation. As a result, small headset pose variations or global tracking drift did not alter the relative geometric relationship between the torch tip and the workpiece. The virtual workpiece was fixed in the scene hierarchy and was not parented to the headset or controllers; therefore, participant body motion affected only the viewpoint and not the geometric measurements.
3.1.2. Contact Point Definition and Measurement Validity
The instantaneous torch contact point was determined using Unity’s physics-based raycasting routine as the intersection between a ray emitted from the torch contact-tip transform () along the electrode direction and the triangulated mesh collider of the workpiece. The detected intersection therefore represents the physical arc attachment point, rather than the controller position or the virtual torch body. If no intersection was detected (e.g., because the torch was positioned too far from the workpiece), the sample was excluded from the dataset. Consequently, all stored observations correspond to physically valid welding configurations.
The electrode wire orientation, denoted as the unit vector
, was defined by the longitudinal axis (up-vector) of the torch tip transform
:
where
corresponds to the local up-direction of the torch tip object. This vector represents the physical direction of the filler wire extending from the contact tip toward the workpiece.
3.1.3. Ideal Seam Representation and Lateral Error Computation
For both butt-joint and T-joint conditions, the ideal weld seam was defined as a straight centerline segment in the local workpiece frame. Let the instantaneous torch contact point be
. The seam is represented by the finite line segment between endpoints
and
. The unit tangent vector
defining the seam direction is given by
The closest point on the seam segment,
, was determined by computing the projection parameter
u:
Let
denote the local surface normal of the workpiece. A lateral axis
perpendicular to both the seam direction and the surface normal was defined as follows:
The signed lateral deviation
was then computed by projecting the vector from the closest point
to the torch contact point
onto this lateral axis:
The resulting value was reported in millimeters and computed in the workpiece local frame, where the seam tangent defines the longitudinal direction and defines the signed lateral direction. Positive and negative values indicate deviation to opposite sides of the seam centerline, whereas indicates perfect alignment.
3.1.4. CTWD Computation
In the dataset, this variable is recorded as Stick_Out to maintain consistency with welding workshop terminology. The contact tip to work distance (CTWD) was computed as the scalar projection of the vector from the torch tip to the raycast hit point onto the electrode wire direction.
Let
denote the torch tip position,
the raycast contact point, and
the unit electrode direction vector. The contact tip to work distance (CTWD) was computed as the scalar projection of the vector from the torch tip to the contact point onto the electrode direction:
This projection-based definition differs from a simple Euclidean distance measurement. A simple Euclidean distance would not correctly capture changes caused by torch tilting, whereas in real welding the effective stick-out depends on the torch inclination. This projection-based definition provides a physically meaningful approximation of electrode extension because it measures distance along the wire direction, rather than as a simple point-to-surface separation.
3.1.5. Travel Speed Computation
The instantaneous welding travel speed was not calculated from the raw motion of the controller in 3D space. Instead, the torch-tip displacement was projected onto the welding seam direction to measure effective task-space motion. Let
and
denote consecutive torch-tip positions, and let
be the unit tangent vector of the welding seam. The incremental displacement is as follows:
The effective travel displacement along the seam is obtained by projecting this displacement onto the seam tangent:
The instantaneous welding speed is then computed as follows:
The absolute value ensures that the recorded speed represents movement magnitude along the seam, independent of forward or backward direction. By embedding task-specific geometric constraints directly into the formulation, the model isolates progression along the weld path while reducing the influence of non-task-related motion components. This task-space definition therefore provides a more physically interpretable representation of welding travel speed than raw multi-dimensional velocity tracking.
3.1.6. Torch Orientation Measurement
The recorded torch orientation angle
was defined relative to the local workpiece surface. Specifically, it was computed from the relationship between the electrode direction vector
and the local surface normal
. To ensure numerical stability and prevent errors caused by floating-point rounding, the dot product was constrained to the interval
, and the angle was computed as follows:
The surface normal vector was obtained directly from the raycast hit information returned by the physics engine. The normal corresponds to the geometric normal of the intersected triangle on the workpiece mesh collider. Therefore, the orientation measurement is locally adaptive and reflects the instantaneous welding surface geometry.
In this formulation, a value of signifies a torch that is perfectly perpendicular to the local surface plane. For T-joint configurations, the local surface normal is defined along the bisector plane; thus, a recorded value of represents ideal alignment with the joint’s internal angle. This formulation ensures that the ideal orientation is consistently represented by across all joint geometries in the dataset, facilitating direct statistical comparison.
3.1.7. Active Welding Window and Temporal Trimming
To isolate steady-state motor behavior and eliminate movement onset or task completion transients, a fixed temporal trimming was applied to each trial:
The first and last 0.5 s of each trial were removed from both the raw logs and the trial-level summary statistics. This trimming was applied prior to dataset storage, so both the raw trajectory files and the trial-level summaries contain only the analyzed steady-state interval. The trimming was necessary because the motion data recorded immediately after arc initiation and immediately before arc termination often contained irregular transition-related samples. These samples reflected movement onset and task completion rather than stable welding behavior. Based on preliminary inspection of pilot trials, a 0.5 s margin was selected as a conservative threshold for excluding these transient segments across participants.
3.1.8. Smoothing and Derivative Estimation (Offline)
Prior to derivative-based kinematic analysis, the recorded welding-speed signal was smoothed to reduce the influence of high-frequency tracking noise. Instantaneous travel speed was obtained during the simulation from path-projected displacement between consecutive samples divided by the sampling interval. Because numerical differentiation inherently amplifies measurement noise, derivative-based features were not computed directly from the raw speed signal.
To improve signal stability, a third-order Savitzky–Golay filter with a window length of 11 samples (220 ms at 50 Hz) was applied offline to the recorded Welding_Speed signal. The window length was selected to suppress high-frequency jitter originating from hand tremor and VR tracking fluctuations while preserving lower-frequency motion variations relevant to task execution. These parameters were selected to provide a practical balance between noise attenuation and preservation of task-relevant movement structure, so that high-frequency tremor-like fluctuations and tracking jitter were reduced without excessively smoothing the broader velocity-profile changes associated with voluntary welding motion.
This smoothing procedure was used exclusively for derivative-based kinematic feature extraction. Specifically, the filtered speed signal was used for the computation of log-normalized jerk (LNJ), spectral arc length (SPARC), and the number of velocity peaks (NVP). In contrast, primary trial-level descriptive performance measures—such as Mean Absolute Error (MAE), Root-Mean-Square Error (RMSE), skewness, and percentiles—were obtained from the recorded trial summaries rather than from the smoothed signal.
All derivative-based features were computed from the seam-projected welding-speed signal rather than from spatial position coordinates. Consequently, the resulting smoothness metrics quantify fluctuations in effective welding progression along the seam, rather than spatial tremor of the hand.
3.2. Trial-Level Performance Summary Dataset
Each summary row corresponds to one welding trial and stores aggregated descriptors derived from the associated 50 Hz samples, together with trial-level metadata.
Table 3 summarizes the main performance variables used in the trial-level summary dataset.
Skewness indicates the directional bias of the lateral error distribution, where a positive value signifies rightward-skewed error relative to the seam direction.
The Final_Score is a composite performance index generated by the simulator. It combines the path score, torch angle score, speed score, and stick-out score into a normalized benchmark used only for participant feedback and not as a primary scientific outcome variable.
3.3. Relationship Between Datasets
The two dataset levels are linked by the unique trial identifier (Overall_Trial_ID in the summary dataset, and the corresponding Trial_ID field in the raw trajectory files). Each trial summary record represents a statistical aggregation of the raw 50 Hz samples belonging to the same welding attempt. Metadata fields such as timestamp and trial order allow longitudinal organization across repeated trials and recording days, whereas session labels were assigned during the analysis stage from the recorded dates.
Consequently, the hierarchical dataset enables analysis at two complementary levels:
This linkage enables examination of how changes in low-level motor behavior, including trajectory organization and smoothness, relate to task-level performance across repeated practice, thereby supporting quantitative analysis of longitudinal trajectory behavior.
4. Task-Space Projection and Kinematic Feature Extraction
To quantify dynamic trajectory behavior during welding, the computational framework first projects raw high-frequency trajectories into a task-specific representation defined by the weld seam geometry. Based on this mathematical formulation, derivative-based and smoothness-related kinematic features were extracted to characterize process-level movement organization. Feature extraction for LNJ, SPARC, and NVP was performed using the projected and smoothed seam-wise speed signal, whereas descriptive performance metrics (e.g., MAE and RMSE) were obtained from the corresponding trial-level summaries.
Let the sampling interval be s (50 Hz). Although the recorded dataset also included lateral deviation, torch orientation, and contact tip to work distance, the derivative-based smoothness features in this section were extracted primarily from the seam-projected welding-speed signal .
4.1. Path Parameterization and Signal Preparation
To provide a task-specific interpretation of welding motion, the movement was represented conceptually as a one-dimensional curvilinear progression along the ideal weld seam. Let
denote the seam length. For each time sample
t, the torch contact point
was orthogonally projected onto the seam segment using the projection defined in Equation (
3), yielding a time-varying normalized progress parameter
.
The corresponding path position
along the task axis is then defined as follows:
This parameterization provides the geometric basis for interpreting welding motion along the task axis rather than in unconstrained 3D controller space. In the present implementation, derivative-based smoothness features were extracted from the recorded seam-projected welding-speed signal, which represents effective progression along the weld seam. This formulation allows the analysis to emphasize task-relevant longitudinal motion while limiting the interpretive influence of lateral and vertical oscillations unrelated to seam-following performance.
4.1.1. Effective Travel Speed
The variable
Welding_Speed represents the effective travel speed along the weld seam rather than the raw 3D velocity magnitude. In the implementation, this quantity was obtained by projecting the incremental torch-tip displacement onto the seam tangent direction and dividing by the sampling interval. This corresponds to the effective progression speed along the task axis and is expressed as follows:
Accordingly, the recorded speed is robust to vertical or lateral hand oscillations and reflects progression along the seam rather than unconstrained motion in 3D space.
4.1.2. Active-Motion Detection and Threshold Rationale
Some trials contained temporary pauses, micro-pauses, or incomplete weld segments. Since derivative-based smoothness metrics are sensitive to stationary intervals, an active-motion mask was applied to ensure that kinematic features characterized active task progression. A sample was considered part of active welding if the seam-projected travel speed exceeded a minimum threshold:
where
was selected as a conservative threshold for excluding quasi-static samples and minimizing the influence of sensor noise during idle periods.
This threshold was selected to avoid treating near-stationary samples as effective task progression, based on three practical considerations: (i) conservative exclusion of quasi-static samples, (ii) reduction in the influence of very small fluctuations that may produce unstable derivative estimates, and (iii) consistency with the physical characteristics of the welding task, where sustained travel speeds below 1 mm/s are not representative of effective seam progression. All derivative-based smoothness and fragmentation features (LNJ, SPARC, and NVP) were computed only within the active-motion windows, so as to prevent near-stationary periods from biasing the resulting metrics.
4.2. Acceleration, Jerk, and Log-Normalized Jerk (LNJ)
Temporal derivatives were computed from the smoothed seam-projected speed signal using discrete numerical differentiation. Acceleration
and jerk
were defined as follows:
where the derivatives were estimated numerically from the smoothed speed signal using discrete gradient operations. These derivatives characterize temporal fluctuations in effective seam-wise progression and provide the basis for jerk-based smoothness analysis.
Because raw jerk magnitude depends on movement duration and movement amplitude, a scale-independent smoothness metric was computed using LNJ. In the present implementation, LNJ was derived from the smoothed seam-projected welding-speed signal. Let
denote the numerically estimated jerk term obtained from discrete differentiation of the smoothed speed signal. LNJ was computed as follows:
where
T is the active movement duration and
A is the effective path length during active motion. In the implementation,
A was approximated from the active-motion speed signal as follows:
where the summation is taken over samples satisfying the active-motion criterion
. The active duration was computed as
, where
N is the number of active-motion samples. The jerk integral was approximated numerically from discrete samples:
The logarithm compresses the dynamic range and improves distributional stability for subsequent statistical analysis. Lower LNJ values indicate smoother motor execution.
Mitigating Trial Duration Bias in LNJ
To reduce sensitivity to movement duration and amplitude, the normalization factor was used so that LNJ would reflect movement smoothness more consistently across trials with different active durations.
4.3. Spectral Arc Length (SPARC)
As a complementary smoothness metric, SPARC was computed from the recorded seam-projected welding-speed signal. Let
denote the normalized magnitude spectrum of the signal. SPARC is defined as follows:
where
is a cutoff frequency bounded by 10 Hz. In general, smoother movements exhibit reduced high-frequency content and, therefore, yield higher (less negative) SPARC values (i.e., values closer to zero).
4.3.1. SPARC Computation Details (Reproducibility)
To ensure reproducibility and spectral consistency across trials of varying lengths, SPARC was computed using the following processing pipeline in Python 3.13.12 (SciPy/NumPy):
De-Meaning: The active-motion speed segment was mean-centered prior to spectral analysis to remove DC bias.
Windowing: A Hann (Hanning) window was applied to the active-motion segment to reduce spectral leakage at segment boundaries.
Zero-Padding: The windowed signal was zero-padded to a fixed FFT length of (or the next power of two if longer), ensuring consistent frequency sampling across trials.
Normalization: The magnitude spectrum was normalized by its maximum value to obtain a dimensionless spectrum
:
Cutoff Frequency: Integration was performed up to an adaptive cutoff frequency capped at 10 Hz. In the implementation, was defined as the highest non-negative frequency for which the normalized spectrum was at or above of its peak magnitude. Only the non-negative frequency bins () were retained for SPARC computation.
4.3.2. Mitigating Trial Duration Bias in SPARC
SPARC is inherently robust to movement duration due to its dimensionless frequency-domain formulation. In addition, the fixed FFT length via zero-padding ensures comparable spectral sampling across trials, so differences in SPARC primarily reflect differences in relative velocity-profile complexity rather than trial length.
4.4. Number of Velocity Peaks (NVP)
Movement fragmentation was quantified by the number of velocity peaks (NVP) extracted from the smoothed seam-projected speed signal. Peaks were identified using a prominence-based local-maximum detection procedure applied to the smoothed speed profile. A peak candidate at
satisfied the local-maximum condition:
To exclude residual small fluctuations and count only functionally meaningful sub-movements, two robustness constraints were applied:
Minimum Prominence: A peak was counted only if its prominence exceeded , where is the maximum speed in the trial (computed over active motion). This relative criterion enables comparison across participants with different speed ranges.
Minimum Temporal Separation: Consecutive peaks were required to be separated by at least 300 ms to avoid multiple counts of the same event.
Peak detection was performed only within active-motion windows (). Higher NVP values indicate more fragmented and intermittent movement profiles.
4.5. Variability Measures
Unless otherwise stated, variability measures were computed as trial-level standard deviations over the recorded samples retained after temporal trimming. Motor stability was further summarized using variability descriptors derived from the recorded trial samples:
These measures capture fluctuations in progression control, orientation stability, and electrode distance regulation, respectively. In addition, variability in lateral deviation was summarized at the trial level using MAE, RMSE, and standard deviation, as described in the dataset section.
4.6. Feature Interpretation
The extracted feature set was organized into two complementary dimensions to separate task-level success from the underlying trajectory organization:
Outcome-Based Performance (what was achieved): Spatial error descriptors (e.g., MAE_Lateral, RMSE_Lateral, percentiles) quantify welding-path accuracy relative to the predefined weld seam.
Process-Based Trajectory Organization (how it was achieved): Kinematic smoothness and intermittency features (LNJ, SPARC, NVP) characterize movement organization, distinguishing fragmented and intermittent control from smoother and more continuous execution.
By jointly analyzing outcome and process metrics, this study enables quantitative assessment of how task performance and movement organization evolve across repeated sessions.
4.7. Sensitivity Analysis for System Robustness
To examine robustness under non-ideal conditions relevant to real-world industrial environments, a synthetic sensitivity analysis was conducted on the proposed task-space kinematic framework. Artificial Gaussian noise () was systematically added to the seam-projected welding-speed signal used for derivative-based feature extraction. Specifically, low ( mm/s), moderate ( mm/s), and high ( mm/s) noise levels were applied. The noise-perturbed signals were then processed through the same smoothing and feature-extraction pipeline used in the main analysis.
As summarized in
Table 4, SPARC and LNJ showed only limited deviation under low and moderate noise levels relative to the baseline. For example, the mean SPARC value changed from
at baseline to
and
under low and moderate noise, respectively, while the mean LNJ value changed from
to
and
, respectively. Under the high-noise condition, larger deviations were observed, indicating the expected reduction in stability under stronger perturbation. Overall, these findings suggest that the proposed framework retains reasonable robustness under perturbed measurement conditions, particularly in low-to-moderate noise regimes, and may therefore remain applicable to future online monitoring and inference settings beyond strictly idealized measurement conditions.
5. Statistical Analysis
All analyses were designed to evaluate changes in welding performance and movement organization across repeated trials and sessions. Because the dataset contained repeated observations from the same participants, both descriptive longitudinal summaries and inferential mixed-effects models were used. Descriptive analyses were used to visualize early trajectory changes, normalized progress, and between-session retention, whereas inferential analyses were used to quantify trial-related performance trends while accounting for within-participant dependency.
5.1. Longitudinal and Session-Based Analyses
To examine performance evolution over practice, trials were first ordered chronologically within each participant to obtain a cumulative trial index. Early trajectory changes were evaluated using the first ten cumulative trials recorded for each participant. Because the number of available observations varied across cumulative-trial positions, the resulting early trajectory-change patterns were interpreted descriptively, with particular caution for the later trial positions.
In addition, because the total number of valid trials differed across participants, the full trial sequence of each participant was normalized into ten equally sized progress bins representing relative progress from 10% to 100%. For each cumulative trial position or normalized progress bin, descriptive summaries were visualized using mean values with standard-error bands. This procedure was used to examine changes in spatial error, smoothness, fragmentation, and temporal stability over repeated practice.
To examine short-term retention across sessions, recording dates were mapped to session labels according to their chronological order in the experiment. The experiment thus comprised three temporally separated sessions. For retention analysis, the first valid recorded trial within each session was extracted for each participant. Retention was evaluated descriptively, using distributional comparisons of spatial error rather than formal repeated-measures hypothesis testing.
To quantify longitudinal performance trends while accounting for repeated measurements within participants, Linear Mixed-Effects (LME) models with participant-specific random intercepts were fitted for the trial-level metrics
MAE_Lateral,
SPARC,
LNJ, and
NVP. These models were specifically selected because they can accommodate unbalanced longitudinal data, allowing population-level effects to be estimated without requiring an equal number of trials for each participant. For each dependent variable
measured for participant
i at trial
j, the following longitudinal progression model was fitted:
where
denotes the cumulative trial index for participant
i at observation
j,
is the fixed intercept,
represents the average trial-by-trial effect,
is the participant-specific random intercept, and
is the residual error term.
To assess whether trial-related effects were robust to session-related differences, a second model was fitted by additionally including session as a categorical fixed effect:
where
denotes the session associated with observation
j for participant
i. The cumulative-trial coefficient
was interpreted as the average trial-by-trial change in the corresponding metric after accounting for between-participant variability, whereas the session coefficients were interpreted as differences relative to the reference level (Session 1). This second model therefore allowed the assessment of whether trial-related trends persisted after session adjustment, as well as whether systematic between-session differences were present.
Model estimates were reported together with standard errors, Wald z statistics, p-values, 95% confidence intervals, and the number of observations included in each model. Because derived kinematic features were not available for all trials after signal-quality screening and feature extraction, the number of observations differed modestly across models. However, missingness in the derived kinematic metrics remained low overall, allowing the mixed-effects analyses to be performed on nearly the full set of valid trial-level observations.
5.2. Association Analysis and Implementation
The relationship between task-level performance and process-level kinematic organization was examined using Spearman’s rank correlation analysis. Specifically, associations between MAE_Lateral and the kinematic metrics LNJ, SPARC, and NVP were evaluated. This non-parametric approach was selected because these metrics may exhibit non-normal distributions and monotonic rather than strictly linear relationships. Correlation analyses were performed on complete-case trial-level observations for each metric pair after restricting the analysis to trials with valid values for both variables. Because missingness after feature extraction was low, the complete-case correlation sample remained close to the full analytic sample.
All preprocessing, feature extraction, descriptive analyses, and statistical computations were performed in Python 3.13.12 using NumPy 2.4.4, Pandas 3.0.2, SciPy 1.17.1, Matplotlib 3.10.9, Seaborn 0.13.2, and statsmodels 0.14.6. Mixed-effects models were fitted with Restricted Maximum Likelihood (REML), using participant as the grouping factor for the random intercept term. The significance level was set to . Missingness in the derived kinematic features was quantified to assess data completeness and the extent of exclusions introduced during the feature-extraction stage.
6. Results
This section reports the quantitative findings from the longitudinal analysis of the VR welding trajectory dataset. The results are organized into five parts: (i) early changes in task-space spatial accuracy, (ii) longitudinal changes in dynamic smoothness and fragmentation metrics, (iii) temporal stability of seam-wise progression, (iv) between-session preservation of trajectory behavior, and (v) associations between geometric error and process-level kinematic descriptors.
This study included participants who completed repeated welding trials across multiple sessions. Following preprocessing, outlier screening, and metric-specific signal-quality checks, the number of valid trial-level observations differed modestly across analyses. The mixed-effects models were fitted on 301 observations for MAE_Lateral, 292 for SPARC, and 293 for both LNJ and NVP. Missingness in the derived kinematic metrics remained low (SPARC: 2.99%, LNJ: 2.66%, NVP: 2.66%), indicating good overall data completeness.
6.1. Early Adaptation and Spatial Performance over Practice
Trajectory changes during the initial stage of practice were examined using the first ten cumulative trials.
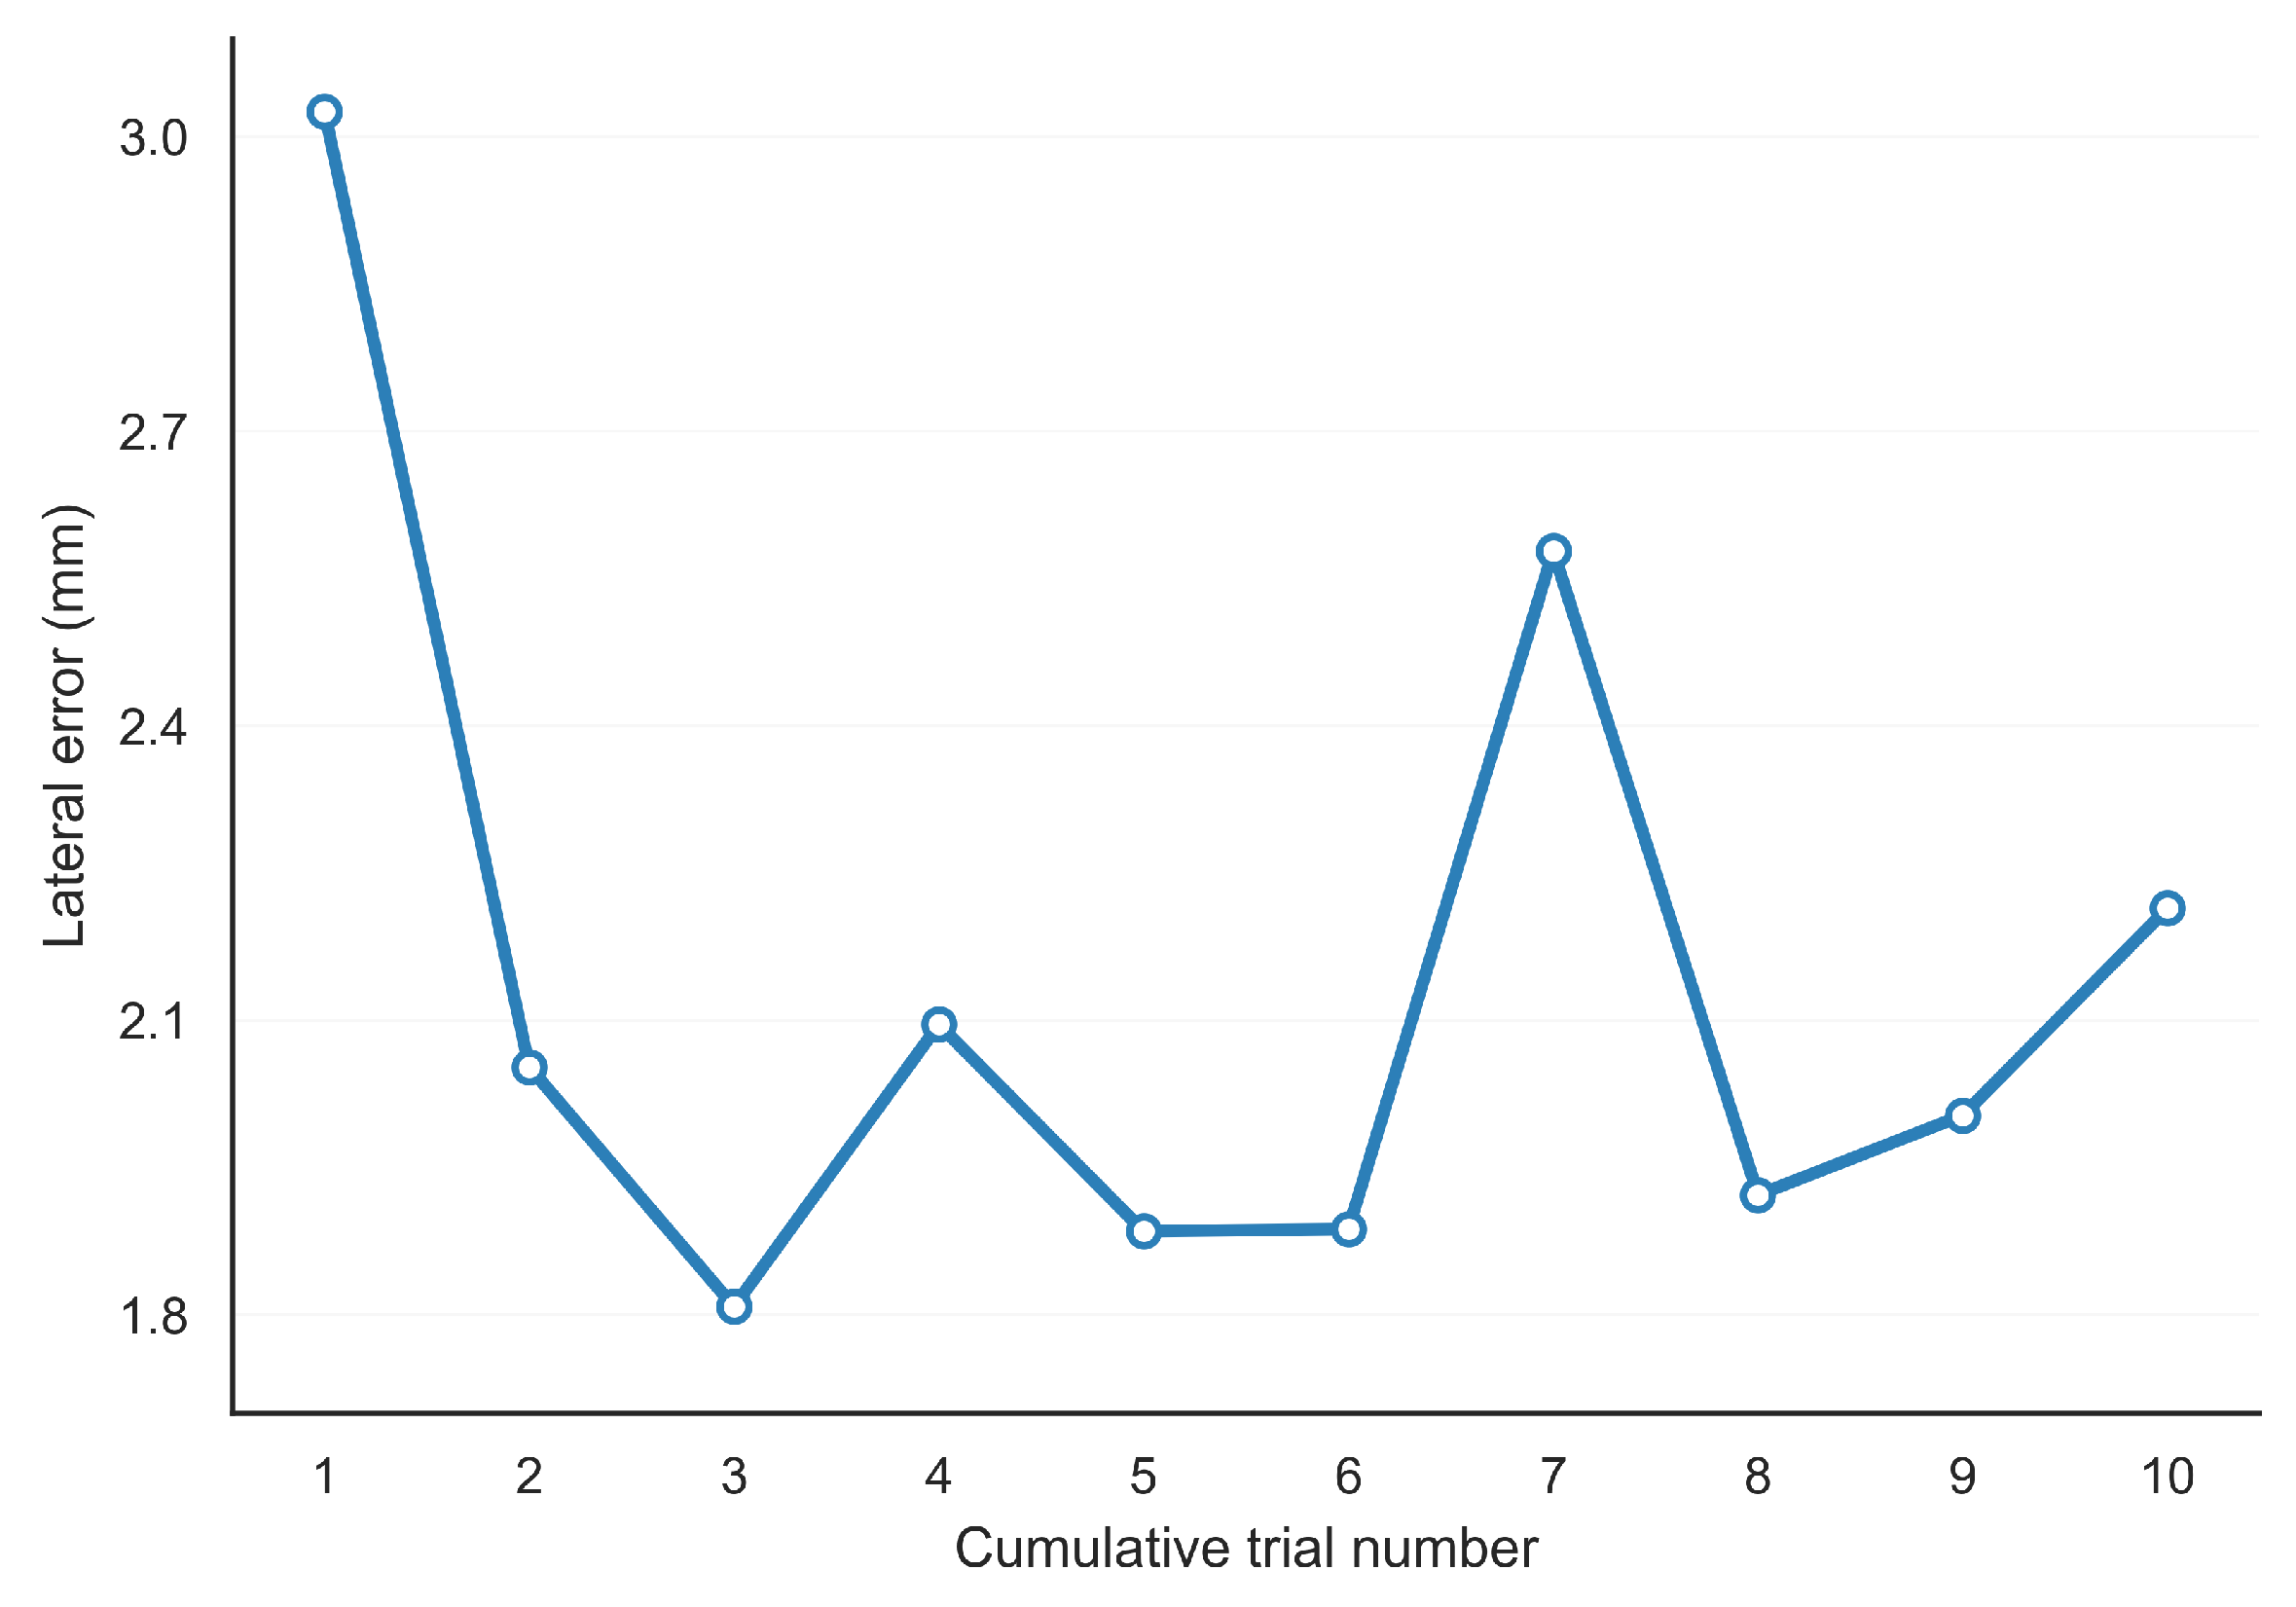
Figure 4 shows the evolution of mean lateral welding error across these initial repetitions.
A clear reduction in spatial error was observed during the earliest repetitions. The mean absolute lateral error (MAE) decreased from approximately mm in the first trial to approximately mm in the second trial, indicating rapid initial adaptation. The lowest mean error within the first ten cumulative trials was observed around the third trial (approximately mm). After this early decline, spatial error did not continue to decrease monotonically. Instead, it fluctuated across the subsequent cumulative trials, remaining mostly around the 2.0–2.3 mm range, with recurrent elevations after the third trial, particularly around the fifth, seventh, ninth, and tenth trials. Overall, the descriptive pattern suggests a rapid early improvement followed by relative stabilization with continued fluctuations, rather than a steady trial-by-trial decline.
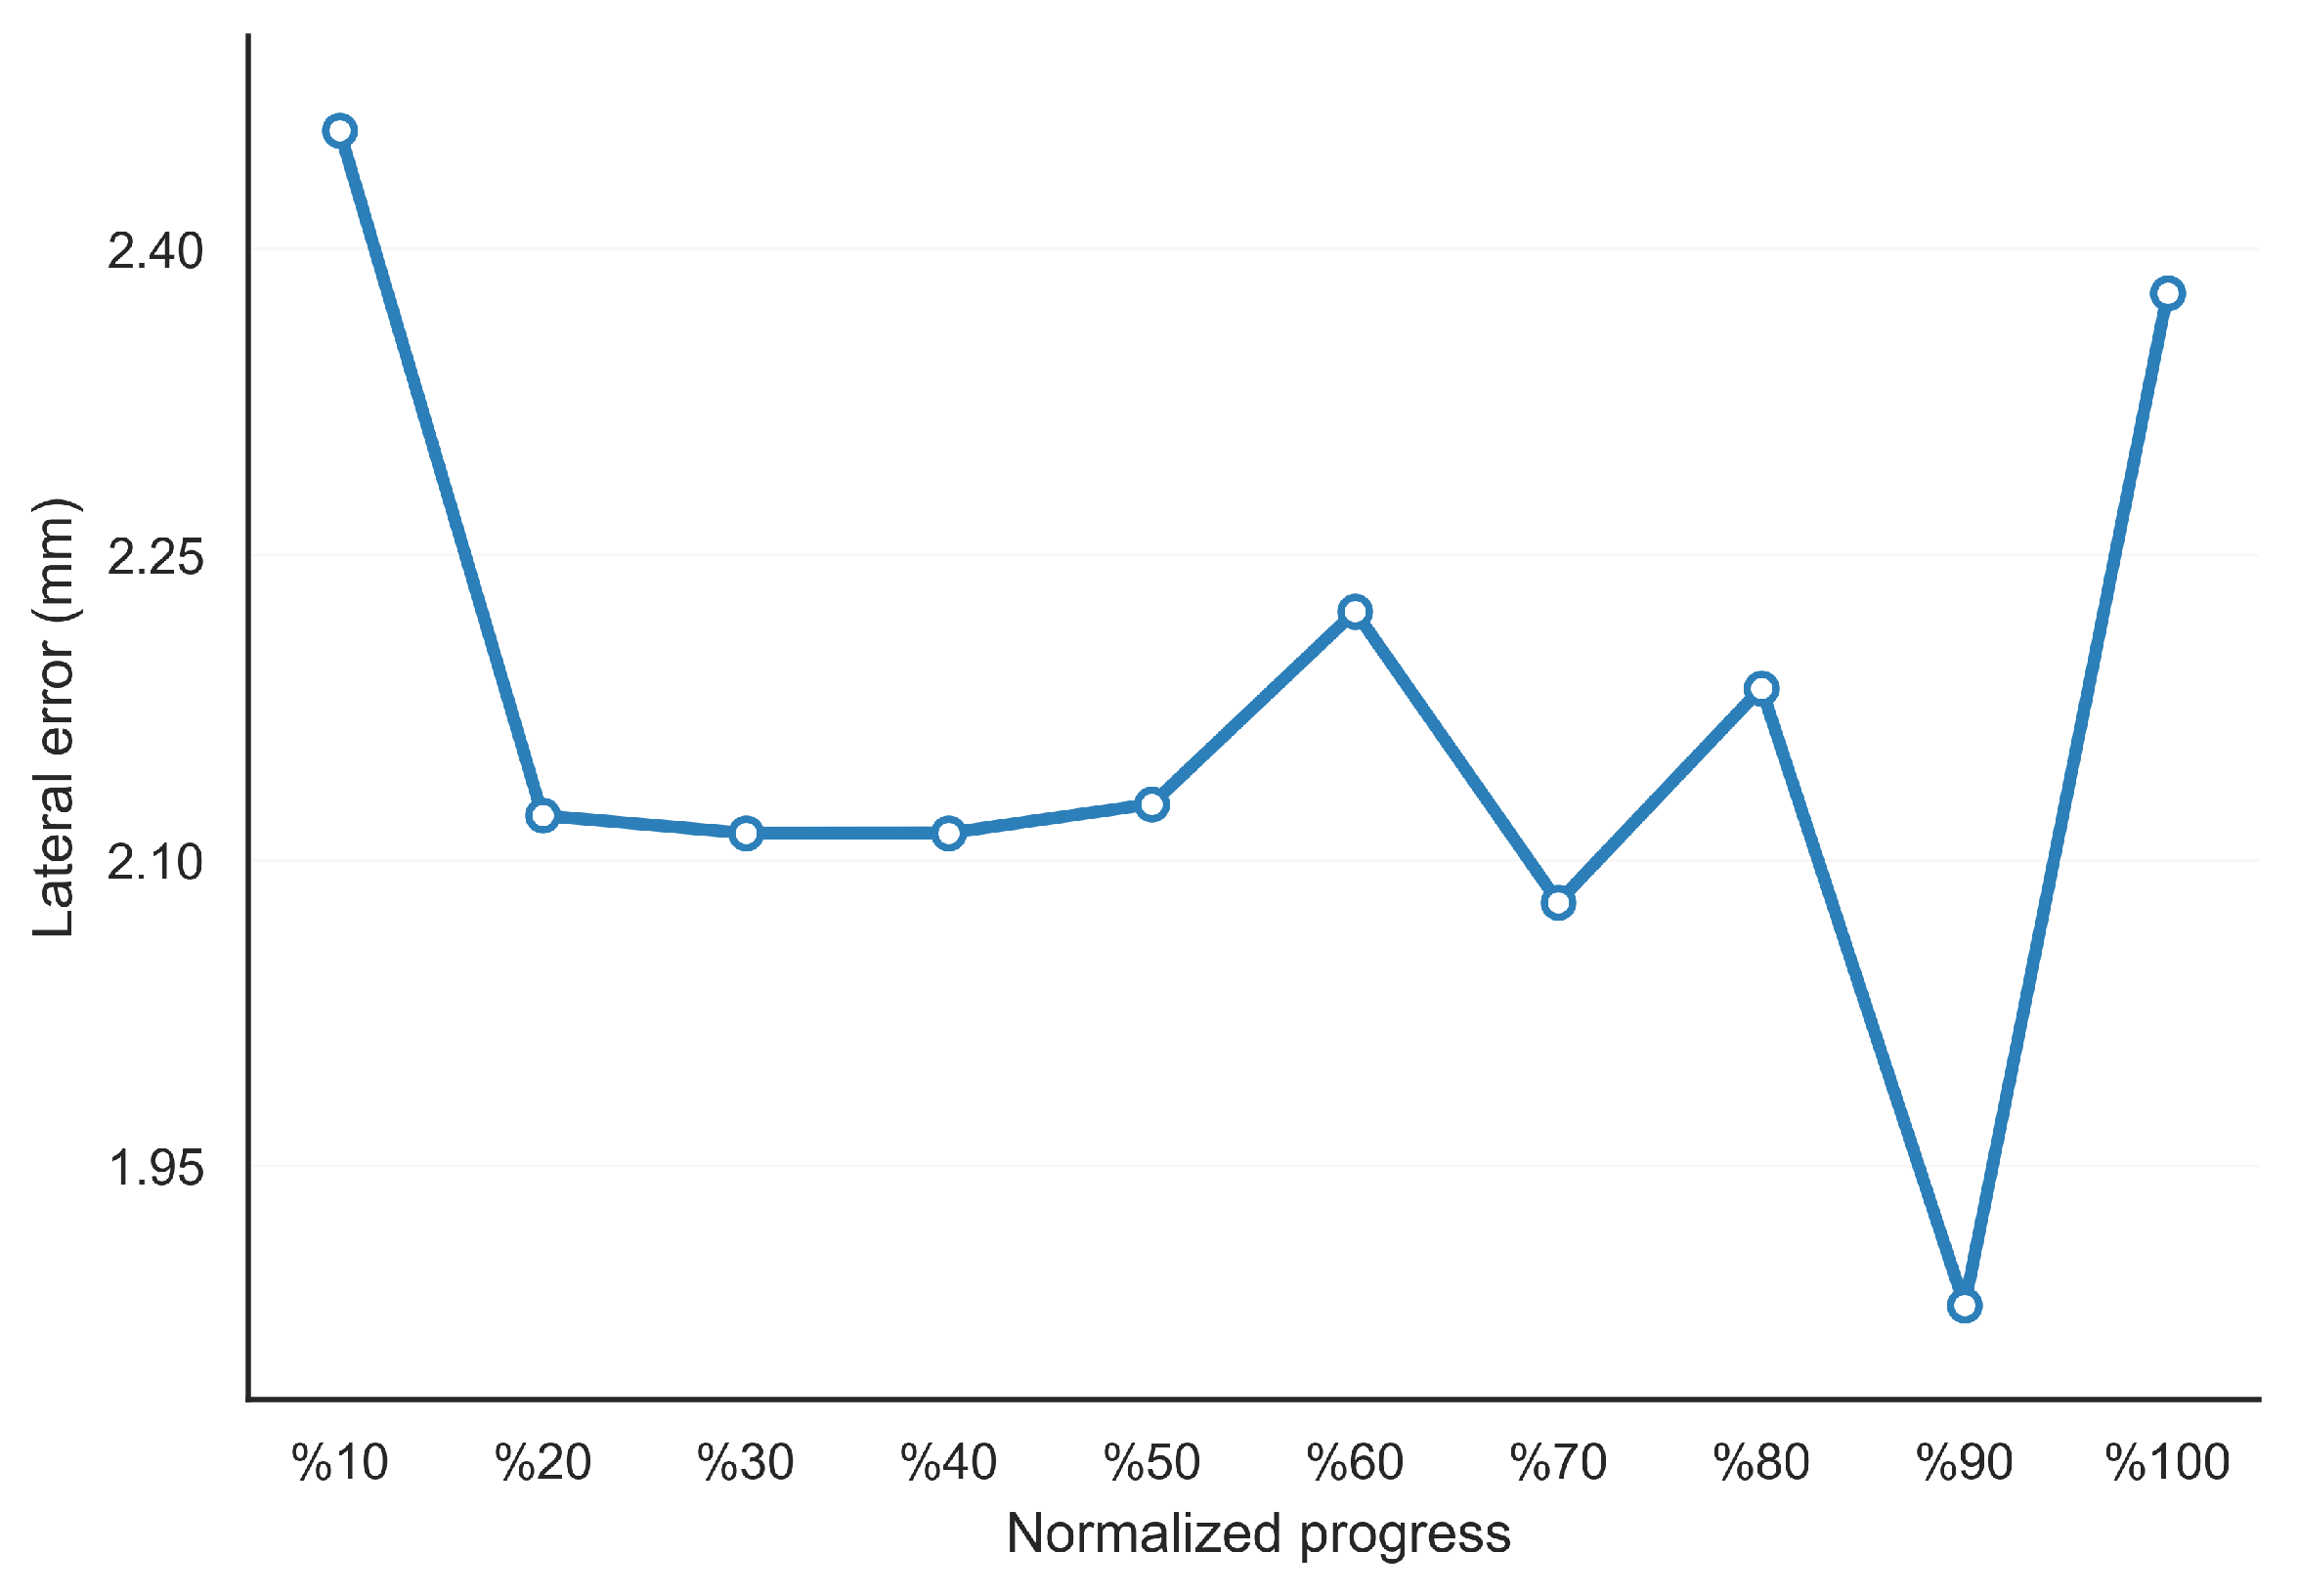
To evaluate spatial performance across the full experimental process, trials were additionally normalized into ten equally sized bins representing relative progress for each participant.
Figure 5 presents the mean MAE across these normalized progress bins.
Across normalized progress, spatial accuracy remained within a relatively narrow range, with mean MAE values fluctuating approximately between and mm. The highest mean error was observed in the earliest progress bin (10%), followed by a reduction during the early phase of repeated practice. The lowest mean value occurred around 30% of normalized progress. Thereafter, the error trajectory remained clearly non-monotonic, with alternating increases and decreases across the middle and later progress bins. Comparatively low values were also observed around 60%, 80%, and especially 90% of normalized progress, whereas the final bin showed a renewed increase in mean error. The renewed increase in mean error observed in the final progress bin may reflect an end-of-session effect, potentially related to fatigue or reduced attentional stability, since this bin corresponds to the last trials completed by each participant. This late-stage increase should also be interpreted cautiously, because the normalized progress bins become descriptively less stable toward the end of the sequence as the number of contributing observations varies across participants. Overall, the descriptive pattern indicates rapid early spatial adaptation, followed by broadly stable but variable performance across the remainder of the observation period.
The mixed-effects analysis did not support this descriptive pattern as evidence of a robust overall longitudinal improvement. In the learning-progression model with participant-specific random intercepts, the cumulative-trial index showed a negative but non-significant effect on MAE_Lateral (, , , , 95% CI [, ]). After additional adjustment for session, the cumulative-trial effect remained negative but non-significant (, , , , 95% CI [, ]). Thus, although the descriptive trajectories suggested early improvement in spatial accuracy, the mixed-effects models did not provide statistical evidence for a consistent overall reduction in spatial error across repeated trials.
Overall, the results suggest that the clearest gains in spatial accuracy occurred during the earliest stage of practice, after which performance fluctuated without a consistent progressive trend.
6.2. Longitudinal Changes in Smoothness and Movement Fragmentation
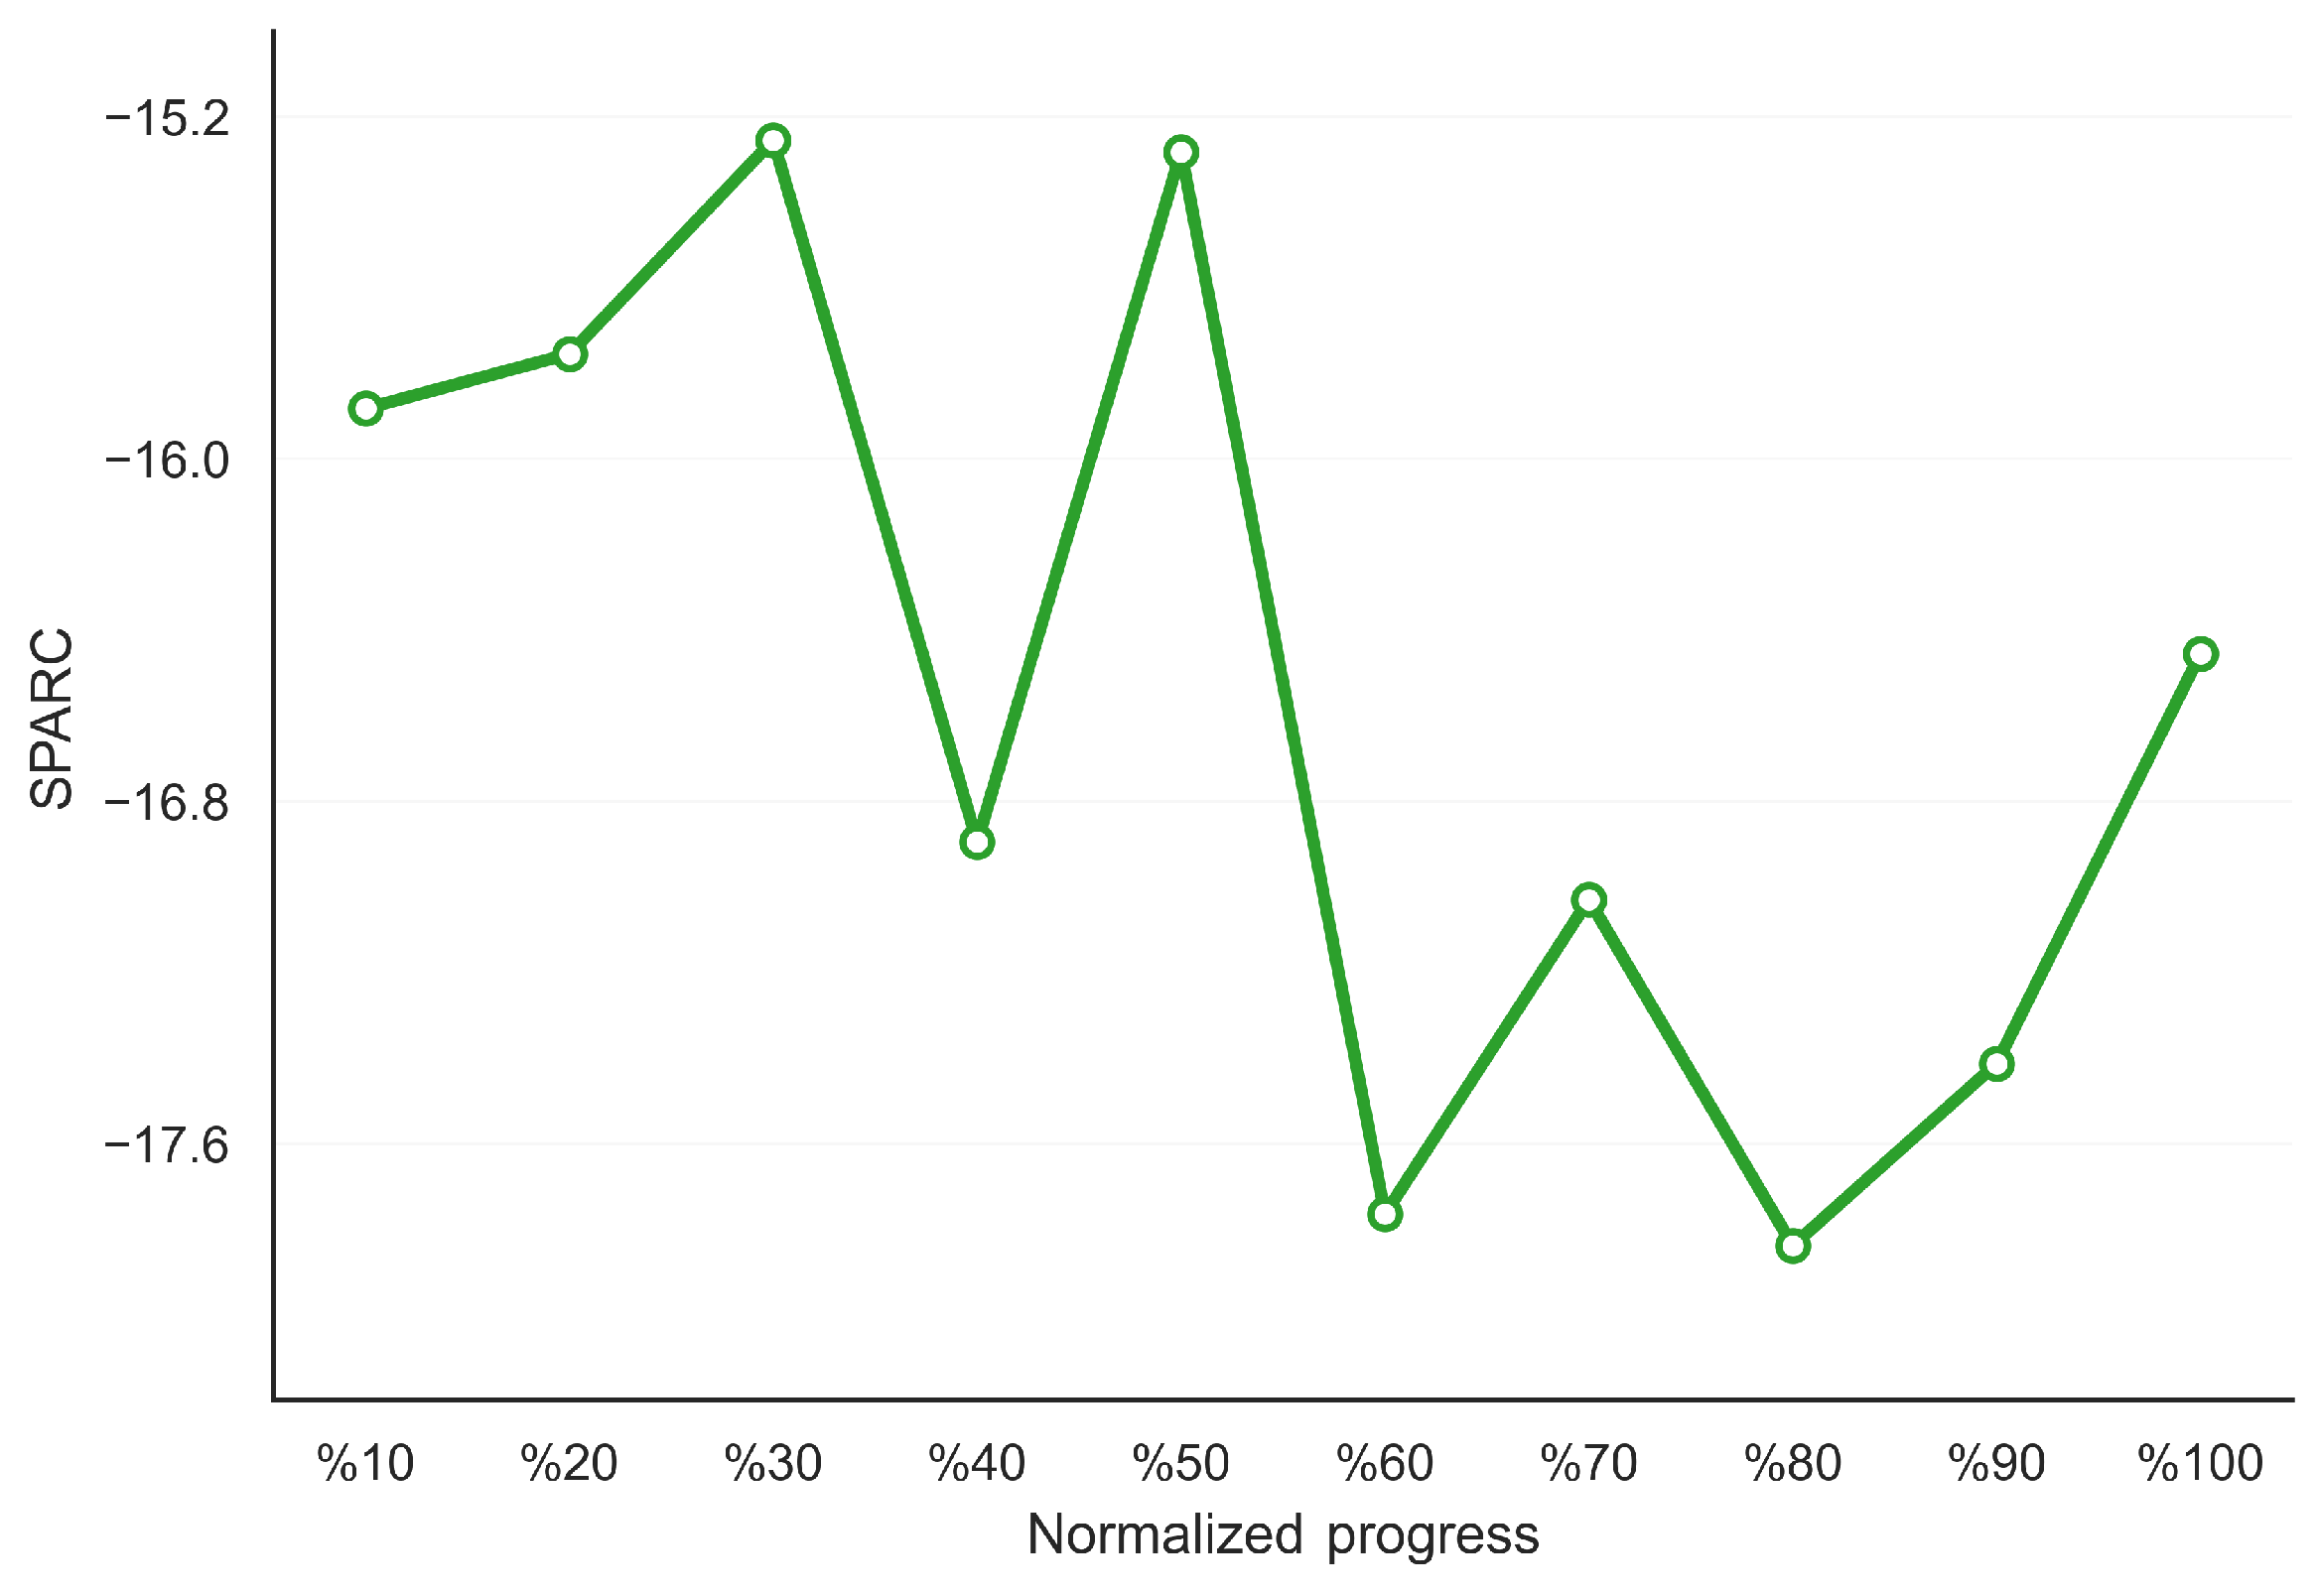
Movement smoothness was evaluated using the spectral arc length (SPARC) metric derived from the seam-projected welding-speed signal.
Figure 6 shows the evolution of SPARC values across normalized progress.
In contrast to the early descriptive reduction in spatial error, SPARC did not show a consistent monotonic improvement across the observation period. Descriptively, SPARC values became less negative from the earliest progress bins to approximately 30% of normalized progress, indicating smoother execution during the early phase of practice. This early improvement was not sustained thereafter. Instead, SPARC fluctuated markedly across the middle and later progress bins, with a pronounced drop around 40%, a temporary recovery around 50%, and substantially more negative values around 60–80%. A partial recovery was again observed toward the final bin. Overall, this pattern indicates substantial fluctuation in movement smoothness over practice, rather than a stable progression toward smoother execution.
This descriptive pattern was only partially consistent with the mixed-effects analysis. In the learning-progression model with participant-specific random intercepts, the cumulative-trial index showed a significant negative effect on SPARC (, , , , 95% CI [, ]), suggesting a trial-related decline in spectral smoothness in the unadjusted model. However, after additional adjustment for session, this effect was no longer significant (, , , , 95% CI [, ]). Thus, the apparent trial-related change in SPARC was not robust after accounting for session-related variation.
Movement fragmentation was additionally examined using the number of velocity peaks (NVP).
Supplementary Figure S1 shows that NVP decreased from the earliest progress bins to approximately 30% of normalized progress, suggesting somewhat less fragmented motion during the early phase of practice, before increasing sharply again around 40% of normalized progress. Thereafter, NVP remained variable across the middle and later portions of training, with relatively elevated values recurring around 40%, 70%, 90%, and 100% of normalized progress. Overall, the descriptive pattern does not indicate a sustained reduction in movement fragmentation over practice.
In the mixed-effects analysis, NVP showed a positive but non-significant trial effect in the learning-progression model (, , , , 95% CI [, ]). After session adjustment, the cumulative-trial effect became negative but remained non-significant (, , , , 95% CI [, ]). Thus, the mixed-effects models did not provide statistical evidence for a consistent longitudinal change in movement fragmentation across repeated trials.
A similar pattern was observed for the log-normalized jerk (LNJ) metric.
Supplementary Figure S3 shows that the mean LNJ remained within a relatively narrow range across normalized progress, reaching its lowest values around 30% and 60% of normalized progress, and exhibiting a clear local peak around 70%. Overall, the LNJ values fluctuated without a clear monotonic trend, indicating that jerk-related smoothness did not progressively improve over repeated practice.
This interpretation was consistent with the mixed-effects results. In the learning-progression model, the trial-related effect for LNJ was positive but non-significant (, , , , 95% CI [, ]). After additional adjustment for session, the cumulative-trial effect became negative but remained non-significant (, , , , 95% CI [, ]). Thus, the mixed-effects models did not support a robust longitudinal improvement in jerk-related smoothness across practice.
Regarding session-level effects, the session-adjusted models indicated that differences between later sessions and Session 1 reached statistical significance for the kinematic smoothness metrics (SPARC, LNJ, and NVP), whereas no statistically significant session effect was found for MAE_Lateral. These session-level patterns are examined further in the retention analysis below.
Taken together, these findings indicate that the early descriptive improvement in spatial accuracy was not accompanied by a similarly robust and consistent improvement in movement smoothness or fragmentation metrics. Participants appeared to achieve better spatial performance before showing equally strong evidence of smoother, less fragmented, or more stable movement organization.
6.3. Temporal Stability of Progression
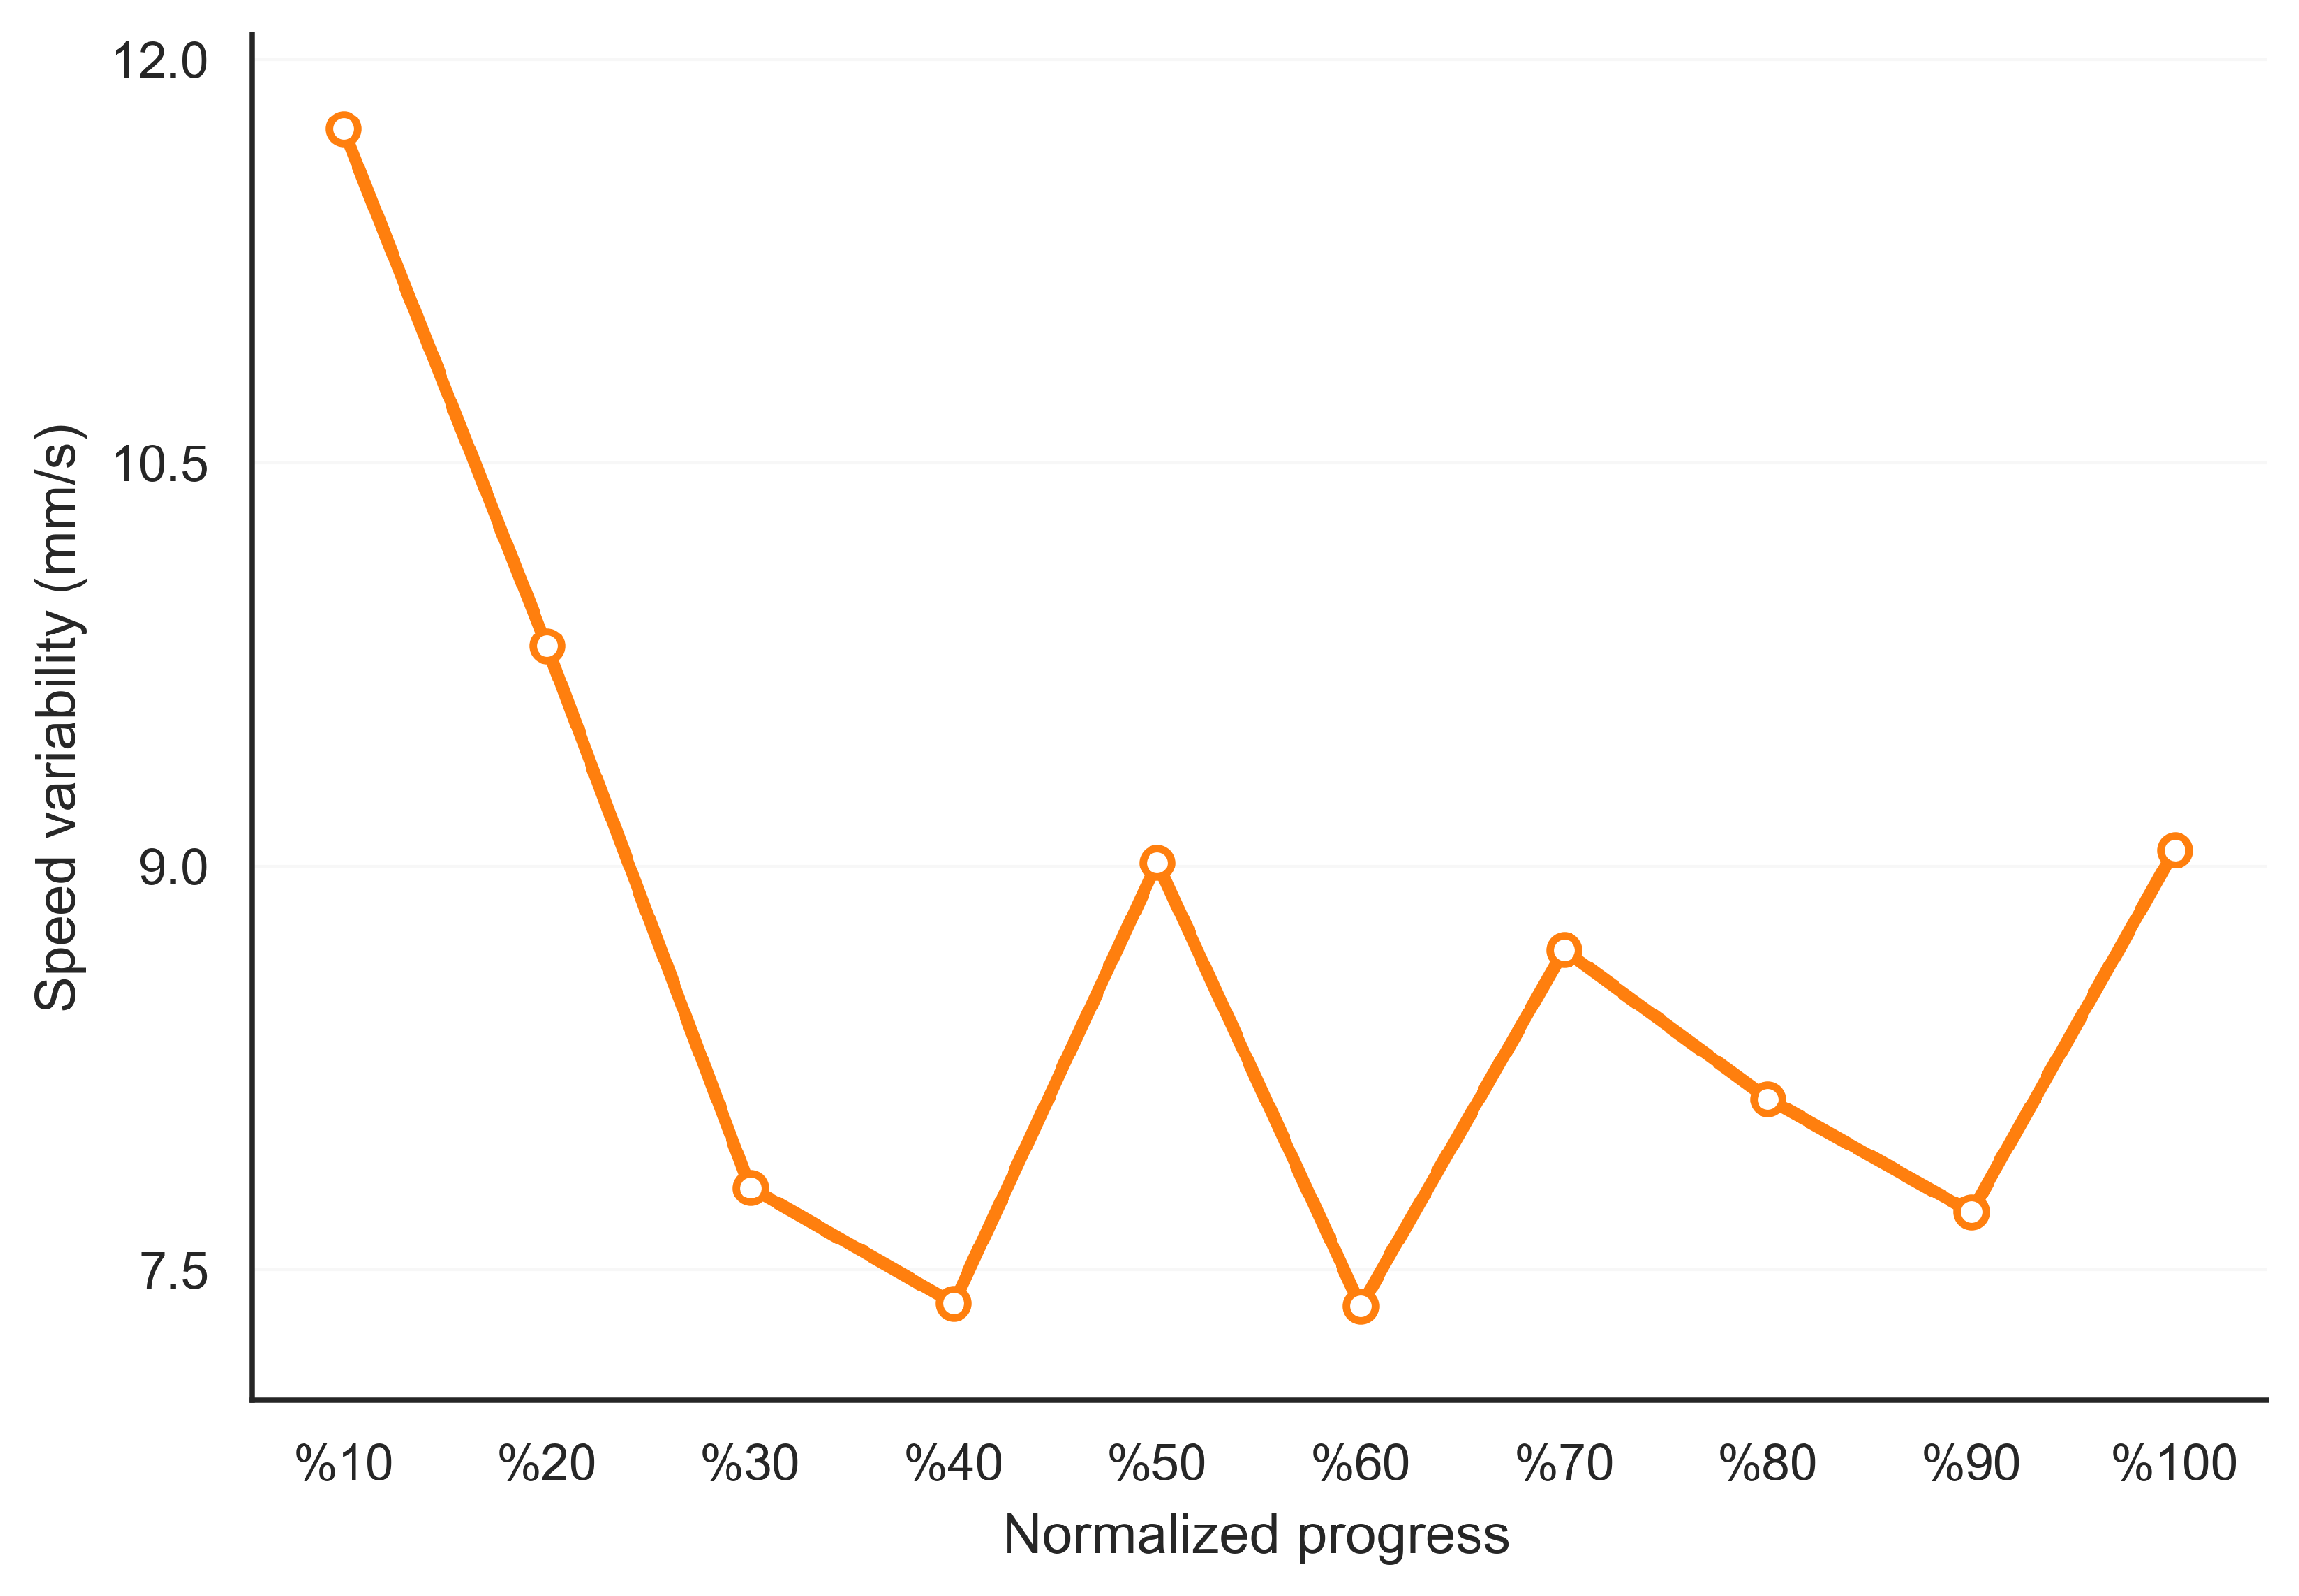
Temporal stability of welding motion was evaluated using the standard deviation of the seam-projected welding speed.
Figure 7 shows the variability in speed across normalized training progress.
Speed variability was highest at the earliest stage of repeated practice, with a mean standard deviation of approximately mm/s in the first progress bin, and was generally lower thereafter. A marked reduction was observed over the early phase of normalized progress, reaching comparatively low values around 40% and again around 60% of normalized progress. This early reduction, however, was not maintained as a monotonic trend across the full trial sequence. Instead, speed variability continued to fluctuate across the middle and later progress bins, with renewed increases observed around 50%, 70%, and in the final progress bin, where it again exceeded 9 mm/s. A similar increase in speed variability in the final progress bin may likewise reflect an end-of-session effect, potentially associated with fatigue or reduced movement consistency during the final trials. As with spatial error, this pattern should be interpreted descriptively and with caution, because the final normalized bin aggregates the last available trials from participants with differing total trial counts.
Overall, after the pronounced variability observed at the beginning of repeated practice, the speed variability remained within a moderate range across the later progress bins, fluctuating mostly between approximately and mm/s. Descriptively, this pattern indicates an early improvement in temporal stability, followed by a broadly stable but non-monotonic profile over the remainder of the observation period. Thus, although the participants appeared to reduce the large initial fluctuations in seam-wise progression, temporal stability did not improve in a consistent monotonic manner across the full training sequence.
6.4. Retention Across Sessions
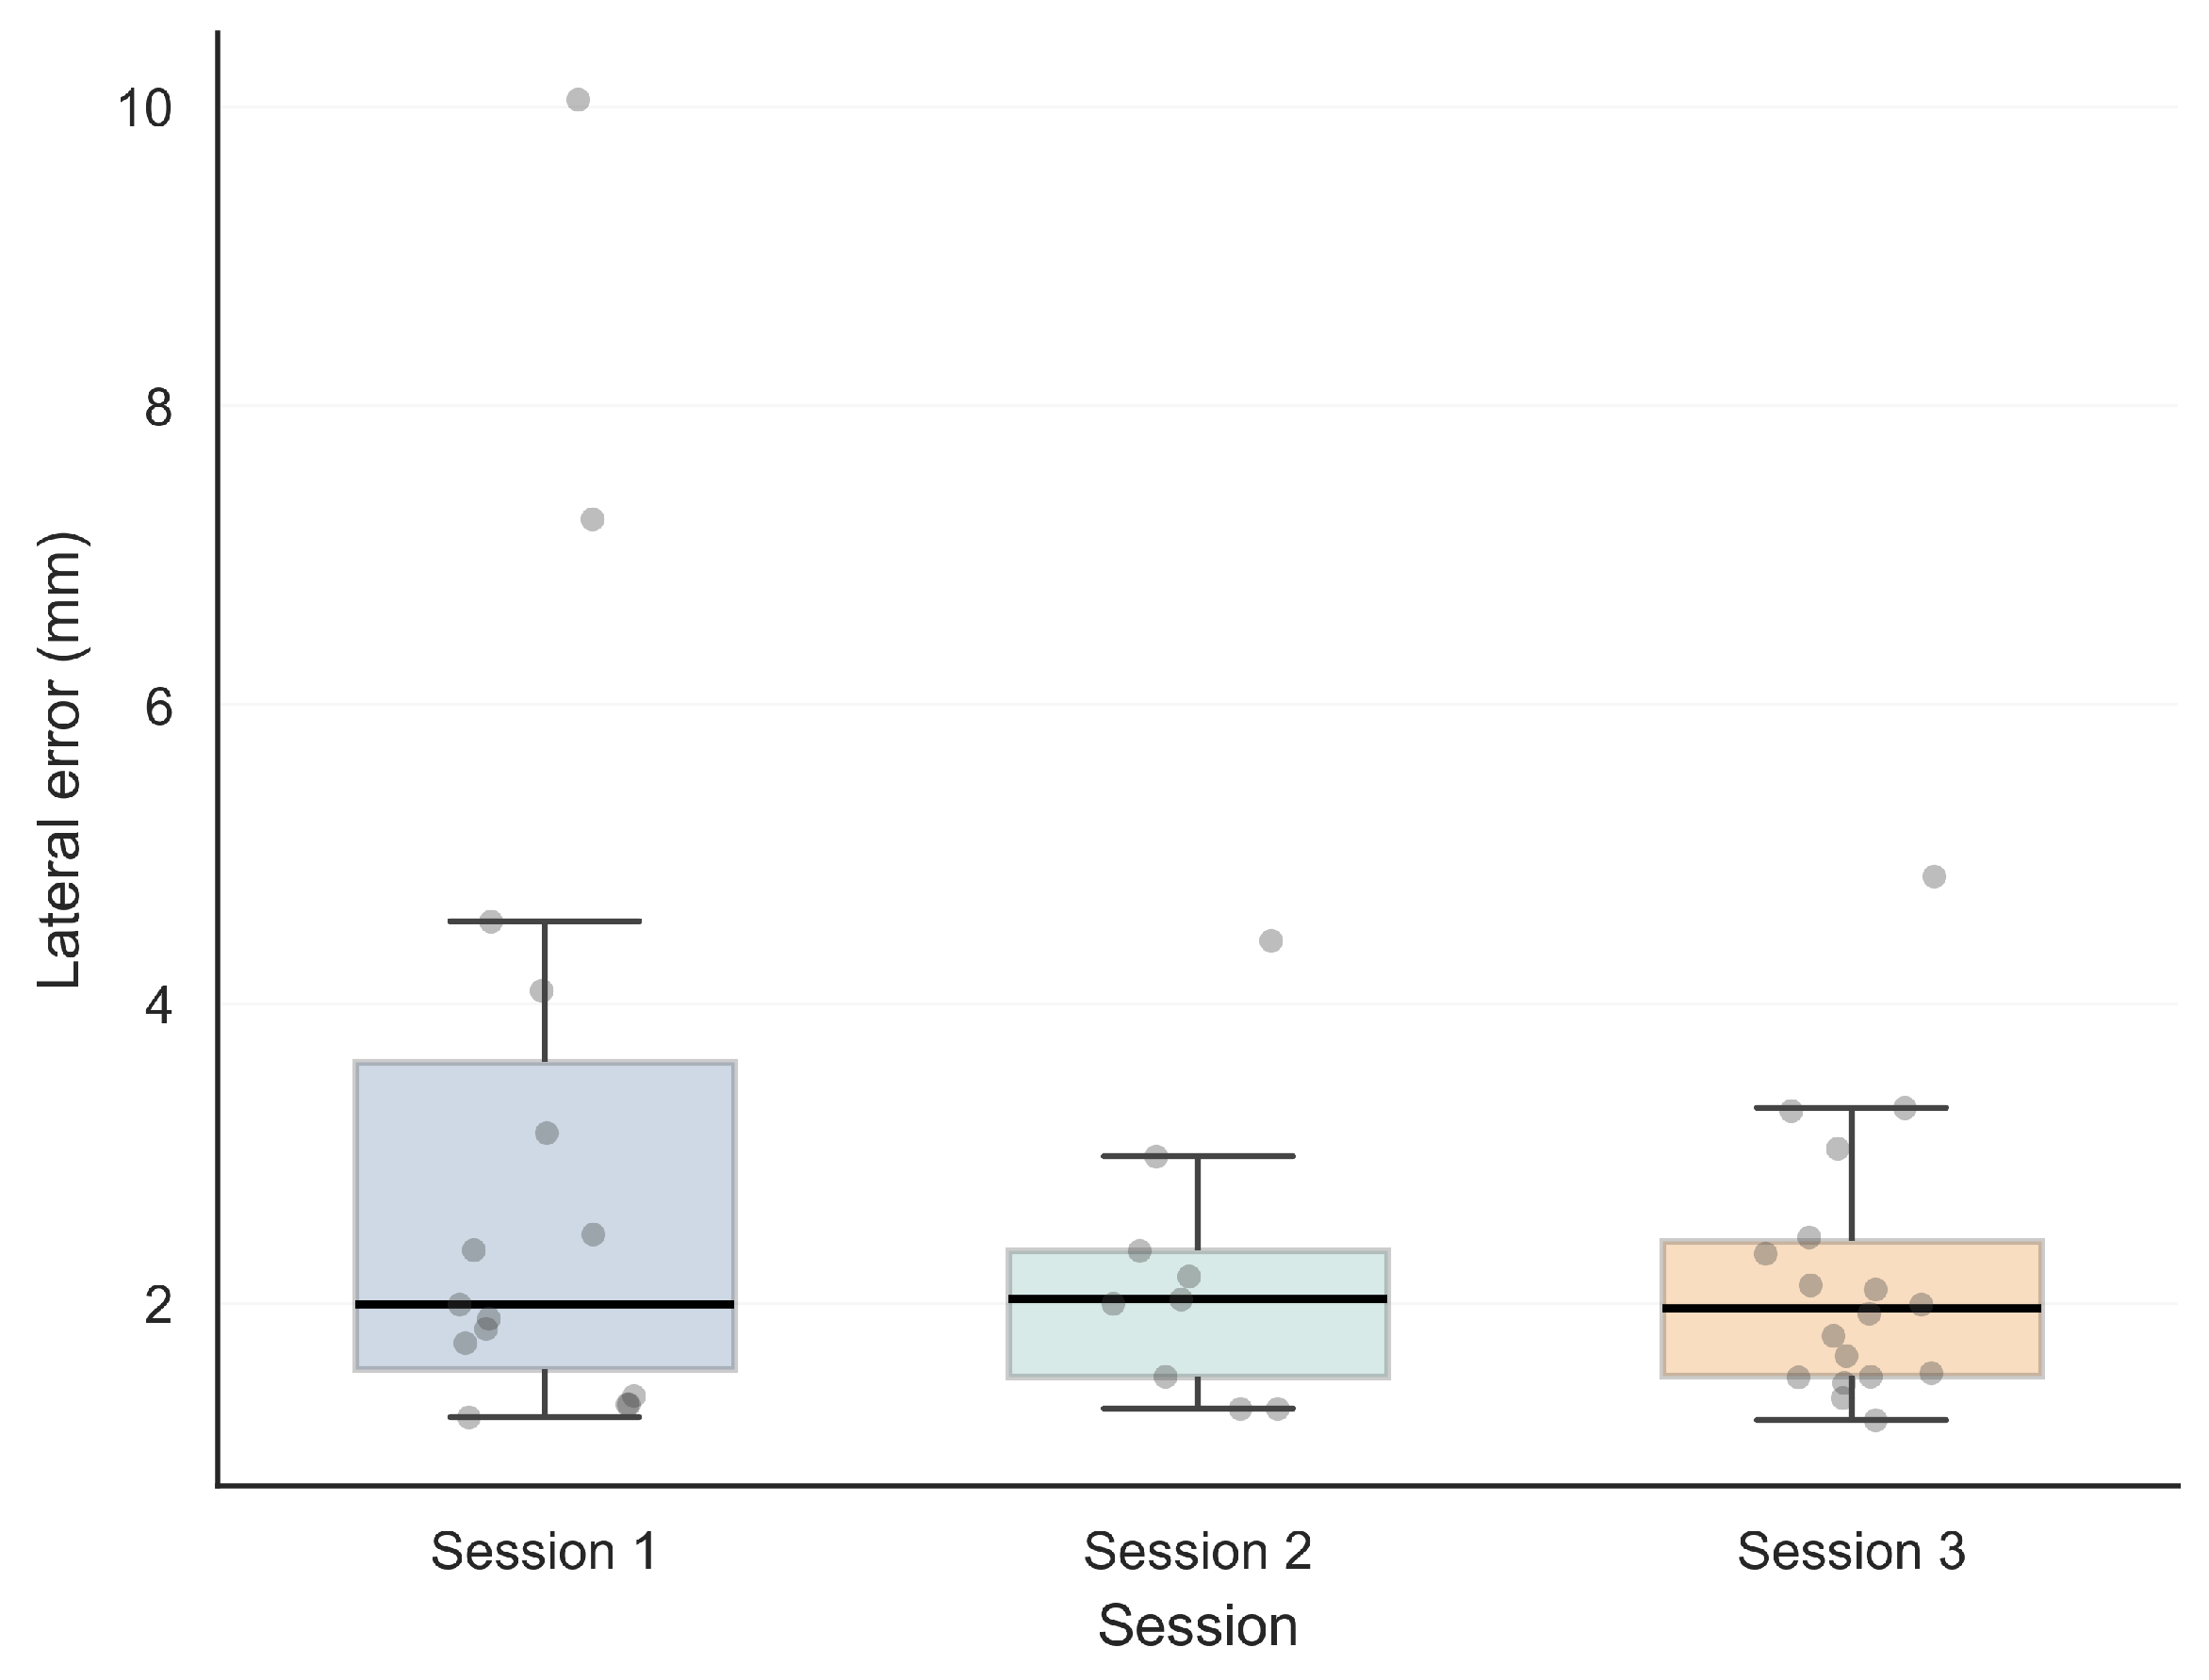
Retention was evaluated by comparing the first recorded trial of each training session for each participant. The protocol comprised three temporally separated training sessions. For each participant, the first valid trial from each session was extracted, and the resulting distributions were compared descriptively.
Figure 8 presents the distribution of MAE values across the three sessions.
The median spatial error remained broadly similar across sessions, with central values clustered near the 2 mm range. This descriptive pattern is consistent with broad preservation of the spatial control acquired during earlier practice as the participants entered subsequent sessions.
At the same time, the spread of the distributions differed across sessions. Session 2 showed the most compact distribution and the least apparent dispersion, whereas Sessions 1 and 3 exhibited wider spreads. Session 1 displayed the broadest distribution, including several high-error observations and the most extreme outlying value. Session 3 showed moderate dispersion, with most observations concentrated near the central range, but with a small number of higher-error observations extending upward.
Overall, these findings are consistent with short-term retention of task-relevant spatial performance in the VR welding task, while also indicating that performance variability persisted across sessions. These patterns should be interpreted descriptively, rather than as formal evidence of session-level differences.
6.5. Associations Between Spatial Accuracy and Kinematic Metrics
To examine the relationship between spatial performance and movement organization, Spearman rank correlation analysis was performed between MAE_Lateral and the kinematic smoothness and fragmentation metrics.
The analysis did not reveal a statistically significant association between spatial error and any of the examined process-level kinematic metrics. LNJ showed a weak positive but non-significant correlation with
MAE_Lateral (
,
,
), and NVP similarly showed a weak positive and non-significant association (
,
,
). SPARC showed a weak negative and non-significant association with spatial accuracy (
,
,
).
Supplementary Figure S2 further illustrates the substantial dispersion in the SPARC–MAE scatter pattern and the absence of a clear monotonic trend, supporting the interpretation that spectral smoothness of the velocity profile was not strongly related to spatial performance in the present VR welding task.
Overall, the correlation analysis suggests that outcome-based spatial accuracy and process-based movement organization were only weakly related in the present dataset. Although the directions of association were qualitatively plausible, with LNJ and NVP positively related and SPARC negatively related to spatial error, all correlations were small and non-significant.
7. Discussion
This study presents a data-driven framework for examining trajectory behavior in a VR welding environment using high-frequency kinematic measurements. Beyond descriptive educational evaluation, the proposed framework provides engineering value by transforming unconstrained human motion into a structured and physically interpretable task-space model. The findings show that VR-based motion logging can capture not only task-level outcomes such as spatial error but also process-level characteristics related to movement smoothness, fragmentation, and temporal control. In this sense, this study extends conventional simulation-based assessment beyond discrete grading scores, toward a quantitative analysis of how performance is produced. By establishing a measurable representation of dynamic trajectory behavior, the framework offers a methodological basis for future engineering applications, including motion-based quality monitoring, human-to-robot skill transfer studies, and the kinematic evaluation of industrial manipulation tasks in constrained manufacturing contexts.
A central finding was the presence of rapid early adaptation at the descriptive level. Spatial error decreased markedly during the earliest repetitions, and the descriptive results indicated relative stabilization with continued fluctuations across the remainder of training. However, the mixed-effects analyses did not show a statistically significant overall trial-related reduction in spatial error, either before or after session adjustment. Taken together, these findings suggest that early gains in spatial accuracy were concentrated in the earliest phase of practice, whereas subsequent changes across the broader training sequence were variable rather than systematically progressive.
In contrast, movement smoothness and fragmentation metrics did not show comparably robust improvement. SPARC, NVP, and LNJ all fluctuated across normalized training progress, and although the unadjusted mixed-effects model indicated a trial-related decrease in SPARC, this effect was no longer significant after session adjustment. Neither NVP nor LNJ showed a statistically significant trial-related change in the mixed-effects models. This indicates that descriptive improvements in task-level spatial performance were not accompanied by equally clear and robust reorganization toward smoother or less fragmented movement execution. Participants appeared to improve their spatial performance before showing equally clear evidence of refined movement organization.
None of the examined process-level kinematic metrics showed a statistically significant association with spatial accuracy. Although the directions of association were qualitatively plausible, with LNJ and NVP positively related and SPARC negatively related to spatial error, all correlations were small and non-significant. This suggests that outcome-based spatial performance and process-based movement organization were only weakly related in the present dataset. Accordingly, acceptable spatial performance may be achieved without equally strong evidence of smooth, continuous, or non-fragmented movement organization.
Temporal stability showed a similar descriptive pattern. Speed variability was highest at the earliest stage of repeated practice, decreased markedly during the early phase, and then fluctuated within a moderate range across the remainder of normalized progress. This suggests that the participants reduced the large initial fluctuations in seam-wise progression but did not exhibit a consistent monotonic refinement in temporal control across the full training sequence.
The retention analysis further suggested that the acquired level of spatial control was broadly preserved across sessions. The median spatial error remained similar across the first valid trials of the three sessions, although the spread of the distributions differed. Because the number of contributing participants was unequal across sessions, these retention patterns should be interpreted descriptively and as broadly consistent with short-term preservation of task-relevant spatial performance within the VR environment. This interpretation is also consistent with the session-adjusted mixed-effects models: spatial error did not differ significantly across sessions, whereas SPARC, LNJ, and NVP showed significant session-related differences.
Methodologically, this study demonstrates the value of combining raw time-series trajectories with trial-level summaries and mixed-effects modeling. The use of seam-projected task-space variables made it possible to analyze behavior in a way that was directly relevant to welding execution rather than to unconstrained controller motion. This provides a more interpretable basis for process-level modeling in VR-based manufacturing simulations. The proposed formulation may also support future predictive approaches for estimating operator performance and trajectory instability in real time.
Several limitations should be noted. First, the participants were all novices from a relatively homogeneous student group; therefore, the findings primarily reflect early-stage adaptation in novice trajectory behavior rather than expert welding behavior. Second, the study focused on simulator-based performance and did not evaluate transfer to real welding. In addition, the kinematic measurements were obtained from a commercial inside-out VR tracking architecture under controlled laboratory conditions, and no external ground-truth validation against physical welding execution was performed. Therefore, the recorded trajectories should be interpreted as simulator-based psychomotor behavior rather than as direct measurements of physical arc-welding kinematics. Although the synthetic sensitivity analysis supported the robustness of the proposed task-space formulation under perturbed measurement conditions, it did not constitute empirical validation against real-world welding data. Third, the observation period was sufficient to reveal early descriptive adaptation in spatial accuracy, but it may have been insufficient to capture longer-term changes in movement economy, smoothness, or control strategy. Fourth, because the retention analyses were based on the first valid trial of each session, conclusions regarding between-session preservation should remain descriptive.
Overall, the findings indicate that trajectory behavior in VR welding is multi-dimensional and cannot be reduced to final simulator scores alone. Early changes were dominated by improvement in spatial alignment at the descriptive level, whereas changes in smoothness, fragmentation, and temporal stability were weaker, more variable, and not consistently supported by inferential modeling. From a mechanics and dynamic-systems perspective, these results suggest that geometric task accuracy and dynamic movement organization should be treated as complementary but non-equivalent descriptors of simulated manual welding behavior.
8. Conclusions
This study presents a mathematical and kinematic modeling framework for analyzing trajectory behavior in a virtual reality welding simulator using high-frequency measurements. By combining raw time-series motion data with trial-level performance summaries, the proposed approach enabled joint evaluation of geometric task outcomes and process-level dynamic organization in a computer-simulated manual welding task. In contrast to conventional simulator scoring systems that primarily emphasize end-point performance, the present framework provided additional insight into how trajectory behavior evolved over repeated trials and sessions.
The results showed that novice participants exhibited a rapid early reduction in spatial welding error, followed by fluctuating but broadly stable performance over the remainder of the observation period. This early change was not accompanied by equally consistent longitudinal improvement in smoothness- and fragmentation-related features. In particular, SPARC, LNJ, and NVP displayed more variable temporal patterns, indicating that improved spatial accuracy did not necessarily imply uniform reorganization of dynamic movement behavior.
Correlation analysis further indicated that geometric error and process-level kinematic metrics were only weakly associated in the present dataset. This suggests that acceptable task-space accuracy may be achieved without equally strong evidence of smooth, continuous, or non-fragmented trajectory organization. Accordingly, final performance measures alone do not fully characterize the dynamic structure of simulated manual welding behavior.
The findings also showed that the achieved level of spatial control was broadly preserved across sessions, although performance variability remained present. More generally, this study demonstrates that high-frequency task-space trajectory analysis in VR can provide a sensitive and interpretable basis for the mathematical modeling of dynamic behavior in simulated welding systems. This perspective may support future work on advanced dynamic behavior characterization, comparative modeling of novice and expert trajectories, and the development of predictive simulation-based analysis frameworks for constrained manual tasks.
Future work should extend this framework to longer observation periods, expert–novice comparisons, and transfer studies involving real welding performance. In addition, future research may adopt an inverse-modeling perspective to reduce direct reliance on internal simulation sensors. The task-space projection developed in this study may serve as a geometric and physically interpretable basis for future hybrid frameworks combining external visual information (e.g., 2D video streams), non-invasive signals, and learning-based models. Such approaches could support the estimation of operator motion trajectories and skill-related states under less controlled conditions and may help bridge the gap between idealized VR analysis and real-world system modeling.