1. Introduction
D2D communication technology refers to the direct exchange of information between proximity devices in a communication network. The data is transmitted through a direct link between two devices, bypassing the base station and core network. This technology significantly alleviates base station pressure, improves spectrum utilization, and reduces latency. Notably, 3GPP has listed D2D technology as one of the key technologies for 5G [
1]. In dynamic networks, D2D communication demonstrates great potential for improving quality of service (QoS). Currently, proximity services (ProSe), defined by 3GPP, serve as the primary framework for implementing D2D communication, support direct communication between devices and provide fundamental signaling and connection establishment functionalities. ProSe plays a key role in facilitating communication initiation and preliminary resource allocation. For instance, in vehicular networks, vehicles can share traffic information in real-time through D2D communication, which improves driving safety and traffic efficiency; in unmanned aerial vehicle (UAV) ad hoc Networks, D2D communication enables direct exchange of location information and task data between drones, reducing communication latency.
D2D only supports short-range communication. In dynamic networks, communication devices are mobile, which causes the communication distance and channel states between devices to change continuously. Single D2D communication cannot meet QoS demands. Hence, a mode selection method is needed to choose according to different needs. The selectable communication modes can be classified into five types, as shown in
Table 1. Factors such as switching thresholds and evaluation criteria need to be thoroughly considered in mode selection methods. Otherwise, QoS will be adversely affected. For example, low selection conditions can lead to frequent mode switches. Data packets from different modes are not interoperable. Each switch results in packet loss, retransmissions, and requires additional signaling messages, thereby increasing the system’s signaling load and reducing throughput. Solving mode selection problems usually depends on a complete and accurate channel state model, but in practical scenarios, accurately modeling channel states is often challenging. Therefore, the improvement of network throughput with incomplete channel state information through reasonable strategies has become an important research direction.
This paper proposes a D2D mode selection method that combines statistical learning and deep learning. This method aims to address important challenges in dynamic network environments, such as optimizing mode switching and enhancing QoS, which have been relatively less explored in prior studies. This method consists of three modules: SINR prediction, error analysis, and threshold selection. In the SINR prediction module, deep learning algorithms are used to predict the channel states between devices. Due to uncertainties in predictions, we establish a probability density function for the error within the error analysis module and construct a confidence interval to ensure the accuracy of the prediction results. In the threshold selection module, we use statistical learning methods to select switching thresholds and introduce AR and PCR constraints to meet actual communication needs. Compared to traditional methods, this study innovatively combines statistical learning and deep learning for the mode selection problem. This method enhances system throughput, effectively reduces mode switching frequency, and improves overall network performance.
The structure of this paper is as follows:
Section 2 describes the background of D2D communication technology and analyzes the shortcomings of existing methods that address incomplete channel state information.
Section 3 explains the proposed mode selection method, which consists of the SINR prediction module, the error analysis module, and the threshold selection module.
Section 4 provides the simulation results and demonstrates that the method improves system throughput and reduces mode switching frequency. Finally,
Section 5 summarizes the research results, identifies limitations, and outlines future research directions.
2. Research Status
Considering dynamic scenarios of a single base station cell, each mobile device has two operating modes: cellular mode and D2D mode. The base station can only receive auxiliary information (e.g., distance, movement speed, and number of devices, among others) and partial channel state information (e.g., SINR and received power, among others).
In dynamic network environments, deep learning methods are commonly used to solve mode selection problems. With known channels, deep learning algorithms can make judgments based on environmental information. Ortiz et al. [
5] uses reinforcement learning to solve real-time D2D mode selection and resource allocation problems. A dual-layer multi-armed bandit (MAB) model is employed, where the first layer allocates resources to cellular users. The usage of resource blocks is then input to the second layer MAB model for D2D user mode selection and resource allocation, and the system throughput determines the reward value. However, this article does not consider the impact of frequent mode switching on system throughput. Zhang et al. [
6] finds the optimal received signal strength (RSS) threshold through reinforcement learning for each base station in multi-base station scenarios. Terminal devices compare the RSS values with the base station’s computed RSS threshold to select the mode and maximize network throughput. Xu et al. [
7] uses residence time as a selection criterion and utilizes a feed-forward neural network to predict the residence time in D2D mode, which determines whether the system switches modes. Najla et al. [
8] uses deep neural networks (DNN) to extract information from cellular channel gain to predict D2D channel gain. Zhang et al. [
9] constructs a network transmission model with energy efficiency maximization as the optimization goal, listing optimization equations for mode selection and resource allocation, and solves the optimal strategy through a deep deterministic policy gradient method. Liu et al. [
10] proposes a D2D mode selection scheme based on average thresholds. Esmat et al. [
11] allows multiple D2D pairs to reuse the radio resource of a cellular user (CU), completing mode selection. Li et al. [
12] estimates the SINR and communication rate based on geographical location and channel information, followed by mode selection and resource allocation.
Mode selection under known channel state information has been performed in previous studies (Ortiz et al. [
5], Zhang et al. [
6], Zhang et al. [
9], Liu et al. [
10], Esmat et al. [
11]). Such studies typically rely on comprehensive and accurate channel state information, such as path loss, channel gain, and fading. They do not consider how to make judgments when channel state information is not fully understood. It is often a challenge to obtain comprehensive and accurate channel state information in practical scenarios due to rapid changes in mobile devices and complex signal propagation environments. In this situation, traditional methods may not ensure the accuracy of mode selection and system performance.
Prediction methods for QoS are employed in several other works (Xu et al. [
7], Najla et al. [
8], Li et al. [
12]). Although such methods can improve network adaptability and response speed to ensure timely mode selection adjustment when channel conditions change, they do not fully consider prediction accuracy. Prediction in practical applications are affected by various factors such as data noise and environmental changes, which may cause deviations between predicted results and actual situations. Without effective control of prediction errors, incorrect mode selection may occur, which affects system stability and performance.
To address such deficiencies, this study proposes a mode selection method under incomplete channel state information. The method estimates switching thresholds using statistical learning and constraint estimation to ensure system stability. By using historical SINR values and deep learning algorithms to predict channel states, and introducing confidence intervals through error analysis module, the accuracy of prediction results is ensured. Compared with the above studies, this study innovatively combines statistical learning and deep learning for mode selection, which enhances system stability and effectively reduces the frequency of mode switching.
3. System Modeling
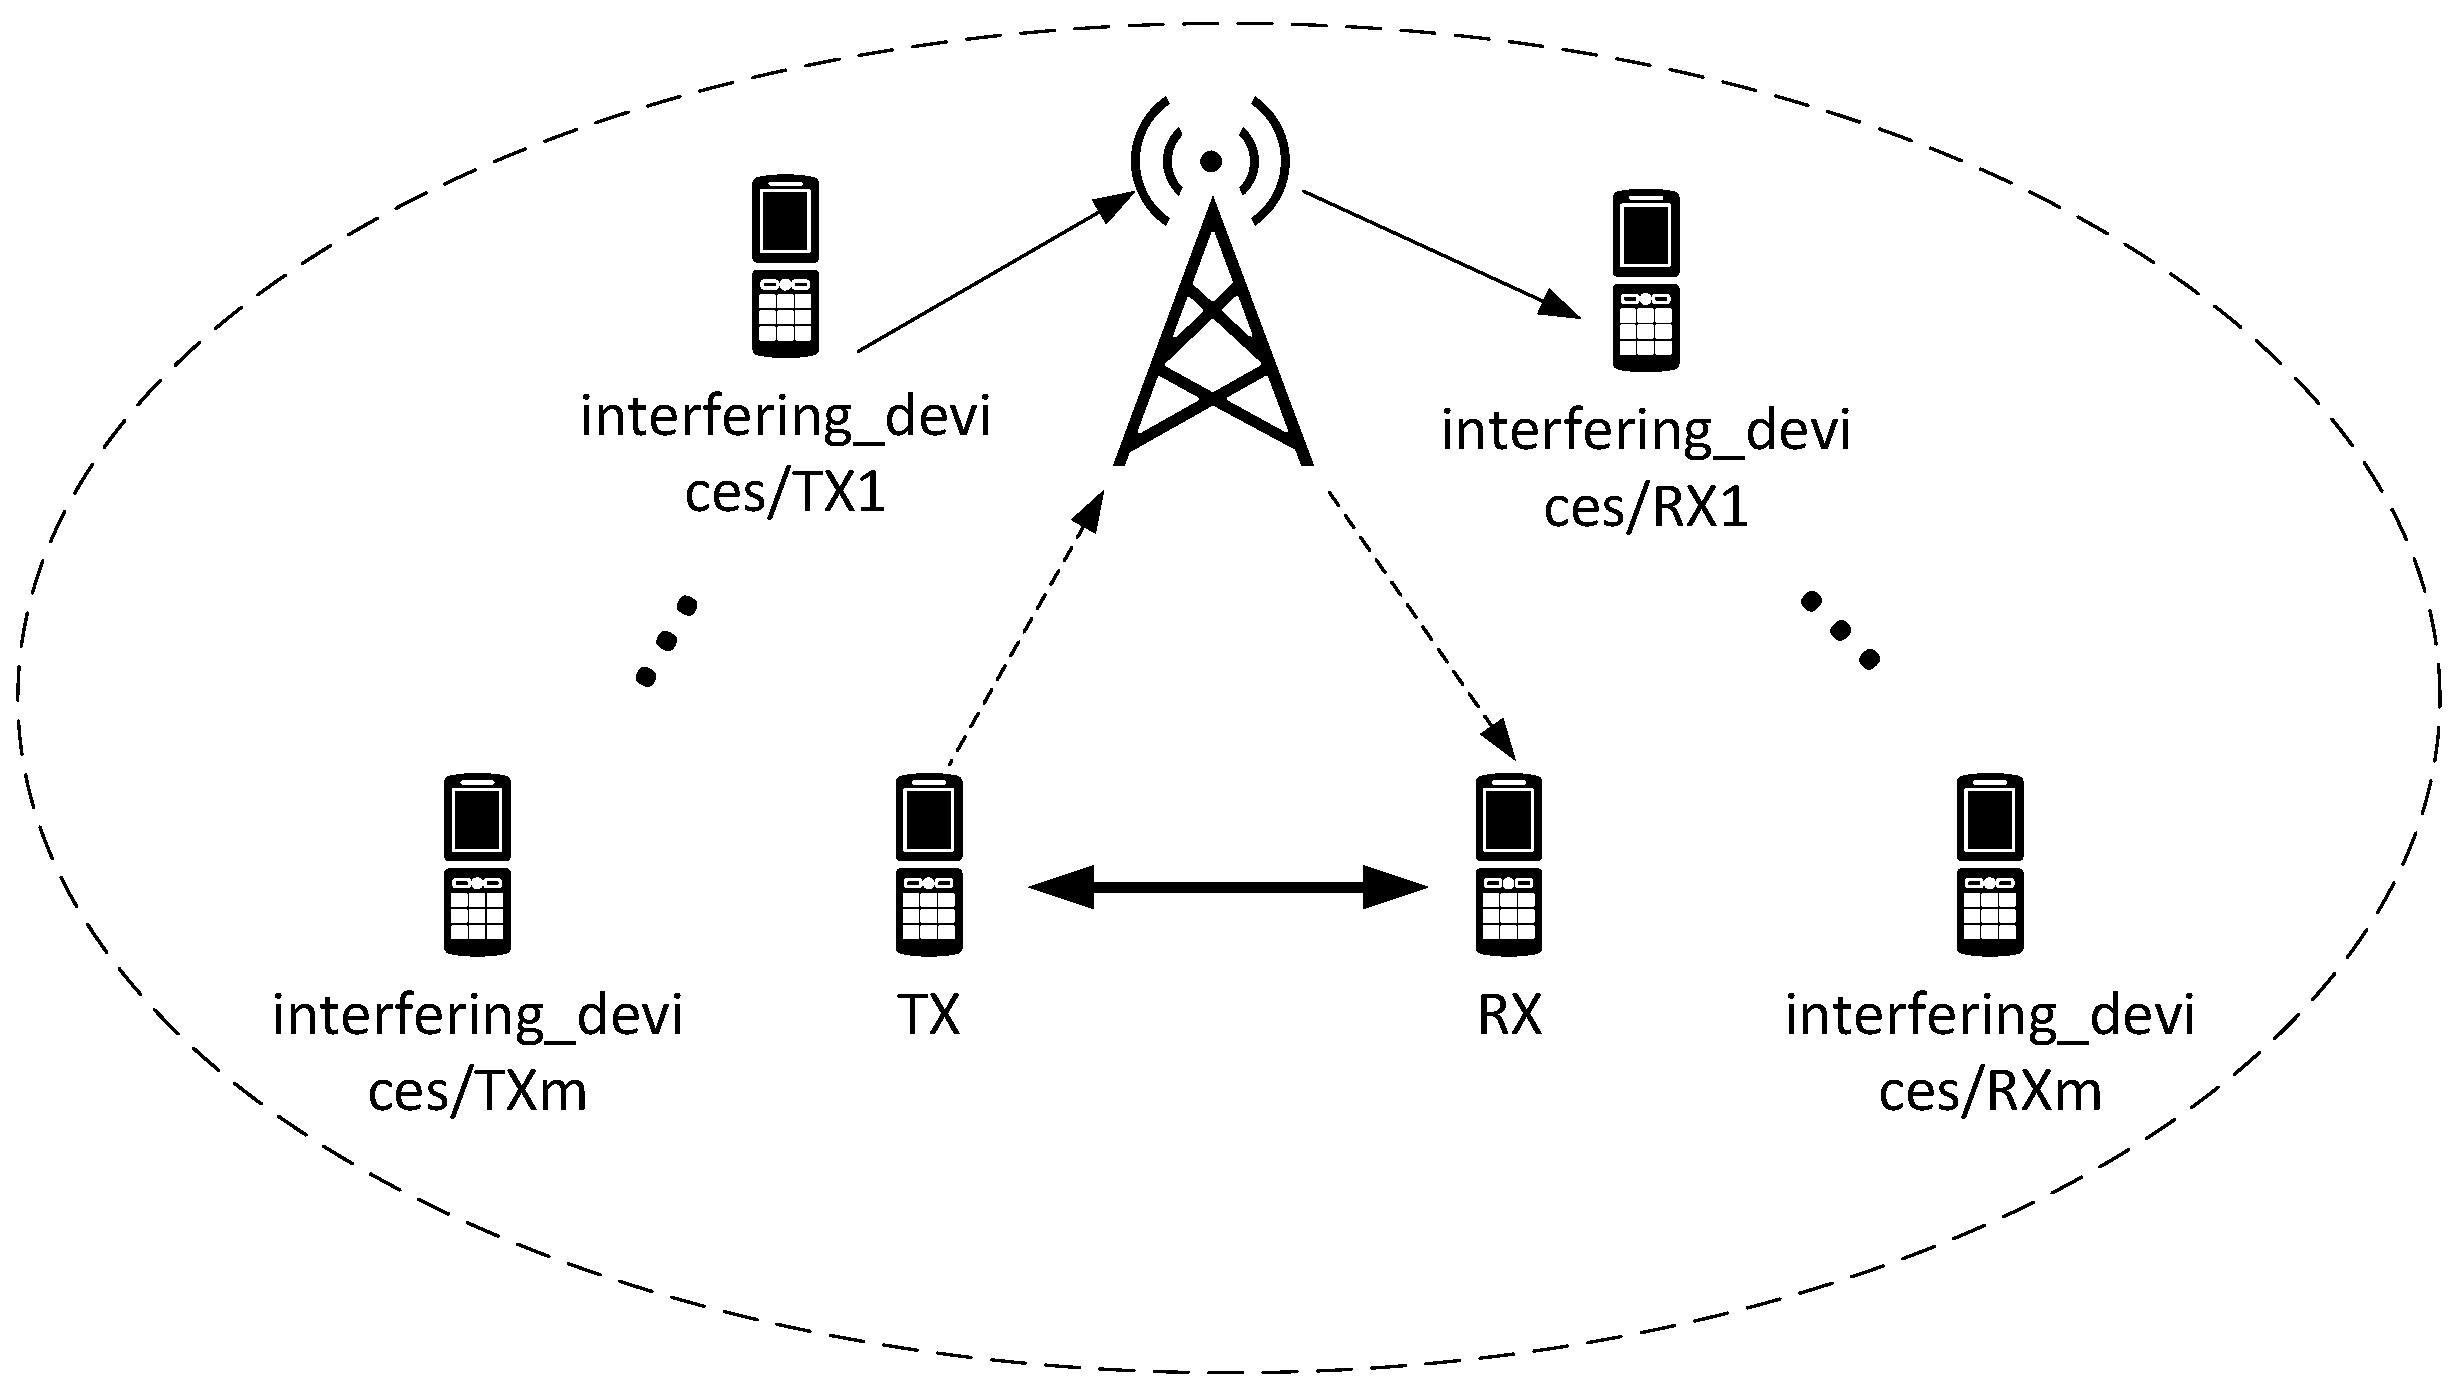
In this study, we consider a single-cell cellular network as shown in
Figure 1, where each cellular user device is allocated orthogonal resource blocks for communication with the base station. We assume that
M cellular user devices coexist with a pair of D2D user devices in the cellular network. Each device functions as both a transmitter and receiver with equivalent capabilities and supports bidirectional communication under either D2D or cellular modes.
In this system, each mobile device measures the received signal strength at its current location and feeds this information back to the connected base station. The base station averages the signal strength information from all devices and calculates the SINR for each device. For communication rate in QoS, SINR is closely related to the communication rate and is defined as
where
S denotes the SINR,
is the transmission power of transmitter
i,
represents the channel gain between transmitter
i and receiver
j,
accounts for the interference from all devices in the network except
i and
j. Here,
represents the expected load from the interference source
k, which also indicates the proportion of resources used,
is the transmission power of the interference source
k, and
represents the channel gain between the interference source
k and receiver
j. Finally,
denotes the noise power. Equation (
1) is widely used for calculating SINR in wireless communication systems. It accounts for the transmission power, channel gain, and interference from surrounding devices, as well as noise power. According to the description in [
13], this equation is suitable for the proposed work because it effectively captures the effects of interference and noise in dynamic network environments. To evaluate the performance of the proposed D2D mode selection method, the achievable throughput of a single communication link is calculated. According to [
14], the data rate of the link is determined based on the Shannon–Hartley theorem, which relates the bandwidth of the channel and SINR to the maximum achievable throughput.
4. Mode Selection Method
In D2D communication, the accuracy of mode selection directly affects system throughput and QoS. Existing methods perform well when channel state information is fully known, but in practical applications, channel information is often incomplete. The proposed method assumes that D2D communication is implemented based on standard protocols, such as ProSe, to enable direct communication. The method also assumes that all transceivers operate with standard mobile device capabilities, including single-antenna setups and moderate transmission power. This ensures that the proposed method is applicable across a wide range of practical deployment scenarios without being restricted by specific hardware configurations. However, as the core of the proposed method focuses on optimizing mode selection, it does not rely on the signaling implementation of specific protocols. Hence, this method ensures high generalizability and compatibility with existing network architectures. To make accurate mode selection decisions in such environments, this study proposes a method based on prediction and statistical learning. Channel states information is predicted by utilizing historical data and deep learning algorithms. To ensure the accuracy of these predictions, confidence intervals are introduced through an error analysis module. Additionally, statistical learning methods are employed, with average reliability and possible correctness constraints incorporated to select appropriate switching thresholds. In combination, the methods enable the achievement of optimal mode selection.
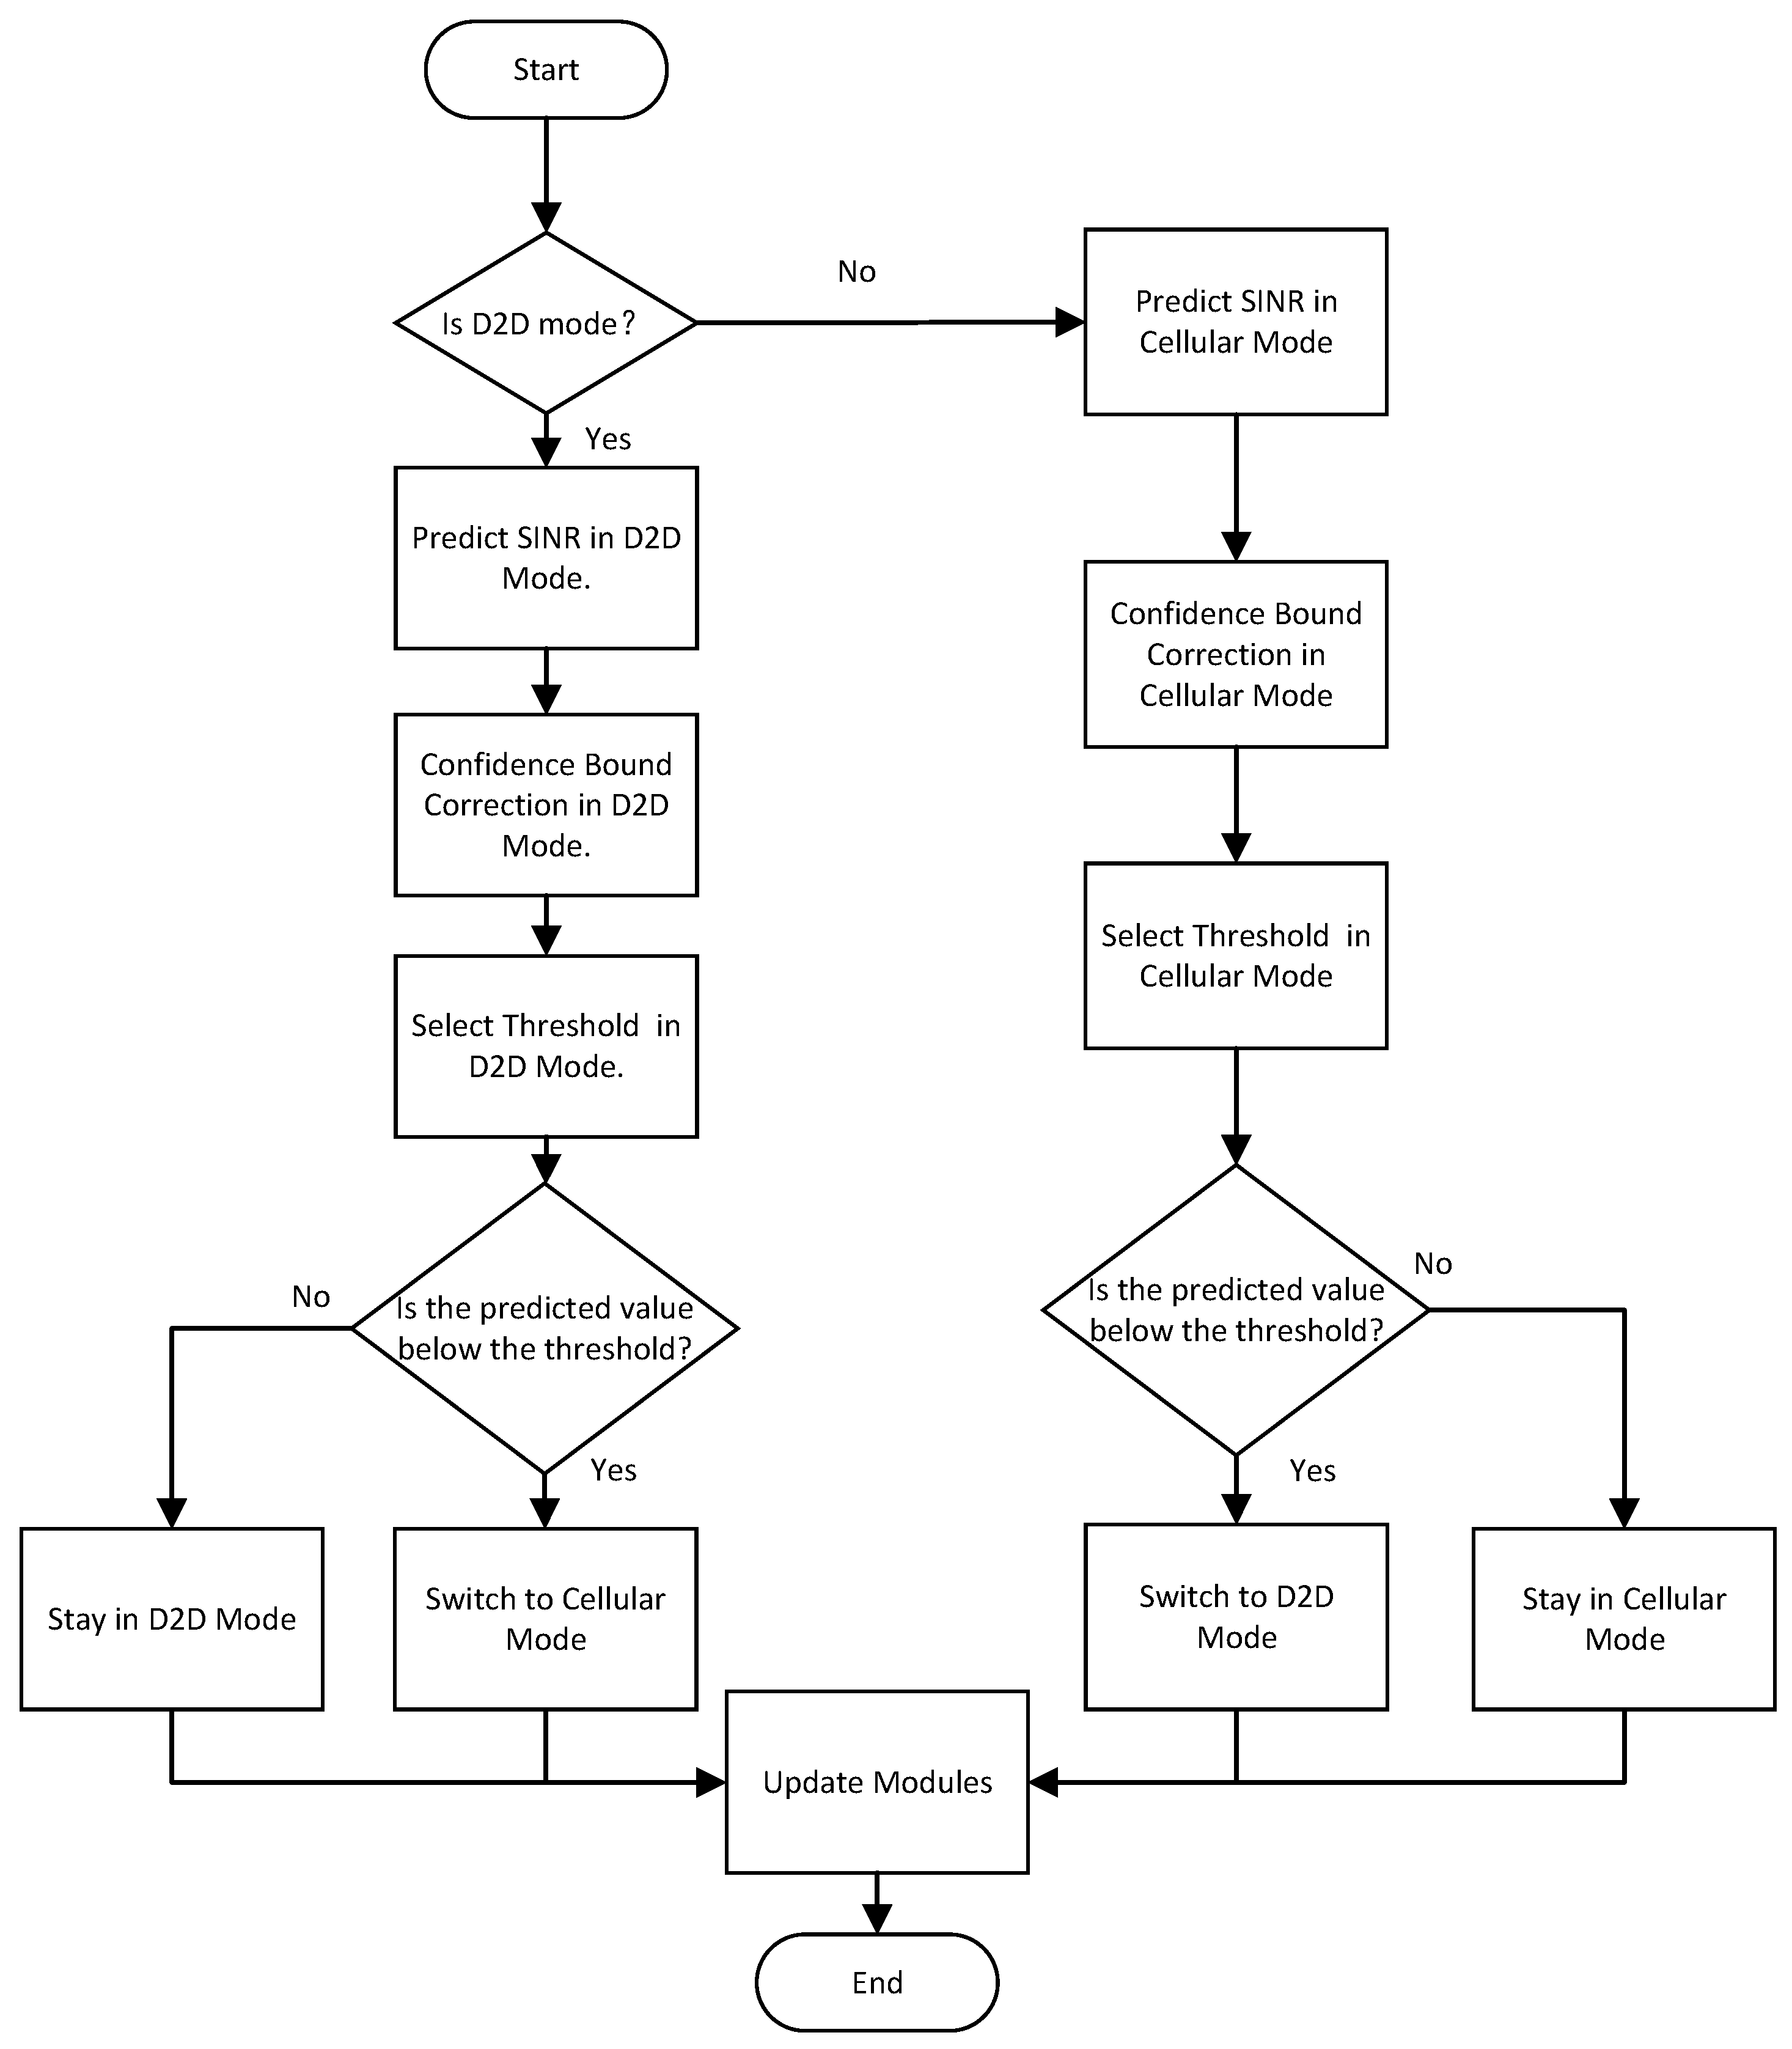
In this method, the system’s operation process is divided into three main modules: the SINR prediction module, the error analysis module, and the threshold selection module. The program initially determines whether it should train the model or proceed with operation based on the time condition. When in the training phase, the system trains the model, including the initial training of the SINR prediction module, error analysis module, and threshold selection module. When in the mode selection phase, the system moves into the operational phase. It determines whether the current communication mode is D2D or cellular. The SINR prediction module then forecasts the future SINR based on the current SINR. The error analysis module corrects the prediction results and calculates the confidence interval of the channel state to ensure reliable predictions in the presence of interference. Finally, the threshold selection module evaluates whether mode switching is necessary based on the corrected prediction values and communication requirements, ultimately enhancing overall communication efficiency. The program flowchart is shown in
Figure 2.
4.1. SINR Prediction Module
SINR data, which fluctuates with device movement and changing channel conditions, can be considered as time series data. To ensure precise mode selection in D2D communication, the GRU model is used in this study for univariate time series prediction. The GRU model has a simple structure and trains rapidly, which enhances its efficiency in dynamic network environments. Its ability to capture temporal dependencies is confirmed by Simmons et al. [
15], and the trade-off between accuracy and computational efficiency is demonstrated, which makes it a suitable choice for this work. GRU has a special mechanism composed of gating units to decide when to remember and when to ignore inputs in the hidden state. The main difference is that GRU only has two gates controlling the information flow, the reset gate and the update gate. Additionally, the cell state (memory cell) is not part of its gating units, and it only uses the hidden state
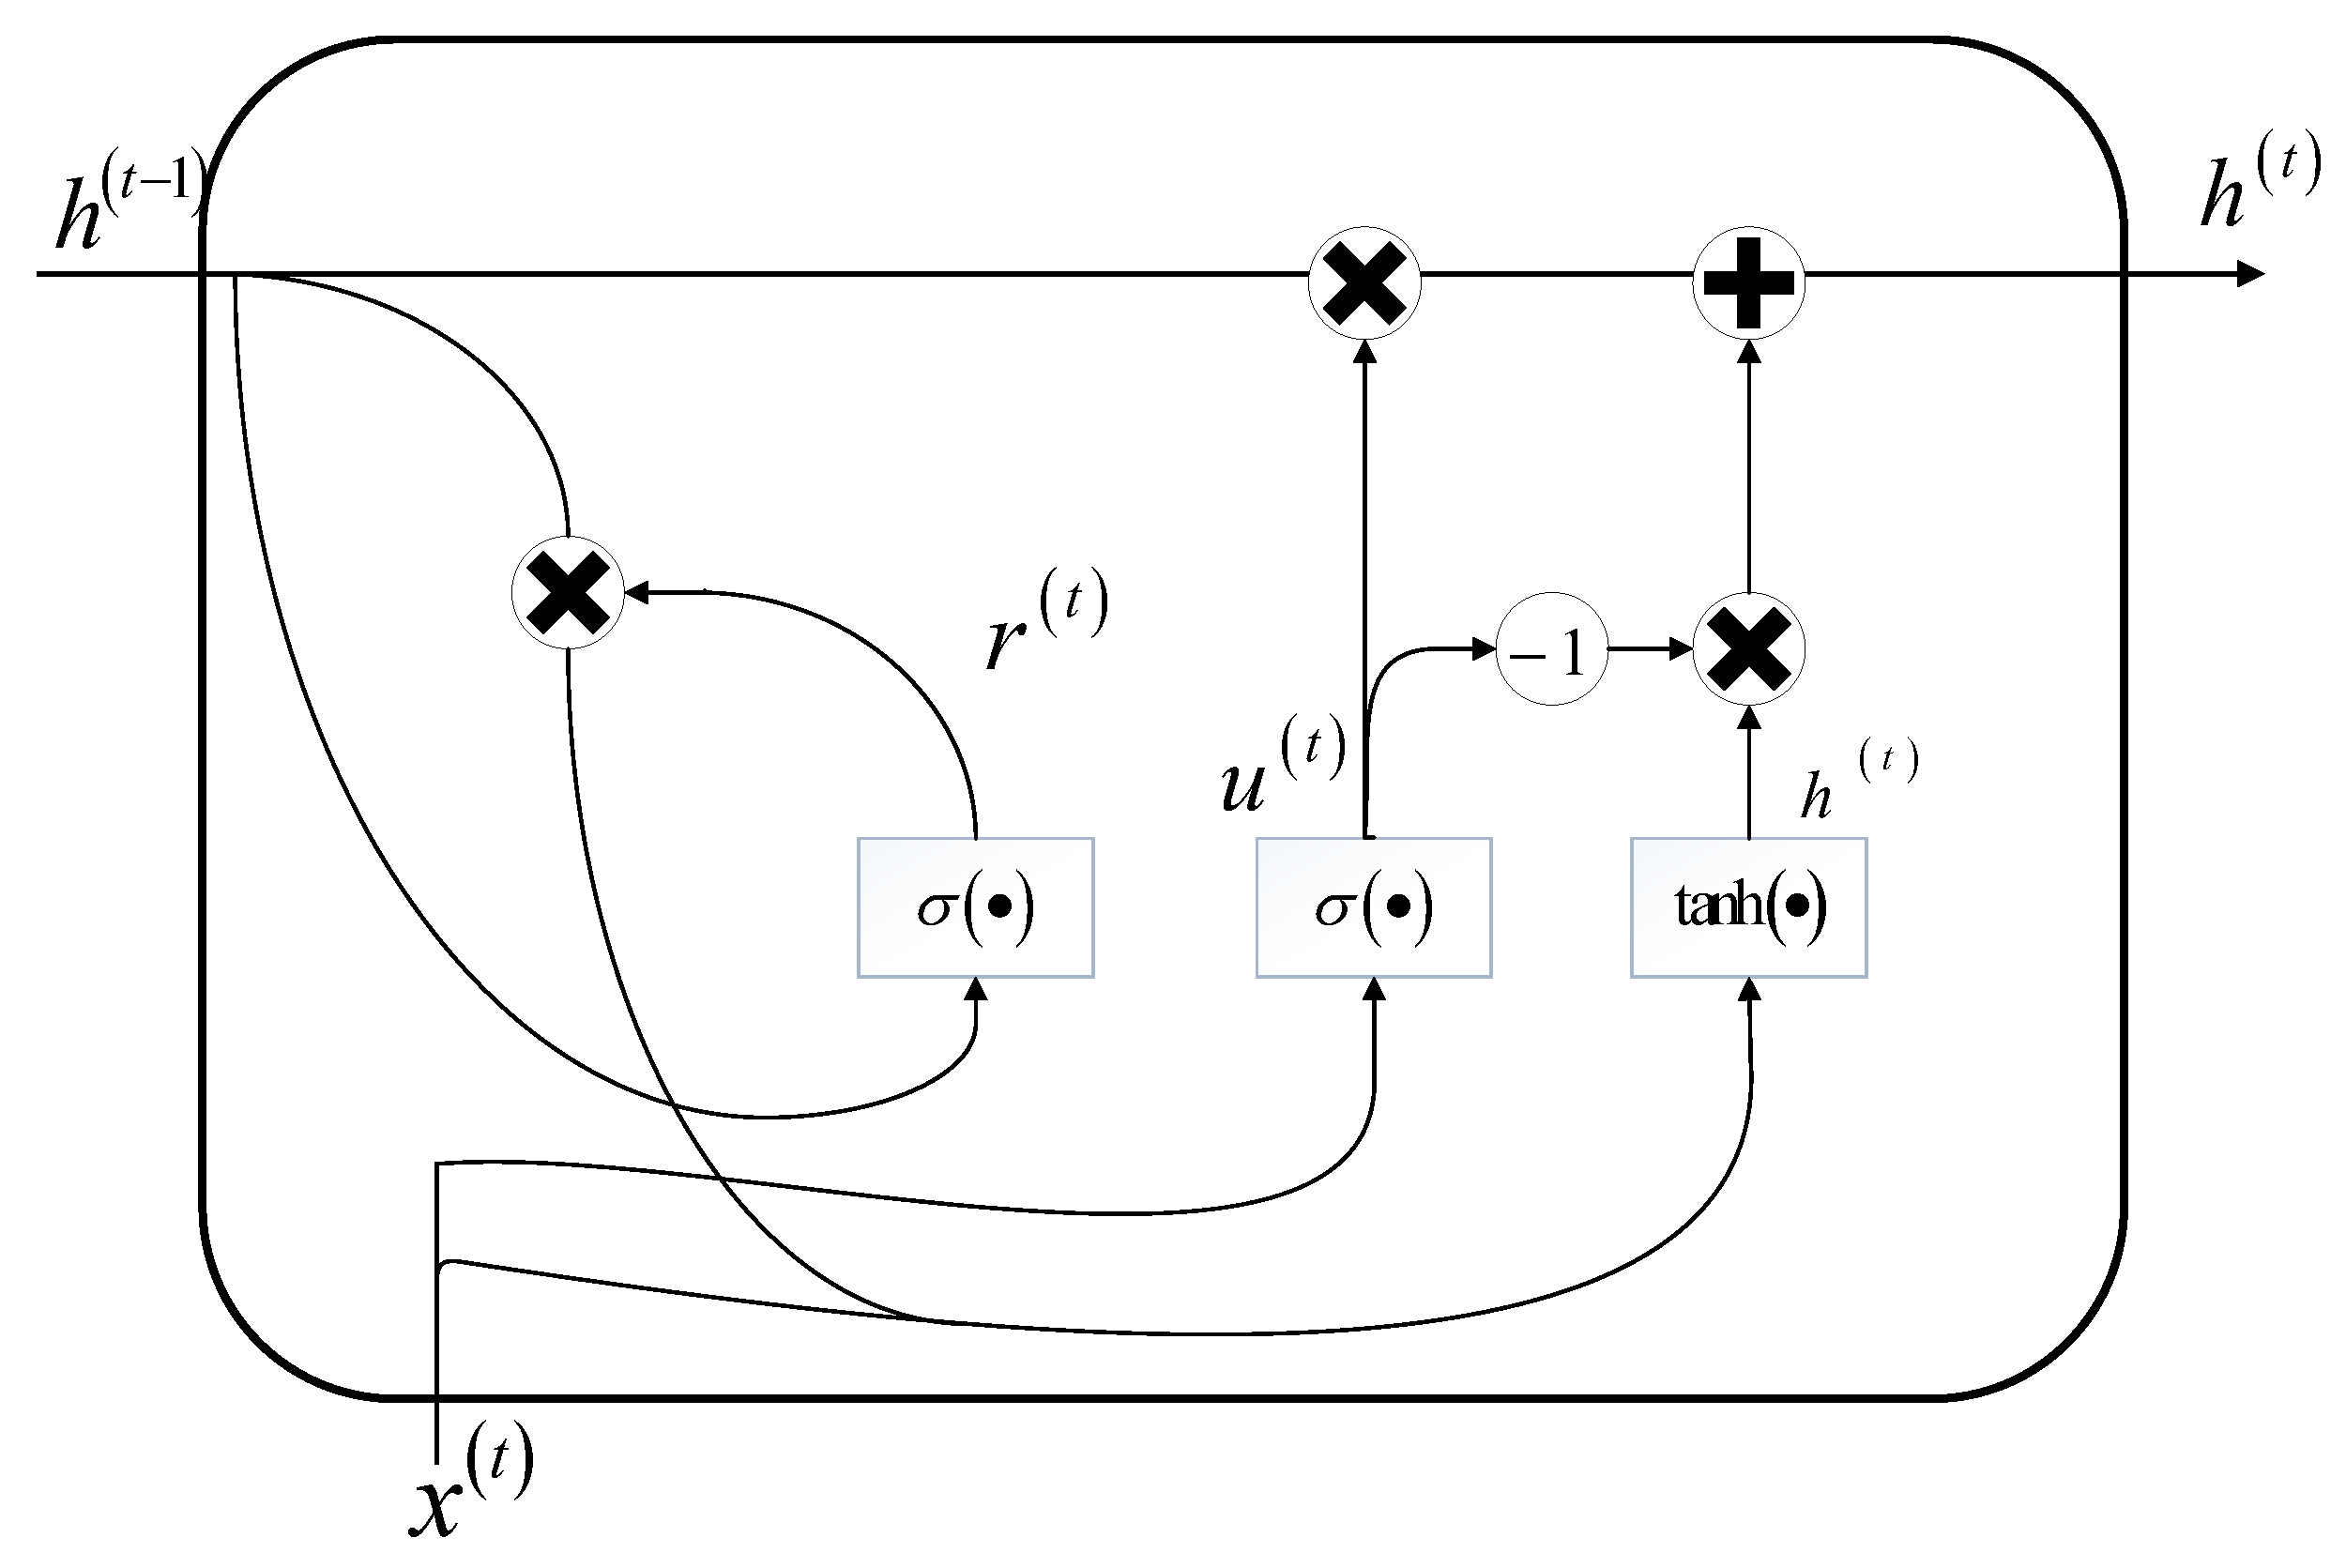
to convey information. GRU’s core functionality relies on a single gating unit controlling both the forgetting factor and updating the state unit’s decision. The system structure diagram is shown in
Figure 3. The updated value is represented as
The update gate
and reset gate
are represented as follows
where
and
are weight parameters,
are bias terms. The current input vector is
the batch size is
N the input size is
. The current hidden state of the GRU output is
with
h hidden layers. The candidate hidden state
at time
t is expressed as
where
are weight parameters,
are bias terms.
4.2. Error Analysis Module
To provide accurate SINR predictions before network state changes, the deep learning method mentioned in the previous subsection is used to predict SINR values, denoted as
. Prediction values inherently carry uncertainty. To ensure the accuracy of the predictions, we estimate the cumulative distribution function of the error, through which the confidence interval is constructed. When the prediction values fall inside this interval, the accuracy of the predictions is guaranteed probabilistically. The prediction value is adjusted to the nearest boundary to ensure accuracy when it falls outside the interval. We initiate this process by collecting both predicted and actual values, and then estimate the probability density function of prediction errors using kernel density estimation. This non-parametric approach, known for its smoothness and ability to capture local features, provides a flexible and accurate estimation of the probability density function. This process enables the calculation of confidence intervals for each prediction value, ensuring they fall within these intervals with a certain probability. The error analysis module can effectively provide the upper and lower confidence intervals for QoS prediction. Prediction error is defined as
where
E represents the error,
S represents the actual SINR value, and
represents the predicted SINR value.
With the probability density function of prediction errors, the confidence interval for SINR values can be calculated. Known probability density function solving methods are divided into parametric and non-parametric methods. This paper chooses the non-parametric method, using kernel density estimation to calculate the probability density function of prediction errors. The probability density function of prediction errors is defined as
where
is the total number of samples,
h is the bandwidth coefficient determining the width of the kernel function. The choice of bandwidth significantly affects the smoothness of the estimate, with
serving as the kernel function.
With the probability density function of prediction errors, the cumulative distribution function (CDF) can be calculated. The confidence interval is constructed based on the confidence level. The confidence level
indicates the probability that the error falls within this interval. The confidence interval’s upper and lower limits are obtained by finding the corresponding values on the cumulative probability distribution function according to the confidence level, satisfying
where
D represents the upper bound of the error,
represents the probability that the prediction error is less than or equal to
D,
L represents the lower bound of the error, and
represents the probability that the prediction error is less than or equal to
L.
After obtaining the confidence interval, each prediction value has a probability of falling within the confidence interval, probabilistically ensuring the prediction result’s accuracy. When the prediction value exceeds the confidence interval, the prediction value is adjusted to the nearest boundary, and the prediction boundaries can be expressed as and , which improves the accuracy of the prediction.
4.3. Threshold Selection Module
An effective computational method of switching thresholds is necessary to achieve optimal mode selection in a dynamic network environment where the continuous movement of devices complicates channel state modeling. A threshold selection module needs to ensure reliable communication and improve system performance. The method proposed in this paper limits the mode switching probability through constraints, without relying on extensive information for precise modeling. It ensures system performance and minimizes the impact of frequent switches. This section introduces the key concepts and mathematical foundations that underlie the threshold selection process.
In a unidirectional communication link, the transmitter (Tx) sends data packets to the receiver (Rx). Let
denote the CDF of the channel variable
S, which can represent any value of interest (e.g., received power, SINR). Define a switching event as
where the switching probability is
.
is the value of predicted channel variable, and
R is the threshold rate selected by the threshold selection function. Using the statistical learning-based rate selection framework proposed in [
14], the threshold selection process involves estimating the SINR distribution and determining an appropriate threshold based on the constraints.
In statistical learning, SINR can be deterministically guaranteed when this distribution is fully known [
13]. However, obtaining complete knowledge of
is rarely attainable in practice. Therefore, statistical learning methods estimate
based on historical data. Estimating
can be achieved through parametric and non-parametric methods. The choice depends on how much the channel information is understood. For instance, if the channel has a fixed direct component, a parametric method can be chosen, such as the Rice fading model. Parametric methods use relevant data to solve model parameters when the channel state is well understood. Non-parametric methods should be used when the channel state is not well understood, as they help avoid model mismatch errors. In this paper, we consider scenarios where the channel state cannot be precisely modeled; hence, a non-parametric method, namely the empirical distribution method, is adopted. The empirical distribution method effectively estimates the actual distribution of the channel state without requiring any assumptions about the data distribution. An independent and identically distributed sequence of length
n is collected, which is referred to as the training sample and denoted by
.
To improve system throughput, it is necessary to select an appropriate switching threshold to avoid frequent mode transitions. Because
is estimated from random samples, it is a random variable with inherent uncertainty [
14]. To ensure reliable threshold selection, one of two constraints can be applied. The first is the AR constraint, which controls the average service quality level. The second is the PCR constraint, which bounds the probability of specific data falling within a designated region. Compared to the AR constraint, the PCR constraint imposes stricter limitations.
The first AR constraint can be expressed as
where
is the average switching probability for training samples
calculated through expectation,
represents the switching probability,
represents the switching threshold selection function. The law of total expectation is applied with
as a condition, and the equation is rewritten as
The second PCR constraint, different from AR, comes from probably approximately correct (PAC) learning. PAC learning selects a generalization function with high probability and low generalization error after training on samples. The PCR constraint selects a threshold based on the channel state, ensuring all switching probabilities remain within a probability interval. The PCR constraint, relying on the meta-probability concept [
16], can be expressed as
where
represents the worst-case probability,
represents the bound on the worst-case probability.
The threshold selection function can be written as
The threshold selection function aims to select the maximum value
satisfying the constraints.
, which is the maximum value satisfying the constraints, is selected after sorting the sample
as
.
For non-parametric methods, the distribution of order statistics from a set of independent and uniformly distributed random variables can be approximated by the Beta distribution, allowing the AR constraint to be rewritten as
where
is beta-distributed with shape parameters
l and
. To satisfy the reliability constraint of the switching probability
,
is set to
. This setting allows the value of
l to be calculated.
Similarly, for the PCR constraint, the order statistics from the same set of independent and uniformly distributed random variables can be approximated by the Beta distribution. This approximation allows the constraint to be rewritten as
where
represents the regularized incomplete Beta function. According to the PCR constraint, setting
allows us to determine the value of
l.
5. Simulation Verification
In this section, the proposed D2D mode selection method is evaluated through simulations, focusing on two aspects: prediction method accuracy and QoS optimization. The simulation scenario is designed based on [
17,
18] to ensure realistic communication. The path loss model described in
Table 2 was chosen for its simplicity and effectiveness, with its design drawing upon methodologies and findings discussed in [
17]. The simulation represents an urban macro-cell with a 500-meter radius and a fixed base station at its center. Specific parameters are shown in
Table 2.
The training phase involves training SINR prediction modules, error analysis modules, and threshold selection modules separately on the cellular dataset
and the D2D dataset
. The mode selection phase takes place, with mode judgment following different judgment cycles. Taking the D2D mode as an example, prediction values
are generated in each cycle. The error analysis module is used to generate the confidence interval
. A threshold selection method determines appropriate switching thresholds
. The judgment result is obtained by comparing the predicted values with the switching thresholds, and the real values
are fed back into the system to update the SINR prediction module, error analysis module, and statistical module. The same process applies to the cellular mode, except that all data are replaced with the cellular mode dataset. The pseudocode for the mode selection algorithm can be found in Algorithm 1.
| Algorithm 1 Mode selection approach for dynamic networks |
Input: (D2D input features), (Cellular input features), (confidence level), (switching probability)
Output: Mode (D2D or Cellular), Updated Modules- 1:
Initialize parameters - 2:
while Network operational do - 3:
Determine current communication mode: D2D or Cellular - 4:
if Current mode is D2D then - 5:
Predict SINR - 6:
Correct prediction using error analysis model to obtain - 7:
Select threshold - 8:
if then - 9:
Switch to Cellular Mode - 10:
else - 11:
Remain in D2D Mode - 12:
end if - 13:
else - 14:
Predict SINR - 15:
Correct prediction using error analysis model to obtain - 16:
Select threshold - 17:
if then - 18:
Switch to D2D Mode - 19:
else - 20:
Remain in Cellular Mode - 21:
end if - 22:
end if - 23:
Update predictions with real-time data based on the current mode - 24:
end while
|
To evaluate interference impact on system performance, 20 interfering devices using cellular communication are simulated, randomly distributed in the cell area according to a homogeneous Poisson point process. The random distribution of interfering devices effectively simulates the irregular distribution of devices in reality, impacting the channel. The main device moves randomly within the cell, with a movement speed of 3 m per second. The device mode only considers cellular mode and dedicated D2D mode, simplifying the simulation model to focus on evaluating these two main modes’ method performance. Channel information collection mainly includes SINR values. QoS focuses on throughput. The simulation duration is set to 300 s, with a time step of 1 s. The SINR prediction module uses the GRU model, effectively capturing dynamic changes in time series suitable for channel state prediction. Specific parameters include 25 hidden layers, 3 layers, and a learning rate of 0.005, tuned for optimal prediction performance. Kernel density estimation uses the Gaussian kernel density function, with a bandwidth parameter for error distribution estimation.
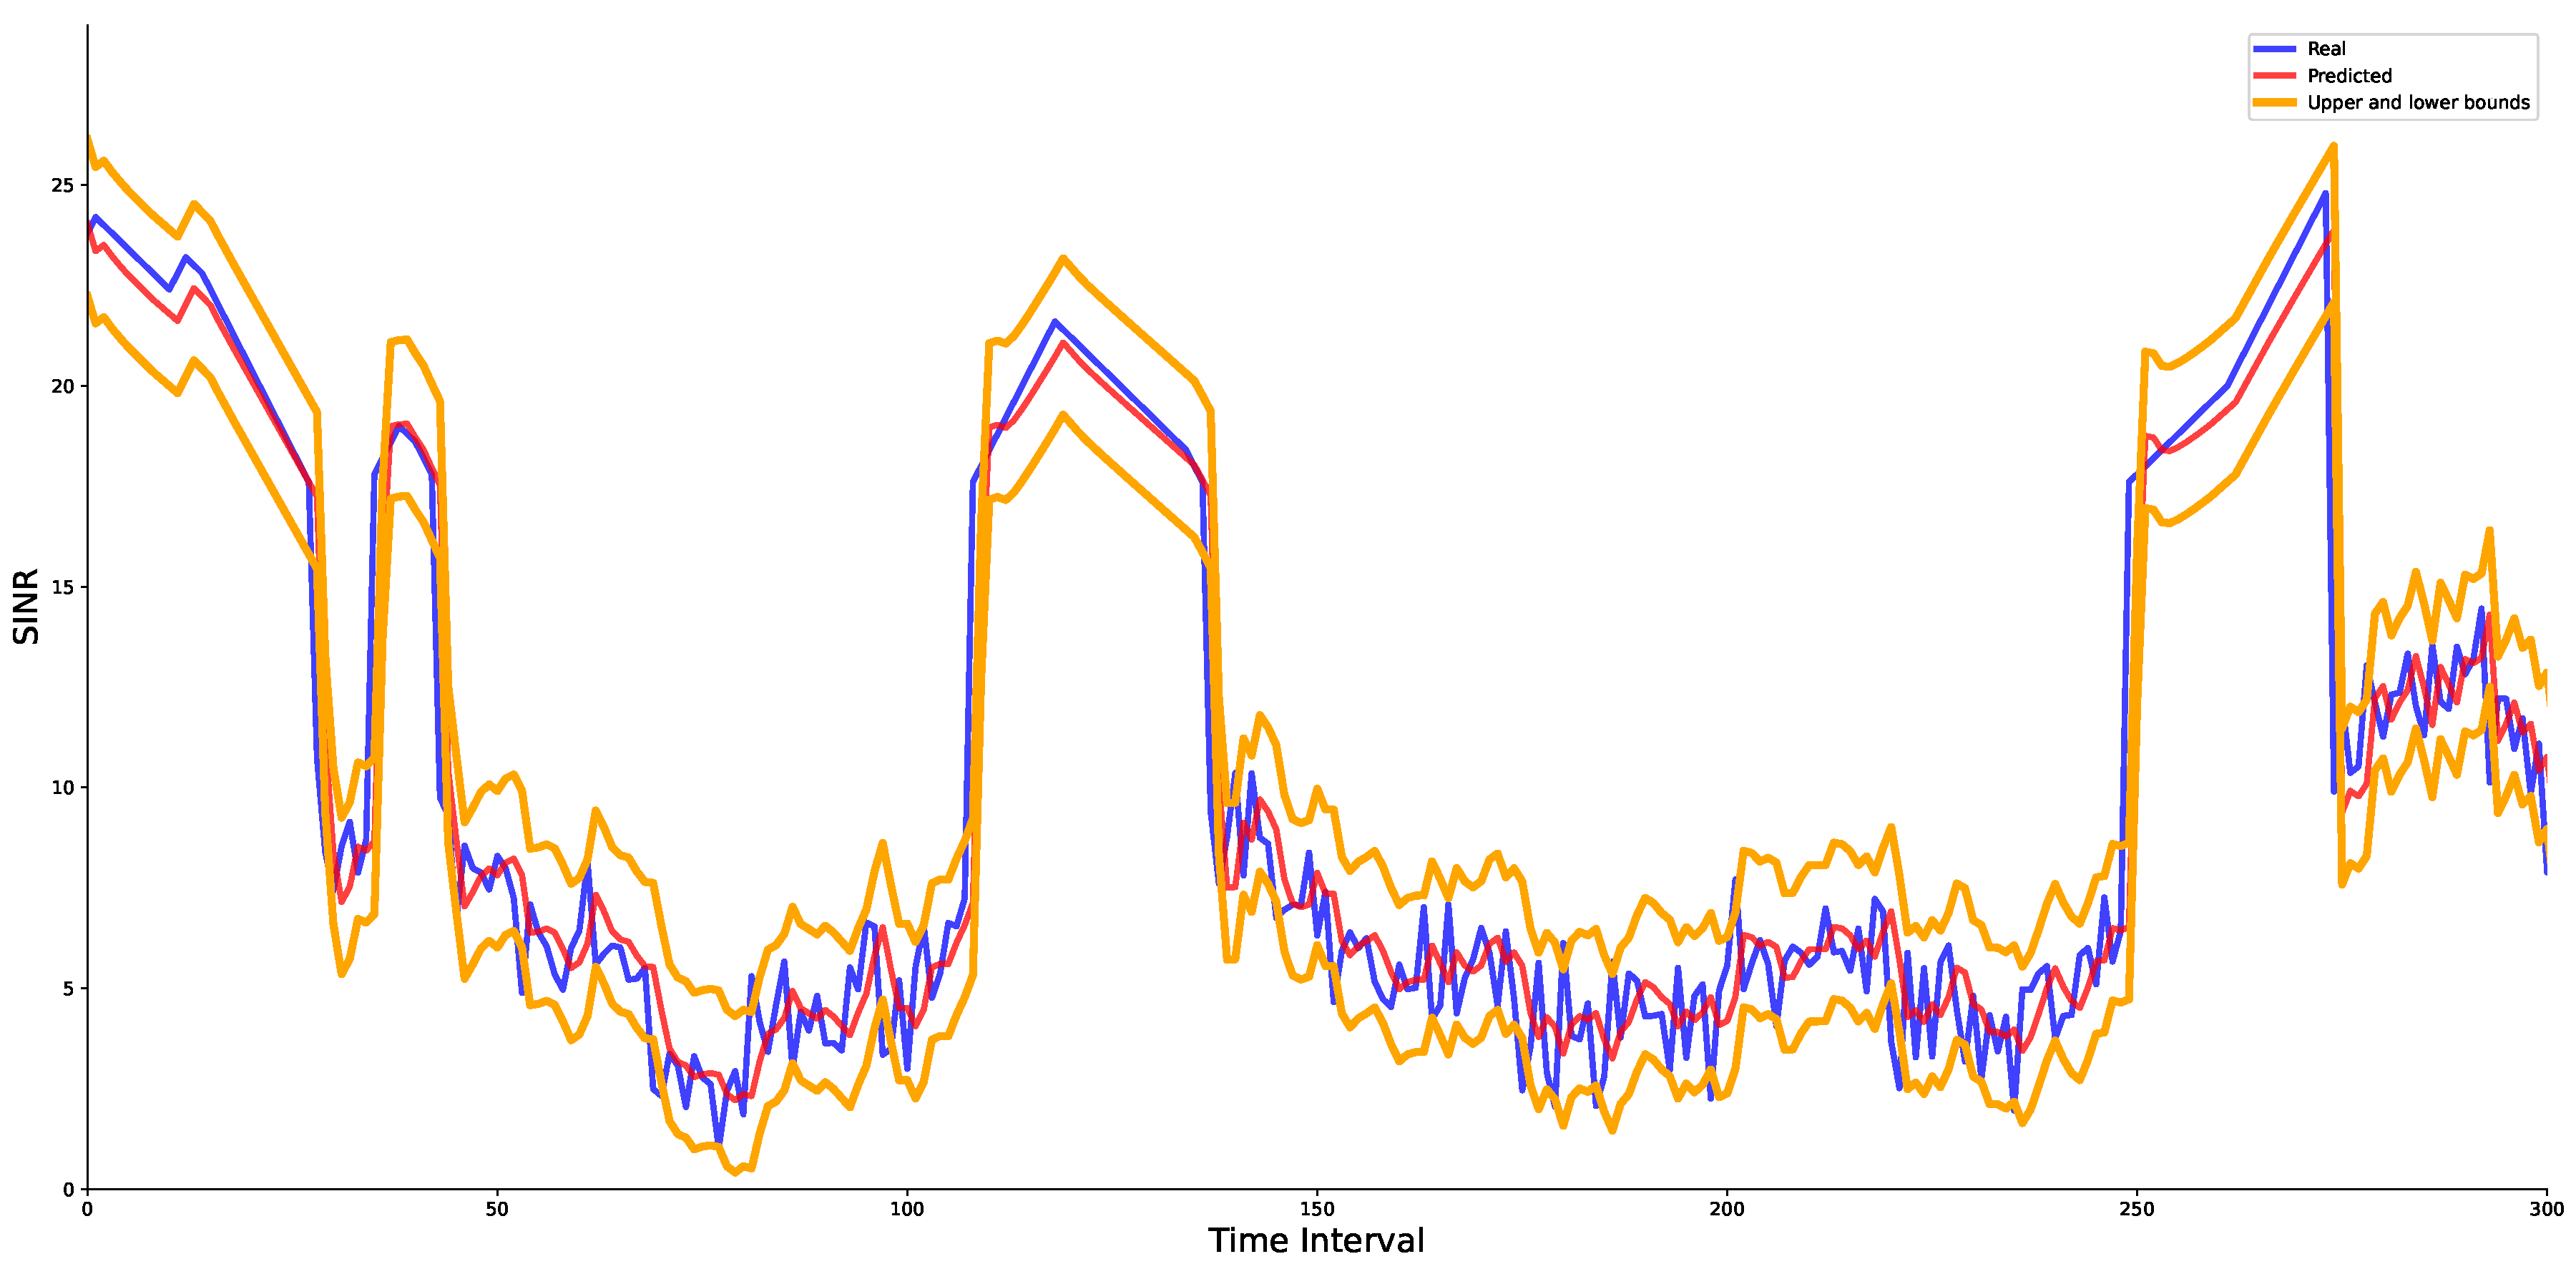
The prediction results of the system SINR values are shown in
Figure 4, which includes four main curves. The blue line represents the actual values, the red line represents the predicted values, and the yellow upper and lower lines represent the confidence intervals of the predicted values. In most time periods, the predicted values (red line) follow the actual values (blue line), which indicates that the GRU model captures channel state changes with high accuracy. The model achieves a mean absolute error (MAE) of 1.40 dB and a root mean squared error (RMSE) of 1.91 dB, which reflects its low prediction error and reliable performance. After introducing the error analysis model, confidence intervals are added to the predicted values. In the 95% confidence interval, the predicted and actual values mostly fall within the confidence interval, which indicates that the predictions are accurate with 95% probability. If the prediction value falls outside the confidence interval, it is adjusted to the nearest boundary to ensure accuracy and maintain reliability. This confidence interval provides a more reliable basis for mode selection.
Figure 5 shows average throughput and the number of mode switches across different switching probabilities and compares performance under AR and PCR constraints. The AR constraint provides higher average throughput but leads to more frequent mode switches, which reflects that it is more sensitive to network dynamics. In contrast, the PCR constraint results in fewer mode switches, which ensures a more stable communication environment but comes with slightly lower throughput. This comparison makes it clear that choosing the appropriate constraint depends on achieving a balance between performance and stability. Ultimately, selecting the AR constraint is preferable in scenarios where maximizing throughput is crucial.
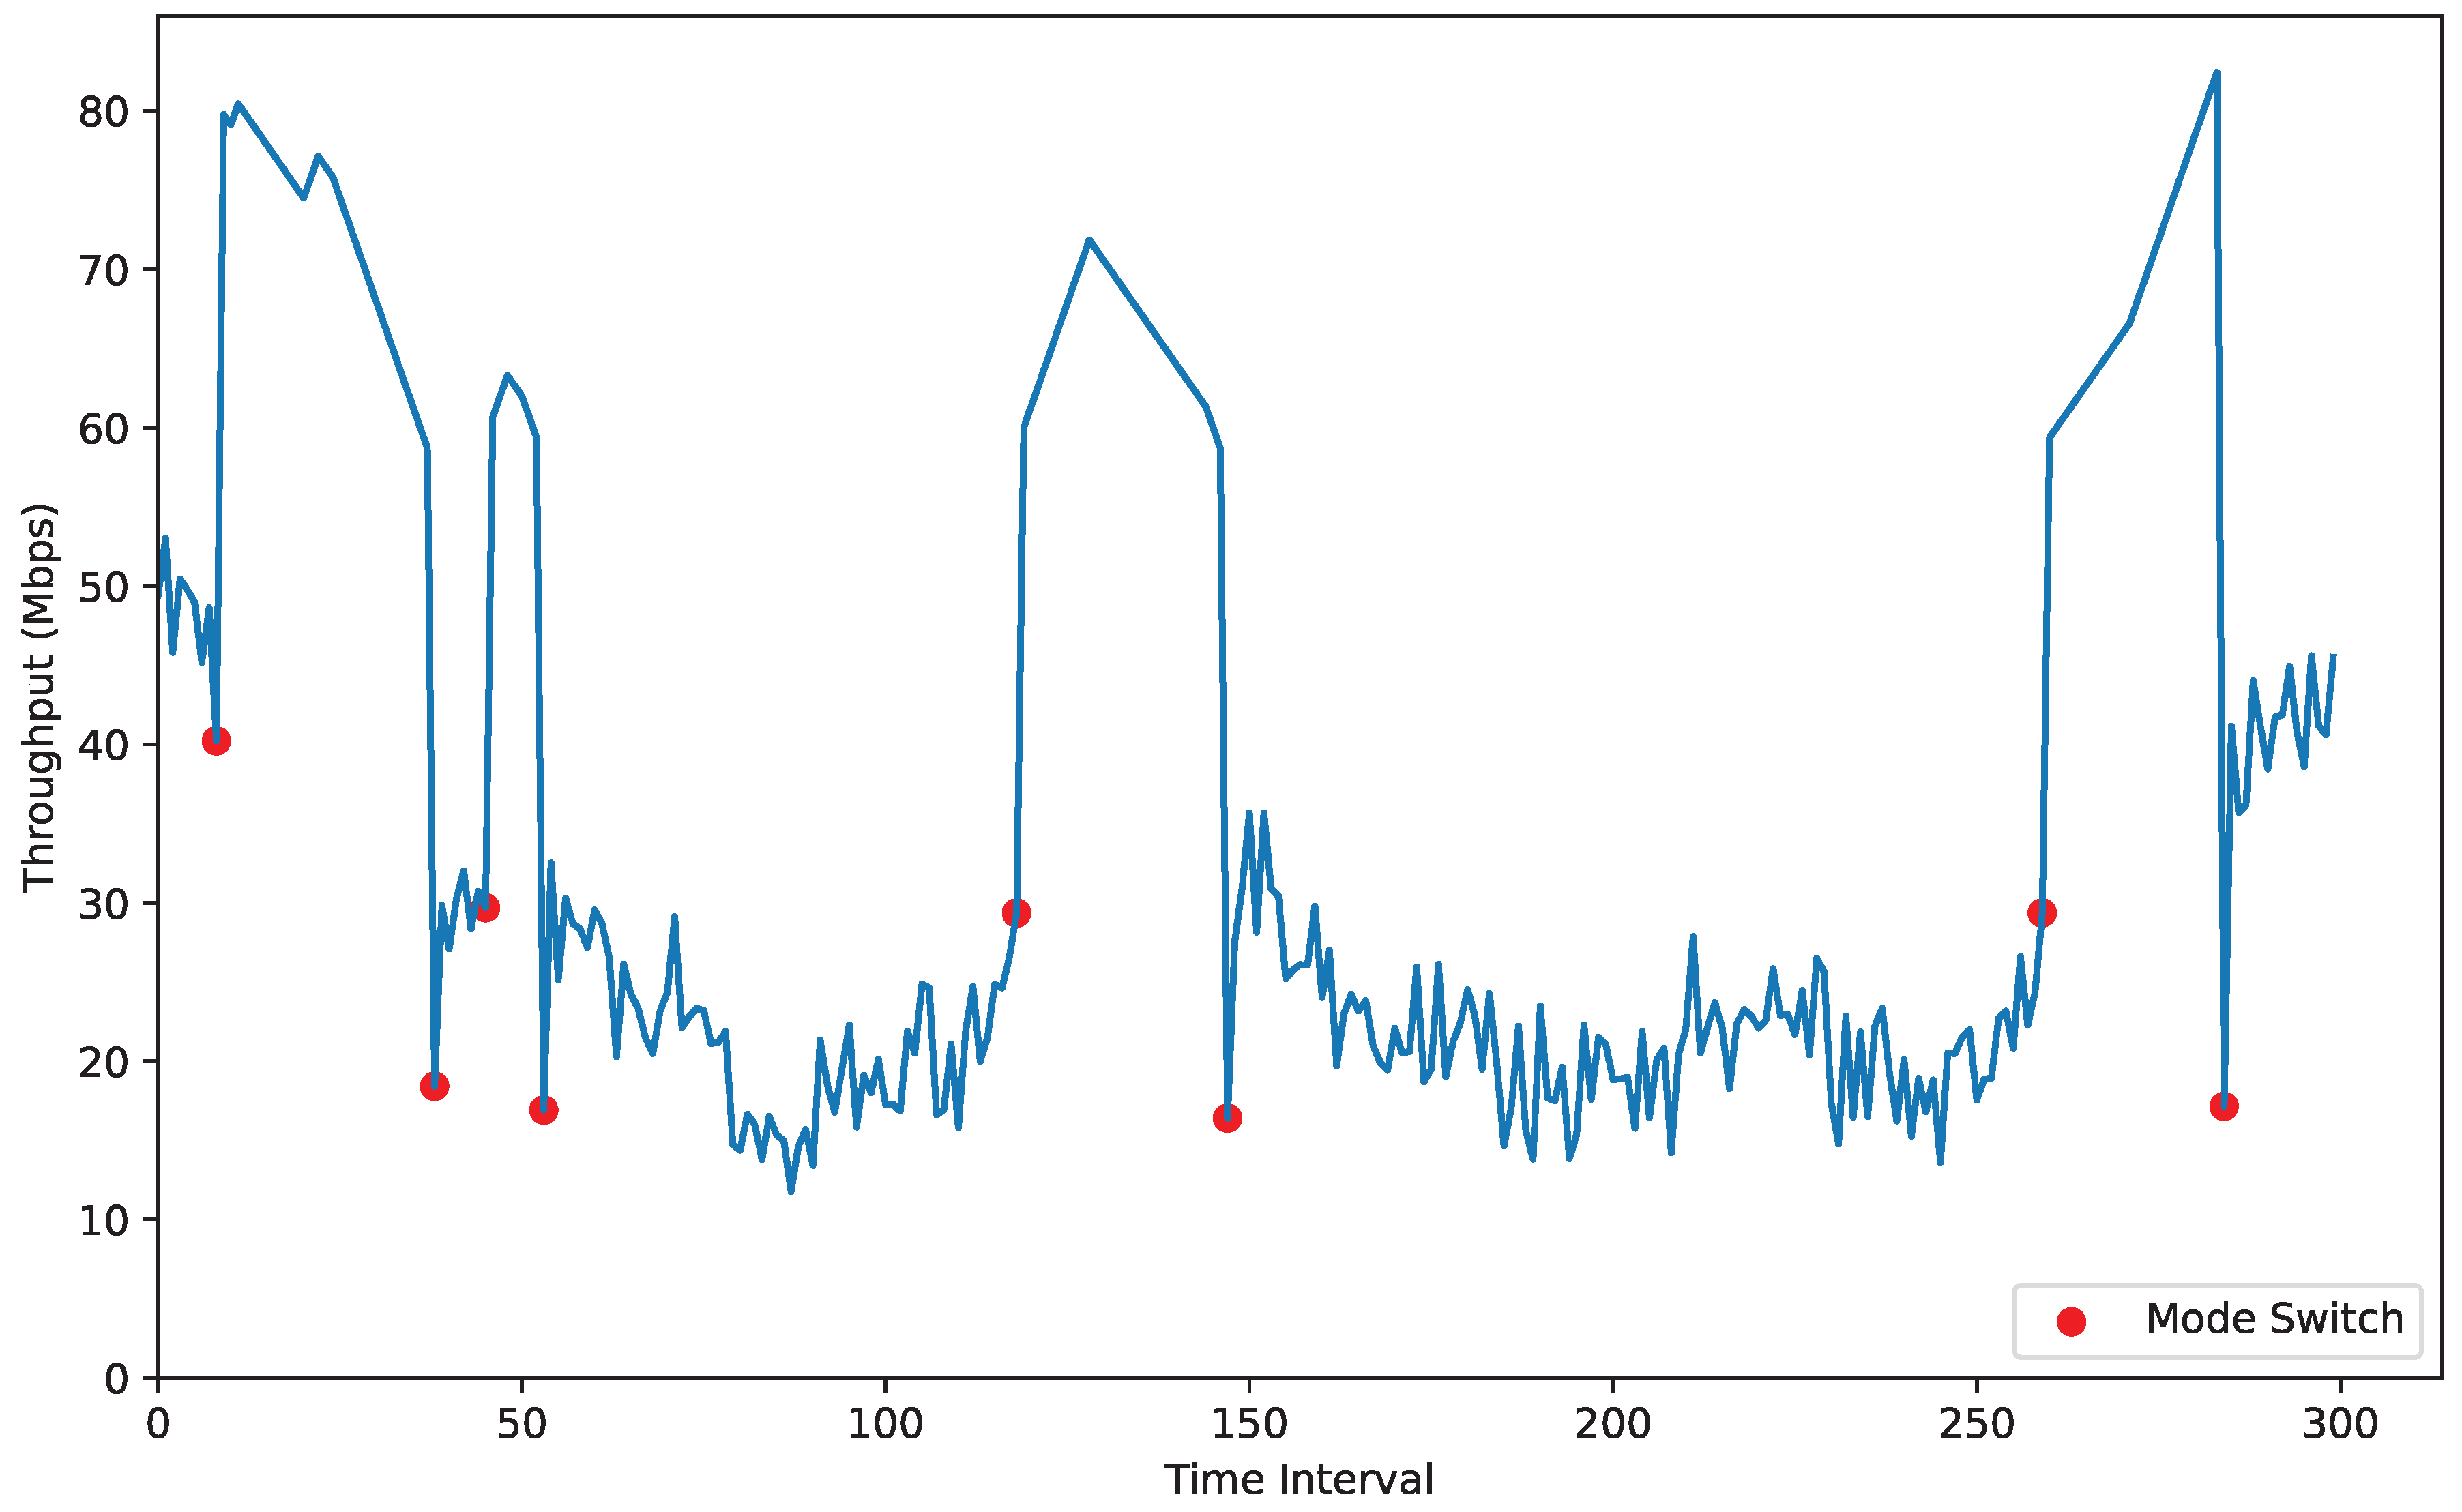
Figure 6 describes the throughput changes of the D2D communication link under different time points based on prediction and mode selection algorithms. The red dots in the figure indicate mode switching. Initially, the two main devices move in random directions within specified boundaries. According to the results in
Figure 5, the AR constraint is selected with a switching probability of 0.7 to achieve higher throughput. Results from
Figure 6 show that in cellular mode, the devices experience significant effects from surrounding interference, which causes throughput to fluctuate as the number of interfering devices increases, for example, between the fourth and fifth switches. In dense interference areas, cellular mode throughput decreases significantly due to interference from proximity devices reducing SINR, affecting data transmission rates. In contrast, D2D mode throughput is more influenced by the distance between devices. As device distance increases, signal attenuation becomes more apparent. When the distance exceeds 400 m, D2D communication is prohibited to prevent communication failure due to poor signal quality. As the devices move closer, the throughput rapidly increases, for example, between the fifth and sixth switches. In the figure, the interval between the third and fourth switches is short because the devices move in opposite directions, and the distance between them gradually increases after they switch to D2D mode, which leads to the fourth switch. During the fifth switch, although the throughput in cellular mode shows a gradual increase, a switch still occurs because the communication conditions in D2D mode are better than those in cellular mode. Frequent mode switching leads to information resending, which increases system signaling overhead and impacts current throughput. The threshold selection module selects reasonable thresholds that minimize unnecessary switches, maintain high throughput, and ensure system stability.
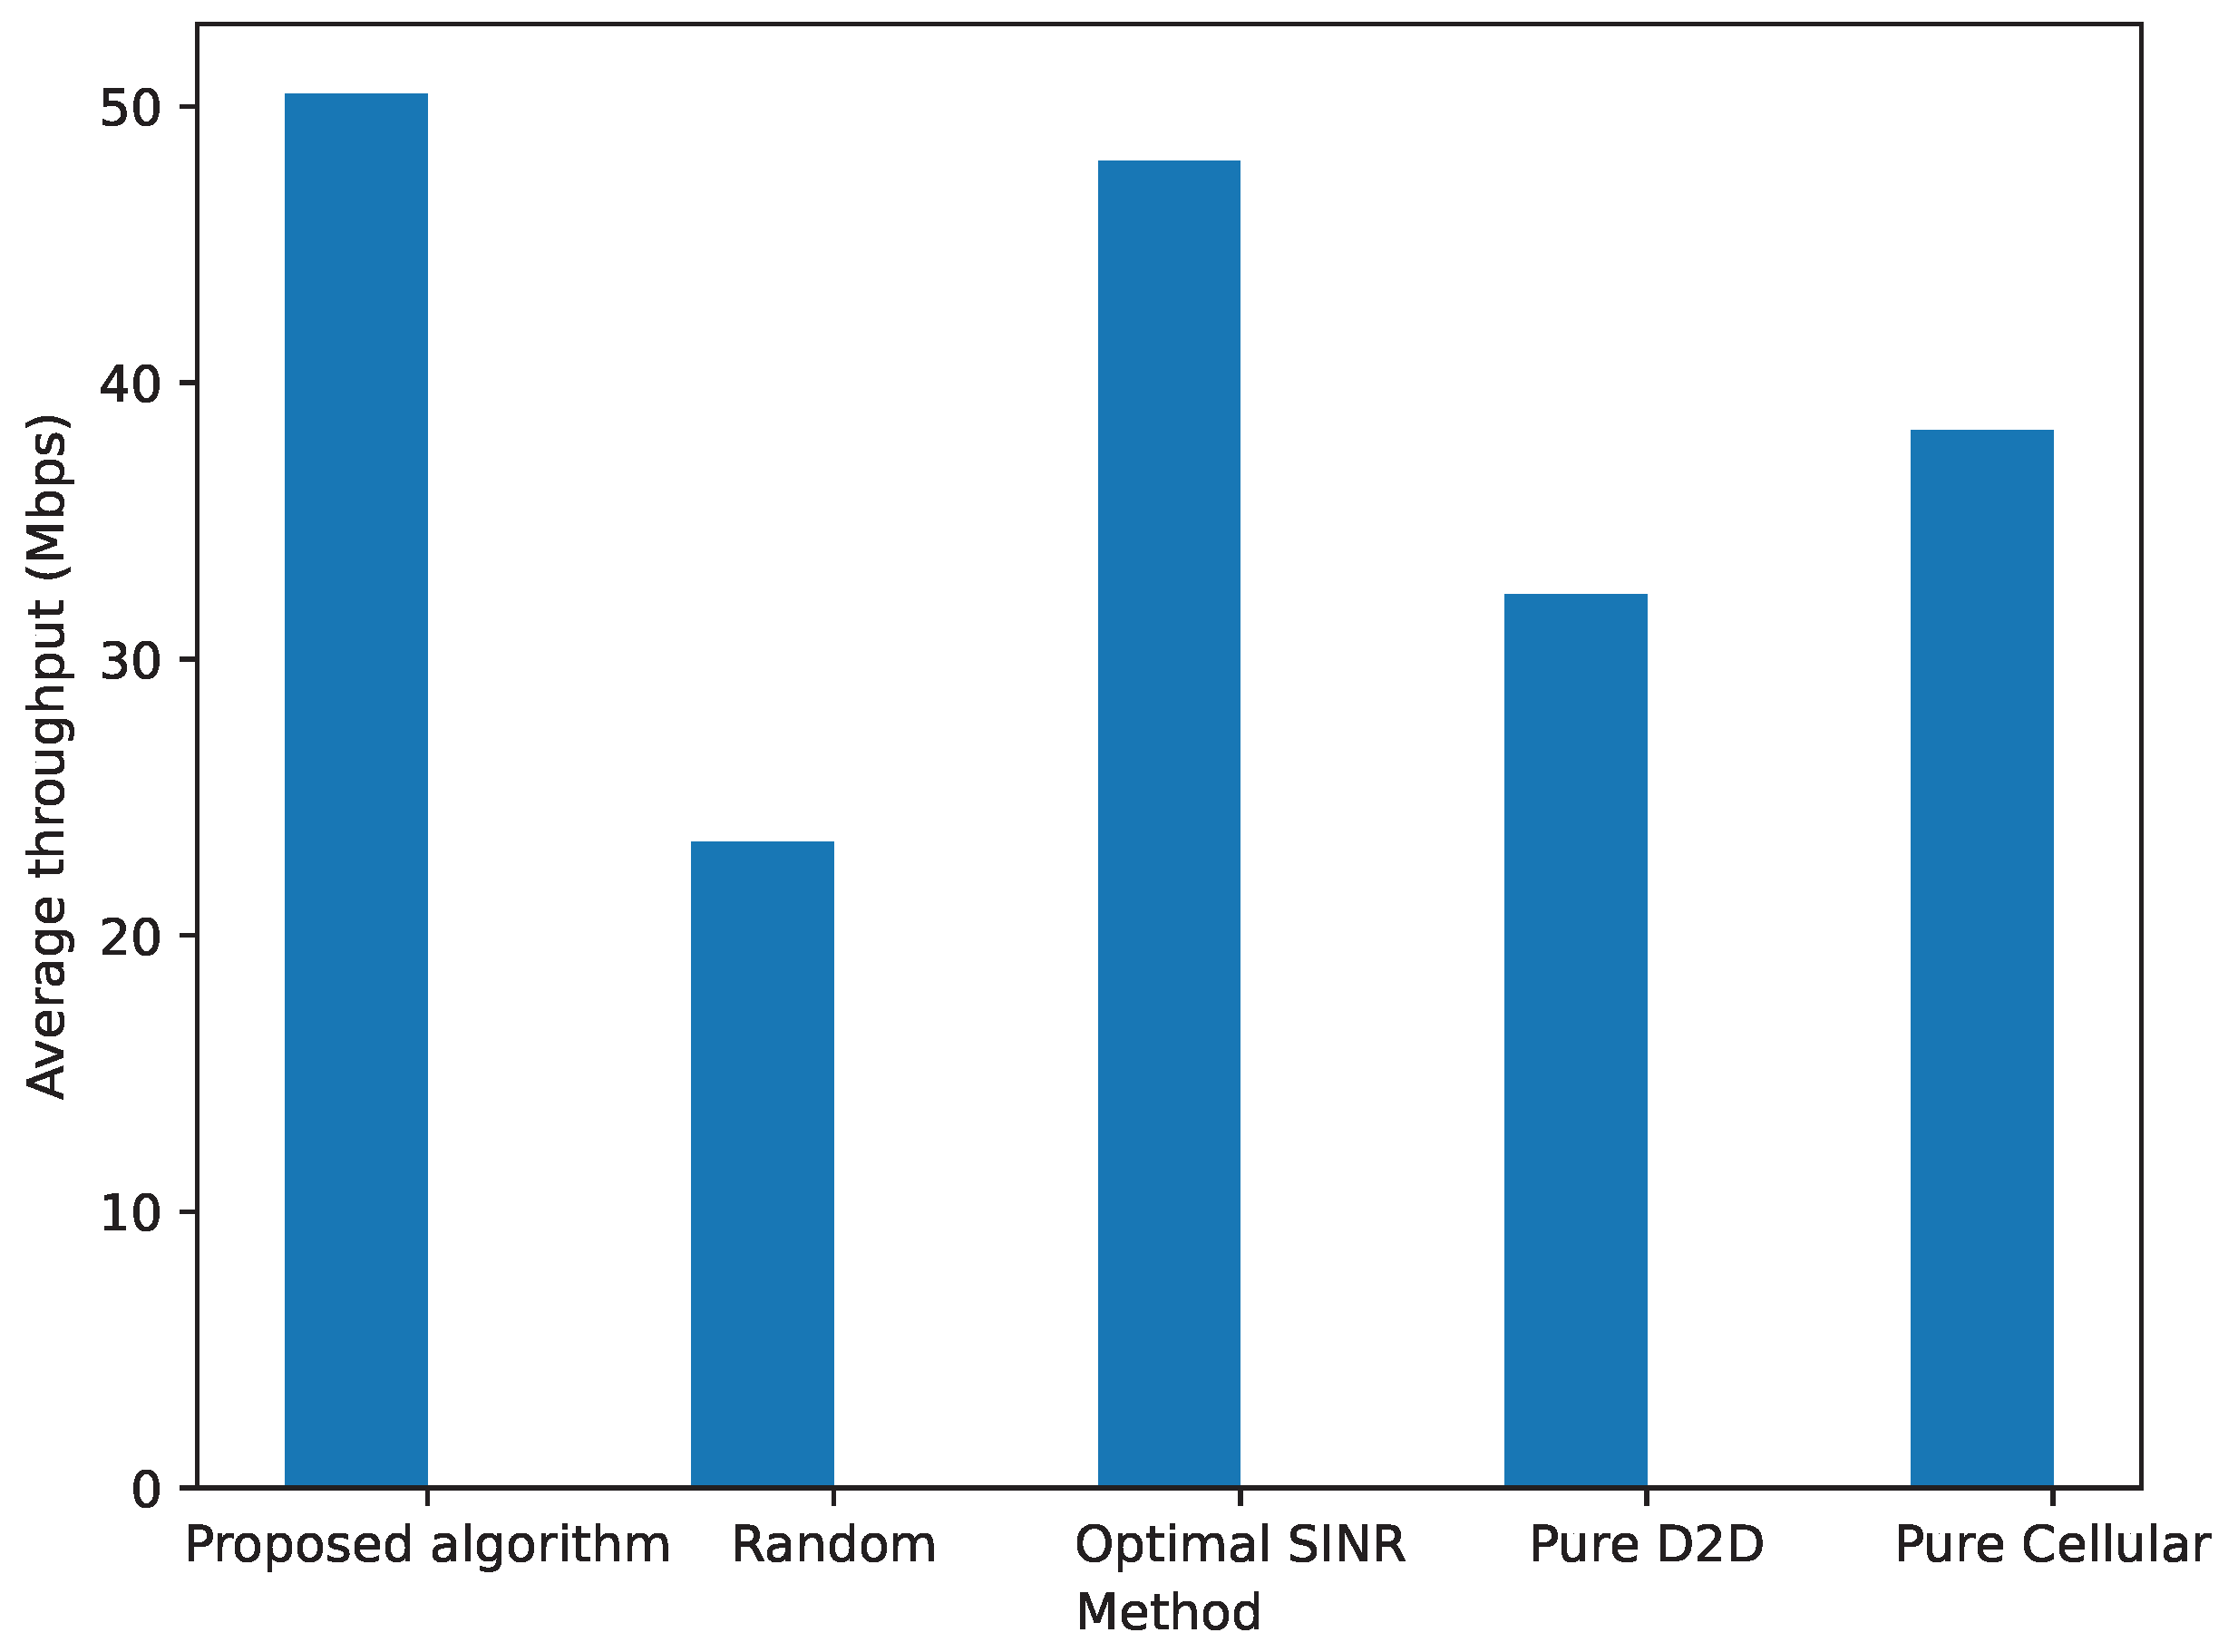
Figure 7 compares average throughput under different methods, which include the proposed algorithm, random [
19], optimal SINR [
20], pure D2D mode, and pure cellular mode. The proposed method achieves an average throughput of approximately 50 Mbps, which surpass the performance of the optimal SINR-based method (48 Mbps), the pure D2D method (32 Mbps), the pure cellular method (38 Mbps), and the random mode selection method (23 Mbps).
Figure 7 shows that the proposed method outperforms other methods in average throughput. Although the optimal SINR-based method performs well in high-SINR conditions, its performance is limited by frequent channel changes and interference in complex network environments. Both pure D2D and pure cellular methods can achieve high throughput in specific scenarios; however, their lack of flexible selection mechanisms leads to inconsistent performance in dynamic environments. Similarly, the random mode selection method yields the lowest throughput and is inefficient in resource utilization among all methods due to its lack of a systematic strategy for mode selection. In contrast, the proposed method demonstrates superior adaptability by addressing dynamic channel conditions through SINR prediction and optimized threshold selection. This capability enables it to maintain higher throughput in dynamic network scenarios, and highlights its robustness and efficiency compared to traditional methods.
As shown in
Table 3, the comparison of mode switching rates [
21] and average D2D mode residence times [
21] under different methods includes the proposed algorithm, random and optimal SINR. The table’s first item represents the average D2D mode residence time, and the second item represents the mode switching rate. The D2D mode switching rate indicates how often the UE switches its communication mode, which directly impacts the system’s signaling overhead. The ’Average D2D Residence Time’ represents the average duration of staying in D2D mode, which also reflects the frequency of mode switching. Simulation results show that in a good D2D communication environment, devices should stay longer in D2D mode to fully utilize its advantages. The proposed algorithm results in longer D2D mode residence times compared to the optimal SINR algorithm. Additionally, the proposed algorithm has a lower mode switching rate, which reduces signaling overhead and throughput loss caused by frequent switching. The results demonstrate that the proposed method achieves higher throughput and lower mode switching rates, while maintaining high system stability.
Simulation verification shows that the proposed D2D mode selection method performs excellently in multiple key performance indicators. The method achieves higher system throughput, maintains high prediction accuracy, and demonstrates lower mode switching frequency compared to other methods. Longer D2D mode residence times and lower mode switching rates further enhance system stability. While this method might not be the most suitable choice for scenarios with strict resource limitations, it is particularly well-suited for high-priority applications, such as vehicular networks or industrial IoT systems, where throughput optimization and reduced mode switching are critical. In these cases, the computational trade-offs are considered reasonable due to the significant improvement in network performance that is taken into account. The methods compared in this study were adapted to match the scenario addressed in the proposed framework, as differences in application contexts made direct comparisons with existing methods infeasible. Unlike traditional approaches that rely on static SINR thresholds, the proposed method provides enhanced adaptability and robustness in dynamic environments.
