Abstract
The most important application of anticancer drugs in various forms (alkylating agents, hormones agents, and antimetabolites) is the treatment of malignant diseases. Topological indices are widely used in the field of chemical and medical sciences, especially in studying the chemical, biological, clinical, and therapeutic aspects of drugs. In this article, the temperature indices in anticancer drugs molecular graphs such as Carmustine, Convolutamine F, Raloxifene, Tambjamine K, and Pterocellin B were calculated and then analyzed based on physical and chemical properties. The analysis was performed by identifying the best regression models based on temperature indices for six physical and chemical features of anticancer drugs. The results indicated that temperature indices were essential topological indices that predict the properties of anticancer drugs, such as boiling point, flash point, enthalpy, molar refractivity, molar volume, and polarizability. It was also observed that the r value of the regression model was more than 0.6, and the p value was less than 0.05.
MSC:
05C92
1. Introduction
The rapid growth of abnormal cells in the human body causes cancer. The drugs used to treat cancer usually include alkylates and metabolites. Making and researching primary drugs for cancer treatment are of interest to doctors, but the drug discovery process, from identifying novel chemical entities to establishing regulatory approval is complex, costly, and time consuming. Traditional methods often suffer from inefficiencies in compound synthesis and biological screening, which prompts the scientific community to seek faster and more efficient ways to discover lead compounds.
Graph theory of chemistry is an interdisciplinary science that is used to study molecular structures and create correlations between different activities, properties, and events.
The molecular graph is related to the structural formula of a chemical compound, and the vertices and edges of the graph correspond to the atoms and chemical bonds of the compound, respectively. Chemical graph theory has provided creative and unique tools for the study of chemical structures, among which topological indices can be mentioned.
The topological index is used as the descriptor to study the structure and some properties of a molecular graph and is expressed as a real number [1,2,3]. The scarcity and expensiveness of anticancer drugs and the production of more effective drugs lead to studies on drug structures, especially using topological indices.
Many studies were conducted on molecular graphs, especially nanotubes, and pharmaceutical structures, using topological indices [4,5,6,7,8,9,10]. Lokesha et al. studied the temperature indices of certain Archimedian Lattices [11]. Adnan et al. investigated the degree-based indices on some anticancer drugs and found a high correlation between the indices and the physical–chemical properties of the drugs [12]. Hayat et al. used temperature indices to predict the physicochemical properties of polycyclic aromatic hydrocarbons and benzenoid hydrocarbons as well as investigate the π-electron energy of benzenoid hydrocarbons [13,14,15].
One of the most important methods of studying the relationship between the physical–chemical properties and topological indices of a material is the application of QSPR (quantitative structure–property relationship analysis) models. In the QSPR model, the curve regression method is used as a tool to analyze the relationship between physical and chemical properties and topological indices. Various QSAR studies using topological indices have been performed on multiple drug structures [16,17].
In this article, different temperature indices are investigated on some anticancer drugs to be used for researchers to understand the physical characteristics and chemical reactions related to them.
2. Preliminaries
In the molecular graph G, the degree of arbitrary vertex s is denoted by ds, and the connection of two vertices z and w is expressed by
Definition 1.
The temperature of a vertex is defined as follows [18]:
where n is the number of graph vertices.
Using vertex temperature, temperature indices were introduced (see Table 1) [19].

Table 1.
Temperature-based topological indices of G.
Recently, studies have been conducted on temperature indices [21,22].
3. Results
In this section, after introducing the molecular graphs of Carmustine, Convolutamine F, Raloxifene, Tambjamine K, Pterocellin B and obtaining the temperature of the vertices, the temperature indices are calculated.
Figure 1 shows the molecular graph of Carmustine.
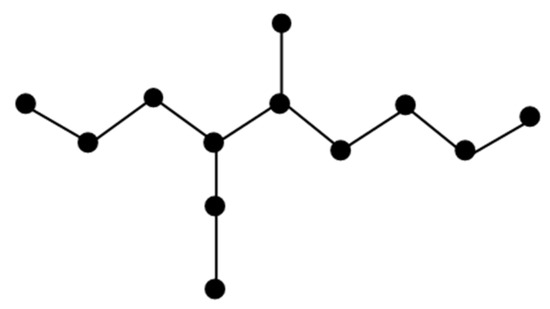
Figure 1.
Molecular graph of Carmustine.
The molecular graph of Carmustine is represented by C. There are five types of edges in C as follows:
The study of the edges in C is shown in Table 2.
Table 2.
Edge partition of C.
- index;
- index;
- index;
- index;
- index.
Theorem 1.
Assume that C is the molecular graph of Carmustine. Then, the temperature indices of C are computed as follows:
Proof of Theorem 1.
The molecular graph of Raloxifene (Figure 2) is represented by R. There are four types of edges in R as follows:
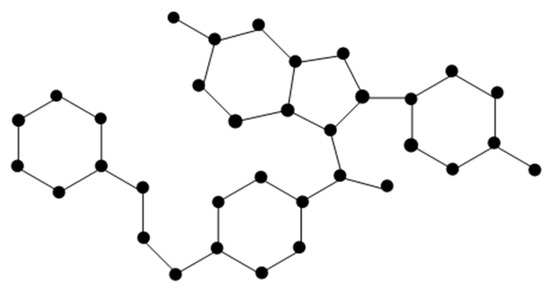
Figure 2.
Molecular of Raloxifene.
The study of the edges in R is shown in Table 3.
Table 3.
Edge partition of R.
Theorem 2.
Assume that R is the molecular graph of Raloxifene. Then, the temperature indices of R are computed as follows:
Proof of Theorem 2.
The molecular graph of Tambjamine K (Figure 3) is represented by T. There are five types of edges in T as follows:
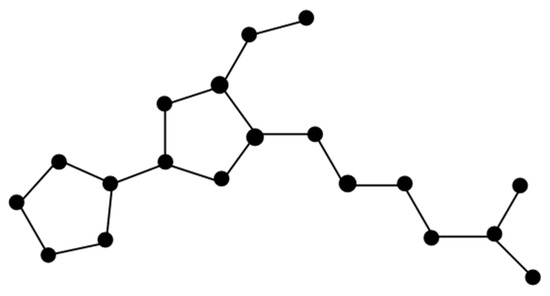
Figure 3.
Molecular of Tambjamine K.
The study of the edges in T is shown in Table 4.
Table 4.
Edge partition of T.
Theorem 3.
Assume that T is the molecular graph of Tambjamine K. Then, the temperature indices of T are computed as follows:
Proof of Theorem 3.
The molecular graph of Pterocellin B (Figure 4) is represented by P. There are five types of edges in P as follows:
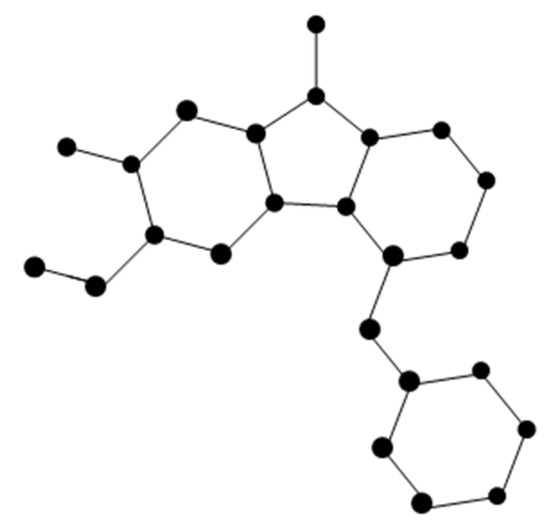
Figure 4.
Molecular of Pterocellin B.
The study of the edges in P is shown in Table 5.
Table 5.
Edge partition of P.
Theorem 4.
Assume that P is the molecular graph of Pterocellin B. Then, the temperature indices of P are computed as follows:
Proof of Theorem 4.
The molecular graph of Convolutamine F (Figure 5) is represented by F. There are five types of edges in F as follows:
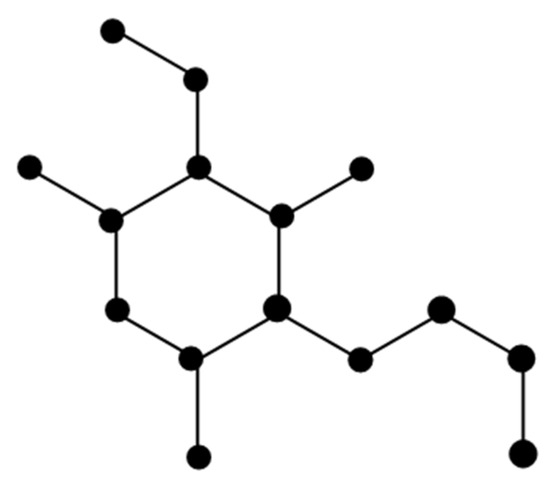
Figure 5.
Molecular of Convolutamine F.
The study of the edges in F is shown in Table 6.
Table 6.
Edge partition of F.
Theorem 5.
Assume that F is the molecular graph of Convolutamine F. Then, the temperature indices of F are computed as follows:
4. Temperature Indices and QSPR
Here, we have four topological indices based on temperature indices such as PT (G), ST (G), SDT (G), and TSO (G) to model five representative physical properties (BP, EN, FP, MR, MV, and PO) with five anticancer drugs: Carmustine, Convolutamine F, Raloxifene, Tambjamine K, and Pterocellin B. The values of these properties are taken from ChemSpider (Table 7). Topological indices based on the above degree and experimental values for the physical and chemical properties of five anticancer drugs are shown in Table 8, respectively. From the data in Table 9, it is clear that all data values are normally distributed. Therefore, a regression model is used for data acceptance and analysis.
Table 7.
Physical properties of drugs used for anticancer drugs.
Table 8.
Temperature indices of drugs used for anticancer drugs.
Table 9.
Correlation coefficients of physical properties of drugs.
The results of Theorems 1–5 are shown in Table 8.
Regression Models
In this section, the analysis is conducted using the temperature indices calculated in Section 3.
The linear regression model is considered as follows:
where P is the anticancer drug property, A is a constant, B is the regression coefficient, and TI represents the topological index. This capability was calculated using SPSS software for six specific characteristics and four topological indices of five anticancer drugs.
P = A + B (TI),
Using equation (1), the different linear models for temperature indices are as follows.
Product connectivity temperature index [PT (G)]
BP = 288.656 + 0.852[PT (G)]
EN = 54.315 + 0.104[PT (G)]
FP = 128.361 + 0.515[PT (G)]
MR = 48.899 + 0.168[PT (G)]
MV = 156.065 + 0.397[PT (G)]
PO = 19.405 + 0.066[PT (G)]
Sum connectivity temperature index [ST (G)]
BP = 240.117 + 4.948[ST (G)]
EN = 48.764 + 0.597[ST (G)]
FP = 99.006 + 2.992[ST (G)]
MR = 39.399 + 0.974[ST (G)]
MV = 134.146 + 2.284[ST (G)]
PO = 15.641 + 0.386[ST (G)]
Symmetric division temperature index [SDT (G)]
BP = 166.496 + 6.624[SDT (G)]
EN = 40.170 + 0.793[SDT (G)]
FP = 54.473 + 4.007[SDT (G)]
MR = 22.859 + 1.349[SDT (G)]
MV = 91.371 + 3.256[SDT (G)]
PO = 9.097 + 0.534[SDT (G)]
Temperature Somber index [TSO (G)]
No topological index displays a satisfactory correlation with TSO (G).
The boiling point (BP) is the temperature at which the addition of heat leads to the conversion of a liquid into its vapor without increasing the temperature. The enthalpy (EN) of a system is equal to the internal energy of the system plus the product of pressure and volume. The flash point (FP) is the lowest temperature at which sufficient flammable vapor is present to support ignition when an ignition source is applied. Molar refractivity (MR) is a measure of the total polarizability of one mole of a substance. The molar volume (MV) of a substance is the ratio of the volume of a substance to the amount of the substance at a given temperature and pressure. Polarizability (PO) usually refers to the tendency of a material in an electric field to acquire a proportional electric dipole moment. The physical properties of drugs used for anticancer drugs are shown in Table 7.
5. Conclusions
Table 9 and the graphs in Figure 6 indicate the correlated values of the physicochemical properties of anticancer drugs with the defined temperature indices. It can be seen that the index ST (G) = 0.984 shows a higher positive and significant correlation with boiling point (BP), and also ST (G) = 0.984 shows a more positive correlation with flash point (FP) than the others. In the case of enthalpy, PT (G) shows the highest correlation value, i.e., 0.983. The SDT (G) index with molar refractivity (MR), molar volume (MV) and polarizability (PO) provides the highest positive correlation with values of 0.974, 0.974 and 0.975 for the physical and chemical properties, respectively.
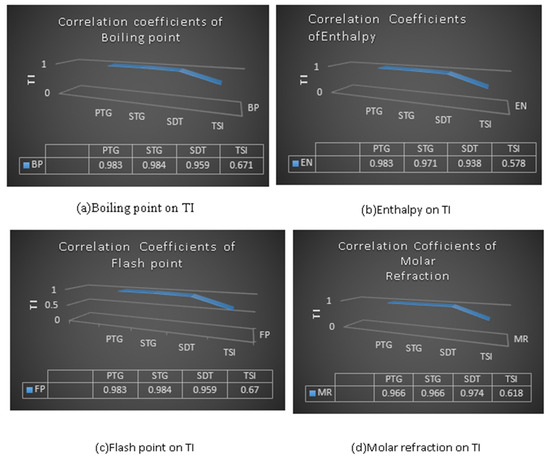
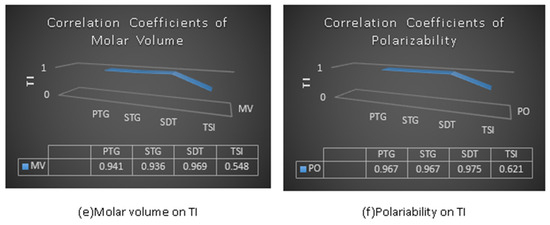
Figure 6.
Physicochemical properties with topological indices.
A positive correlation is observed between the physical and chemical properties of anticancer drugs and temperature indices. Table 10, Table 11 and Table 12 show the regression model of various physicochemical properties. The results show that the regression model value r is more than 0.6, and the p value is less than 0.05. The most reliable predictors for linear regression equations are the min criterion (SE), max (R2) and max (F). Hence, it can be concluded that all the physicochemical properties are highly significant. This topic shows the potential importance of these topological indicators in the QSPR analysis of anticancer drugs, and the drawn regression line is visible. The results of this study can be used in the production, development, and improvement of more effective anticancer drugs. The method of this article can be used to investigate other pharmaceutical structures as well.
Table 10.
Statistical parameters for the linear QSPR model for PT (G).
Table 11.
Statistical parameters for the linear QSPR model for ST (G).
Table 12.
Statistical parameters for the linear QSPR model for SDT (G).
Author Contributions
X.S., R.C., J.R.T. and A.A.T.; methodology, R.C., J.R.T. and A.A.T.; formal analysis, A.A.T., R.C., J.R.T. and X.S.; writing—original draft preparation, J.R.T., X.S. and A.A.T.; writing—review and editing, X.S. and A.A.T.; funding acquisition. All authors have read and agreed to the published version of the manuscript.
Funding
This work was supported by the National Key R & D Program of China (Grant 2019YFA0706402) and the National Natural Science Foundation of China under Grant 62172302, 62072129 and 61876047.
Data Availability Statement
Data are contained within the article.
Acknowledgments
The authors are very grateful to the editor and the anonymous referee(s) for their comments and suggestions which led to the present improved version of the manuscript.
Conflicts of Interest
The authors declare no conflicts of interest.
References
- Ghorbani, M.; Hosseinzadeh, M.A. A new version of Zagreb indices. Filomat 2012, 26, 93–100. [Google Scholar] [CrossRef]
- Hayat, S.; Suhaili, N.; Jamil, H. Statistical significance of valency-based topological descriptors for correlating thermodynamic properties of benzenoid hydrocarbons with applications. Comput. Theor. Chem. 2023, 1227, 114259. [Google Scholar] [CrossRef]
- Kulli, V.R.; Pal, M.; Samanta, S.; Pal, A. Handbook of Research of Advanced Applications of Graph Theory in Modern Society; IGI Global: Hershey, PA, USA, 2020. [Google Scholar]
- Ghods, M.; Ramezani Tousi, J. Computing Revan Polynomials and Revan Indices of Copper (I) Oxide and Copper (II) Oxide. Commun. Comb. Cryptogr. Comput. Sci. 2021, 1, 50–58. [Google Scholar]
- Kosari, S. On spectral radius and Zagreb Estrada index of graphs. Asian-Eur. J. Math. 2023, 16, 2350176. [Google Scholar] [CrossRef]
- Kosari, S.; Dehgardi, N.; Khan, A. Lower bound on the KG-Sombor index. Commun. Comb. Optim. 2023, 8, 751–757. [Google Scholar]
- Ramezani Tousi, J.; Ghods, M. Computing K Banhatti and K Hyper Banhatti Indices of Titania Nanotubes TiO2[m, n]. J. Inf. Optim. Sci. (JIOS) 2023, 44, 207–216. [Google Scholar]
- Ramezani Tousi, J.; Ghods, M. Investigating Banhatti indices on the molecular graph and the line graph of Glass with M-polynomial approach. Proyecciones J. Math. 2024, 43, 199–219. [Google Scholar]
- Ramezani Tousi, J.; Ghods, M. Some polynomials and degree-based topological indices of molecular graph and line graph of Titanium dioxide nanotubes. J. Inf. Optim. Sci. 2024, 45, 95–106. [Google Scholar]
- Shi, X.; Kosari, S.; Hameed, S.; Shah, A.G.; Ullah, S. Application of connectivity index of cubic fuzzy graphs for identification of danger zones of tsunami threat. PLoS ONE 2024, 19, e0297197. [Google Scholar] [CrossRef]
- Lokesha, V.; Yasmeen, K.Z.V.L. Temperature Index of Certain Archimedean Lattice. South East Asian J. Math. Math. Sci. 2021, 17, 213. [Google Scholar]
- Adnan, M.; Bokhary, S.A.U.H.; Abbas, G.; Iqbal, T. Degree-based topological indices and QSPR analysis of antituberculosis drugs. J. Chem. 2022, 2022, 5748626. [Google Scholar] [CrossRef]
- Hayat, S.; Alanazi, S.J.; Liu, J.B. Two novel temperature-based topological indices with strong potential to predict physicochemical properties of polycyclic aromatic hydrocarbons with applications to silicon carbide nanotubes. Phys. Scr. 2024, 99, 055027. [Google Scholar] [CrossRef]
- Hayat, S.; Khan, A.; Ali, K.; Liu, J.B. Structure-property modeling for thermodynamic properties of benzenoid hydrocarbons by temperature-based topological indices. Ain Shams Eng. J. 2024, 15, 102586. [Google Scholar] [CrossRef]
- Hayat, S.; Liu, J.B. Comparative analysis of temperature-based graphical indices for correlating the total π-electron energy of benzenoid hydrocarbons. Int. J. Mod. Phys. B 2024, 2550047. [Google Scholar] [CrossRef]
- Havare, Ö.Ç. Quantitative structure analysis of some molecules in drugs used in the treatment of COVID-19 with topological indices. Polycycl. Aromat. Compd. 2022, 42, 5249–5260. [Google Scholar] [CrossRef]
- Huang, L.; Wang, Y.; Pattabiraman, K.; Danesh, P.; Siddiqui, M.K.; Cancan, M. Topological indices and QSPR modeling of new antiviral drugs for cancer treatment. Polycycl. Aromat. Compd. 2023, 43, 8147–8170. [Google Scholar] [CrossRef]
- Fajtolowicz, S. On conjectures of Graffitti. Discrete Math. 1988, 72, 113–118. [Google Scholar] [CrossRef]
- Kulli, V.R. Computation of Some Temperature Indices of HC5C5[p, q] Nanotubes. Ann. Pure Appl. Math. 2019, 20, 69–74. [Google Scholar] [CrossRef]
- Kulli, V.R. Temperature Sombor and temperature Nirmala indices. Int. J. Math. Comput. Res. (IJMCR) 2022, 10, 2910–2915. [Google Scholar] [CrossRef]
- Kansal, N.; Garg, P.; Singh, O. Temperature-based topological indices and QSPR Analysis of COVID-19 Drugs. Polycycl. Aromat. Compd. 2023, 43, 4148–4169. [Google Scholar] [CrossRef]
- Zhang, Y.; Khalid, A.; Siddiqui, M.K.; Rehman, H.; Ishtiaq, M.; Cancan, M. On analysis of temperature based topological indices of some COVID-19 drugs. Polycycl. Aromat. Compd. 2023, 43, 3810–3826. [Google Scholar] [CrossRef]
Disclaimer/Publisher’s Note: The statements, opinions and data contained in all publications are solely those of the individual author(s) and contributor(s) and not of MDPI and/or the editor(s). MDPI and/or the editor(s) disclaim responsibility for any injury to people or property resulting from any ideas, methods, instructions or products referred to in the content. |
© 2024 by the authors. Licensee MDPI, Basel, Switzerland. This article is an open access article distributed under the terms and conditions of the Creative Commons Attribution (CC BY) license (https://creativecommons.org/licenses/by/4.0/).